Article

Diverging Responses of Two Subtropical Tree Species (Schima superba and Cunninghamia lanceolata) to Heat Waves

1
Forest Ecology & Stable Isotope Center, Forestry College, Fujian Agriculture and Forestry University, Fuzhou 350002, China
2
Research Group PLECO (Plants and Ecosystems), Department of Biology, Universiteit Antwerpen (Campus Drie Eiken), 2610 Wilrijk, Belgium
3
Fujian Academy of Forestry Science, Fuzhou 350000, China
4
National Hulunber Grassland Ecosystem Observation and Research Station & Institute of Agricultural Resources and Regional Planning, Chinese Academy of Agricultural Sciences, Beijing 100081, China
5
School of Life Science, Shanxi University, Taiyuan 030006, China
6
Center for Global Changes and Earth Observation/Department of Geography, Environment, and Spatial Sciences, Michigan State University, East Lansing, MI 48823, USA
*
Authors to whom correspondence should be addressed.
Forests 2020, 11(5), 513; https://doi.org/10.3390/f11050513
Submission received: 27 March 2020 / Revised: 23 April 2020 / Accepted: 26 April 2020 / Published: 2 May 2020
(This article belongs to the Section Forest Ecology and Management)

Abstract

:
The frequency and intensity of heat waves (HWs) has increased in subtropical regions in recent years. The mechanism underlying the HW response of subtropical trees remains unclear. In this study, we conducted an experiment with broad-leaved Schima superba (S. superba) and coniferous Cunninghamia lanceolata (C. lanceolata) seedlings to examine HW (5-day long) effects on stem water transport, leaf water use efficiency (WUE), morphology and growth, and to elucidate differences in the responses of both species. Our results indicated that HWs can significantly reduce hydraulic conductivity in both species. C. lanceolata experienced significant xylem embolism, with the percentage loss of conductivity (PLC) increasing by 40%, while S. superba showed a non-significant increase in PLC (+25%). Furthermore, HW also caused a reduction in photosynthesis rates (An), but transpiration rates (Tr) increased on the 5th day of the HW, together leading to a significant decrease in leaf WUE. From diurnal dynamics, we observed that the HW caused significant decrease of S. superba An only in the morning, but nearly the all day for C. lanceolata. During the morning, with a high vapor pressure deficit (VPD) environment, the HW increased Tr, which contributed a lot to latently cooling the foliage. In comparing the two tree species, we found that HW effects on S. superba were mostly short-term, with leaf senescence but limited or no xylem embolism. The surviving S. superba recovered rapidly, forming new branches and leaves, aided by their extensive root systems. For C. lanceolata, continued seedling growth initially but with subsequent xylem embolism and withering of shoots, led to stunted recovery and regrowth. In conclusion, apart from the direct thermal impacts caused by HW, drought stress was the main cause of significant negative effects on plant water transport and the photosynthetic system. Furthermore, S. superba and C. lanceolata showed clearly different responses to HW, which implies that the response mechanisms of broad-leaved and coniferous tree species to climate change can differ.

1. Introduction

Human activities continue to affect the environment, and increasingly frequent, intense and longer-lasting heat waves (HWs) are expected with ongoing climate warming [1,2]. A HW is commonly defined as a period with excessively hot days, usually combined with dry atmospheric and surface soil conditions [3,4,5]. Such extreme thermal climatic events can exert stronger selective pressures on organisms than gradual changes in temperature [6,7,8,9] and could negatively impact the function and survival of plants [10,11,12,13]. Moreover, the increase in HW frequency and intensity are particularly obvious in subtropical regions [10,14]. Theoretically, tree species native to subtropical areas should be better adapted to high temperatures than temperate and boreal trees [15], but studies have shown that warm-grown trees can be more susceptible to HW damage than cool-grown trees [16,17]. Moreover, there is evidence that subtropical HWs can cause a significant reduction in carbon sequestration [18]. Uncovering the mechanisms that determine the responses of subtropical tree species to HWs will help us explain and predict the consequences of HWs and provide deeper insights into changes in carbon and water fluxes [11] and the risks to forestry [19].
HWs not only directly lead to plant damage through thermal stress but also cause damage via associated indirect drought-related effects [3,20]. Drought stress can eventually lead to hydraulic damage and further reduce plant C uptake, finally resulting in plant death, while the accompanying extreme heat tends to amplify these processes and accelerate mortality [8,21,22]. Essentially, water transport and water use processes of the plant are critical in explaining responses to heat [23]. In contrast, if any of these processes fail, the mortality rates significantly increase, or plant growth and health are at least seriously impacted [24]. In arid forests, tree drought tolerance is closely related to xylem hydraulic conductivity [25,26,27], indicating a drought resistance strategy that depends on the active regulation of leaf stomatal closure [28]. However, in tropical or subtropical areas, tree species commonly exhibit high levels of transpiration to buffer leaf temperatures under high vapor pressure deficit (VPD) conditions [15], which illustrates a fundamental trade-off between avoiding overheating and reducing water consumption. During HW periods, stomatal conductance tends to increase until soil water levels drop below a threshold [29,30]. Low leaf water availability ultimately affects leaf health [31], while high temperatures can cause thermal damage to the photosynthetic system [17], leading to significantly decreased WUE under HWs. Some tree species, such as Pseudotsuga menziesii and Liriodendron tulipifera, exhibit WUE values that steadily decrease during HWs, while other species, such as Robinia pseudoacacia and Quercus falcata, maintain their photosynthesis rates during the early stage of an HW, and the rates decrease markedly later [22,32]. It has been suggested that these different responses of plant WUE to HWs reflect different species-specific levels of heat resistance and are closely related to the plant photosynthetic system and the hydraulic transport system, yet the underlying mechanisms still need to be fully elucidated.
The tree species chosen in this study are common subtropical tree species in China with high economic value and ecological benefits. Schima superba (S. superba) is a slow-growing and evergreen broadleaf tree species but is considered a valuable and important source of wood and bioactive medicinal compounds [33]. Cunninghamia lanceolata (C. lanceolata) is a fast-growing evergreen conifer with high yield and excellent timber quality [34]. In China, there are over 17 million ha of C. lanceolata plantations, which represent approximately 6.1% of the forest plantations in the world. These forests play an important role in the global carbon cycle [35,36]. However, C. lanceolata monocultures may face a number of problems, including productivity declines caused by successive rotation and subsequent depletion of soil nutrients [37], lack of understory vegetation [38] and low resistance to climate change [39]. Mixed S. superba and C. lanceolata forests could be used to successfully maintain long-term productivity, with additional benefits for stand structure, ecological functions, and natural regeneration [40,41]. Measuring their species-specific responses to HWs will help to determine an optimal ratio of these two species in mixed forests in the context of climate change [42]. Regional summer heat and seasonal drought can be detrimental for the growth of S. superba and C. lanceolata [43], with high mortality rates observed after seedling transplant [44]. Moreover, trees in subtropical regions usually grow in a hot and humid environment, which indicates a better tolerance to hot weather but less tolerance to drought stress, which are contradictory. Thus, research to increase our understanding of the adaptive mechanisms of S. superba and C. lanceolata to HWs is necessary and timely.
Finally, we designed and carried out pot experiments to characterize the adaptive mechanisms of a broad-leaved tree species (S. superba) and a coniferous tree species (C. lanceolata) in response to HWs in southern China. We imposed an experimental HW to measure the HW effect on both plant water transport and water use processes. We hypothesise that (1) HW will cause a variation in stem hydraulic characteristics, specifically the presence of xylem embolism; (2) HW will also affect the photosynthetic system, including a variation in photosynthesis (An), transpiration rates (Tr) and water use efficiency (WUE); (3) Such variations on the hydraulic and photosynthetic systems will further impact the plant leaf nutrient content, biomass and morphology; and (4) finally, broad-leaf and coniferous trees species with different responses to HW also indicates different tolerance strategies.

2. Materials and Methods

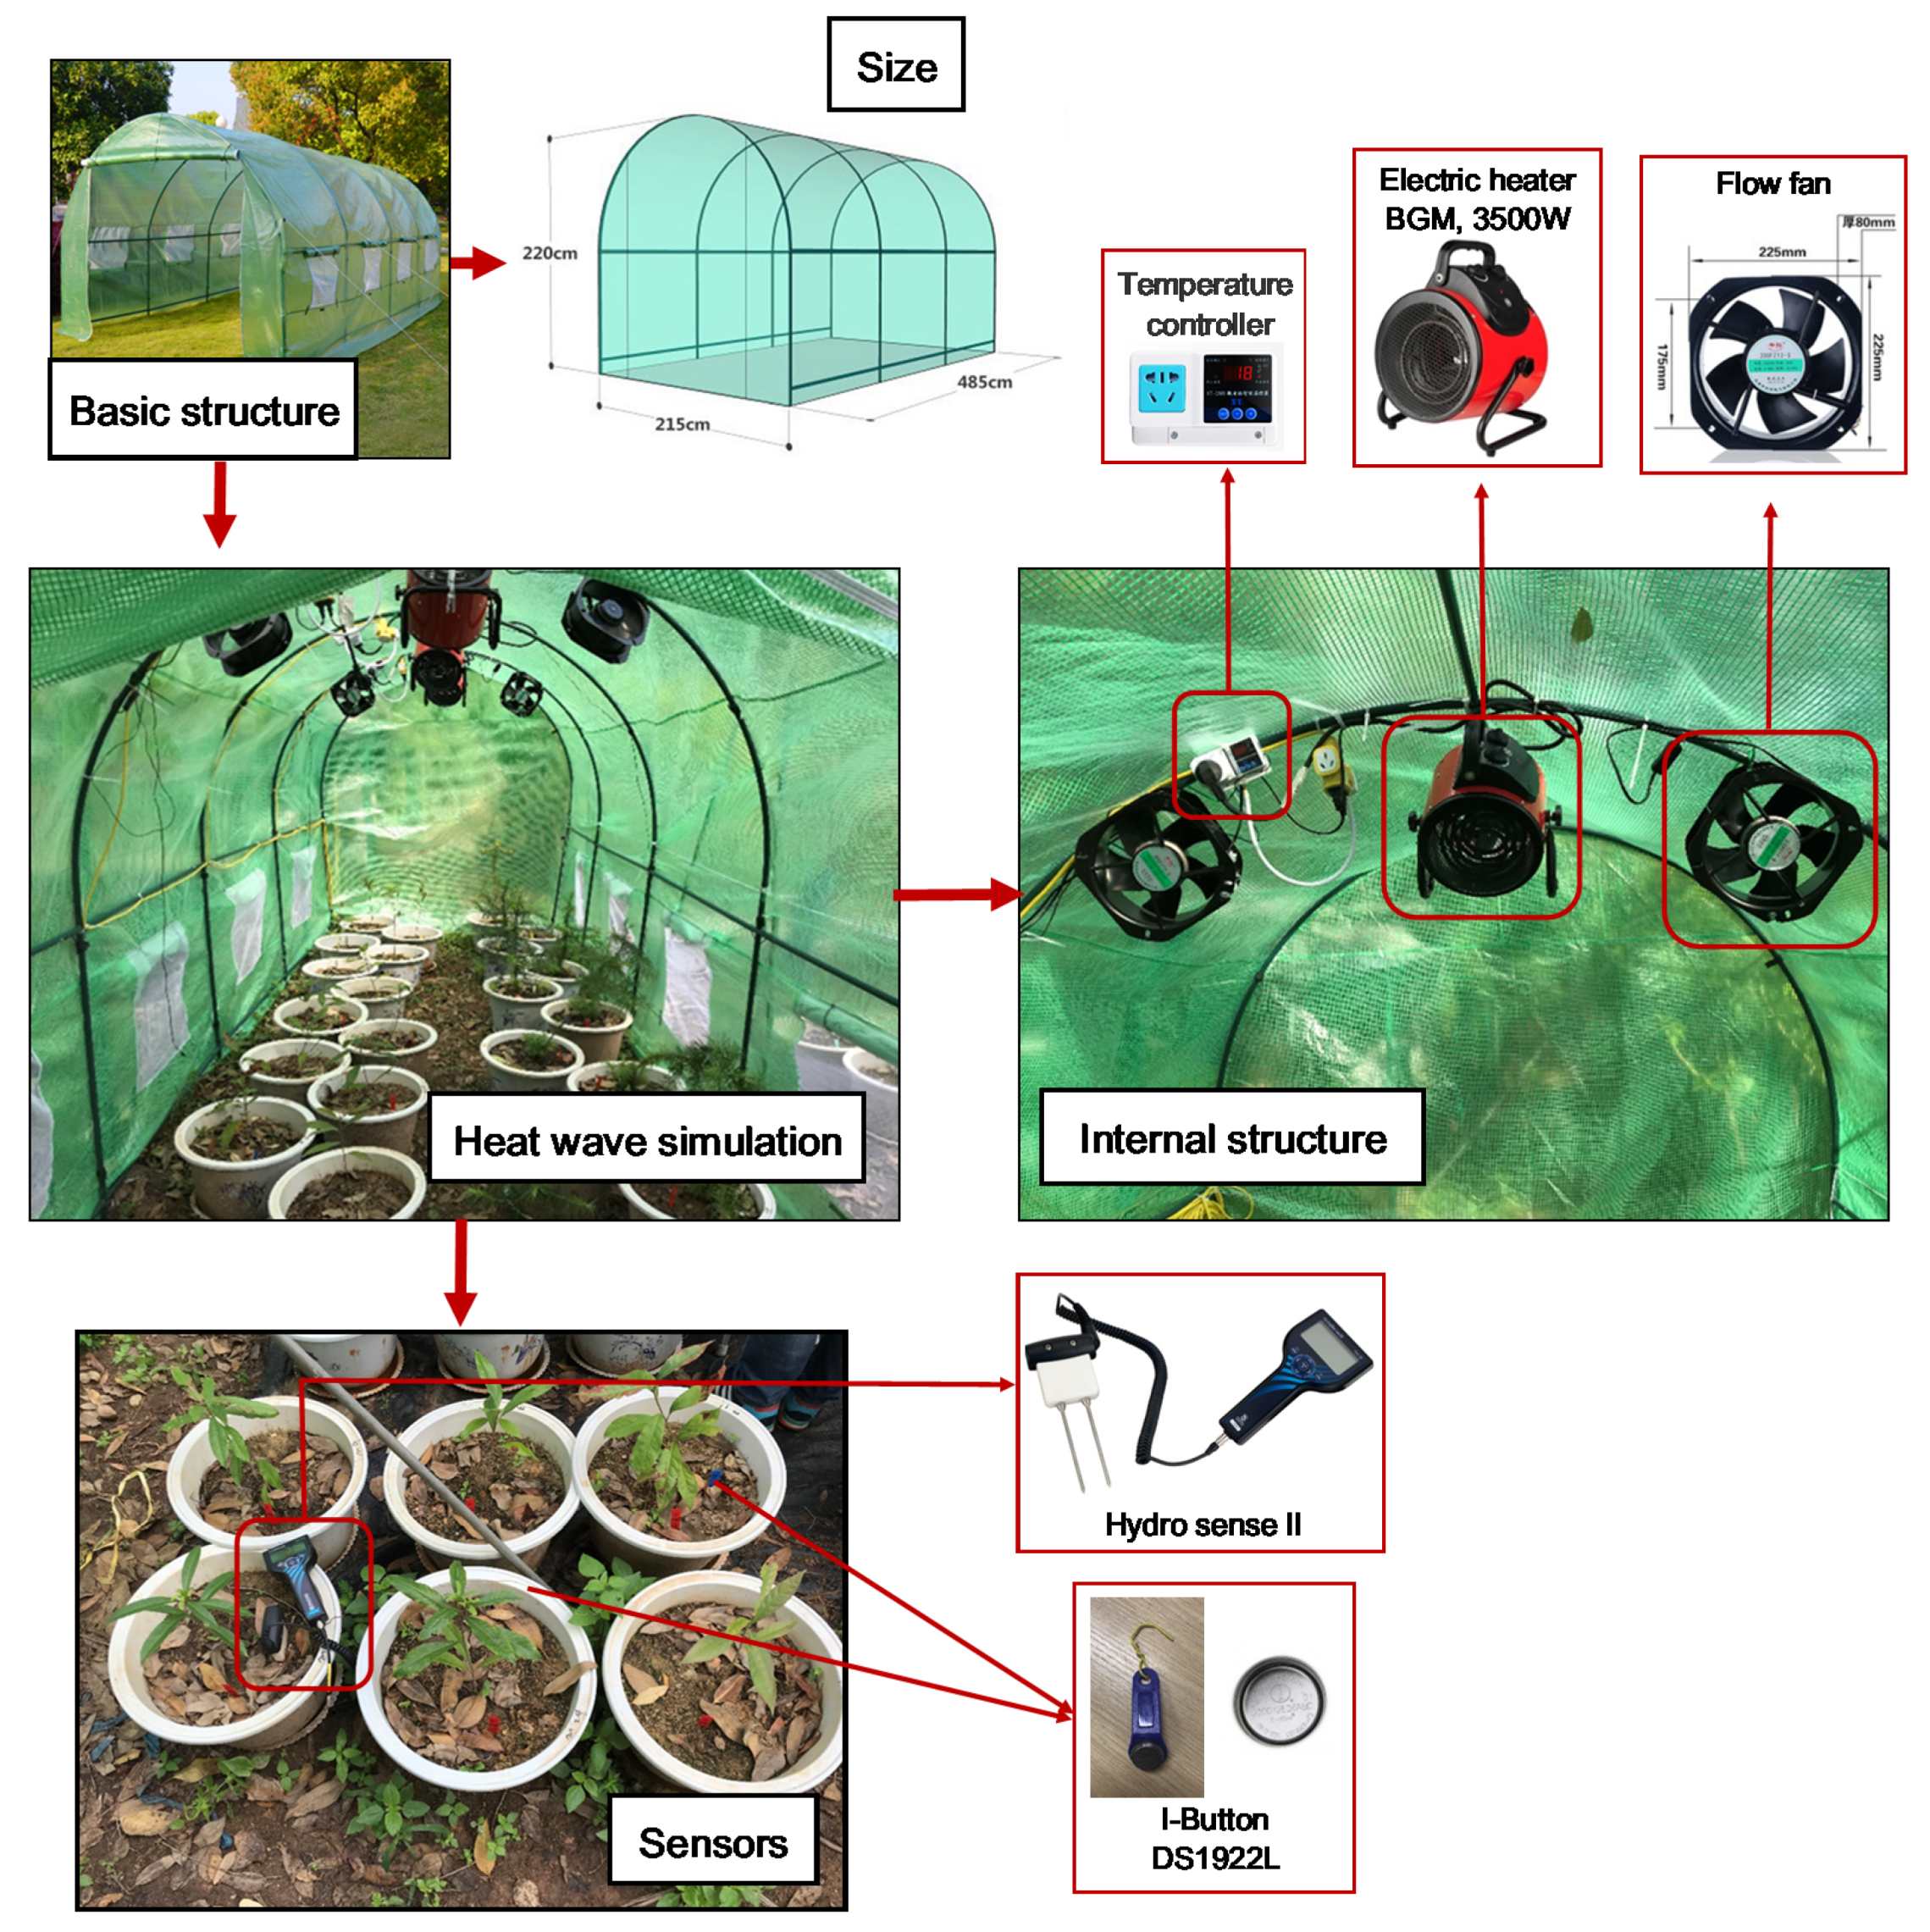
2.1. Experimental Platform

The experimental site was located within a seedling nursery at the Fujian Academy of Forestry Sciences, Fuzhou, Fujian, China (26°08′53′’ N, 119°17′03′’ E, 63 m a.s.l.), which has a subtropical maritime monsoon climate. Mean annual precipitation is 1600 mm, with 56% falling in the rainy season from March to June. The highest recorded maximum daily precipitation is 131.7 mm and mean annual potential evaporation is 1323 mm. Mean annual temperature is 18.9 °C and monthly mean temperature ranges from 8.9 °C in January to 27.8 °C in July.
Two major subtropical tree species were chosen: one broad-leaved tree species (Schima superba) and one coniferous tree species (Cunninghamia lanceolata). All seedlings were planted in the seedling nursery two years prior to the experiment, with healthy seedlings of comparable size carefully transplanted into pots half a year before the start of the experiment. Three-year-old seedlings are considered the key stage for local forestry work. The average height of C. lanceolata seedlings was 36.1 cm with an average diameter of 3.4 cm at ground level, while the average height and ground-level diameter of S. superba seedlings was 44.4 cm and 6.0 cm, respectively. Aside from their relatively fast growth rate, seedlings are usually transplanted from the nursery to the field at this age. The pots we used were circular, with a 44 cm diameter and a height of 30 cm, which fully simulated the planting distribution during plantation cultivate, and also ensured that the pot internal spaces provided ample space for seedling root growth to avoid limitations in terms of nutrients, water, or space. We used a red loam soil (total organic carbon = 47.3 g kg−1, total nitrogen = 3.2 g kg−1 and pH = 4.9) collected at Wuyi Mountain at 500 m a.s.l., with a dry soil weight of 20 kg per pot. The pots were buried horizontally in the soil at ground level to avoid excessive soil warming via the sides of the pots and to ensure a soil environment similar to field conditions. In total, 48 seedlings (for each species) were grown in separate pots, evenly divided into 2 treatments (control and HW) with 3 replicate plots, so that each plot contained 16 pots. Eight seedlings (4 for control and 4 for HW treatment) were harvested on the first day after the HW to measure the stem hydraulic conductivity. The other 8 seedlings were kept at ambient conditions until the last day of the experiment for measuring the biomass and leaf nutrition parameters.

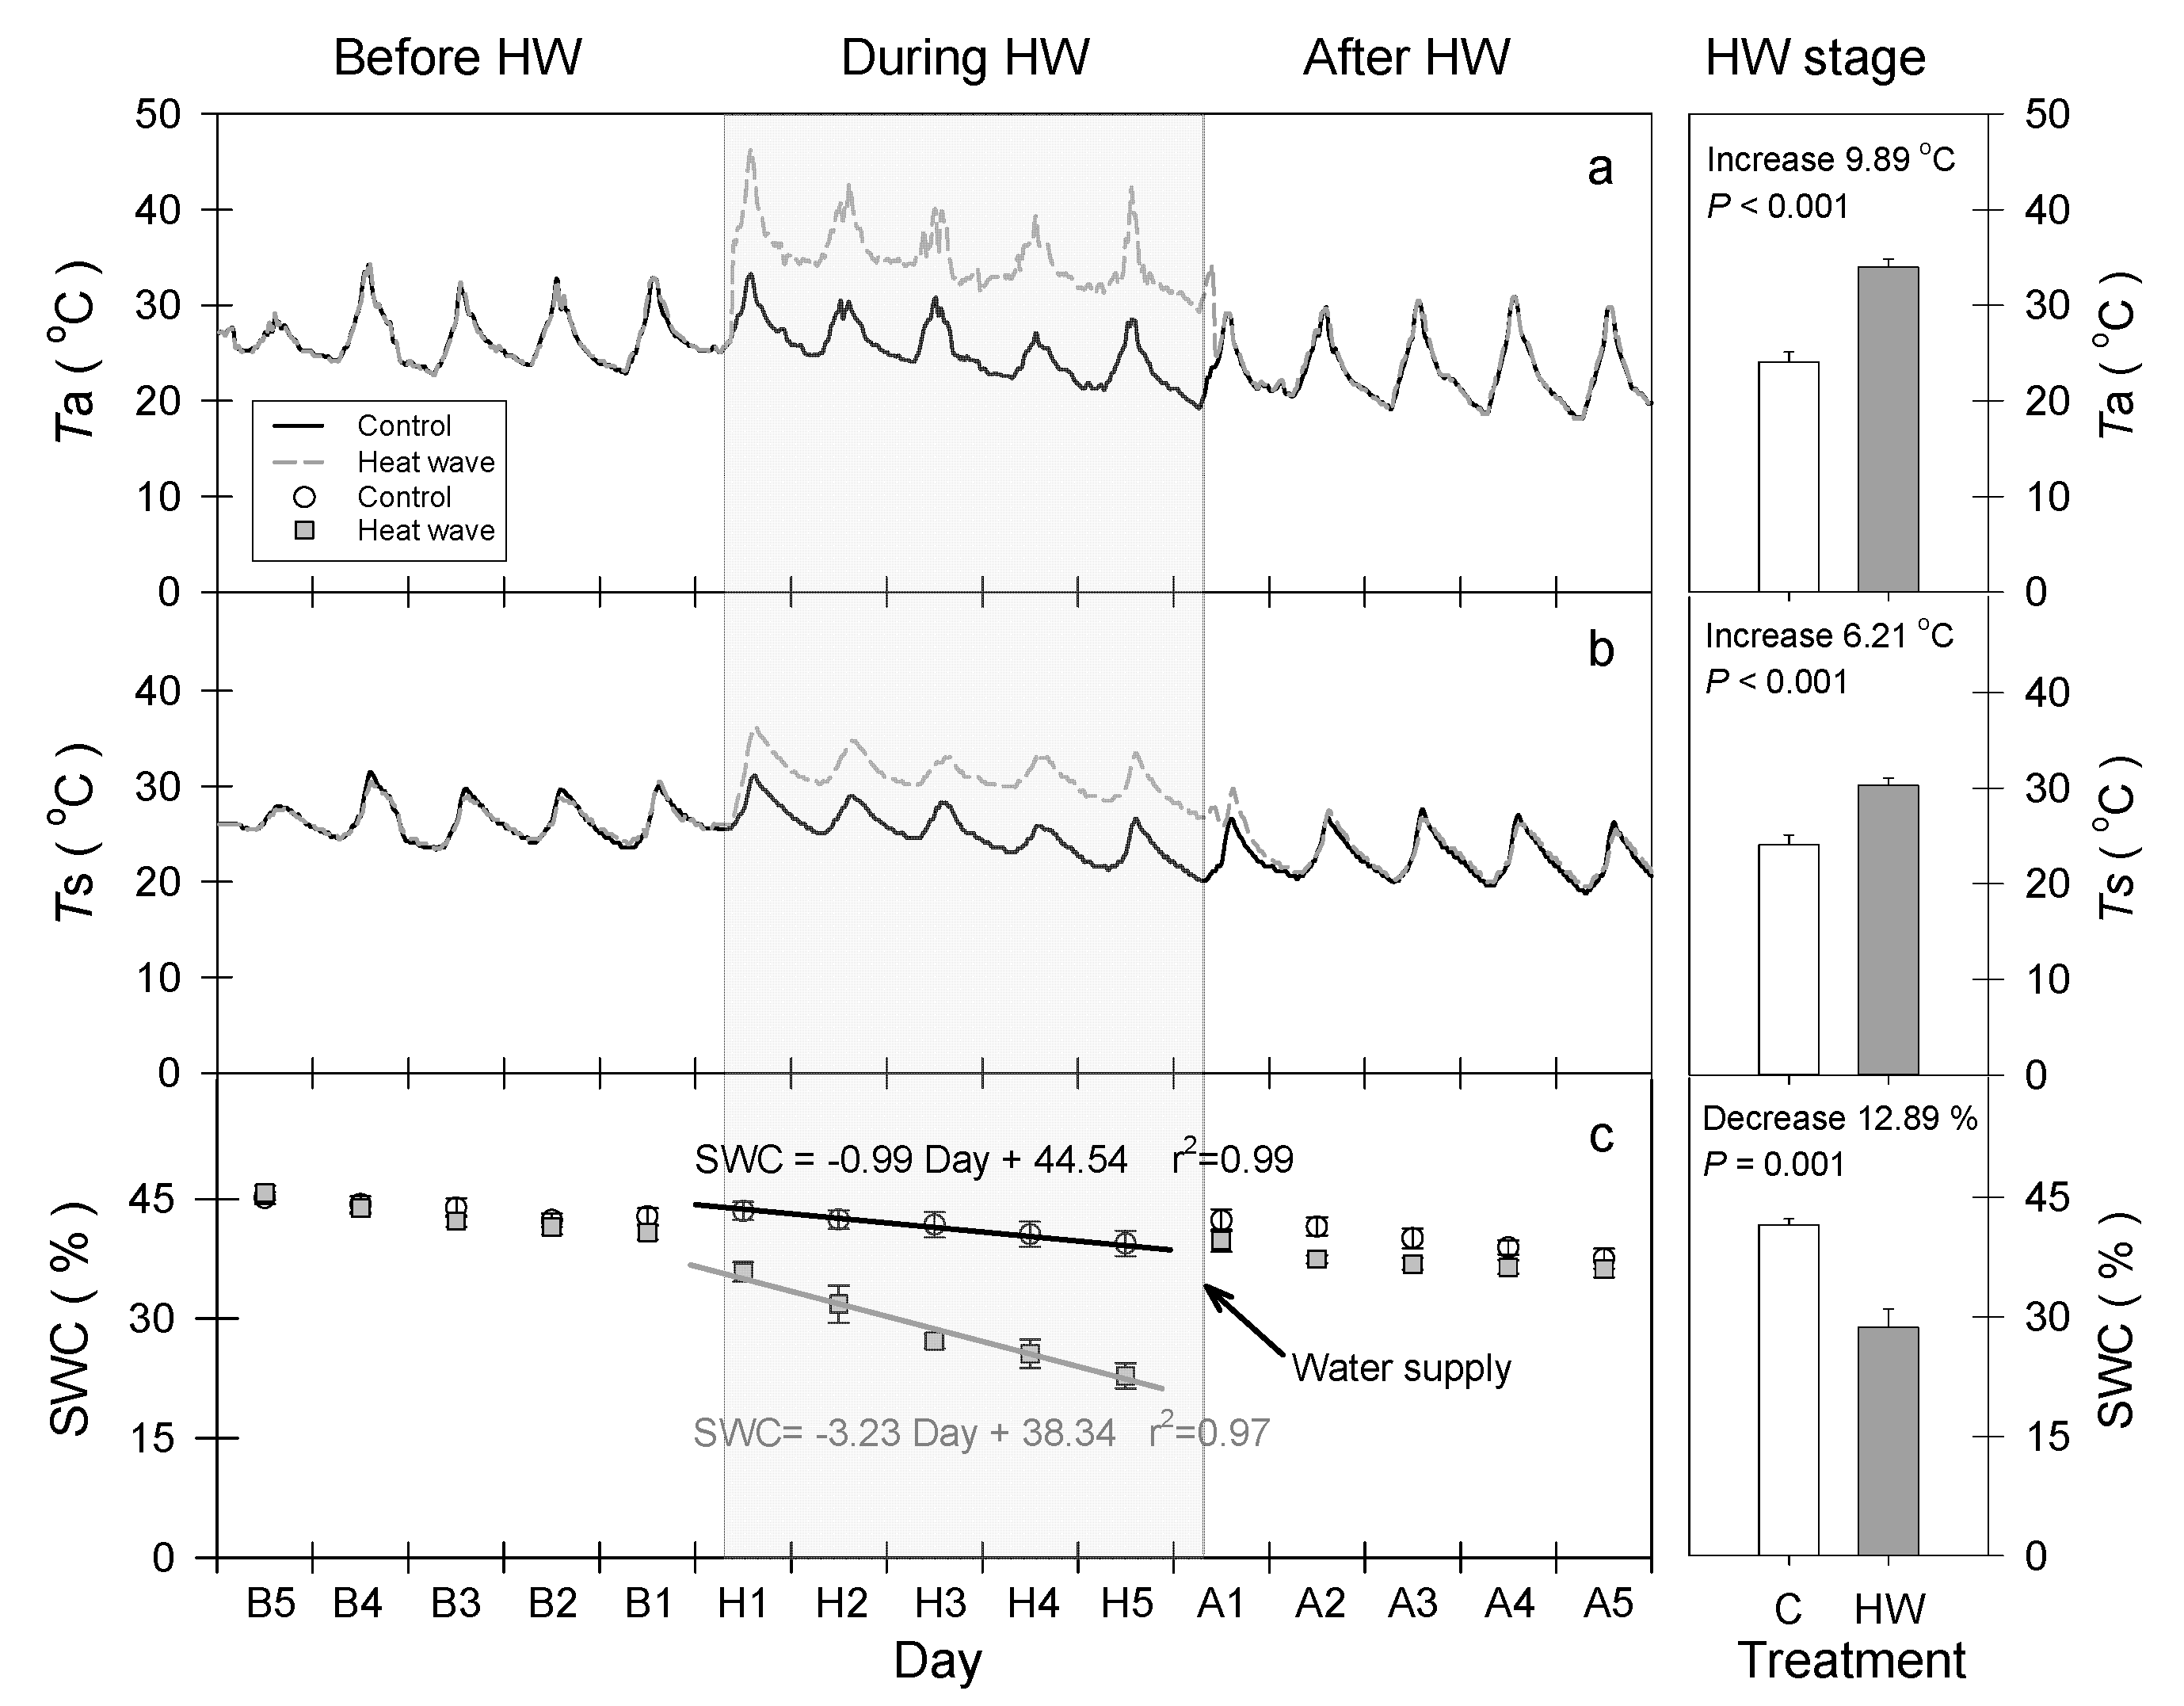
2.2. Heat Wave Simulation

Open top chambers (OTCs) with two electric heaters were used to simulate HWs (Figure 1), with each plot being covered by an OTC (a total of 6 OTC). The OTCs were rectangular in shape, with a length of 4.8 m, a width of 2.2 m and a height of 2.2 m, and were constructed using 28 mm steel tubes. During the HW treatment, the OTCs were covered with a polyethylene mesh cloth. Two industrial electric heaters (20 cm × 15 cm × 15 cm, 3500 W each, BGE, Germany) were installed inside each HW OTC at a height of 2.0 m, with a fixed angle of 20° to prevent hot wind blowing directly on the plants. Four fans providing axial flow were suspended on both sides of the heater to homogenise the air inside the OTC. Thermal control devices were used to prevent the temperature in the OTC from exceeding the local air temperature (45 °C) for comparable subtropical areas. To minimise the impact of the OTC, control plots were also covered by OTCs, but without the heating devices. To quantify the abiotic effects of HW simulation, the air temperature at a 5 cm height (Ta), soil temperature at a 5 cm depth (Ts), and soil volumetric water content (SWC) were monitored during the experiment. The temperature was measured by button type temperature recorders (IBUTTON, DS1922L, China). Each plot had 6 IBUTTONs, 3 for Ta and 3 for Ts, with 18 IBUTTONs used in total. SWC was measured daily at 10:00 a.m. during the 15 days before, during and after the HW by Hydro sense-II sensors with 12-cm rods (Campbell Scientific, Logan, UT, USA).
In line with the local climate history, HWs were applied in August, the month with the second highest HW frequency, to reduce the risk of natural HW impact, continuous dry sunny days were selected for HW application because natural HWs are usually dry. The HW treatment lasted for 5 days, and the polyethylene mesh cloth did not fully insulate the OTC, with outside temperatures also influencing inside air temperatures. A pilot experiment showed that the canopy temperature increased by c. 6–10 °C during the day and by c. 4 °C at night. After the HWs, the OTCs were removed, and a shade cloth was installed to avoid any natural HW impacts. There was no irrigation during the HW period for both control and HW treatments (the OTS is water proof), but nearly 3 L of water was immediately supplied in each pot when the OTC was removed, and the SWC was maintained between 40% and 50% during the rest of the experiment. The experiment was divided into three periods: “pre HW” (B1–B5), “HW” (H1–H5) and “post HW” (A1–A30). The environmental conditions observed inside the OTCs were in line with realistic summer patterns and HW events (Figure 2). Before the HW simulation (B5–B1), all the environmental factors (Ta, Ts and SWC) were similar between treatments, indicating that all the environmental variations came from our HW simulation method. When the HW simulation began, the Ta in the HW groups significantly (p < 0.001) increased by 9.9 °C on average, from 24.1 °C to 33.9 °C, while the Ts increased by 6.2 °C, from 24.1 °C to 30.3 °C (p < 0.001). The SWC in the HW groups decreased significantly, with a daily rate of SWC reduction (3.2% day−1) more than 3 times higher under HW treatment than that in the control group (1.0% day−1). The daily average significantly decreased by more than 12%, from 41.5% to 28.7% (p = 0.001). After the HW, the Ta in the HW group immediately returned to the control level, while the Ts remained slightly higher than the control level until the second day. The SWC in the HW group quickly recovered to the same level as the control because of sufficient irrigation.

2.3. Stem Hydraulic Conductivity

Stem hydraulic conductivity was measured on the first post HW day (A1) (Table 1). Main stems of c. 15-cm long, each from a different individual, were collected from 5 cm above the soil in the early morning. After excision, the cut ends of the branches were immediately re-cut under water to remove embolized tracheid (2 cm removed). The stem segment, selected for hydraulic conductivity measurements, and the downstream parts with leaves were subsequently labelled. Remaining under water throughout this entire procedure, the labelled stem segments were then immediately transported to the laboratory where 10-cm-long stem segments were cut from the middle part of the originally sampled segments for determining hydraulic conductivity (Kh). After smoothing both ends with a sharp razor blade, the stem segments were connected to a tubing apparatus. The perfusion solution used for hydraulic conductivity measurements was 10 mmol·L−1 oxalic acid solution, degassed and filtered through a 0.2 µm pore. We used a hydraulic head of 50 cm to generate hydrostatic pressure by which a steady flow of the solution was passed through the stem segments. Stem Kh (g·m·s−1 MPa−1) was calculated as follows:
Kh = Jv/(ΔPL)
where Jv is the flow rate of solution through the segment, p is the hydrostatic pressure generated by the hydraulic head and L is the length of the segment. After the determination of Kh, the degree of stem xylem embolism was estimated by comparing native hydraulic conductivity and maximum hydraulic conductivity after embolisms were removed, which is the percentage loss of conductivity (PLC). We then connected the stem to a tubing apparatus and flushed it with filtered (0.2 μm) oxalic acid solution at 100 kPa for 15 min to eliminate any existing embolisms and subsequently determined the maximum hydraulic conductivity (Kmax) by applying the same method as for Kh. PLC was then calculated as follows:
PLC (%) = 100·(KmaxKh)/Kmax
Then, the specific conductivity (Ks, g m s−1 MPa−1), leaf specific conductivity (Kl, g m s−1 MPa−1) and Huber value (Hv) were calculated as follows:
Ks = Kh/Aw
Kl = Kh/LA
Hv = Aw/LA
where Aw is the sapwood area (cm2), and LA is the total leaf area (cm2) terminal to the segment.

2.4. Leaf Gas Exchange

Photosynthetic measurements were conducted during and after the HW treatment to determine the effects of HW on foliar gas exchange. To assess diurnal changes, measurements were conducted before (B1), during (H3 and H5), and after the HW (A3, A5 and A7) during the morning (8:00–10:00 a.m.) (Table 1). Moreover, the diurnal dynamics of An, Tr and WUE were determined every two hours on day H5 from 8:00 a.m. to 16:00 p.m. Mature fully expanded leaves were chosen randomly then marked from each individual (48 leaves in total), and leaf temperature (Tleaf), leaf vapor pressure deficit (VPD), stomatal conductance (gs), net photosynthesis rate (An) and transpiration rate (Tr) were measured with a portable photosynthesis system (LI-6800, LI-COR Biosciences, Lincoln, NE, USA). During measurements, the photosynthetic photon flux was maintained at 1500 μmol·m−2·s−1 to ensure that light-saturated photosynthesis rates were reached for the two study species. The ambient CO2 concentration was maintained at 400 μmol·mol−1, and the airflow was auto-set in the leaf chamber without temperature and water controls. We ensured that the broad leaf area (green part) fully filled the leaf chamber, while needle leaves were arranged together to ensure complete cover of the leaf chamber (6 cm2 circle). The leaf water use efficiency (WUE) was calculated as WUE = An/Tr.

2.5. Final Harvest

Thirty days after the end of the HW (A30) (Table 1), the seedlings were harvested and then sorted into different categories (by species and by plant tissue (leaves, stems and roots)), oven-dried at 65 °C for 3 days and weighed to measure the biomass. Dried leaves were pulverized with a ball mill, and approximately 4 mg of the sample was collected and wrapped into a tin cup to determine the carbon and nitrogen content with a C/N elemental analyser (IRMS, Isoprime 100, UK) for measuring the leaf total nitrogen content (TN) and total carbon content (TC), and the C/N ratio was calculated.

2.6. Data Analysis and Statistics

The average value of each plot (containing 4 pots) was used for replications (n = 3) before the analysis. Paired T-tests were applied to examine the effects of HWs on the environment (Ta, Ts and SWC). Multivariate analysis (two-way ANOVA) was used to examine the effects of the HW, the species and their interaction on the hydraulic characteristics (Kh, Kmax, PLC, Ks, Kl and HV) and biomass (leaf, stem, aboveground, underground and total) of the two tree species. Repeated measures analysis was used to examine daily or temporal variability of the photosynthetic system (Tleaf, VPD, gs, An, Tr and WUE) and leaf nutrient parameters (TC, TN and C/N ratio) during different stages (days) for different species when combined with the HW treatment. Independent T-tests were applied to examine short- and long-term HW effects on biomass, leaf C/N content, the photosynthesis system and seedling hydraulic characteristics of S. superba and C. lanceolata. All statistical analyses were conducted using SPSS 22.0 for Windows (SPSS Inc., Chicago, Illinois, USA).

3. Results

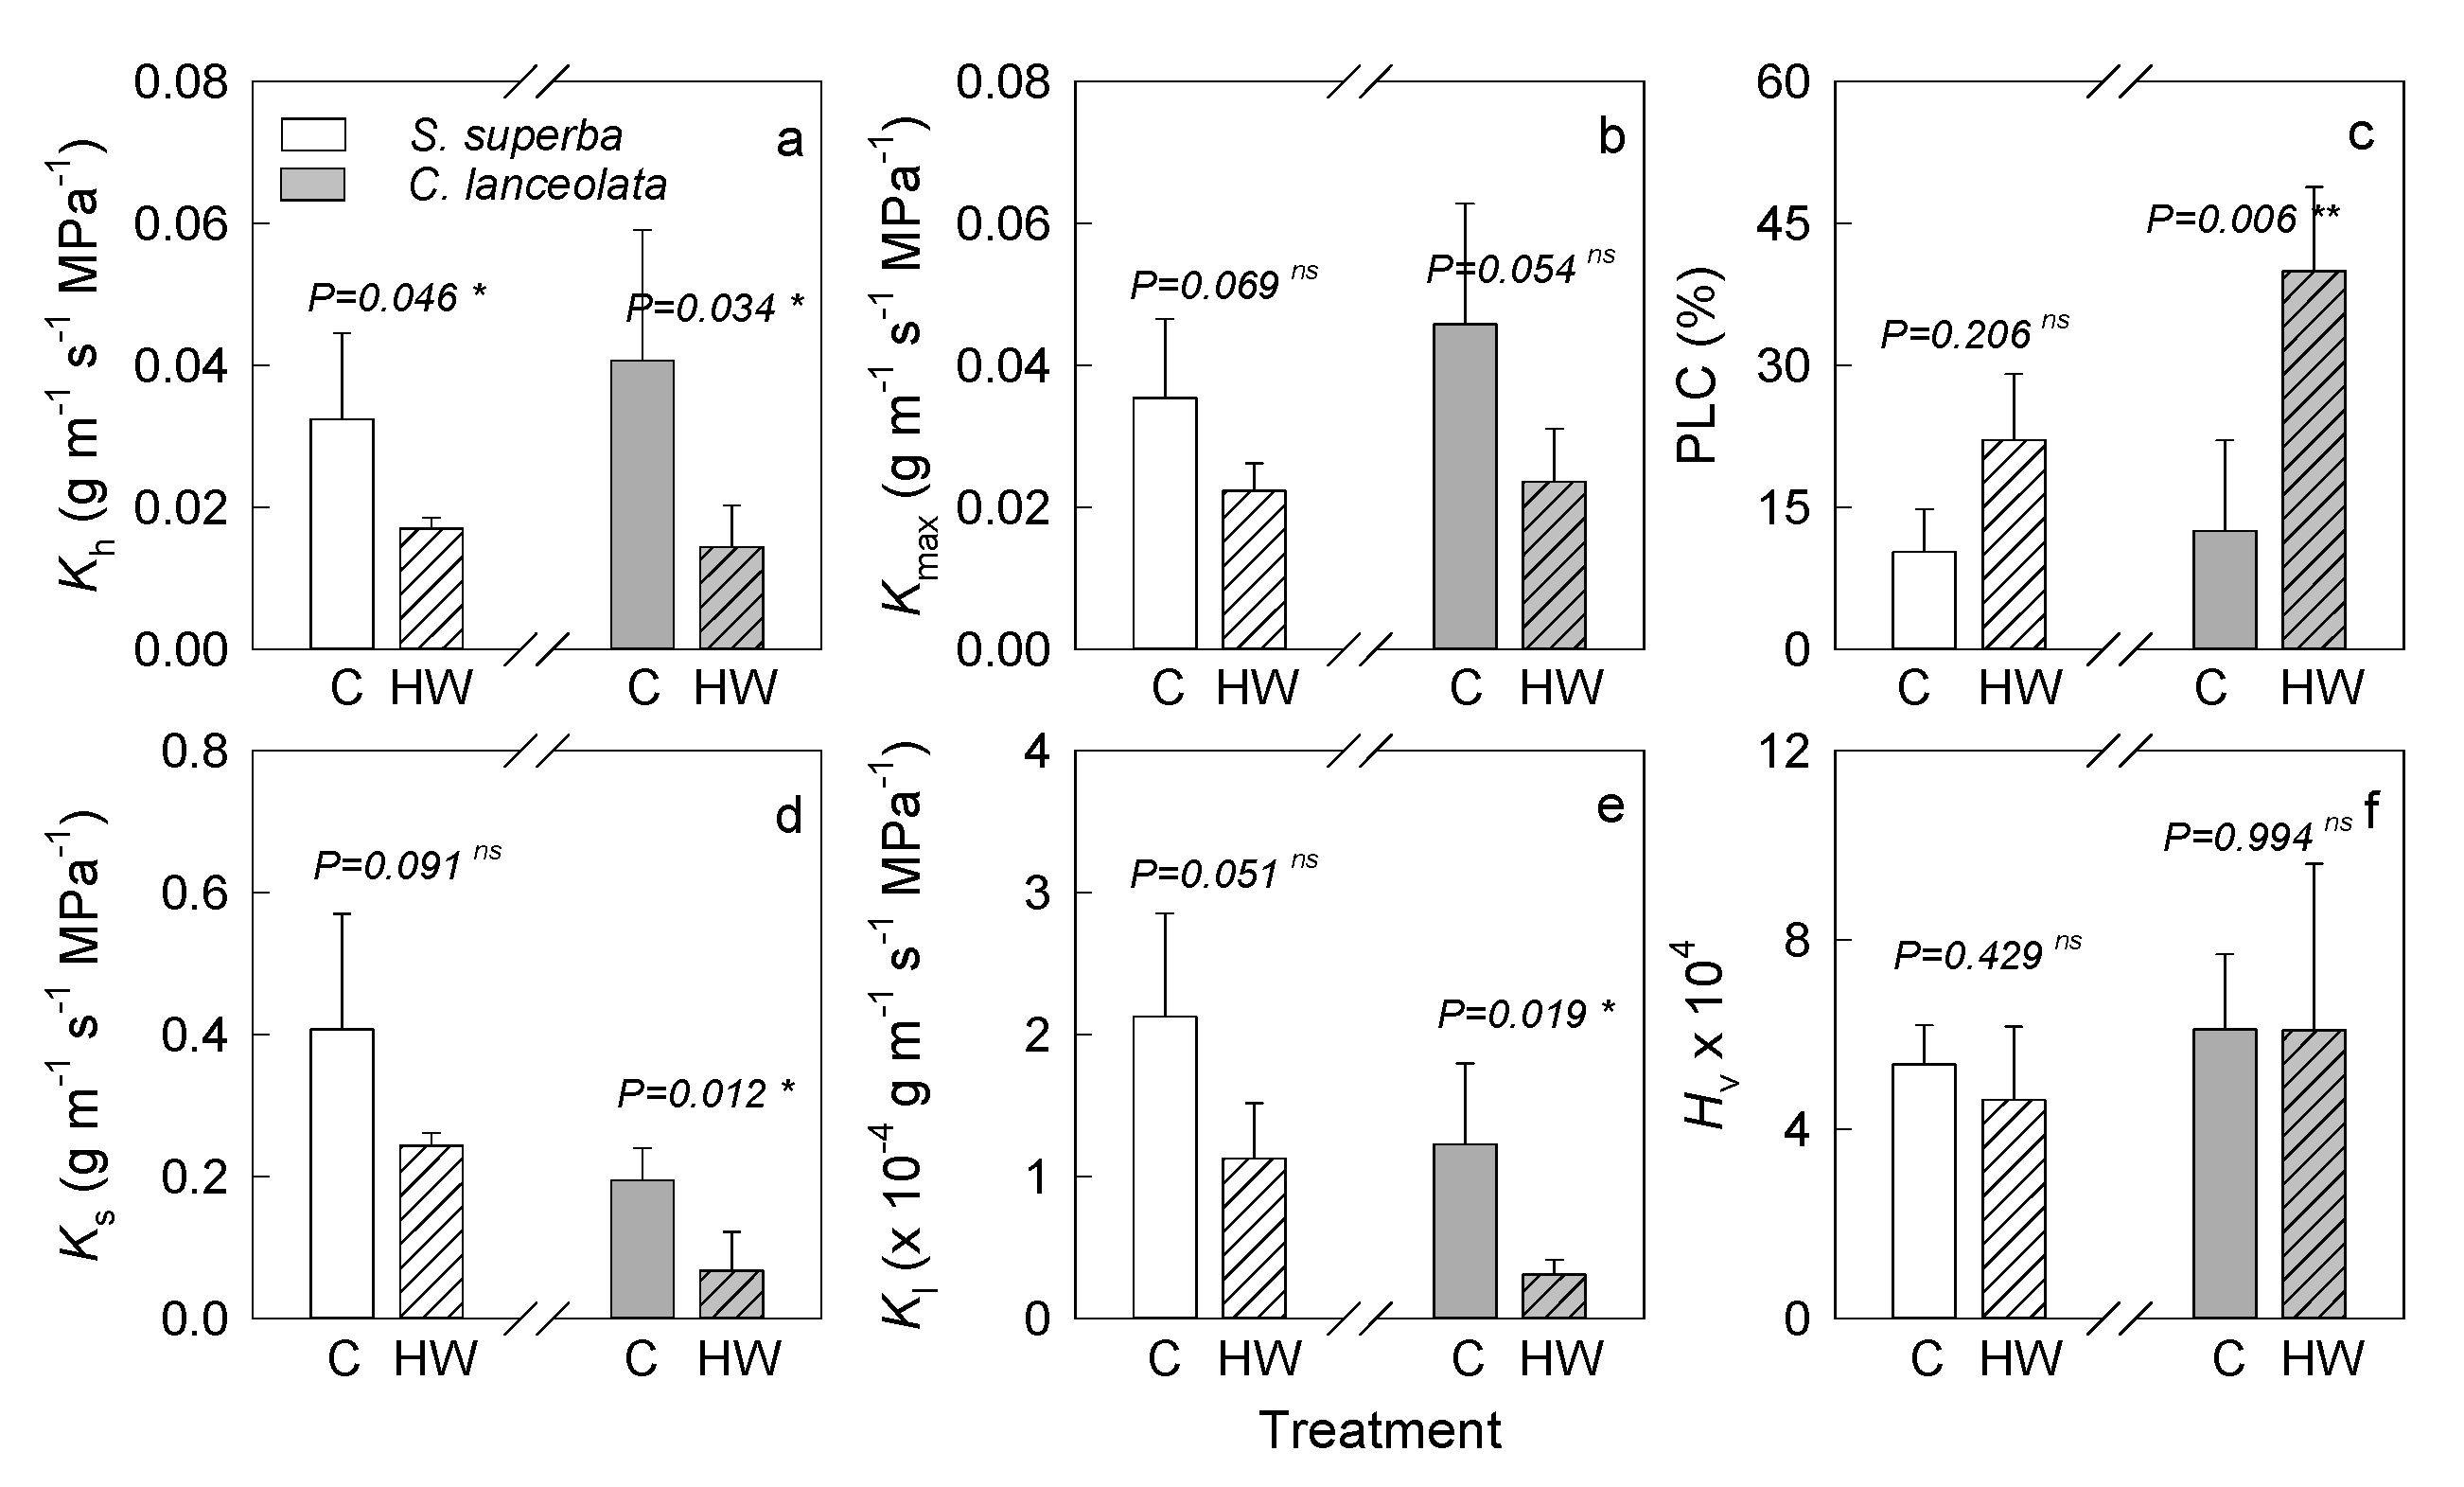
3.1. HW Effects on Plant Hydraulic Characteristics

The hydraulic characteristics of both S. superba and C. lanceolata were significantly affected by the HW treatment, although interspecific differences were apparent (Table 2). An HW caused the Kh of S. superba to decrease significantly by 52% from 0.032 g·m−1 s−1·MPa−1 (p = 0.046), while the Kmax decreased by 24% from 0.035 g·m−1 s−1 MPa−1 (p = 0.069) (Figure 3). In comparison, the Kh of C. lanceolata decreased significantly by 35% from 0.041·g m−1 s−1 MPa−1 (p = 0.034), and the Kmax decreased by 51% from 0.046 g m−1 s−1 MPa−1 (p = 0.054) (Figure 3a,b). Therefore, under the HW treatment, the PLC of S. superba increased by 25% (from 10.3%), which was, however, not significantly different from that of the control group (p = 0.206), whereas the PLC of C. lanceolata was significantly increased by 40% from 12.5% (p = 0.006) (Figure 3c). Although HWs caused no significant differences in HV for the two species (Figure 3f), they did significantly decrease the Ks and Kl of C. lanceolata, but not significantly in S. superba, where the KS of S. superba decreased by 40% from 0.195 g m−1 s−1 MPa−1 and the Kl decreased by 47%, while the KS of C. lanceolata decreased by 66% from 0.407 g·m−1 s−1·MPa−1 and the Kl decreased by 75% (Figure 3d,e).

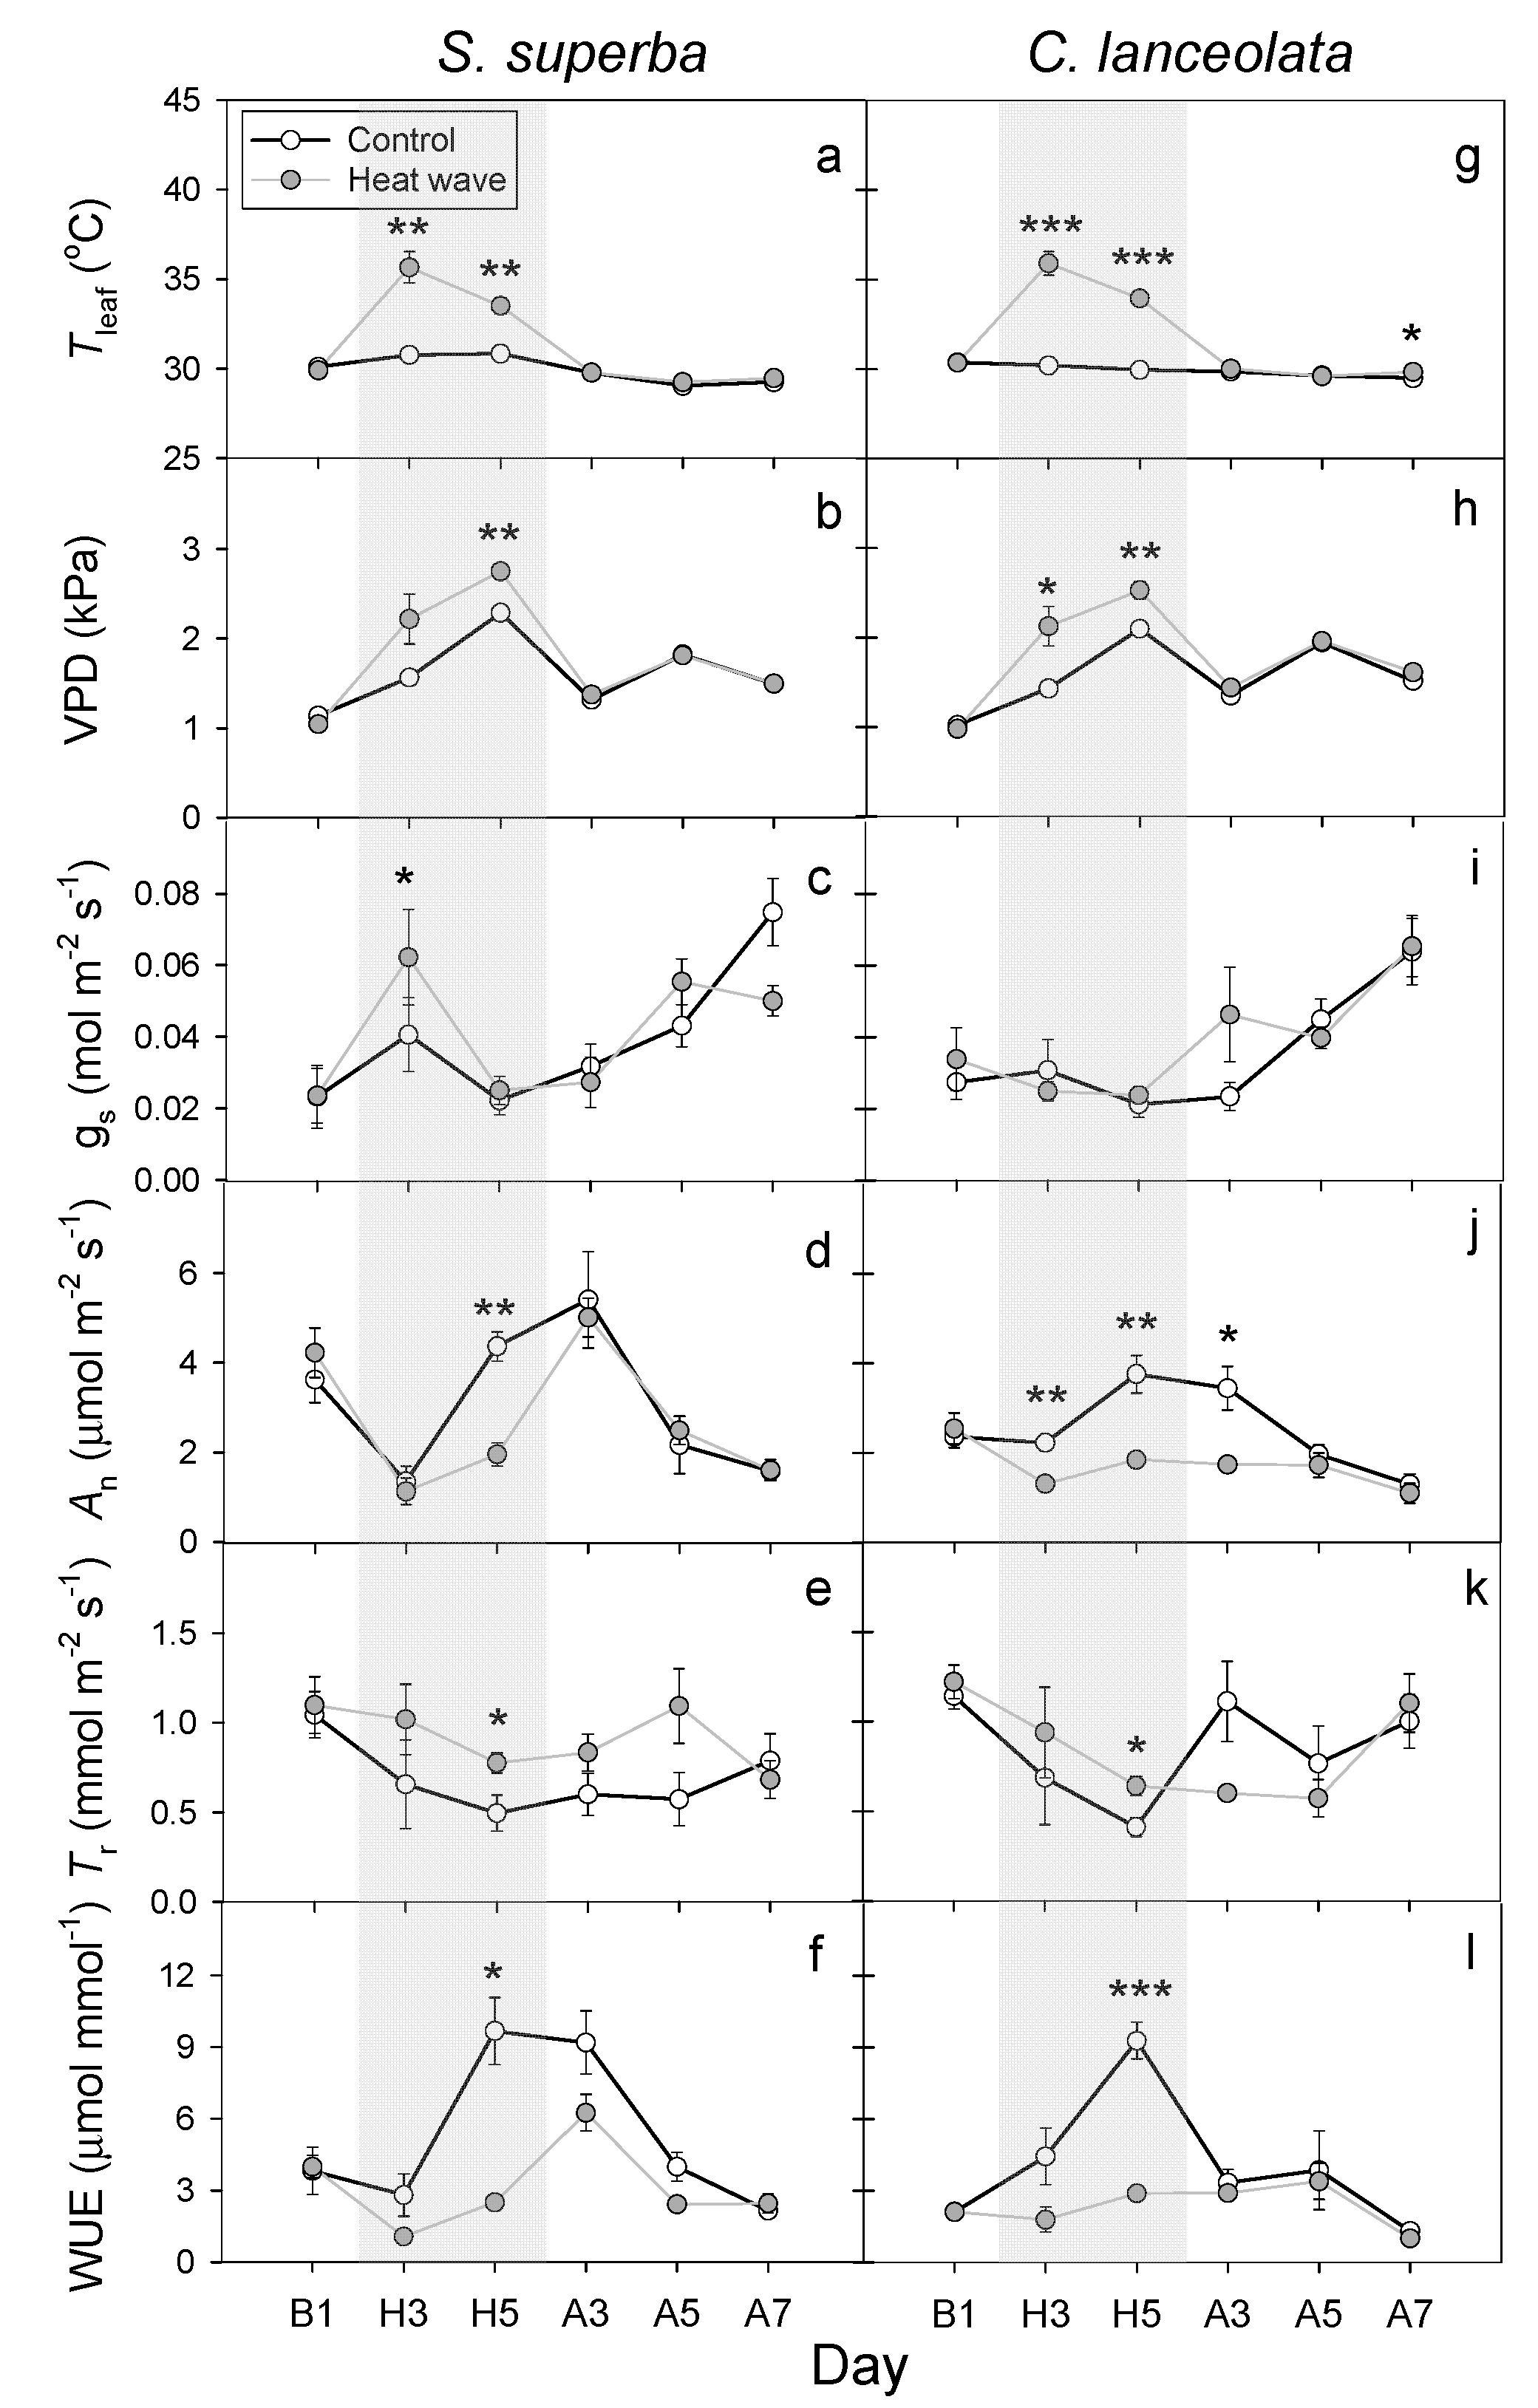
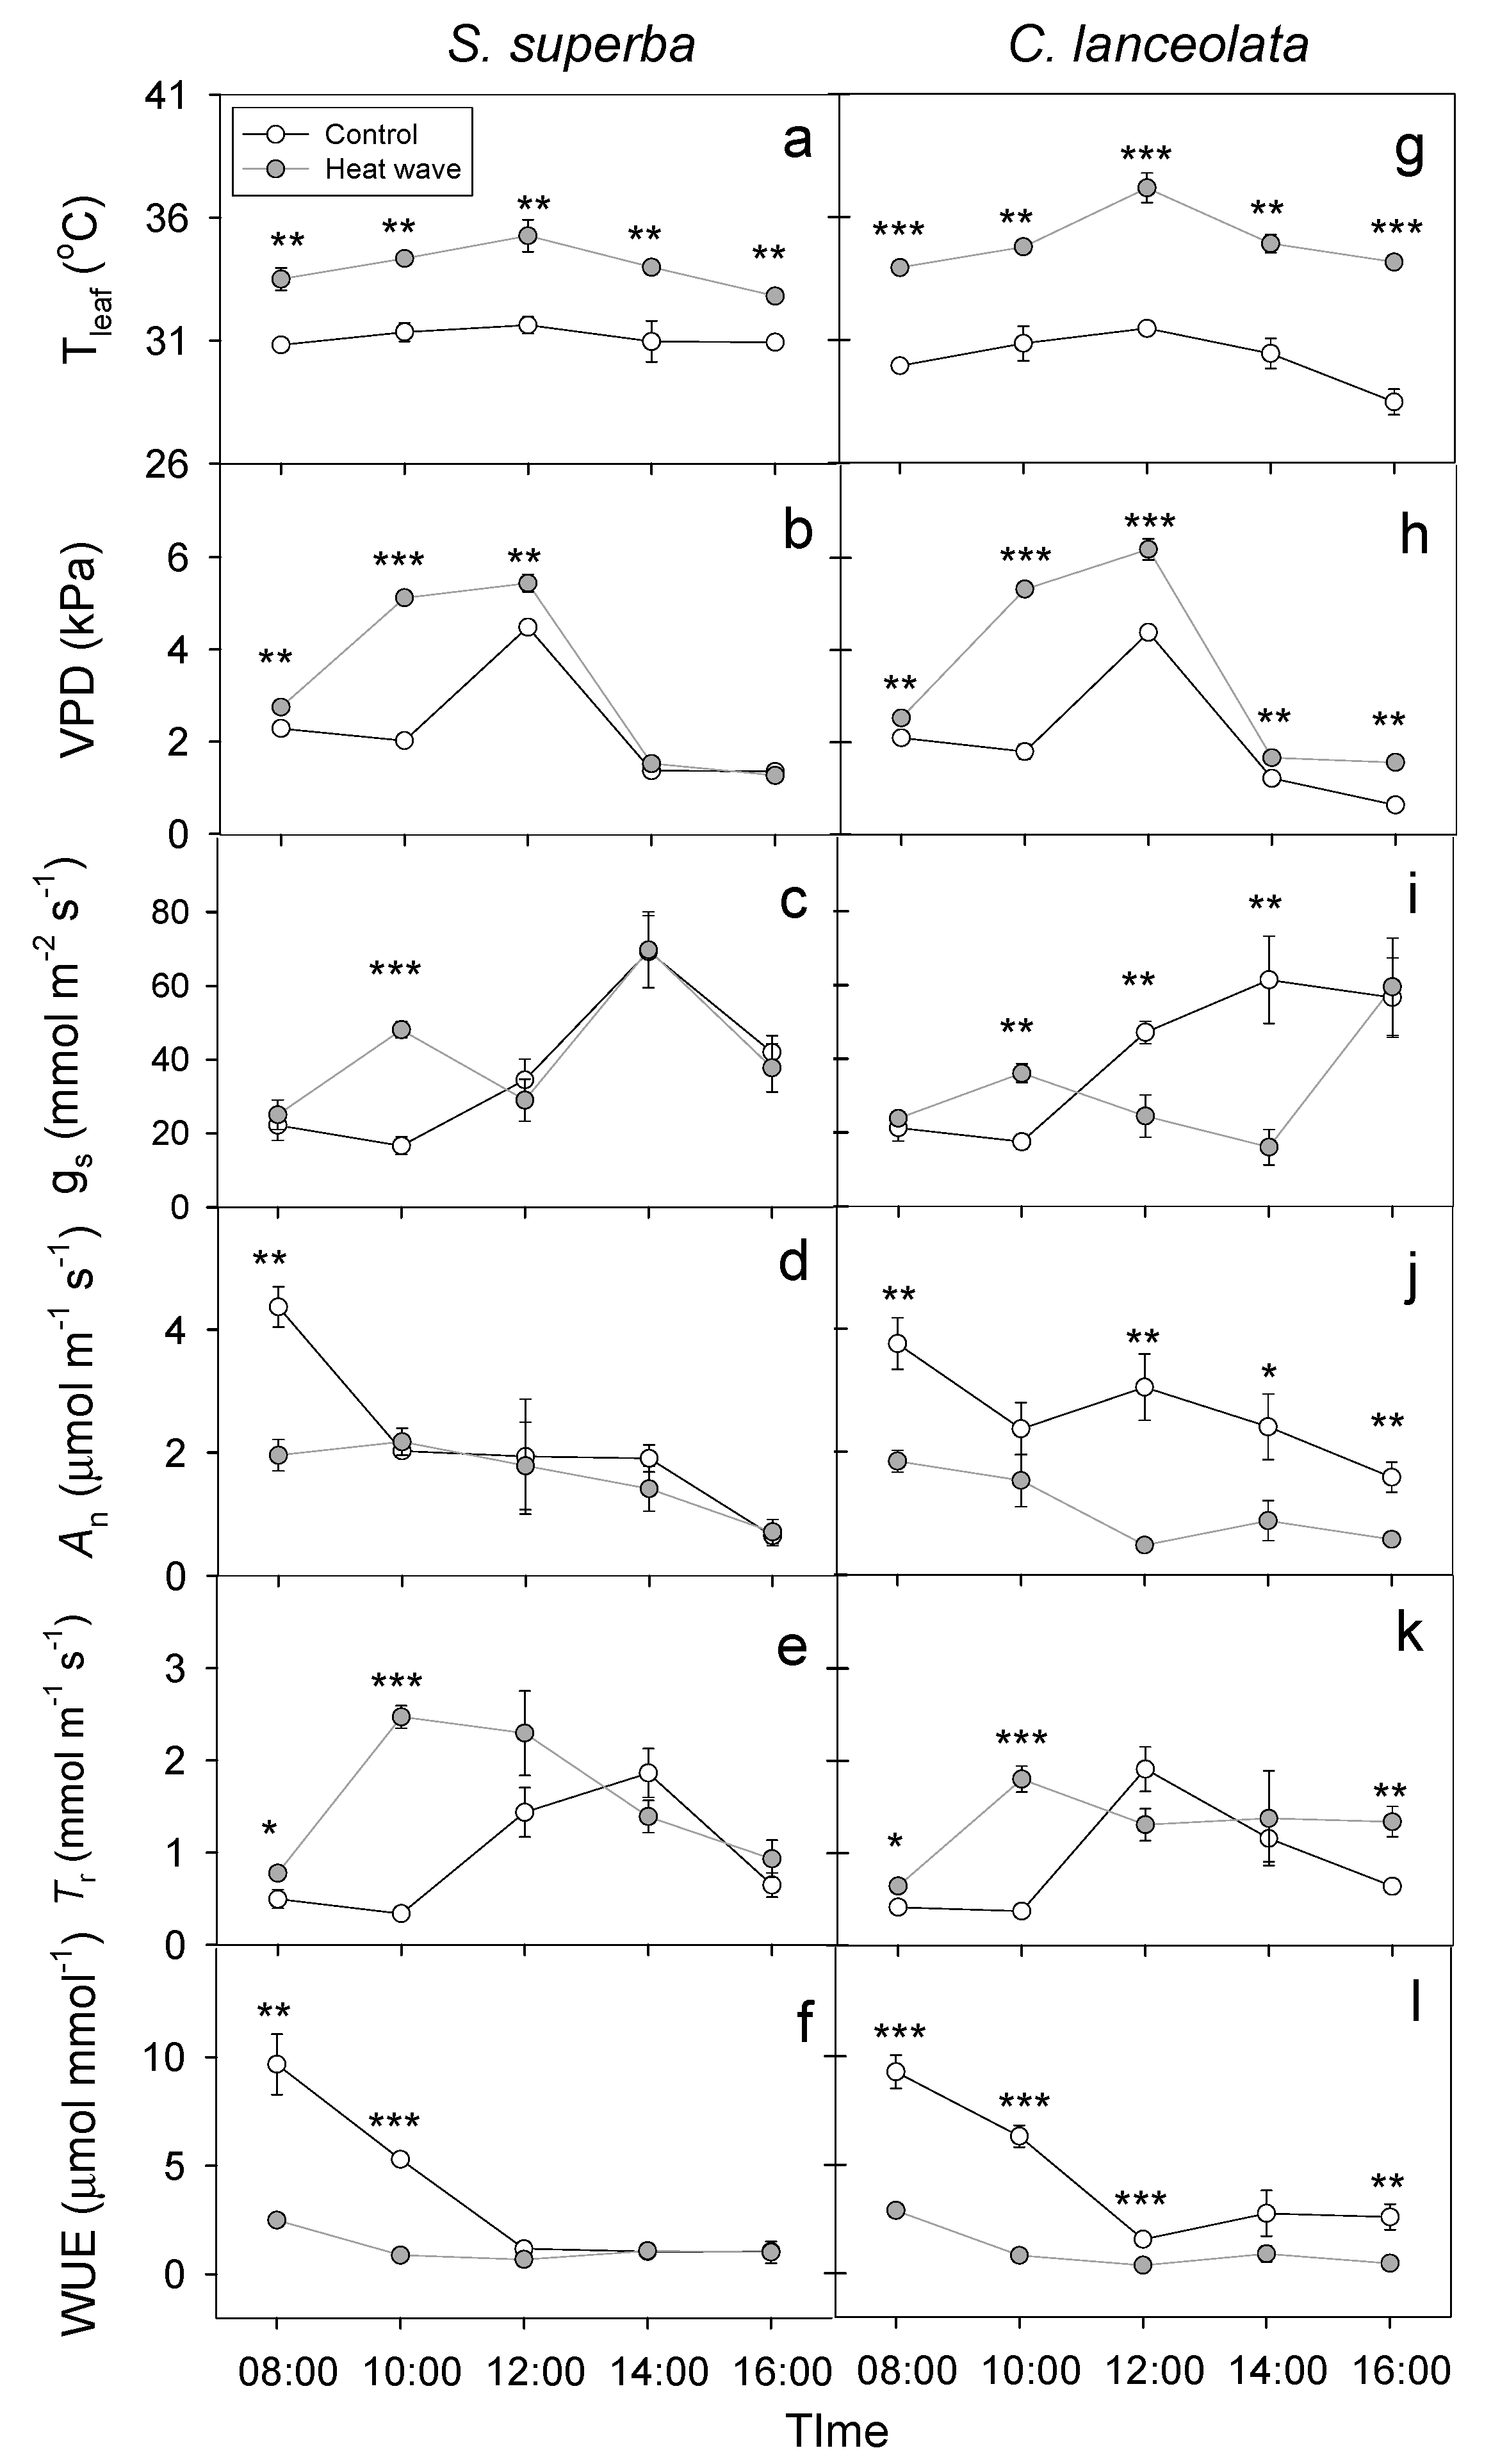
3.2. HW Effects on Leaf Gas Exchange and WUE

Differences in daily Tleaf, VPD, gs, An, Tr and WUE between the HW and control groups were used to measure the resistance and resilience of S. superba and C. lanceolata seedlings to HW stress (Table 3). HW led to a significant increase in Tleaf during the HW period (H3 and H5) (p < 0.01), while the Tleaf on day H3 was higher than on day H5, while the leaf VPD was highest at H5 for both species (Figure 4a,b,g,h). In line with higher VPD values on that day, Tr was significantly increased during day H5 (p < 0.05), to a similar extent for both species (Figure 4e,k), as there was no significant variation of gs (Figure 4c,i). Significant species-specific variation only occurred for the An and WUE (p < 0.01). For the broadleaved species S. superba, An was significantly (p < 0.01) affected by HW only at H5, with a reduction of more than 55% (Figure 4d), but the significant effect of HW on An disappeared three days later. In comparison, for the coniferous species C. lanceolata, the significantly reduced An occurred earlier and lasted longer than that observed in S. superba: HW caused a significant reduction in An of 41% and 51% during the HW period (H3 and H5), and An was still 49% lower 3 days after the end of the HW treatment (Figure 4j). Although the WUE of each species responded differently to HW, the only significant difference was recorded for H5 for both species (Figure 4f,l).
HWs also significantly affected the diurnal dynamics of plant leaf gas exchange on the last day of the HW (Table 4). On the 5th day of HW, Tleaf was significantly higher in the HW group than in the controls for both species (Figure 5a,g). The VPD variation followed the change in temperature and radiation (Figure 5b,h), with the highest Tleaf and VPD occurring at noon (12:00 a.m.). The peak An and WUE of S. superba and C. lanceolata both occurred at 8:00, and the most significant negative effects of the HWs were also recorded at this time (p < 0.001). Additionally, HWs also significantly increased the Tr at this time of day (p < 0.05). At 10:00 am, the decrease in An had become insignificant, but the differences in Tr were still significant for both species (p < 0.001), associated with a significantly increased gs (p < 0.05). Species-specific differences regarding the response of the gs, An, Tr and WUE to HWs started appearing from noon. For S. superba, there were no significant differences between the HW and control groups after this time, but for C. lanceolata, significant negative effects (p < 0.01) of HWs on An and gs were observed at 12:00 a.m. and 14:00 pm, and the significant difference lasted until 16:00 p.m. for An, while gs was not significant at this time of day (Figure 5i,j). This was also coupled with a significant reduction in WUE (Figure 5l) at 12:00 a.m. and 16:00 p.m. and an increased Tr at 16:00 p.m. (Figure 5k).

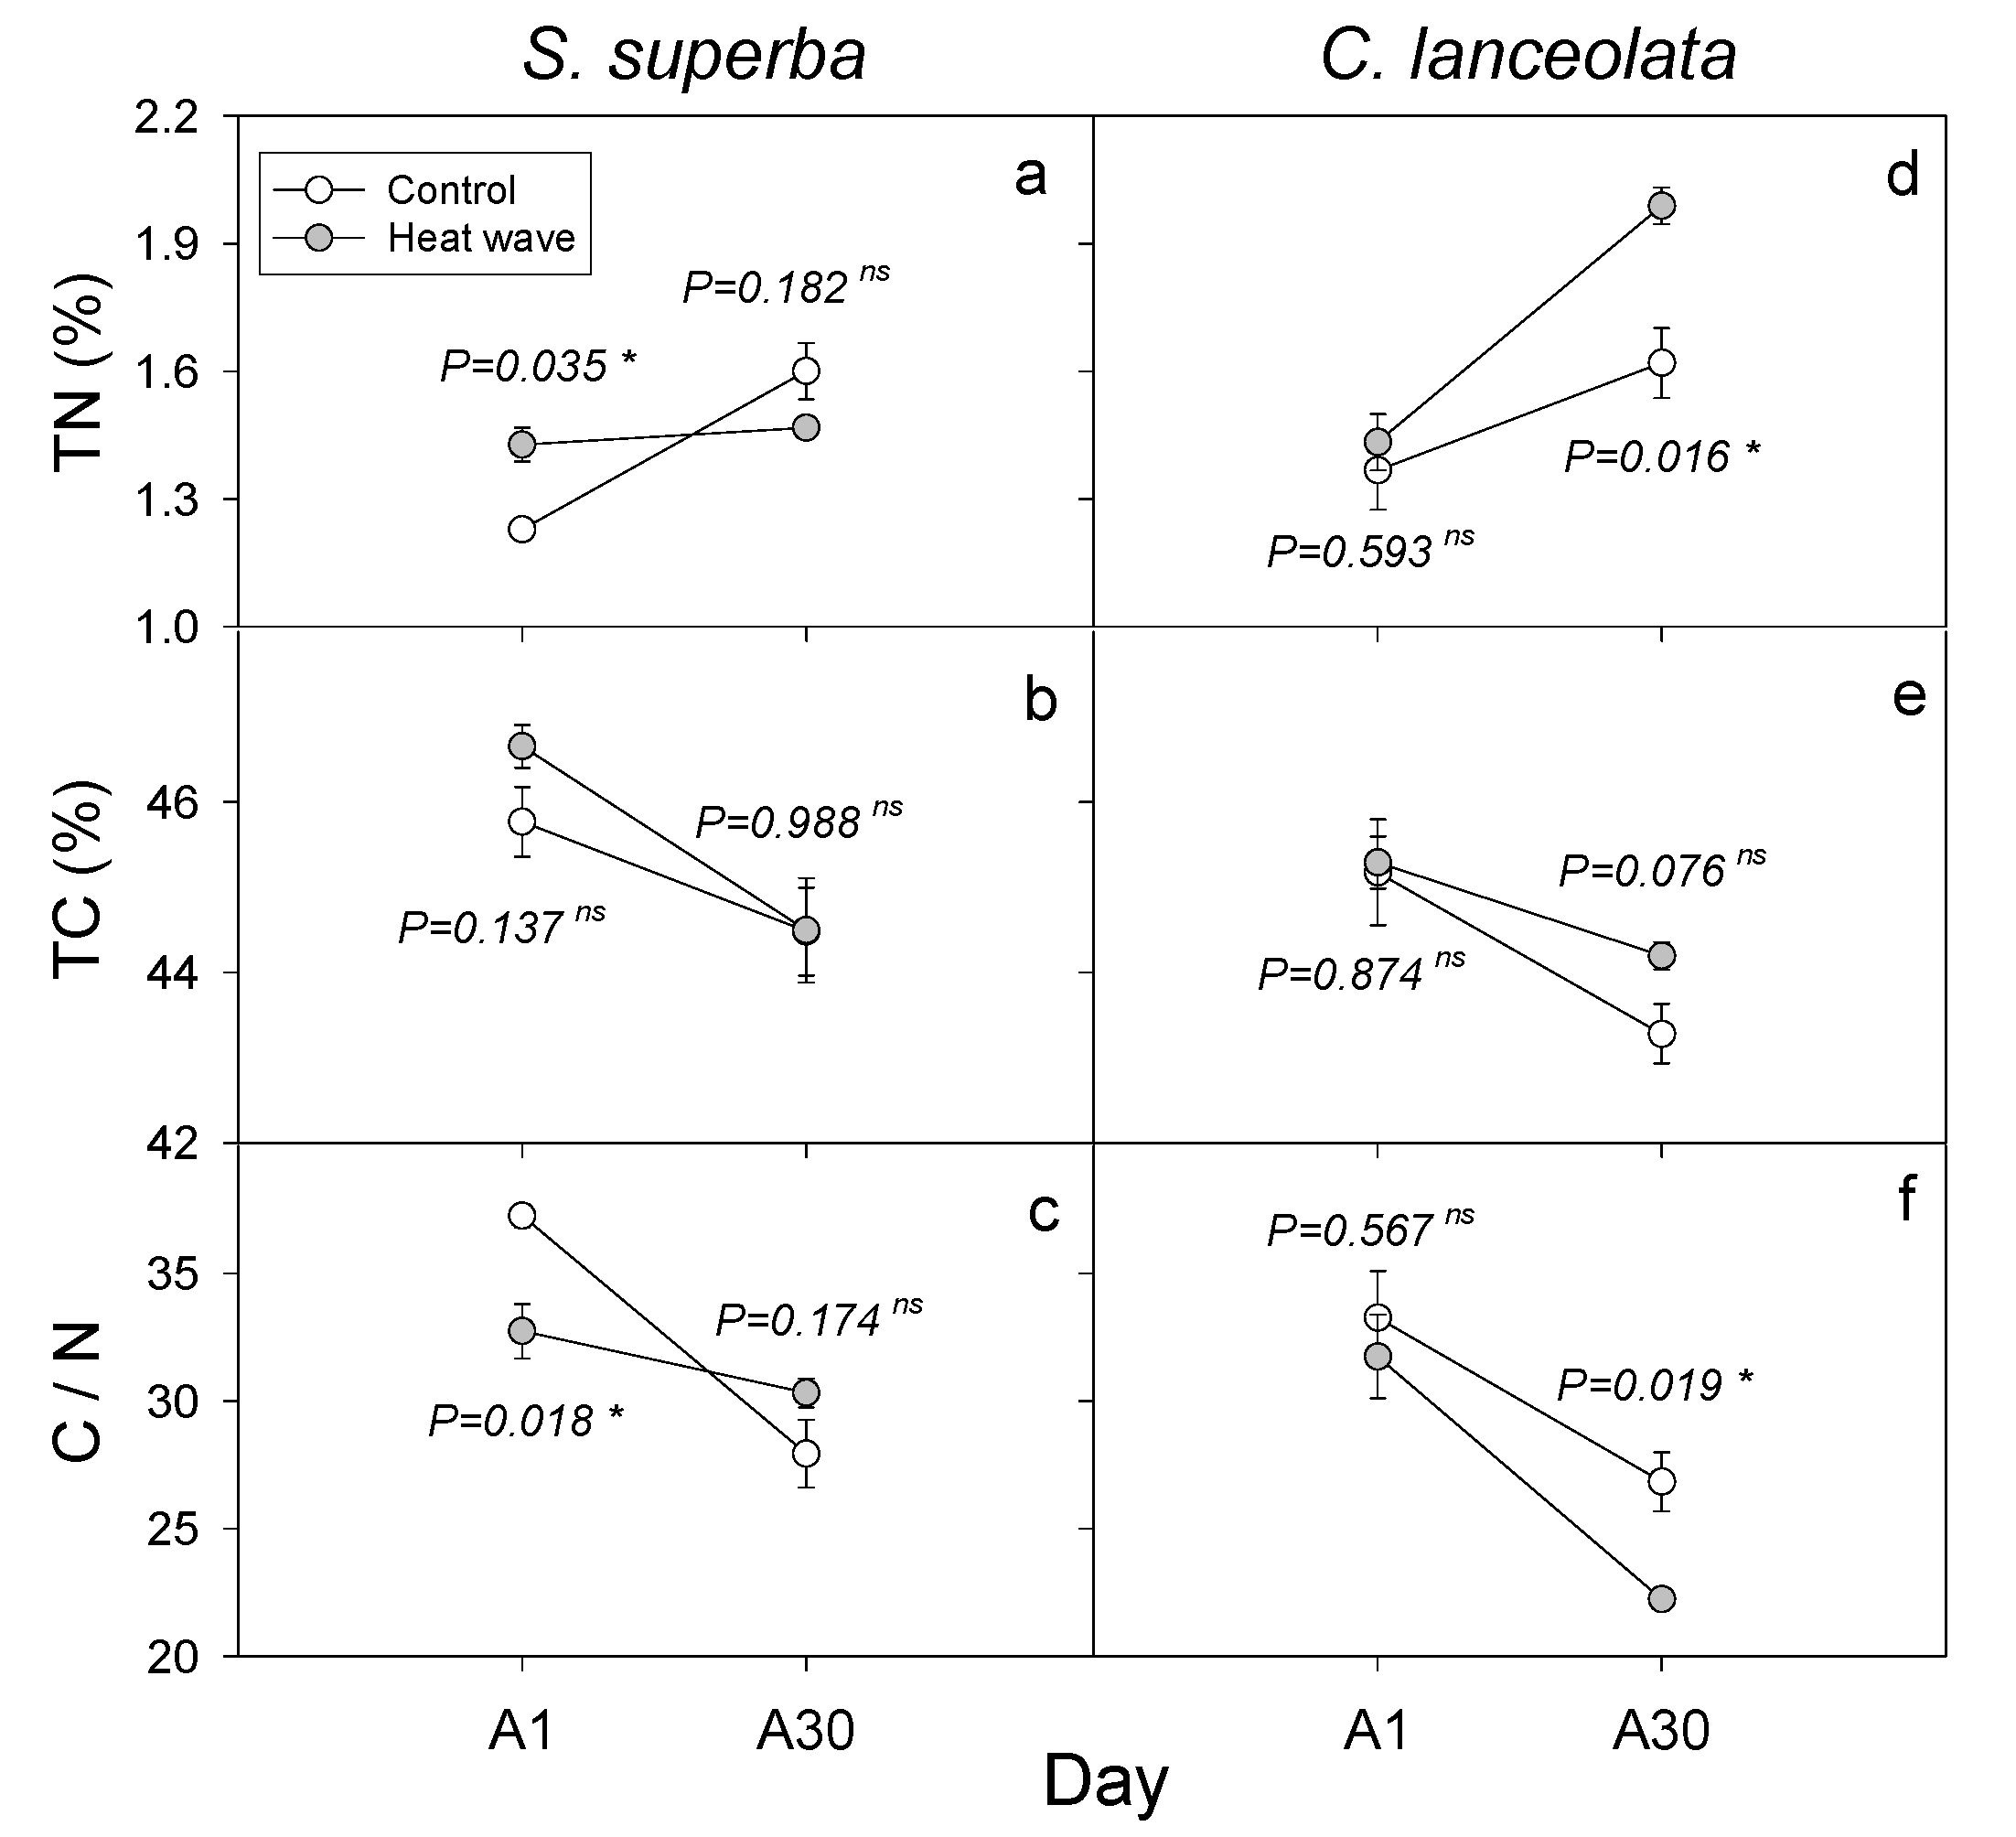
3.3. HW Effects on Plant Leaf Nutrients and Biomass

The HW caused a negative effect on the plant photosynthetic system, in turn causing significant variation in leaf nutrient contents and also affecting nutrient accumulation in the 30 days following the HW. Leaf TN was significantly affected by HWs, and interspecific and temporal differences were also apparent (p < 0.05), while HW had an insignificant effect on the leaf TC and C/N ratio with some interspecific differences (Table 5). The HW effect on S. superba leaf nutrients was most notable on the first day following the HW (A1), with a significantly higher TN (p = 0.035) and lower C/N ratio (p = 0.018) in the HW group; these significant differences disappeared 30 days later (Figure 6a–c). In contrast, the HW effect on C. lanceolata was insignificant during A1, while significant increases in leaf TN (p = 0.016), insignificant increases in leaf TC (p = 0.076), and a decrease in the C/N ratio (p = 0.019) were observed 30 days after the HW (Figure 5d–f).
We found significant species-specific effects of HWs on plant biomass, especially belowground biomass, at 30 days after the end of the HW treatment (A30) (p = 0.013, Table 2). In the control treatments, the biomass of C. lanceolata (40.3 g) was much larger than that of S. superba (3.4 g), but the root:shoot ratio of S. superba (0.71) was higher than that of C. lanceolata (0.50) (Table 6). HWs did not significantly affect the aboveground biomass of C. lanceolata (p = 0.711), with increases of leaf biomass and decreases of stem biomass seen, as well as a decrease in the belowground biomass by 21% (4.3 g, p = 0.074). For S. superba, the HW insignificantly stimulated the aboveground biomass by 62% (2.1 g, p = 0.083), coupled with a 49% increase of leaf biomass, 74% increase of stem biomass, and a 107% increase in the belowground biomass (2.6 g, p = 0.083). Moreover, HWs increased the root:shoot ratio of S. superba (0.90) but reduced this ratio in C. lanceolata (0.36). In general, HW caused no significant (p = 0.964) effect on the total biomass of C. lanceolata, (60.5 g in control treatment and 60.0 g in HW treatment) but a significant (p = 0.008) increase in the S. superba total biomass by 80%, from 5.8 g to 10.5 g.

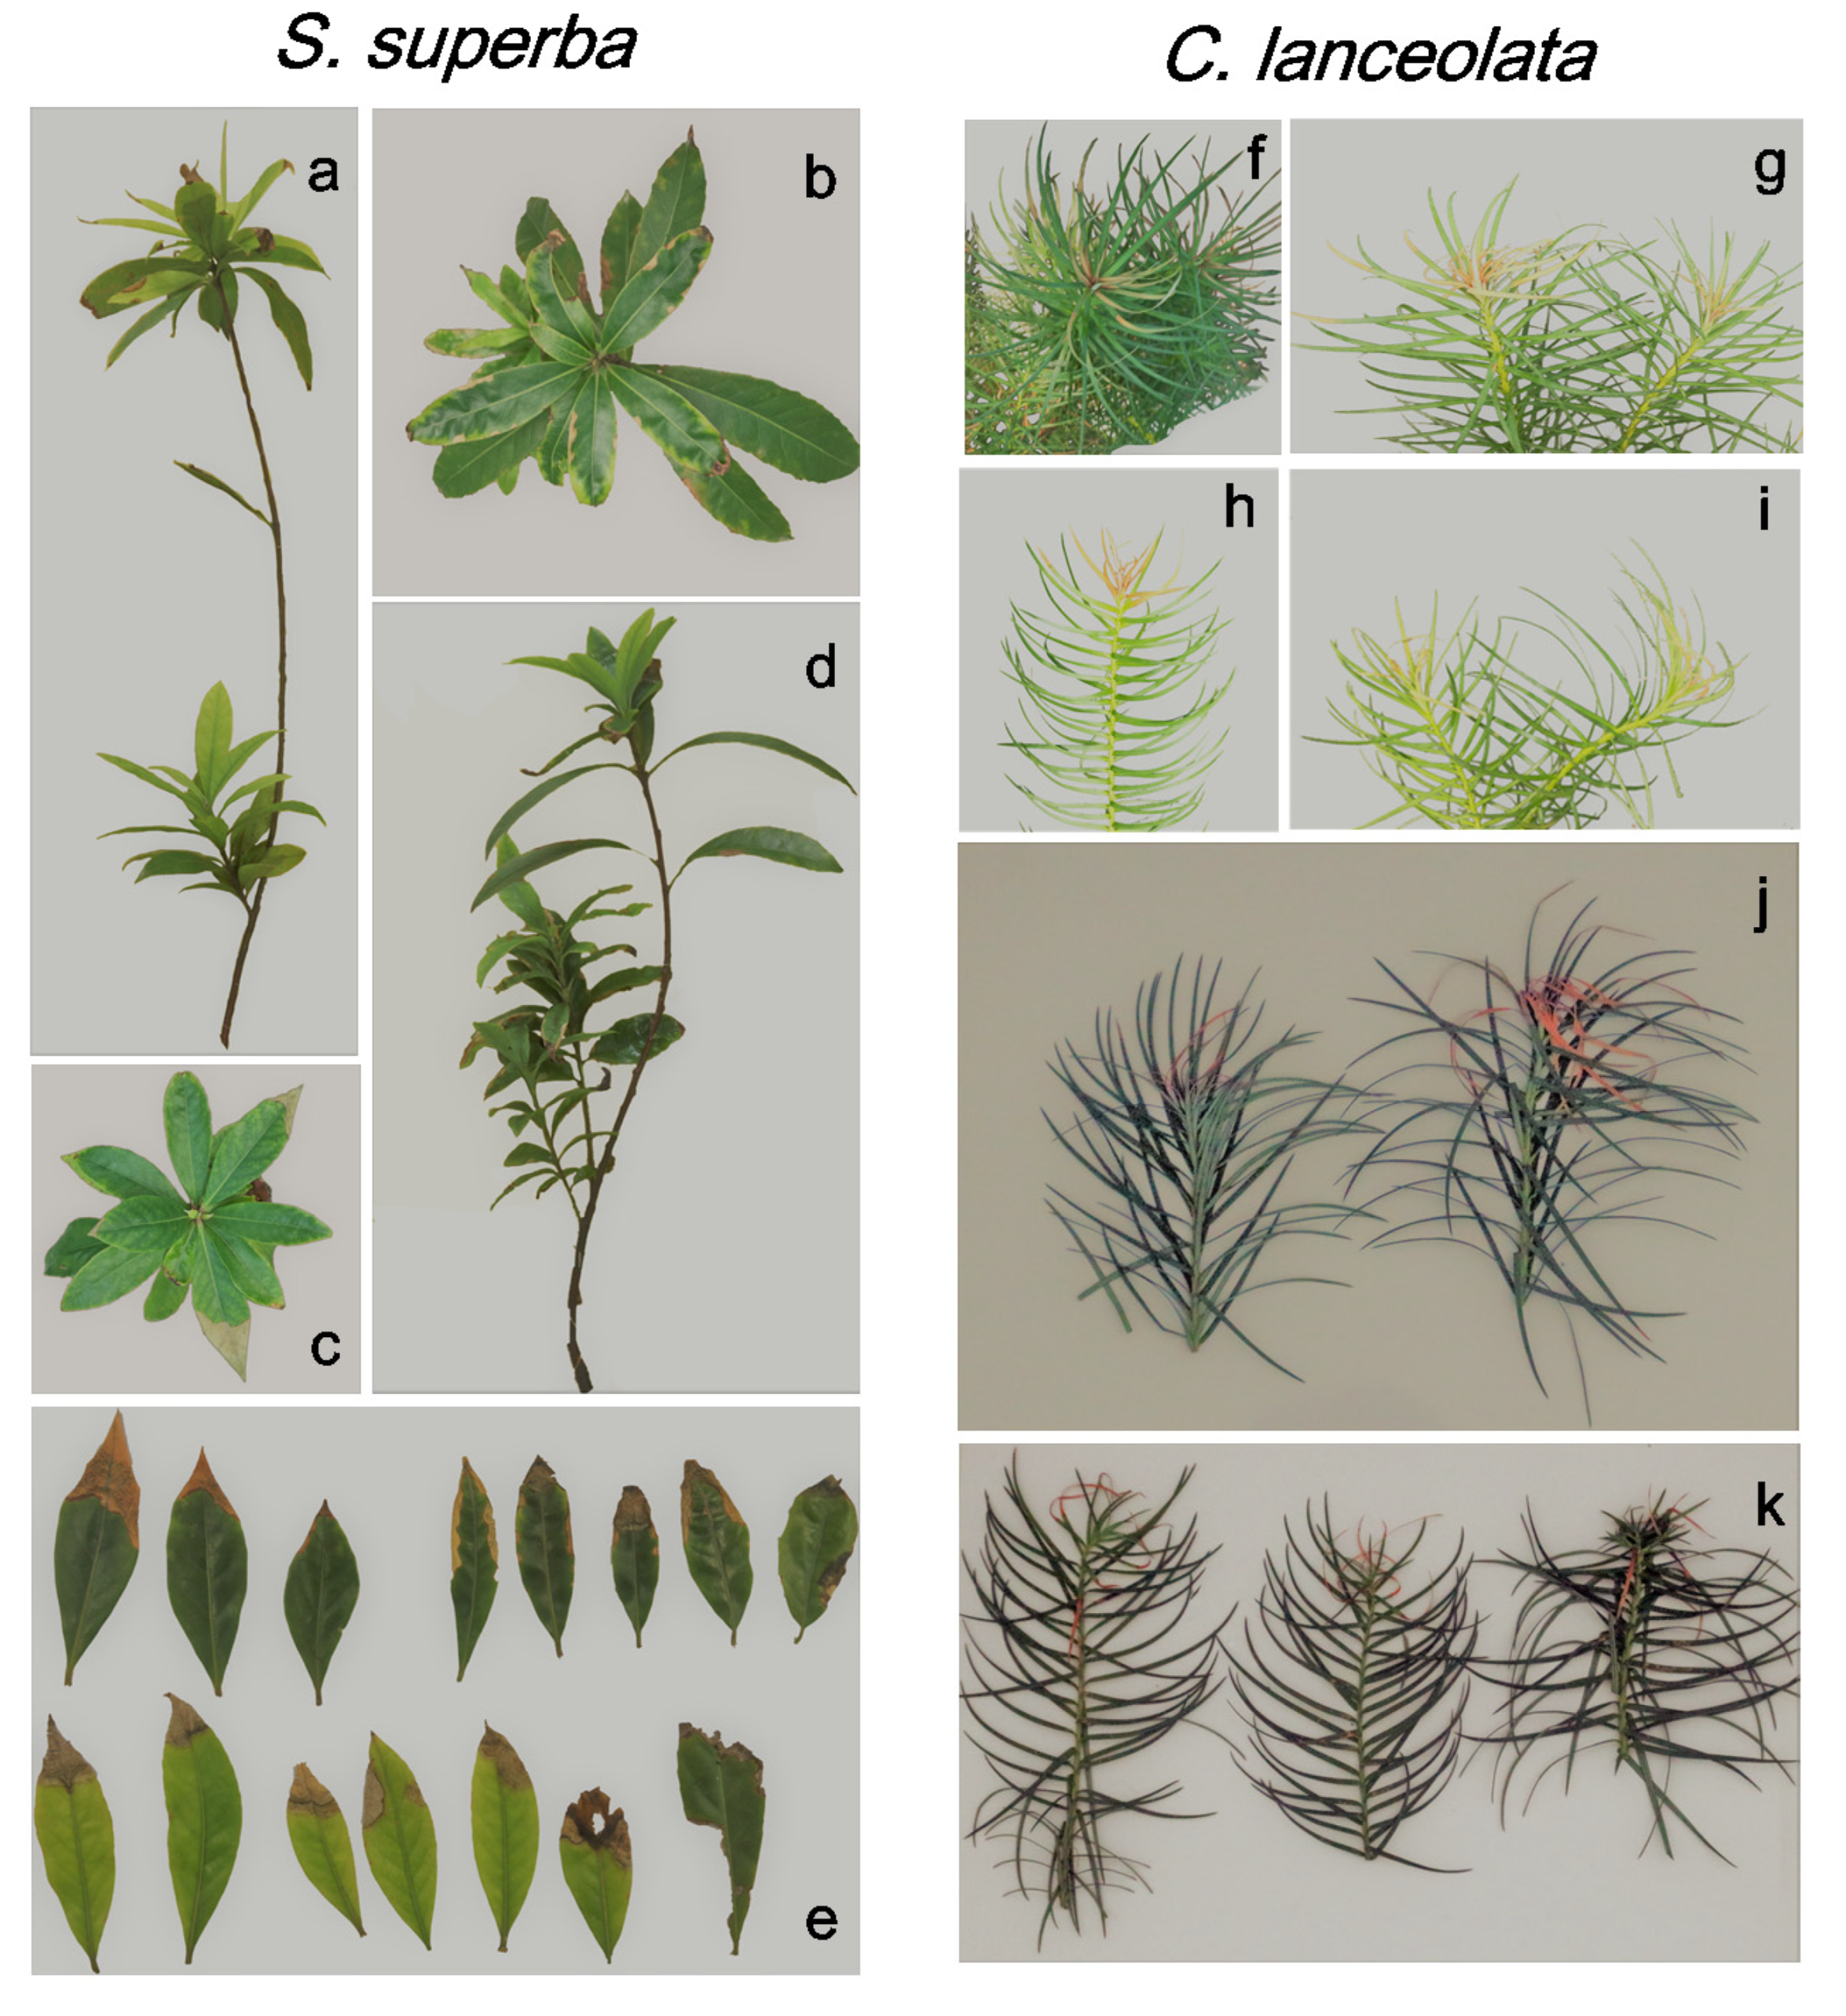
3.4. HW Effects on Plant Appearance

The HW effects on the plant hydraulic and photosynthetic systems gave rise to differences in plant and leaf appearance (Figure 7). The edges of the S. superba leaves were partially withered, reducing the effective photosynthetic leaf area (Figure 7b,c,e). This phenomenon was most apparent in the top leaves of the plants, with 70% of the seedlings showing similar symptoms. Moreover, more than 75% of S. superba individuals sprouted new branches at the soil surface and developed new leaves after the end of the HW (data were estimated by observation) (Figure 7a–d). C. lanceolata leaves also had a withered appearance that first manifested in the distal branches and then gradually occurred on multiple branches (Figure 7f–k). The withered leaves located at the top of the branch did not recover 30 days after the HW.

4. Discussion

Thermal damage and drought stress are widely considered to be the main environmental stresses associated with HWs. These factors both influence plant water transport processes and the photosynthetic system, in turn affecting the plant’s WUE. In this study, we provide direct evidence that HWs will disturb the plant water transport system because of xylem embolism. Although gradual recovery might happen after the HW, immediate HW impacts led to persistent differences in plant leaf C and N contents, biomass and morphology weeks after the end of the event. We also observed distinct differences between the subtropical broad-leaved S. superba and the conifer C. lanceolata, regarding both direct HW stress and recovery processes.

4.1. HWs Caused a Negative Effect on Plant Water Transmission System by Xylem Embolism

The imposed HW led to a reduction in the Kh and an increase in the PLC in the stems, which was especially apparent in C. lanceolata (Figure 3). This indicates xylem embolism, which is a phenomenon that commonly occurs in tree species of arid and semi-arid regions, caused by a combination of soil water stress and high VPD [45,46]. Studies on hydraulic functioning have mostly focused on the drought thus far [46,47], while there is a lack of studies that consider concurrent dry and hot conditions, the combination of which is often observed during HWs. During HW periods, extreme high temperatures also lead to increased evaporative demand from the air. These factors combine to increase water stress in plants, which is manifested as increased xylem tension. Most studies so far indicated that xylem water potential tends to decrease during drought, especially when plants desiccate, which will lead to increasing xylem tension, causing water column rupture whereby external microbubbles can enter the vessel, blocking the transport of water [47,48,49]. Typically, these consequences include a rapid cessation of photosynthetic CO2 assimilation, loss of canopy evaporative cooling through transpiration and greater probability of photodamage over a short time scale [50]. Over longer time scales, low photosynthetic rates associated with drought-induced stomatal closure can lead to depletion of non-structural carbohydrate pools, which interferes with translocation of sugars through the phloem and the production of chemical defense compounds needed to prevent herbivory and disease [23,51]. All this theory hinges on the premise of drought, but when drought is accompanied by high temperature, the impact may be different. On the one hand, besides hydraulic failure causing cessation and low photosynthetic rates, thermal stress also leads to the same results [9]. This double stress can accelerate this depletion of non-structural carbohydrate pools. On the other hand, responses such as reduced transpiration cooling or stomatal closure are less likely to occur in a high temperature environment [52]. This is because thermal stress can be avoided by sustaining high transpiration to latently cool leaves below the air temperature or through biochemical adaptation such as heat-shock protein generation to increase thermal tolerance [52]. Our experiment also detected a significantly higher Tr combined with a high VPD during the HW period (Figure 4), especially at the hottest time of day (Figure 5). Therefore, combined with the low soil water content under HWs (Figure 2), we assumed that the HW-induced xylem embolism in this experiment was primarily caused by the depletion of soil moisture due to the increased consumption of water through plant transpiration and the high VPD associated with high temperatures. Moreover, passive xylem embolism can produce significant morphological damage, as was the case for C. lanceolata in our study, which makes recovery slow [53]. In general, the xylem embolism caused by HW may accelerate drought-only impacts as plants need to find a balance between cooling and water saving, which make xylem embolism more likely to happen during the HW period.
However, many woody plants commonly operate xylem embolism when facing drought stress [48]. Although some plant death is caused by hydraulic failure, many individuals can survive despite a high loss of conductivity [23,54]. Some studies also indicated that under drought conditions, some tree species undergo embolism of large-diameter vessels to keep the small-diameter vessels transporting water normally, thereby reducing water consumption and maintaining water supply to ensure tree survival throughout the dry season [55]. When the drought abates, plants can refill embolised xylem conduits via spontaneous bubble dissolution once xylem pressure nears atmospheric values, or under positive root/stem pressure [56,57]. Trees can also repair the total conducting area following seasonal replacement through regrowth of new xylem [48]. However, the premise is that the loss of xylem hydraulic conductance is not beyond the thresholds, which was considered to be above 60% [55,58,59]. While the xylem embolism observed in the current experiment was below this value, the plants still had a chance of survival after a 5-day long HW. Moreover, this recovery process depends on the degree of damage to the apical and cambial meristematic tissues, the functional status of the remaining hydraulic pathway, the overall health of trees and the plant stocks of water, non-structural carbohydrates and nutrients [46]. In addition, under HW stress, thermal damage can lead to leaf withering (Figure 7), and plants need to repair their photosynthetic apparatus first. Moreover, the significant decrease of leaf C/N of C. lanceolata (Figure 6) also indicated potential deficiency of non-structural carbohydrates, which would all prolong this recovery process when comparing to a single drought stress.

4.2. HWs Decreased WUE Due to the Reduction in the Leaf An or Increase in the Tr

Photosynthesis is a process sensitive to temperature peaks, with both the “light” (electron transport rate) and the “dark” (Calvin cycle) reactions being thermally sensitive, and this is especially true for PSII in the light reaction [60] and Rubisco activase in the dark reaction [61]. This can lead to a variety of potential physiological disorders, including ammonia poisoning, biofilm damage and protein denaturation, eventually leading to plant death [62]. Moreover, because the plant respiration rate is generally higher than the photosynthesis rate under high temperatures, carbon loss exceeds carbon gain [63], which could accelerate the depletion of non-structural carbohydrate pools. In fact, some plants that are unable to sustain high photosynthetic rates during high temperature (>40 °C) may prefer to keep their stomata open (at the expense of WUE) to ensure transpiration cooling to safely pass the HW period. But the premise to satisfy this assumption is that the environment should have sufficient water supply and the water can successfully transport to the leaf tissue [15,53]. In this situation, soil water depletion or xylem embolism causes a reduction in water transport, resulting in less transpiration cooling, with the potential for thermal damage leading directly to negative effects to the photosynthetic system.
In this study, HWs not only decreased the efficiency with which water was transported through the plant but also caused a decrease in WUE on the 5th day of HW due to a reduction in the An and a simultaneous increase in the Tr (Figure 4). However, from the daily dynamics of An, Tr and WUE during the same day, we noticed that the contribution to lowering WUE by a decrease in An and an increase in Tr depended mostly on leaf VPD (Figure 5). Under low VPD conditions, the decrease in An was the main reason for the decrease in WUE (8:00 a.m.), but under high VPD conditions, it was mostly an increased Tr that led to the decrease in WUE (10:00 a.m.). We assume that although no irrigation was supplied during the experiment, the naturally formed dew could help foliage cooling via evaporation in the early morning. Later, during the day, trees need to transpire to lower leaf temperatures [52], which is associated with an increased Tr, as seen in our experiment (Figure 4, 10:00 a.m.). According to the processes described above, 5-day long HW stress caused no permanent foliar damage but temporarily reduced the photosynthetic rate. The dissipated difference in An and WUE between the HW and the control group 7 days after the HW ended supports this assumption (Figure 4), also suggesting recovery from HW stress.

4.3. Differences in the Response of Two Subtropical Tree Species to HWs

We directly derived the degree of xylem embolism from the relative loss of conductivity (PLC) under the HW and found that the broadleaved S. superba had a better embolism resistance and resilience than the coniferous C. lanceolata in a short-term (5 days) single HW (Figure 3). The larger Ks and Kl of S. superba also suggests that a higher water potential inside its vascular bundles and more leaf and less sapwood areas contributing to water transport may benefit water transmission in vascular bundles [32]. In addition, S. superba had a higher root:shoot ratio than C. lanceolata (Table 6), indicating that S. superba was able to absorb relatively more soil water (compared to its total mass), which was beneficial to offset HW stress [47,64,65]. Furthermore, the HW event even enhanced the root:shoot ratio of S. superba, while the opposite effect was observed for C. lanceolata. Moreover, the leaf TN concentration in S. superba did not increase in the recovery period, unlike in the control and both variations of C. lanceolata (Figure 6). Based on these observations, we conclude that harmful HW effects on the water transport system of S. superba were mostly rapid yet short-lived, while longer-lasting (legacy) effects were apparent in C. lanceolata. The differences in leaf morphology may explain why these broadleaved (S. superba) and coniferous tree species (C. lanceolata) responded differently to HWs. The leaves of S. superba were mainly concentrated at the tip of the stem, where their transpiration provides the driving force for stem flow [66]. When the HW occurred, many leaves were damaged by the high temperatures and partly withered at the leaf tips (Figure 7a–e), reducing the effective leaf area and decreasing the water potential in the stem, in turn lowering water transport (Figure 3). The ensuing leaf regeneration combined with the extensive root system [67] led to full recovery and even enhancements in the water transmission capacity [68]. In contrast, the leaves of C. lanceolata were evenly distributed on both sides of the branches (Figure 7f–k), which indicates that the water potential in the xylem gradually increases from the bottom to the tip [69]. Transpiration sustains the hydraulic potential so that the bottom of the xylem is more affected by the number of leaves than the tip area. When plants are unable to access a sufficient water supply, the leaves located at the tip of the branch will wither and die off first, while leaves near the bottom may survive [70]. This gradual withering process actually postpones the time at which HW effects become apparent. A significant variation in C. lanceolata leaf nutrient content was detected only 30 days after HW stress, not immediately after the HW. However, tender shoots and growing points of the C. lanceolata located at the tip of the branch were easily affected by water shortage, and xylem embolism occurred when many old leaves died in the tip area without new leaf growth [71,72]. When the stem is fully embolized and tender shoots die, the branch is unable to continue growing and gradually withers. Large-scale death of C. lanceolata seedlings was observed in forestry production in recent years (pers. comm. with Xiangqing Ma, Fujian Agriculture and Forestry University, Fuzhou, China), which seems to be related to short-term drought.
HWs affected the An and WUE of both S. superba and C. lanceolata similarly (Figure 4), indicating a consistent response of the photosynthetic system to the extreme conditions [9,73]. However, these measurements were mainly performed on the surviving leaves after the HW, and therefore, considering the difference in the quantity of effective photosynthetic organs may be more meaningful. In S. superba, many leaves showed different degrees of withering beyond repair (Figure 7e), which may be related to a higher vulnerability of broadleaved species to high temperatures than needle-leaved species due to the larger, more atmospherically decoupled surface areas of the latter causing faster warm-up under conditions of high radiation [32]. Unlike the more gradual and slow withering of C. lanceolata leaves, the withering of S. superba leaves was more distinct, with some seedlings having no leaves left. The conditions faced during HWs thus appeared more perilous to S. superba, but if the seedlings survived, fast recovery was possible through the potential of this species to grow new branches and leaves. Importantly, these HW impacts on tree seedlings are likely to influence adult trees in terms of their morphology or growth rates. Increased lateral branch generation will cause trees to have fewer straight features, which will affect the quality of the wood and reduce the tree height. On the other hand, a low-growing tree with thicker side branches is considered to be better adjusted to drought and high temperature stress, which would imply that HW impacts at an early stage may lead to better HW resilience later in life [74]. These theories are difficult to verify, in part due to the difficulties in simulating HW events with adult trees, and because this would require a long observation period.

5. Conclusions

HW impacts are usually a combination of high temperature and drought effects [3,13]. In the subtropics, water stress seems to play a pivotal role. If the water supply is insufficient, plants will be unable to maintain their leaf temperature below thermal stress thresholds by transpiration, and the ensuing high temperature stress will directly cause leaves to wither and fall. Although both tree species in our study are common in subtropical areas and therefore would be expected to be adapted to a high temperature environment, the imposed HW still led to significant reductions in tree water transport and water use efficiency, although species-specific differences were apparent. We found that the broadleaved S. superba altered its biomass distribution through expansion of the root system, germination of new branches and leaf renewal. Because it avoided xylem embolism and because fresh leaf growth quickly compensated for the leaves lost during the HW, recovery was rapid for this species. The coniferous C. lanceolata maintained the growth of aboveground biomass but decreased the belowground biomass. This may have led to an imbalance between water demand and supply, especially as xylem embolism further aggravated the supply shortage. As the growing points at the branch tip withered and died first, the entire plant growth was affected, hampering the germination of fresh leaves and thus slowing recovery. Generally, HW effects on S. superba seedlings were short-lived, while significant legacy effects were observed in C. lanceolata. Although these results pertain to young trees due to technical limitations and time constraints, our findings are nevertheless useful in forestry production. Upon transplantation of S. superba and C. lanceolata, supplying shade to leaves will increase survival rates during HWs, as this will directly avoid high radiation doses and concurrent higher leaf temperatures and indirectly lower soil evaporation. Moreover, the maintenance of an appropriate water supply seems crucial for C. lanceolata during long-lasting HWs, and proper trimming of withered seedling branches afterwards might accelerate the regeneration of branches and benefit wood quality.

Author Contributions

Conceptualization, J.C., Y.H. and C.S.; methodology, L.Q., G.D. and J.C.; validation, H.Y., C.S. and H.F.; formal analysis, L.Q.; investigation, W.X., Z.G. and Z.H.; resources, H.F. and Y.H.; data curation, L.Q., W.X., Z.G. and Z.H.; writing—original draft preparation, L.Q.; writing—review and editing, H.J.D.B.; supervision, J.C. and C.S.; project administration, C.S. and Y.H.; funding acquisition, L.Q., C.S. and H.F. All authors have read and agreed to the published version of the manuscript.

Funding

This research was funded by Natural Science Foundation of China (31800512, 31870466), China Postdoctoral Science Foundation (2018M632560), Sub-projects of the national key research and development plan for Phoebe bournei efficient cultivation technology in Fujian province (2016YFD0600603-2), The sixth period forest seedling science and technology project for the research with Schima superba breeding germplasm innovation and core breeding seed orchard high technology in Fujian province (fjzmgg2019-2). And the APC was funded by Natural Science Foundation of China (31800512).

Acknowledgments

We thank the U.S.-China Carbon Consortium (USCCC), and also thank the anonymous reviews for their careful reading of our manuscript and their helpful comments and suggestions.

Conflicts of Interest

The authors declare no conflict of interest.

References

  1. IPCC. 2013: Climate change 2013: The physical science basis. In Contribution of Working Group I to the Fifth Assessment Report of the Intergovernmental Panel on Climate Change; Cambridge University: Cambridge, UK, 2013. [Google Scholar]
  2. Meehl, G.A. More Intense, More Frequent, and Longer Lasting Heat Waves in the 21st Century. Science 2004, 305, 994–997. [Google Scholar] [CrossRef] [Green Version]
  3. De Boeck, H.; Dreesen, F.E.; Janssens, I.A.; Nijs, I. Climatic characteristics of heat waves and their simulation in plant experiments. Glob. Chang. Boil. 2010, 16, 1992–2000. [Google Scholar] [CrossRef]
  4. Sippel, S.; Reichstein, M.; Ma, X.; Mahecha, M.D.; Lange, H.; Flach, M.; Frank, D. Drought, Heat, and the Carbon Cycle: A Review. Curr. Clim. Chang. Rep. 2018, 4, 266–286. [Google Scholar] [CrossRef] [Green Version]
  5. Teskey, R.O.; Wertin, T.; Bauweraerts, I.; Ameye, M.; McGuire, M.A.; Steppe, K. Responses of tree species to heat waves and extreme heat events. Plant Cell Environ. 2014, 38, 1699–1712. [Google Scholar] [CrossRef]
  6. Gutschick, V.P.; BassiriRad, H. Extreme events as shaping physiology, ecology, and evolution of plants: Toward a unified definition and evaluation of their consequences. New Phytol. 2003, 160, 21–42. [Google Scholar] [CrossRef]
  7. Sanz-Lazaro, C. Climate extremes can drive biological assemblages to early successional stages compared to several mild disturbances. Sci. Rep. 2016, 6, 30607. [Google Scholar] [CrossRef]
  8. Bauweraerts, I.; Wertin, T.M.; Ameye, M.; McGuire, M.A.; Teskey, R.O.; Steppe, K. The effect of heat waves, elevated [CO2] and low soil water availability on northern red oak (Quercus rubra L.) seedlings. Glob. Chang. Boil. 2012, 19, 517–528. [Google Scholar] [CrossRef] [PubMed]
  9. Qu, L.; Chen, J.; Dong, G.; Shao, C. Heavy mowing enhances the effects of heat waves on grassland carbon and water fluxes. Sci. Total. Environ. 2018, 627, 561–570. [Google Scholar] [CrossRef] [PubMed]
  10. Wang, P.; Tang, J.; Sun, X.; Wang, S.; Wu, J.; Dong, X.; Fang, J. Heat Waves in China: Definitions, Leading Patterns, and Connections to Large-Scale Atmospheric Circulation and SSTs. J. Geophys. Res. Atmos. 2017, 122, 10,679–10,699. [Google Scholar] [CrossRef]
  11. Reichstein, M.; Bahn, M.; Ciais, P.; Frank, D.; Mahecha, M.D.; Seneviratne, S.I.; Zscheischler, J.; Beer, C.; Buchmann, N.; Frank, D.C.; et al. Climate extremes and the carbon cycle. Nature 2013, 500, 287–295. [Google Scholar] [CrossRef]
  12. Qu, L.; Dong, G.; De Boeck, H.J.; Tian, L.; Chen, J.; Tang, H.; Xin, X.; Chen, J.; Hu, Y.; Shao, C. Joint forcing by heat waves and mowing poses a threat to grassland ecosystems: Evidence from a manipulative experiment. Land Degrad. Dev. 2019. [Google Scholar] [CrossRef]
  13. Qu, L.; Chen, J.; Dong, G.; Jiang, S.; Li, L.; Guo, J.; Shao, C. Heat waves reduce ecosystem carbon sink strength in a Eurasian meadow steppe. Environ. Res. 2016, 144, 39–48. [Google Scholar] [CrossRef] [PubMed]
  14. Wu, X.; Hao, Z.; Hao, F.; Li, C.; Zhang, X. Spatial and Temporal Variations of Compound Droughts and Hot Extremes in China. Atmosphere 2019, 10, 95. [Google Scholar] [CrossRef] [Green Version]
  15. Wu, G.; Liu, H.; Hua, L.; Luo, Q.; Lin, Y.; He, P.; Feng, S.; Liu, J.; Ye, Q. Differential Responses of Stomata and Photosynthesis to Elevated Temperature in Two Co-occurring Subtropical Forest Tree Species. Front. Plant Sci. 2018, 9, 467. [Google Scholar] [CrossRef] [Green Version]
  16. Aspinwall, M.J.; Pfautsch, S.; Tjoelker, M.G.; Vårhammar, A.; Possell, M.; Drake, J.E.; Reich, P.B.; Tissue, D.; Atkin, O.K.; Rymer, P.D.; et al. Range size and growth temperature influence Eucalyptus species responses to an experimental heatwave. Glob. Chang. Boil. 2019, 25, 1665–1684. [Google Scholar] [CrossRef]
  17. O’Sullivan, O.S.; Heskel, M.; Reich, P.B.; Tjoelker, M.G.; Weerasinghe, L.K.; Penillard, A.; Zhu, L.; Egerton, J.J.G.; Bloomfield, K.J.; Creek, D.; et al. Thermal limits of leaf metabolism across biomes. Glob. Chang. Boil. 2016, 23, 209–223. [Google Scholar] [CrossRef] [Green Version]
  18. Yuan, W.; Cai, W.; Chen, Y.; Liu, S.; Dong, W.; Zhang, H.; Yu, G.; Chen, Z.; He, H.; Guo, W.; et al. Severe summer heatwave and drought strongly reduced carbon uptake in Southern China. Sci. Rep. 2016, 6, 18813. [Google Scholar] [CrossRef] [Green Version]
  19. Wright, I.J.; Dong, N.; Maire, V.; Prentice, I.C.; Westoby, M.; Díaz, S.; Gallagher, R.V.; Jacobs, B.F.; Kooyman, R.M.; A Law, E.; et al. Global climatic drivers of leaf size. Science 2017, 357, 917–921. [Google Scholar] [CrossRef] [Green Version]
  20. Duan, H.; Wu, J.; Huang, G.; Zhou, S.; Liu, W.; Liao, Y.; Yang, X.; Xiao, Z.; Fan, H. Individual and interactive effects of drought and heat on leaf physiology of seedlings in an economically important crop. AoB Plants 2016, 9, 1–16. [Google Scholar] [CrossRef] [Green Version]
  21. De Boeck, H.; Bassin, S.; Verlinden, M.; Zeiter, M.; Hiltbrunner, E. Simulated heat waves affected alpine grassland only in combination with drought. New Phytol. 2015, 209, 531–541. [Google Scholar] [CrossRef]
  22. Ruehr, N.K.; Gast, A.; Weber, C.; Daub, B.; Arneth, A. Water availability as dominant control of heat stress responses in two contrasting tree species. Tree Physiol. 2015, 36, 16. [Google Scholar] [CrossRef] [PubMed] [Green Version]
  23. McDowell, N.G.; Pockman, W.; Allen, C.D.; Breshears, D.D.; Cobb, N.; Kolb, T.; Plaut, J.; Sperry, J.; West, A.; Williams, D.G.; et al. Mechanisms of plant survival and mortality during drought: Why do some plants survive while others succumb to drought? New Phytol. 2008, 178, 719–739. [Google Scholar] [CrossRef] [PubMed]
  24. Birami, B.; Gattmann, M.; Heyer, A.G.; Grote, R.; Arneth, A.; Ruehr, N.K. Heat Waves Alter Carbon Allocation and Increase Mortality of Aleppo Pine Under Dry Conditions. Front. For. Glob. Chang. 2018, 1, 8. [Google Scholar] [CrossRef]
  25. Bartlett, M.K.; Klein, T.; Jansen, S.; Choat, B.; Sack, L. The correlations and sequence of plant stomatal, hydraulic, and wilting responses to drought. Proc. Natl. Acad. Sci. USA 2016, 113, 13098–13103. [Google Scholar] [CrossRef] [PubMed] [Green Version]
  26. Trifilò, P.; Nardini, A.; Gullo, M.A.L.; Barbera, P.M.; Savi, T.; Raimondo, F. Diurnal changes in embolism rate in nine dry forest trees: Relationships with species-specific xylem vulnerability, hydraulic strategy and wood traits. Tree Physiol. 2015, 35, 694–705. [Google Scholar] [CrossRef] [PubMed] [Green Version]
  27. Adams, H.D.; Zeppel, M.; Anderegg, W.R.L.; Hartmann, H.; Landhäusser, S.M.; Tissue, D.T.; Huxman, T.E.; Hudson, P.J.; Franz, T.E.; Allen, C.D.; et al. A multi-species synthesis of physiological mechanisms in drought-induced tree mortality. Nat. Ecol. Evol. 2017, 1, 1285–1291. [Google Scholar] [CrossRef]
  28. St-Paul, N.M.; Delzon, S.; Cochard, H. Plant resistance to drought depends on timely stomatal closure. Ecol. Lett. 2017, 20, 1437–1447. [Google Scholar] [CrossRef]
  29. De Dios, V.R.; E LoikiD, M.; Smith, R.A.; Tissue, D. Effects of a Heat Wave on Nocturnal Stomatal Conductance in Eucalyptus camaldulensis. Forests 2018, 9, 319. [Google Scholar] [CrossRef] [Green Version]
  30. Fauset, S.; Freitas, H.C.; Galbraith, D.R.; Sullivan, M.J.P.; Aidar, M.P.M.; Joly, C.A.; Phillips, O.L.; Vieira, S.A.; Gloor, E. Differences in leaf thermoregulation and water use strategies between three co-occurring Atlantic forest tree species. Plant Cell Environ. 2018, 41, 1618–1631. [Google Scholar] [CrossRef] [Green Version]
  31. Gleason, S.M.; Westoby, M.; Jansen, S.; Choat, B.; Hacke, U.; Pratt, R.B.; Bhaskar, R.; Brodribb, T.; Bucci, S.J.; Cao, K.; et al. Weak tradeoff between xylem safety and xylem-specific hydraulic efficiency across the world’s woody plant species. New Phytol. 2015, 209, 123–136. [Google Scholar] [CrossRef] [Green Version]
  32. Guha, A.; Han, J.; Cummings, C.; McLennan, D.; Warren, J. Differential ecophysiological responses and resilience to heat wave events in four co-occurring temperate tree species. Environ. Res. Lett. 2018, 13, 065008. [Google Scholar] [CrossRef]
  33. Ali, A.; Ma, W.; Yang, X.; Sun, B.; Shi, Q.; Xu, M. Biomass and carbon stocks in Schima superba dominated subtropical forests of eastern China. J. For. Sci. 2014, 60, 198–207. [Google Scholar] [CrossRef] [Green Version]
  34. Yang, Y.; Guo, J.; Chen, G.; Xie, J.; Gao, R.; Li, Z.; Jin, Z. Carbon and nitrogen pools in Chinese fir and evergreen broadleaved forests and changes associated with felling and burning in mid-subtropical China. For. Ecol. Manag. 2005, 216, 216–226. [Google Scholar] [CrossRef]
  35. Fang, J.; Chen, A.; Peng, C.; Zhao, S.; Ci, L. Changes in Forest Biomass Carbon Storage in China Between 1949 and 1998. Science 2001, 292, 2320–2322. [Google Scholar] [CrossRef]
  36. Yan, X.-L.; Wang, C.; Ma, X.; Wu, P. Root morphology and seedling growth of three tree species in southern China in response to homogeneous and heterogeneous phosphorus supplies. Trees 2019, 33, 1283–1297. [Google Scholar] [CrossRef]
  37. Zhang, X.-Q.; Kirschbaum, M.U.; Hou, Z.; Guo, Z. Carbon stock changes in successive rotations of Chinese fir (Cunninghamia lanceolata (lamb) hook) plantations. For. Ecol. Manag. 2004, 202, 131–147. [Google Scholar] [CrossRef]
  38. Wang, Q.; Wang, S.-L.; Zhang, J. Assessing the effects of vegetation types on carbon storage fifteen years after reforestation on a Chinese fir site. For. Ecol. Manag. 2009, 258, 1437–1441. [Google Scholar] [CrossRef]
  39. Wang, L.; Zhang, Y.; Berninger, F.; Duan, B. Net primary production of Chinese fir plantation ecosystems and its relationship to climate. Biogeosciences 2014, 11, 5595–5606. [Google Scholar] [CrossRef] [Green Version]
  40. Lian, Y.; Zhang, Q. Conversion of a natural broad-leafed evergreen forest into pure and mixed plantation forests in a subtropical area: Effects on nutrient cycling. Can. J. For. Res. 1998, 28, 1518–1529. [Google Scholar] [CrossRef]
  41. Dai, E.; Zhu, J.; Wang, X.; Xi, W. Multiple ecosystem services of monoculture and mixed plantations: A case study of the Huitong experimental forest of Southern China. Land Use Policy 2018, 79, 717–724. [Google Scholar] [CrossRef]
  42. Bowman, D.; Williamson, G.J.; Keenan, R.; Prior, L.D. A warmer world will reduce tree growth in evergreen broadleaf forests: Evidence from Australian temperate and subtropical eucalypt forests. Glob. Ecol. Biogeogr. 2014, 23, 925–934. [Google Scholar] [CrossRef]
  43. Zhang, X.; Xu, D. Seasonal changes and daily courses of photosynthetic characteristics of 18-year-old Chinese fir shoots in relation to shoot ages and positions within the tree crown. Sci. Silvae Sin. 2000, 36, 19–26. (In Chinese) [Google Scholar]
  44. Liu, B.; Liu, Q.; Daryanto, S.; Guo, S.; Huang, Z.; Wang, Z.; Wang, L.; Ma, X. Responses of Chinese fir and Schima superba seedlings to light gradients: Implications for the restoration of mixed broadleaf-conifer forests from Chinese fir monocultures. For. Ecol. Manag. 2018, 51–57. [Google Scholar] [CrossRef] [Green Version]
  45. Zwieniecki, M.A.; Secchi, F. Threats to xylem hydraulic function of trees under ‘new climate normal’ conditions. Plant, Cell Environ. 2014, 38, 1713–1724. [Google Scholar] [CrossRef] [PubMed] [Green Version]
  46. Choat, B.; Brodribb, T.; Brodersen, C.R.; Duursma, R.; López, R.; Medlyn, B.E. Triggers of tree mortality under drought. Nature 2018, 558, 531–539. [Google Scholar] [CrossRef] [PubMed]
  47. Mitchell, P.; O’Grady, J.G.; Tissue, D.; White, D.A.; Ottenschlaeger, M.L.; Pinkard, E.A. Drought response strategies define the relative contributions of hydraulic dysfunction and carbohydrate depletion during tree mortality. New Phytol. 2012, 197, 862–872. [Google Scholar] [CrossRef]
  48. Klein, T.; Zeppel, M.; Anderegg, W.R.L.; Bloemen, J.; De Kauwe, M.G.; Hudson, P.; Ruehr, N.K.; Powell, T.; Von Arx, G.; Nardini, A. Xylem embolism refilling and resilience against drought-induced mortality in woody plants: Processes and trade-offs. Ecol. Res. 2018, 1–17. [Google Scholar] [CrossRef]
  49. Li, X.; Blackman, C.J.; Choat, B.; Duursma, R.; Rymer, P.D.; Medlyn, B.E.; Tissue, D. Tree hydraulic traits are coordinated and strongly linked to climate-of-origin across a rainfall gradient. Plant, Cell Environ. 2018, 41, 646–660. [Google Scholar] [CrossRef]
  50. Powles, S.B. Photoinhibition of photosynthesis induced by visible light. Annu. Rev. Plant Physiol. 1984, 35, 15–44. [Google Scholar] [CrossRef]
  51. Sevanto, S.; McDowell, N.G.; Dickman, L.T.; Pangle, R.; Pockman, W. How do trees die? A test of the hydraulic failure and carbon starvation hypotheses. Plant Cell Environ. 2013, 37, 153–161. [Google Scholar] [CrossRef]
  52. Drake, J.E.; Tjoelker, M.G.; Varhammar, A.; Medlyn, B.E.; Reich, P.B.; Leigh, A.; Pfautsch, S.; Blackman, C.J.; López, R.; Aspinwall, M.J.; et al. Trees tolerate an extreme heatwave via sustained transpirational cooling and increased leaf thermal tolerance. Glob. Chang. Boil. 2018, 24, 2390–2402. [Google Scholar] [CrossRef]
  53. Ruehr, N.K.; Grote, R.; Mayr, S.; Arneth, A. Beyond the extreme: Recovery of carbon and water relations in woody plants following heat and drought stress. Tree Physiol. 2019, 39, 1285–1299. [Google Scholar] [CrossRef] [PubMed]
  54. Klein, T.; Cohen, S.; Yakir, D. Hydraulic adjustments underlying drought resistance of Pinus halepensis. Tree Physiol. 2011, 31, 637–648. [Google Scholar] [CrossRef] [PubMed] [Green Version]
  55. Brodribb, T.; Bowman, D.J.M.S.; Nichols, S.; Delzon, S.; Burlett, R. Xylem function and growth rate interact to determine recovery rates after exposure to extreme water deficit. New Phytol. 2010, 188, 533–542. [Google Scholar] [CrossRef] [PubMed]
  56. Lovisolo, C.; Perrone, I.; Hartung, W.; Schubert, A. An abscisic acid-related reduced transpiration promotes gradual embolism repair when grapevines are rehydrated after drought. New Phytol. 2008, 180, 642–651. [Google Scholar] [CrossRef]
  57. Nardini, A.; Savi, T.; Trifilò, P.; Gullo, M.A.L. Drought Stress and the Recovery from Xylem Embolism in Woody Plants. In Progress in Botany; Springer Science and Business Media LLC: Cham, Switzerland, 2017; Volume 79, pp. 197–231. [Google Scholar]
  58. Meinzer, F.C.; McCulloh, K.A. Xylem recovery from drought-induced embolism: Where is the hydraulic point of no return? Tree Physiol. 2013, 33, 331–334. [Google Scholar] [CrossRef] [Green Version]
  59. Hammond, W.; Yu, K.; Wilson, L.; Will, R.E.; Anderegg, W.R.L.; Adams, H.D. Dead or dying? Quantifying the point of no return from hydraulic failure in drought-induced tree mortality. New Phytol. 2019, 223, 1834–1843. [Google Scholar] [CrossRef] [Green Version]
  60. Heckathorn, S.A.; Downs, C.A.; Sharkey, T.D.; Coleman, J.S. The Small, Methionine-Rich Chloroplast Heat-Shock Protein Protects Photosystem II Electron Transport during Heat Stress. Plant Physiol. 1998, 116, 439–444. [Google Scholar] [CrossRef] [Green Version]
  61. Crafts-Brandner, S.J.; Salvucci, M.E. Sensitivity of Photosynthesis in a C4 Plant, Maize, to Heat Stress. Plant Physiol. 2002, 129, 1773–1780. [Google Scholar] [CrossRef] [Green Version]
  62. Kuczyńska-Wiśnik, D.; Matuszewska, E.; Laskowska, E. Escherichia coli heat-shock proteins IbpA and IbpB affect biofilm formation by influencing the level of extracellular indole. Microbiology 2009, 156, 148–157. [Google Scholar] [CrossRef] [Green Version]
  63. Crous, K.Y.; Drake, J.E.; Aspinwall, M.J.; Sharwood, R.; Tjoelker, M.G.; Ghannoum, O. Photosynthetic capacity and leaf nitrogen decline along a controlled climate gradient in provenances of two widely distributed Eucalyptus species. Glob. Chang. Boil. 2018, 24, 4626–4644. [Google Scholar] [CrossRef]
  64. Wang, D.; Heckathorn, S.A.; Mainali, K.; Tripathee, R. Timing Effects of Heat-Stress on Plant Ecophysiological Characteristics and Growth. Front. Plant Sci. 2016, 7, 13. [Google Scholar] [CrossRef] [PubMed] [Green Version]
  65. Leigh, A.; Sevanto, S.; Close, J.; Nicotra, A. The influence of leaf size and shape on leaf thermal dynamics: Does theory hold up under natural conditions? Plant Cell Environ. 2017, 40, 237–248. [Google Scholar] [CrossRef] [PubMed]
  66. Zhu, S.-D.; Song, J.-J.; Li, R.-H.; Ye, Q. Plant hydraulics and photosynthesis of 34 woody species from different successional stages of subtropical forests. Plant Cell Environ. 2012, 36, 879–891. [Google Scholar] [CrossRef] [PubMed]
  67. Tyree, M.T.; Velez, V.; Dalling, J.W. Growth dynamics of root and shoot hydraulic conductance in seedlings of five neotropical tree species: Scaling to show possible adaptation to differing light regimes. Oecologia 1998, 114, 293. [Google Scholar] [CrossRef] [PubMed]
  68. Peng, S.L.; Wu, J.; You, W.H. And Recovery of saturated hydraulic conductivity along a forest successional series from abandoned land to mature, evergreen broad-leaved forest in eastern China. Soil Res. 2012, 50, 257. [Google Scholar] [CrossRef]
  69. Li, R.-S.; Yang, Q.-P.; Zhang, W.; Zheng, W.-H.; Chi, Y.; Xu, M.; Fang, Y.; Gessler, A.; Li, M.-H.; Wang, S.-L. Thinning effect on photosynthesis depends on needle ages in a Chinese fir (Cunninghamia lanceolata) plantation. Sci. Total. Environ. 2017, 580, 900–906. [Google Scholar] [CrossRef]
  70. Yang, Q.; Zhang, W.; Li, R.; Xu, M.; Wang, S. Different responses of non-structural carbohydrates in above-ground tissues/organs and root to extreme drought and re-watering in Chinese fir (Cunninghamia lanceolata) saplings. Trees 2016, 30, 1863–1871. [Google Scholar] [CrossRef]
  71. Yang, F.; Feng, Z.; Wang, H.; Dai, X.; Fu, X. Deep soil water extraction helps to drought avoidance but shallow soil water uptake during dry season controls the inter-annual variation in tree growth in four subtropical plantations. Agric. For. Meteorol. 2017, v, 106–114. [Google Scholar] [CrossRef]
  72. Blackman, C.J.; Brodribb, T.; Jordan, G.J. Leaf hydraulics and drought stress: Response, recovery and survivorship in four woody temperate plant species. Plant, Cell Environ. 2009, 32, 1584–1595. [Google Scholar] [CrossRef]
  73. Dong, T.; Li, J.; Zhang, Y.; Korpelainen, H.; Ülo, N. Partial shading of lateral branches affects growth, and foliage nitrogen- and water-use efficiencies in the conifer Cunninghamia lanceolata growing in a warm monsoon climate. Tree Physiol. 2015, 35, 632–643. [Google Scholar] [CrossRef] [PubMed]
  74. Kumarathunge, D.P.; Medlyn, B.E.; Drake, J.E.; Tjoelker, M.G.; Aspinwall, M.J.; Battaglia, M.; Cano, F.J.; Carter, K.R.; Cavaleri, M.A.; Cernusak, L.A.; et al. Acclimation and adaptation components of the temperature dependence of plant photosynthesis at the global scale. New Phytol. 2019, 222, 768–784. [Google Scholar] [CrossRef] [PubMed] [Green Version]
Figure 1. Illustration of the basic structure of the open top chamber (OTC), internal structure and sensors of heat wave simulation devices.
Forests 11 00513 g001
Figure 2. The major microclimatic variables before, during and after the 5-day heat wave period. Control: C, Heat Wave: HW. Ta, air temperature (a), Ts, soil temperature (b), SWC, soil water content (c). B1–B5, days before the heat wave, H1–H5, days during the heat wave, A1–A5, days after the heat wave. The bar chart to the right indicates the change in environmental conditions during the heat wave (5 day means), and the p-values are the result of paired T-tests
Forests 11 00513 g002
Figure 3. Heat wave effects on plant hydraulic characteristics, including hydraulic conductivity (Kh, a), max hydraulic conductivity (Kmax, b), percentage loss of conductivity (PLC, c), specific conductivity (Ks, d), leaf specific conductivity (Kl, e) and Huber value (Hv, f) of Schima superba (white bar) and Cunninghamia lanceolata (grey bar). Mean ± SD. Control: C, Heat Wave: HW. p-values are the result of independent T-tests, Level of significance are * p < 0.05; ** p < 0.01 and ns, non-significant.
Forests 11 00513 g003
Figure 4. Heat wave effects on plant leaf temperature (Tleaf), leaf vapor pressure deficit (VPD), stomatal conductance (gs), net photosynthesis rate (An), transpiration rate (Tr) and water use efficiency (WUE) of Schima superba (af) and Cunninghamia lanceolata (gl) during the whole experiment in the morning (8:00 a.m.). B1: one day before the start of the heat wave treatment; H3, H5: 3, 5 days into the heat wave treatment; A3, A5, A7: 3, 5, 7 days after heat wave treatment. Mean ± SE. Control: C, Heat Wave: H. Stars above the spots are the results of independent T-tests between the heat wave and control treatment during the same day. Levels of significance are * p < 0.05; ** p < 0.01; *** p < 0.001 and ns, non-significant.
Forests 11 00513 g004
Figure 5. Heat wave effects on the daily dynamics of leaf temperature (Tleaf), leaf vapor pressure deficit (VPD), stomatal conductance (gs), net photosynthesis rate (An), transpiration rate (Tr) and water use efficiency (WUE) of Schima superba (af) and Cunninghamia lanceolata (gl) during the 5th day of the heat wave from 8:00 am.to 16:00 pm. Mean ± SE. Control: C, Heat Wave: HW. Stars above the spots are the results of independent T-tests between the heat wave and control treatment during the same time. Level of significance are * p < 0.05; ** p < 0.01; *** p < 0.001 and ns, non-significant.
Forests 11 00513 g005
Figure 6. Heat wave effects on plant leaf total nitrogen content (TN), total carbon content (TC) and C/N ratio of Schima superba (ac) and Cunninghamia lanceolata (df). Mean ± SE. A1:1 day after the heat wave, A30: 30 days after the heat wave. p-values above the spots are the results of independent T-tests between the heat wave and control treatment during the same day. Level of significance are * p < 0.05 and ns, non-significant.
Forests 11 00513 g006
Figure 7. Visual symptoms of heat wave induced damage on plant leaves and morphological variation of Schima superba (ae) and Cunninghamia lanceolata (fk) 30 days after the end of the heat wave treatment.
Forests 11 00513 g007
Table 1. Time series on measuring of stem hydraulic conductivity, leaf gas exchange, biomass, leaf C/N content and plant appearance during the whole experiment. The experiment was divided into three periods: “pre HW” (B1–B5), “HW” (H1–H5) and “post HW” (A1–A30).
Pre Heat WaveHeat Wave Stage (5 Days)Post Heat Wave (30 Days)
1st Day
(B1)
3rd Day
(H3)
5th Day
(H5)
1st Day
(A1)
3rd Day
(A3)
5th Day
(A5)
7th Day
(A7)
30th Day
(A30)
Stem hydraulic conductivity
Leaf gas exchange
Biomass
Leaf C/N content
Plant appearance
Table 2. Outcome of the multivariate ANOVA analysis (p-values given) on the effects of heat wave (HW), species (S) and their interactions on hydraulic characteristics (hydraulic conductivity (Kh), max hydraulic conductivity (Kmax), percentage loss of conductivity (PLC), specific conductivity (Ks), leaf specific conductivity (Kl) and Huber value (HV)) and biomass (leaf, stem, aboveground, underground, total and root/shoot) after heat wave effect. p-values of <0.05 are indicated in bold.
FactorsHydraulic CharacteristicsBiomass
KhKmaxPLCKsKlHvLeafStemAbovegroundUndergroundTotalRoot/Shoot
HW0.0030.0080.0030.0070.0020.7260.3810.9510.5590.4700.7170.740
S0.6280.3070.0830.0010.0050.320<0.001<0.001<0.001<0.001<0.0010.020
HW × S0.3590.4230.1670.6870.8730.7370.5150.4470.8660.0130.6500.432
Table 3. Outcome of the repeated ANOVA (p-values given) for responses of daily hourly leaf temperature (Tleaf), leaf vapor pressure deficit (VPD), stomatal conductance (gs), net photosynthesis rate (An), transpiration rate (Tr) and water use efficiency (WUE) to heat waves (HW), species (S), day (D) and their interactions. p-values of <0.05 are indicated in bold, with df the degrees of freedom.
FactorsdfTleafVPDgsAnTrWUE
D5<0.001<0.001<0.001<0.0010.001<0.001
D × HW5<0.001<0.0010.455<0.0010.421<0.001
D × S50.3060.0390.244<0.0010.341<0.001
D × HW × S50.3050.9980.3240.7350.2180.607
HW1<0.001<0.0010.5010.0040.012<0.001
S10.3100.5260.183<0.0010.2340.005
HW × S10.2050.6540.8080.1860.0080.451
Table 4. Outcome of the repeated ANOVA (p-values given) for responses of hourly leaf temperature (Tleaf), leaf vapor pressure deficit (VPD), stomatal conductance (gs), net photosynthesis rate (An), transpiration rate (Tr) and water use efficiency (WUE) to heat waves (HW), species (S), time (T) and their interactions. p-values of <0.05 are indicated in bold, with df the degrees of freedom.
FactorsdfTleafVPDgsAnTrWUE
T4<0.001<0.001<0.001<0.001<0.001<0.001
T × HW40.094<0.001<0.0010.003<0.001<0.001
T × S40.0810.0040.0270.6160.3880.775
T × HW × S40.0570.0060.2690.0720.0080.253
HW1<0.001<0.0010.5790.001<0.001<0.001
S10.8650.7290.3780.8640.0970.193
HW × S10.0060.0020.0620.0760.2600.079
Table 5. Outcome of the repeated ANOVA (p-values indicated) for responses of leaf total nitrogen content (TN), total carbon content (TC) and C/N ratio to heat waves (HW), species (S), day (D) and their interactions. p-values of <0.05 are indicated in bold, with df the degrees of freedom.
FactorsLeaf Nutrient
dfTNTCC/N
D1<0.0010.001<0.001
D × HW10.8310.9570.231
D × S10.0160.7390.194
D × HW × S10.0010.2430.010
HW10.0340.1210.052
S10.0080.0140.004
HW × S10.0970.9060.303
Table 6. Heat wave effects on final plant leaf biomass, stem biomass, aboveground biomass, underground biomass, total biomass and root:shoot ratio (Root/shoot) of Schima superba and Cunninghamia lanceolata at 30 days after the heat wave. Mean ± SD. p-values are the result of independent T-tests, with values <0.05 indicated in bold.
Schima superbaCunninghamia lanceolata
ControlHeat Wavep-ValueControlHeat Wavep-Value
Leaf (g)1.64 ± 0.312.45 ± 0.940.18624.47 ± 1.9529.77 ± 3.250.484
Stem (g)1.75 ± 0.893.05 ± 1.340.15815.85 ± 3.2614.33 ± 6.180.678
Aboveground (g)3.39 ± 1.065.50 ± 1.730.08340.32 ± 4.8644.10 ± 8.840.711
Underground (g)2.41 ± 1.314.97 ± 2.090.08320.17 ± 2.2815.86 ± 3.270.074
Total (g)5.80 ± 2.3210.46 ± 0.500.00860.49 ± 6.4359.96 ± 9.320.964
Root/shoot0.71 ± 0.040.90 ± 0.030.2060.50 ± 0.050.36 ± 0.030.203

