1. Introduction
Compared with other materials, wood shows many unique properties. Above all, it is characterized by a good ratio of mechanical strength to density. Its properties depend on genetic background and species-specific characteristics; moreover, they are shaped by modified gene expression influenced by tree growth conditions (external conditions). In addition, wood of growing trees is living matter, and adapts its properties to the changing mechanical and physiological conditions of the tree trunk during its formation [
1]. Both internal and external factors significantly influence wood structure [
2]. The multitude of factors contributing to the changes in the structure of wood endows this material with a very wide range of properties, unprecedented among other construction materials. However, if used for purposes for which its characteristics do not meet the criteria for a given application, wood may be considered as a non-ideal material. One of the features of wood that determines its technological properties is its density. It is also the parameter that is most frequently measured because it determines the physical and mechanical properties as well as technological quality of wood. The higher the density, the higher the strength, hardness, and stiffness. However, an increase in the density of the wood contributes to an increase in its lateral moisture deformations [
3,
4].
The wood of fast-growing trees is often characterized by wide annuals rings and too low density to be used in structures exposed to high loads or flooring materials. For this reason, for many years, attempts have been made to increase the density of wood by compressing it transversely to the fibers direction, which leads to an improvement in mechanical properties [
5,
6,
7,
8,
9,
10,
11,
12,
13,
14]. Densification should not be confused with the compression parallel to the fibers direction (pleating), because this process does not increase significantly the density of wood; however, the wood becomes easily and highly pliable [
15]. Wood densification is one of the promising techniques for expanding the use of such wood species [
16,
17,
18]. The first attempts of the densification of wood were carried out in the beginning of the 20th century. At that time, the first patents on mechanical densification of wood tissue appeared [
19,
20]. These ideas were, however, imperfect. Densified wood was characterized by improved mechanical properties (not always greater than the increase in wood density Perkitny and Jablonski [
21]), but showed a significant tendency to return to its previous shape after deformation, associated with the so-called "memory effect" [
22,
23,
24,
25], also known as rebound resilience. Rebound resilience, which is the main problem of densified wood, is currently the subject of many studies carried out at various scientific centers. According to Kutnar and Šernek [
20], between 1930 and 1960, the first attempts were made to stabilize the dimensions of mechanically densified wood by heat treatment and chemical modification, among others [
7]. Minimization of return deformation of densified wood was obtained by gluing together thin veneers impregnated with an aqueous solution of phenol-formaldehyde prepolymer. Such a product was named by its inventors Stamm and Seborg [
26] as “Impreg”. A similar material called "Compreg" was created by pressing a stack of veneers impregnated with adhesive resin at 150 °C. This material was characterized by high density (1460 kg × m
−3) and low swelling in water (<4%) [
27]. It should be noted that densified wood has been produced in Germany since the early 1930s and sold under the trade name “Lignostone”, and the laminated compressed wood is produced under the trade name “Lignofol” [
17]. The information on the current commercial use of modified wood and the associated environmental impact can be found in the work of Sandberg et al. [
28].
In 2018, the work of Song et al. [
29] appeared, whose innovation consisted in densification of wood previously subjected to partial delignification by a boiling aqueous solution of a mixture of NaOH and Na
2SO
3 and rinsing this mixture with boiling deionized water. Wood modified in this way had very good mechanical properties, even exceeding the parameters of some metals and their alloys. High values of strength parameters of the obtained material and its high resistance to punctures are explained by the authors, apart from densification of the tissue, also by the increased ordering and compression of cellulose nanofibers, which contributes to the creation of new hydrogen bonds. The reduction in the content of the components forming the matrix inlaying the cellulose structure results in a significant reduction in elastic recovery. In lignocellulosic materials, hemicellulose is responsible for shape stabilization, while lignin plays a major role in the mechanism of quasi elastic recovery (shape memory effect).
The presented research aims to produce densified wood after earlier partial delignification of cell walls. The intention of the work is also to determine the impact of hardwood species (poplar, birch) on the possibility of delignification of cell walls using NaOH and Na
2SO
3. Further, it aims to confirm whether the delignification process can contribute (reducing the lignin and hemicellulose components) to increasing the density and improving the hardness of densified material. The Brinell hardness of densified wood was determined in the tangential direction. It is possible that, owing to this innovative approach, low density wood species will be used in structures exposed to heavy loads and floor materials, where they have not been used so far and, together with the results of previous studies [
19,
20,
21,
22,
23,
24,
25,
26,
27,
28,
29], provides a set of results useful for further modelling purposes.
2. Materials and Methods
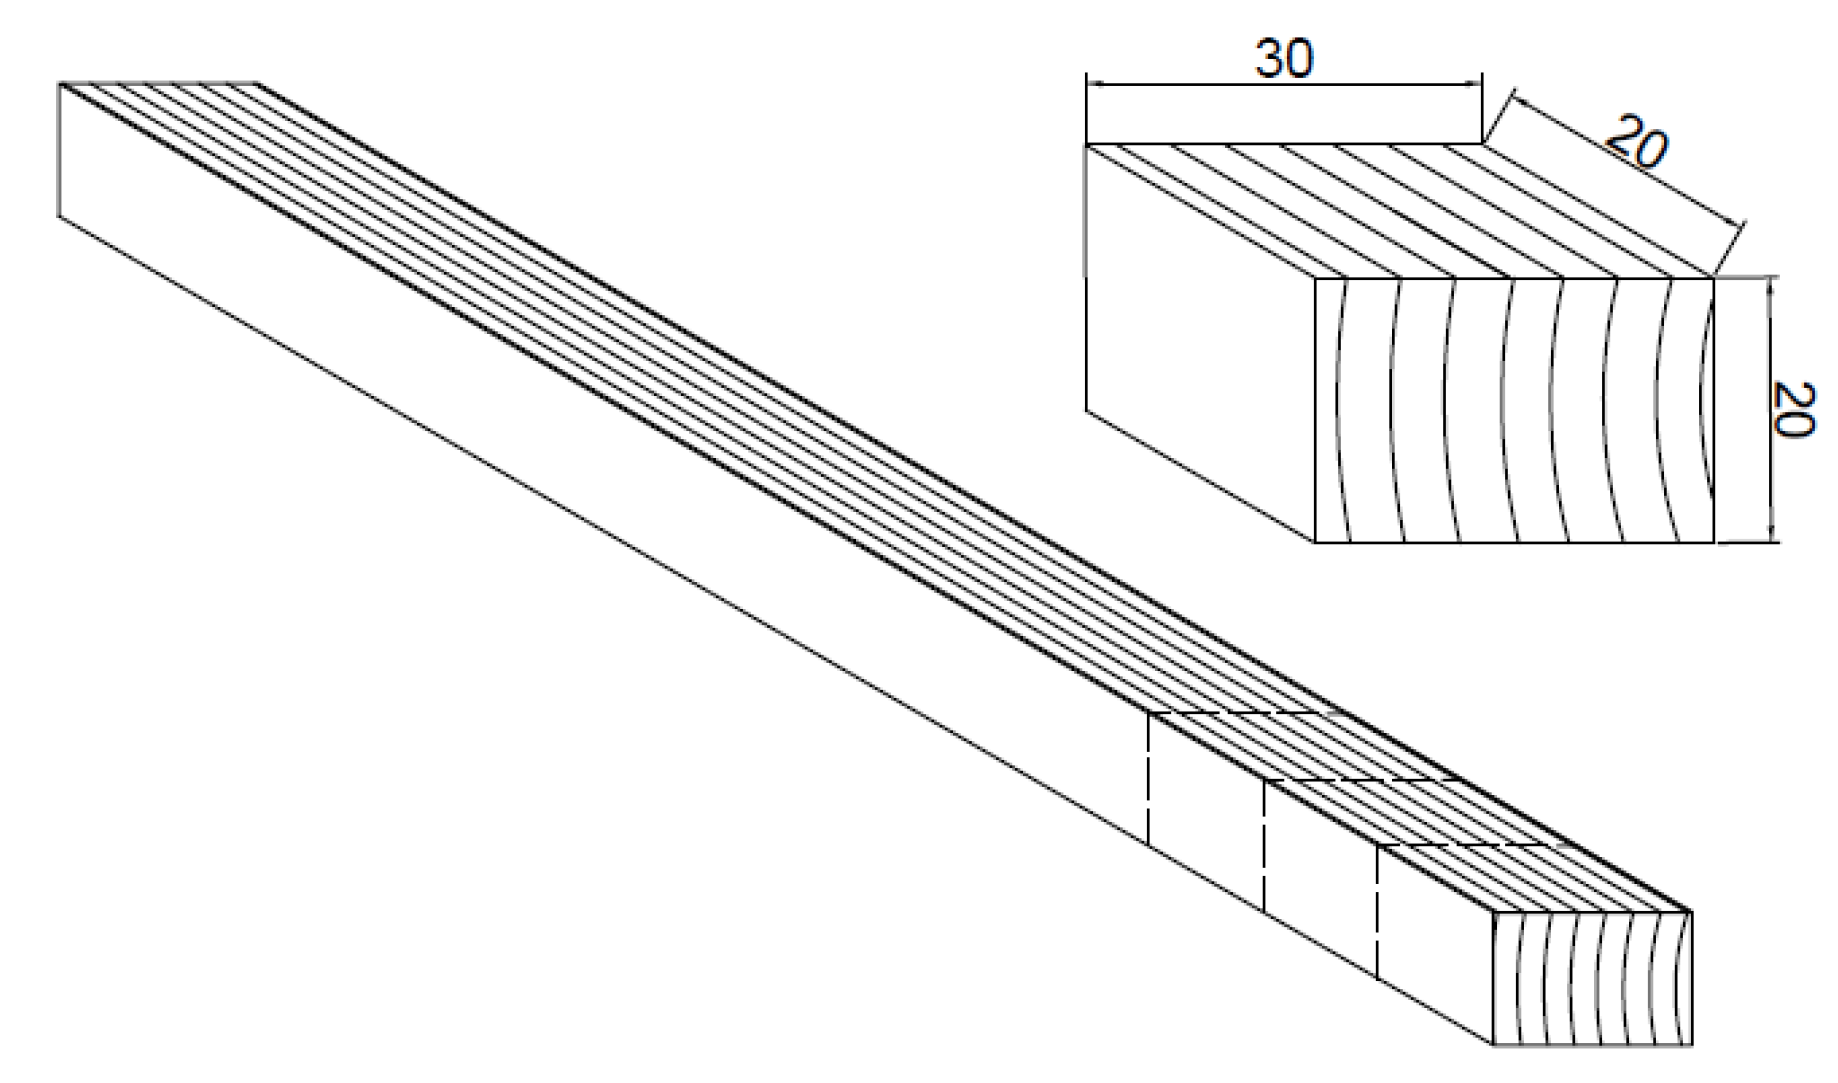
The research was carried out on samples of poplar (
Populus alba L.) and birch (
Betula pendula Roth.) wood obtained from strips cut from 60 mm thick logs, stored under a roofing for three years. From these strips, 30 samples were obtained, cut one after another, with dimensions of 20 (T) mm, 30 (R) mm, and 20 (L) mm. The sample obtaining scheme is shown in
Figure 1. The selection of these wood species was based on the following considerations:
- -
poplar and birch wood differ significantly in density;
- -
the lignin of these wood species consists of syringyl (S) and/or guaiacyl (G) structures connected by a series of ether and carbon–carbon bonds. The S/G ratio of deciduous trees is greater [
30,
31,
32]. The higher content of the more reactive lignin (S) (easier to remove) [
33,
34] in deciduous wood was thus the reason for choosing such wood for our study.
In order to characterize the experimental material, the width of annual rings was measured on the cross sections of the wood samples at an accuracy of 0.1 mm. Their density was determined according to the method recommended by ISO 13061-2: 2014 [
35]. The mass of each sample was measured on an analytical balance (Sartorius GmbH, Germany) (±0.001 g accuracy). The dimensions were measured using a digital caliper with an accuracy of ±0.01 mm. Wood moisture content (MC) was also determined by gravimetric method according to the ISO 13061-1 (2014) [
36] standard.
The chemical composition of the wood was modified in accordance with the procedure described in Song et al. [
29]. It consisted in heating the samples in a boiling aqueous solution of 2.5 M NaOH and 0.4 M Na
2SO
3 for seven hours. The heated samples were placed in special steel baskets to prevent them from floating to the surface. The baskets, together with the samples, were placed in 2-liter round-bottomed flasks. The flasks, containing 1 L of the solution and the samples, were connected to a reflux condenser and placed in a sand bath to bring the solution to the boil. The boiling point of the solution was 110 °C. After that time, the samples were washed several times with deionized water at a temperature of about 20 °C, until the water stopped coloring in response to phenolphthalein addition.
Cellulose contents were determined by the Seifert’s method according to PN - 92/5009 standard [
37], and two tests were carried out for each material tested. A portion of approximately 1 g of sawdust (obtained from the control samples and delignified) of known moisture content was placed in a 50 cm
3 conical flask. A mixture consisting of 6 cm
3 acetylacetone, 2 cm
3 dioxane, and 1.5 cm
3 concentrated hydrochloric acid was added to the flask with the sawdust. Then, the flask, after connecting to the reflux condenser, was placed in a water bath. The process of heating was carried out for 30 minutes. After that time, the sample was diluted in 30–40 cm
3 of methyl alcohol and transferred to the previously weighed G-3 foam crucible. The substance on the crucible was washed with 100 cm
3 of methyl alcohol, 40 cm
3 of dioxane, and 400 cm
3 of hot water. Then, it was washed with 40 cm
3 of dioxane and 40 cm
3 of ethyl alcohol. The cellulose obtained in this way was drained with a vacuum pump and dried to constant weight at 105 °C. Then, it was weighed on a laboratory balance to the accuracy of 0.0001 g. The cellulose content was calculated from the following formula:
where:
a is the cellulose mass after drying (g),
m is the mass of the sample taken for cellulose determination (g), and
s is the dry matter content of the tested raw material (%).
The lignin content was determined by the TAPPI [
38] method and two tests were carried out for each material tested. A portion of about 1 g of air-dry sawdust (obtained from control samples and subjected to delignification) was placed in a small beaker and then flooded with 15 cm
3 of 72% sulfuric acid solution. The beaker and its contents were left for two hours in laboratory conditions for preliminary hydrolysis. After two hours, the beaker contents were transferred to a conical flask, and 575 cm
3 of distilled water was added, which caused the dilution of acid to 3%. Then, the contents of the flask were boiled for four hours over a gas burner and under a reflux condenser. When the heating was complete, the flask and its contents were left until the next day. Then, the solution was filtered through the previously weighed foam crucible G-4, connected to a water vacuum pump. The contents of the crucible were dried to a constant mass at 105 °C, and then the mass was determined on a laboratory balance at an accuracy of 0.0001 g. The lignin content was calculated from the following formula:
where
b is the lignin mass after drying (g),
m is the mass of the sample taken for lignin determination (g), and
s is the dry matter content of the tested raw material (%).
The holocellulose content was determined with the use of sodium chlorite, according to PN -92/5009 [
37] standard, and two tests were carried out for each material tested. Approximately 1.5 g of chips of the test material of known moisture content was placed in a conical flask. Then, 50 cm
3 of distilled water at 75–80 °C, 1.5 g of sodium chlorite (NaClO
2), and 10 drops of glacial acetic acid were added to the flask. The flask and its contents were placed in a water bath at a temperature of 75–80 °C for 60 min, and the flask was shaken carefully every 15 min. After that time, 1.5 g of sodium chlorite and 10 drops of glacial acetic acid were added and heated for another 60 min. After the end of heating, the flask and its contents were cooled to 10 °C in an ice bath. The contents of the flask were then transferred to the previously weighed G-2 foam crucible connected to a vacuum water pump. Then, 400 cm
3 of distilled water and 50–60 cm
3 of acetone were filtered through the crucibles. The crucibles with their contents dried to constant mass were weighed on a laboratory balance at an accuracy of 0.0001g. The holocellulose content was calculated from the following formula:
where:
m1 is the mass of dried holocellulose (g),
m is the mass of extracted material (g),
s is the dry matter content in the extracted sample (%), and E is the extract content in the raw material (%). When determining changes in cellulose, hemicelluloses, and lignin content after chemical treatment, specific contents of these compounds were referred to the original mass of the samples, that is, not subjected to chemical treatment.
The samples to be densified (10 birch and poplar samples each after chemical treatment and 3 control samples from each species tested), with moisture content above the fiber’s saturation point, were first plasticized in boiling water for 1 h. Then, after being placed in special steel clamps (
Figure 2), they were pressed tangentially on a Zwick ZO50TH (Zwick/Roell, Ulm, Germany) strength testing machine.
The maximum deformation that the samples could withstand without cracking (delamination at the limit of annual increments) was 15 mm for poplar (75% size reduction) and 12 mm for birch wood samples (60% size reduction in the tangential direction). After pressing the samples, the clamps were clamped by tightening the screws to prevent elastic recovery. The samples clamped in this way were left in the laboratory to dry. In this way, seven samples were obtained from poplar and birch wood, which were densified after previous chemical treatment, as well as three control samples, which were only plasticized in boiling water. Upon drying of the samples in the clamps, shrinkage in the direction of compression was observed.
Hardness determinations were carried out after air-conditioning of the samples at T = 20 °C and relative humidity (RH) = ~65%, which allowed us to achieve equilibrium moisture content (MC) of the control wood, at MC = 6%–9%, which allowed us to check how the wood parameters change under normal environmental conditions. The hardness of the tested materials in the tangential direction was determined using the Brinell method [
39]. A steel ball with a diameter of 10 mm was pressed into the surface of the samples with a force of 1000 N for densified samples and 500 N for control samples. The maximum and minimum diameter of the residual indentation was measured with a Brinell magnifier to the accuracy of 0.1 mm. The hardness was calculated from the following formula:
where:
F is the force acting on the ball (N),
D is the diameter of the pressed ball (mm), and
d is the average residual indentation (mm).
3. Results and Discussion
The width of annual rings in the studied samples of birch wood ranged from 4.2 to 6.8 mm (average 5.5 mm), while in the samples of poplar wood, it ranged from 1.9 to 4.7 mm (average 3.7 mm). As the samples from both species of wood were made from one strip, the wood density of the same wood type samples was very similar (
Table 1), and the values are within the range given in the literature [
40].
The average contents of basic chemical components of birch and poplar wood before and after the chemical treatment are shown in
Table 2, they are consistent with the literature data [
41]. It should be mentioned that the greatest lignin content and the greatest loss of this component, after the chemical treatment, was noted for poplar wood. Initially (in the control wood), the lignin content was 25.2%, and after the chemical treatment, this value decreased to 16.6%, which means that its loss was just over 34%. In birch wood, lignin was less degraded: from 21.6% of its content in the control wood, after the chemical treatment, its content decreased to 17.2%, which gave a loss of 20.4%.
Boiling the samples in an aqueous solution of NaOH and Na2SO3 brought the greatest reduction in the content of hemicelluloses. Their content in the birch wood samples, after seven hours of boiling in the above solution, decreased from 35% to 12.3%, that is, by as much as 64.9%. A slightly smaller loss of this component was observed for poplar wood samples, in which the content of hemicelluloses decreased from 26.7% to 11.2%, so by 58%.
The component of wood most resistant to the solution was cellulose. In birch control wood, the share of this component was 40.3%, and after chemical treatment, it decreased to 36.4%. In poplar wood, the cellulose initial content was 48% of all substances, and after chemical treatment, it slightly decreased to 41.5% (13.5% loss).
The results of determination of wood density at equilibrium moisture content corresponding to the air parameters in the laboratory are presented in
Table 3. This table also includes, whenever possible, the calculated basic statistical parameters. The density value was determined at the MC ranging from 6.3% to 8.2%. The data in this table indicate that the density values determined for the studied samples, within their respective groups, were characterized by very small variation of about 2%.
The lowest density (about 420 kg × m
−3) was obtained for poplar wood samples, and after their densification, without chemical pre-treatment, their density increased on average to 1042 kg × m
−3. The samples of densified poplar wood after chemical treatment showed a higher density (1133 to 1207 kg × m
−3), on average, 1181 kg × m
−3. The average density value of birch wood was about 657 kg × m
−3, and after the densification of birch wood samples, this value increased to about 1160 kg × m
−3 for non-chemically treated samples, and to about 1240 kg × m
−3 after previous partial delignification. The density values of the tested wood samples after their densification are comparable to the density of guaiac wood (
Guaiacum officinale L.). A similar increase in birch wood density, in the range of 885–1185 kg × m
−3, was observed by Pařil et al. [
42]. An increase in wood density after densification was presented by Lesar et al. [
43]. The densification of poplar wood caused an increase in density to 1150 kg × m
−3. The average density value after densification was about 1300 kg × m
−3 in Song et al. [
29]. The density of poplar samples densified with and without heat modification was increased by 102% and 174% on average, respectively [
44].
The density of control wood and density of the same species after its densification, at very close moisture content, permitted evaluation of the degree of densification expressed as a percentage ratio of the wood density before and after the process. From the two studied wood species, poplar wood was more densified (without chemical pre-treatment: 238% and after treatment: 281%). For birch wood, the density levels were 176% and 188%, respectively. The obtained density levels of the studied wood are reflected in the reduction of its porosity (
Table 4).
The wood porosity (Φ), before and after densification, was calculated from the following formula:
where
is the density of wood (g × cm
−3) and 1.5 is the approximate wood substance density (g × cm
−3).
The porosity reduction (
Rp) was calculated from the following formula:
where Φ
cw is the porosity of control wood and Φ
dw is the porosity of densified wood
From the data contained in
Table 4, it can be concluded that a higher degree of densification of poplar wood compared with birch wood results from differences in the porosity of the compared wood types, and thus a greater reduction of pores in poplar wood, mainly vessels. Mainly vessels were affected by the compression, and their pore volumes decreased significantly [
45]. In addition, both species differ in the content of vessels in the wood. Poplar is characterized by a greater share of these cells. Another reason for differences in the degree of densification is the thickness of the cell walls in the fibers. Poplars are characterized by very thin-walled, birch medium wall thickness. Thus, the partial loss of chemical compounds from the cell wall, mainly hemicellulose and lignin, increases the degree of densification, which is manifested as a reduction in its porosity [
46]. The results of hardness measurement of the tested wood samples in the tangential direction are presented in
Table 5. The hardness was determined at the samples’ moisture content ranging from 6.3% to 8.2%.
The presented data indicate that the hardness of the tested materials is in the range from 16 MPa for poplar wood to 147 MPa for densified birch, after reduction of cell wall components. Such a wide range of hardness is owing to the large variation in the density of the studied wood materials. The upper limit of this range is significantly higher than the hardness of native species, which, for oak and ash wood, is about 64 MPa, and for beech or hornbeam wood, is about 70 MPa [
40]. Thus, the hardness of densified wood is about twice as high as that of the species considered to be the hardest of domestic species, and equals the values for guaiac wood whose hardness ranges from 85 to 145 MPa. Blomberg et al. [
10] densified Scots pine, Norway spruce, silver birch (
Betula pendula Roth), black alder (
Alnus glutinosa (L.) Gaertn.), European aspen (
Populus tremula L.), European beech (
Fagus sylvatica L.), English oak (
Quercus robur L.), and European ash
(Fraxinus excelsior L.). The highest hardness increase was found for spruce with a 293% increase, and the lowest for oak with a 154% increase in relation to initial value. A significant change in hardness due to densification has also been reported for different densification processes [
47,
48,
49].
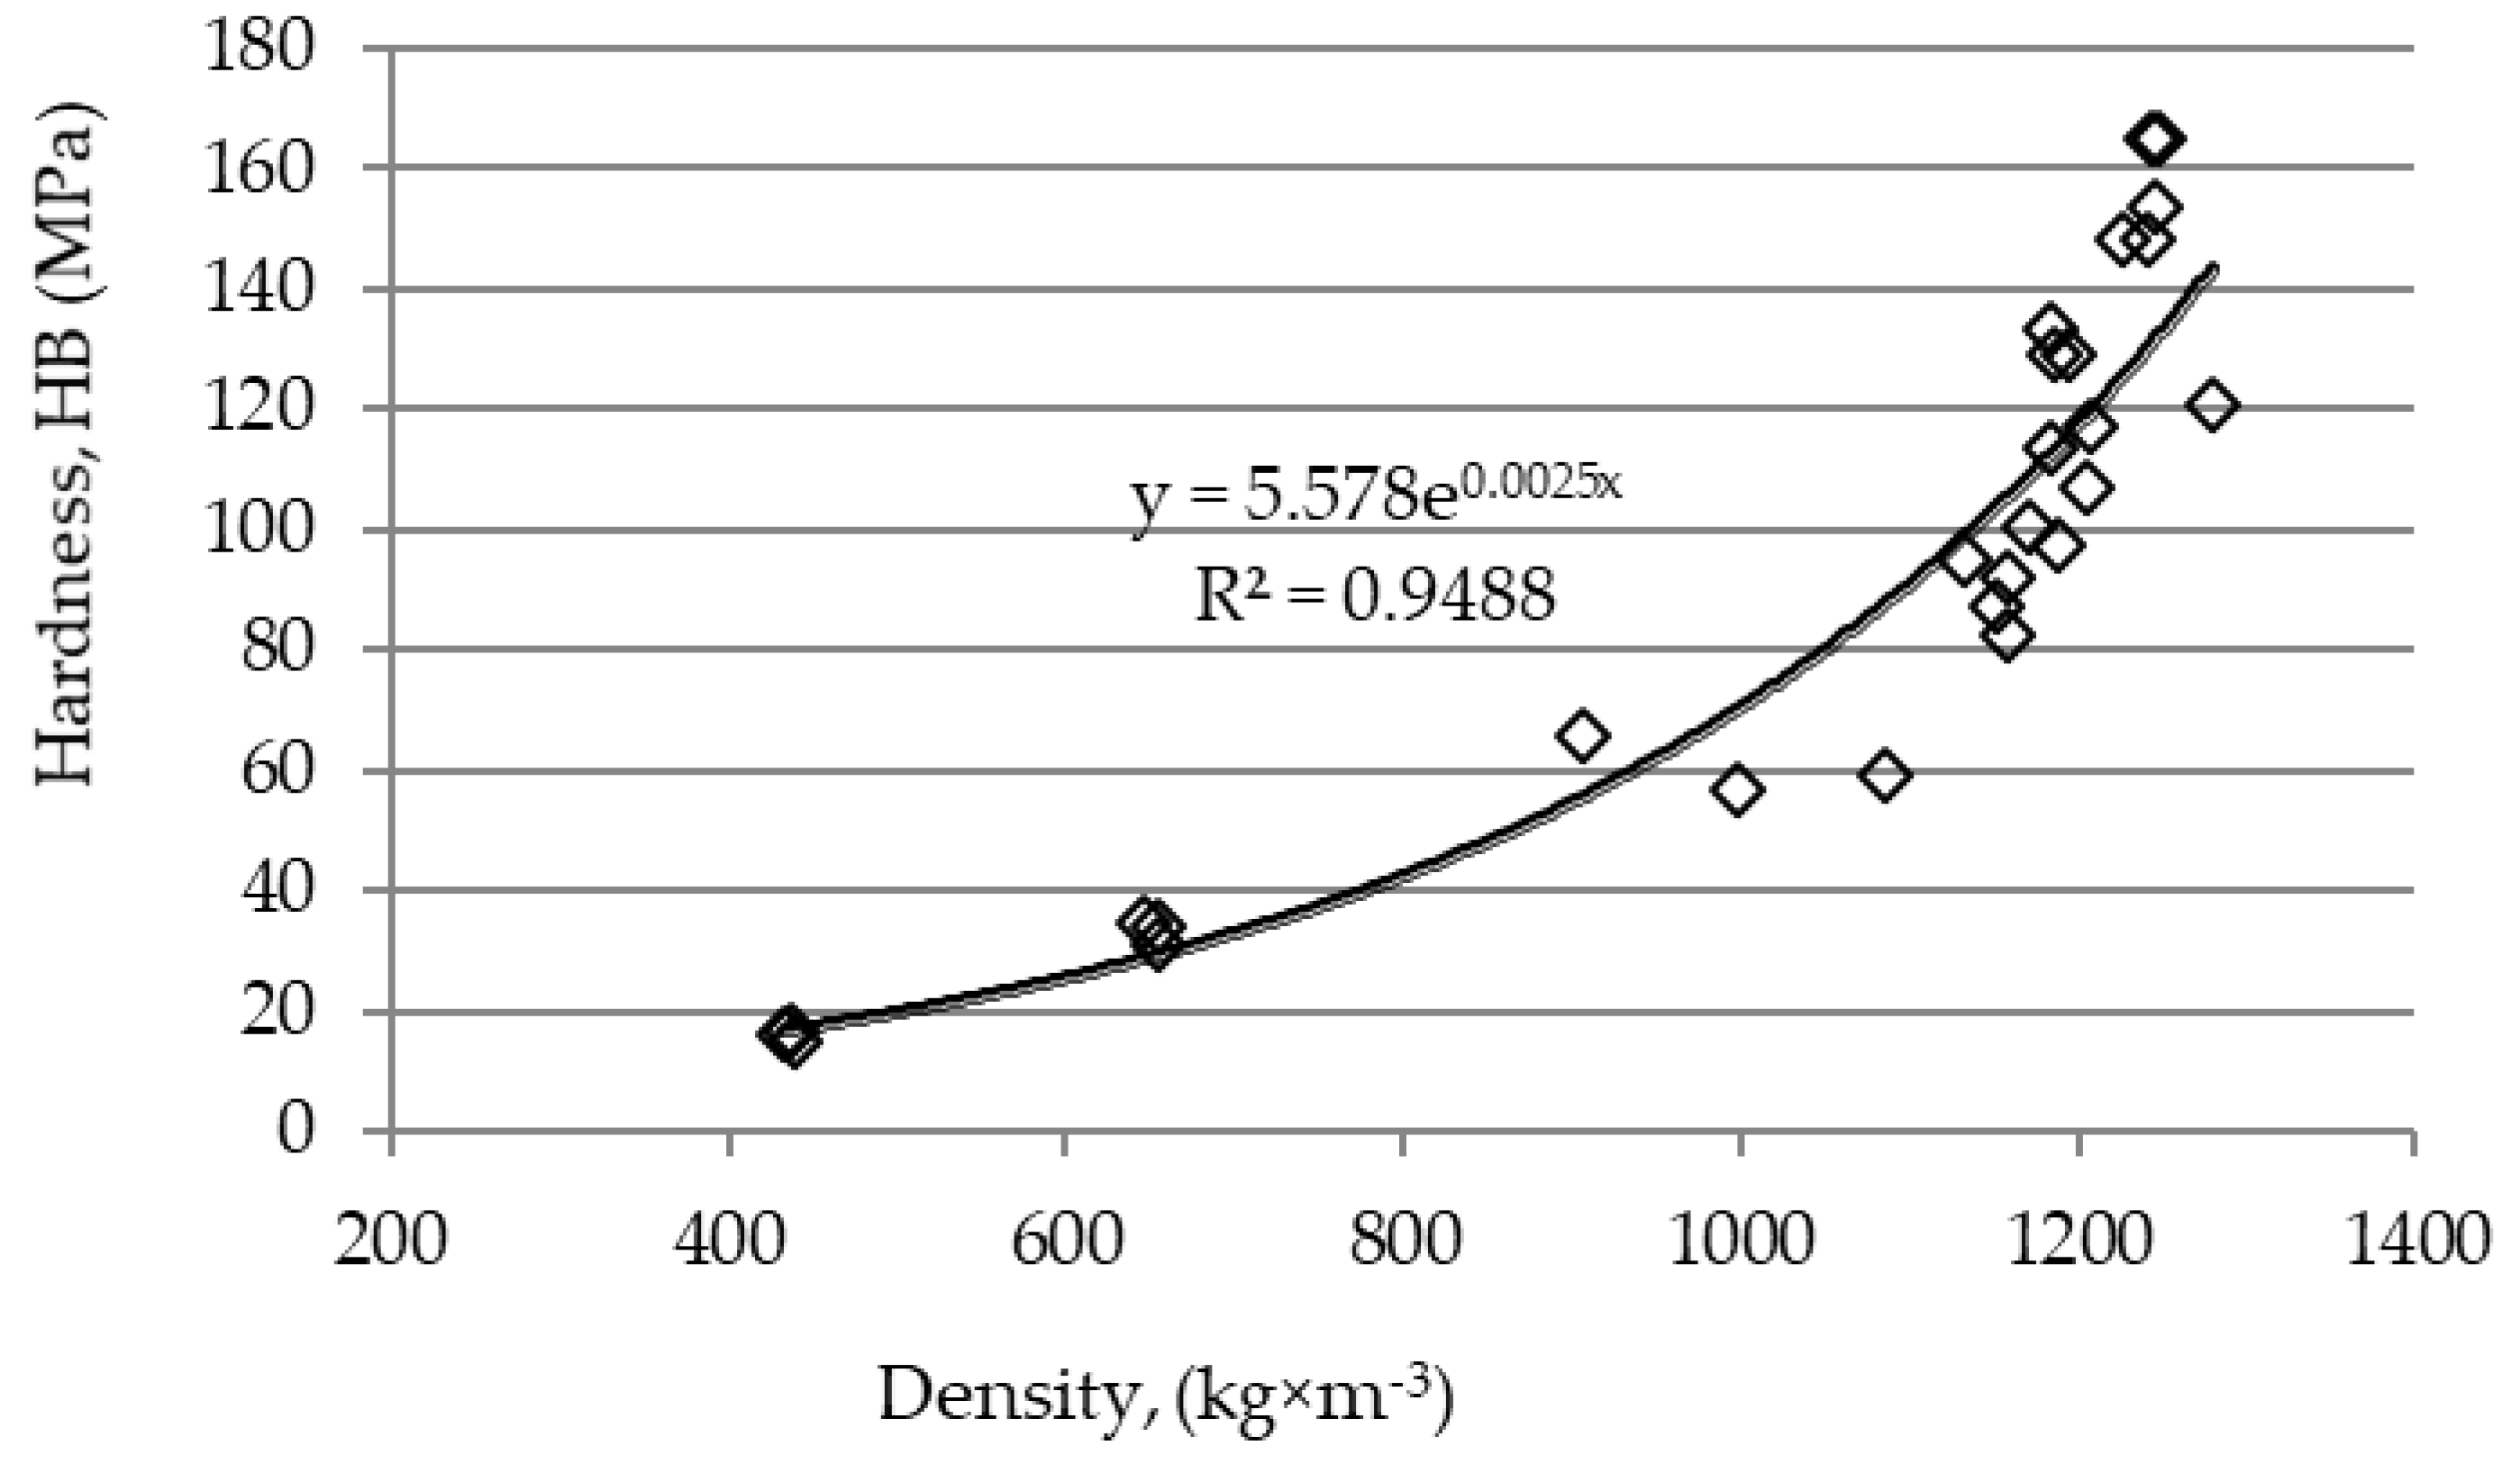
The relationship between the density of the tested materials and their hardness (HB) is shown in
Figure 3. In the literature, the most commonly accepted function describing the above relation is the power function (H =
), with the exponent n ranging from 1.1 to 2.25 [
50]. The experimental data obtained in this study are approximated slightly better by the exponential function, hence it was used to describe the presented dependence.
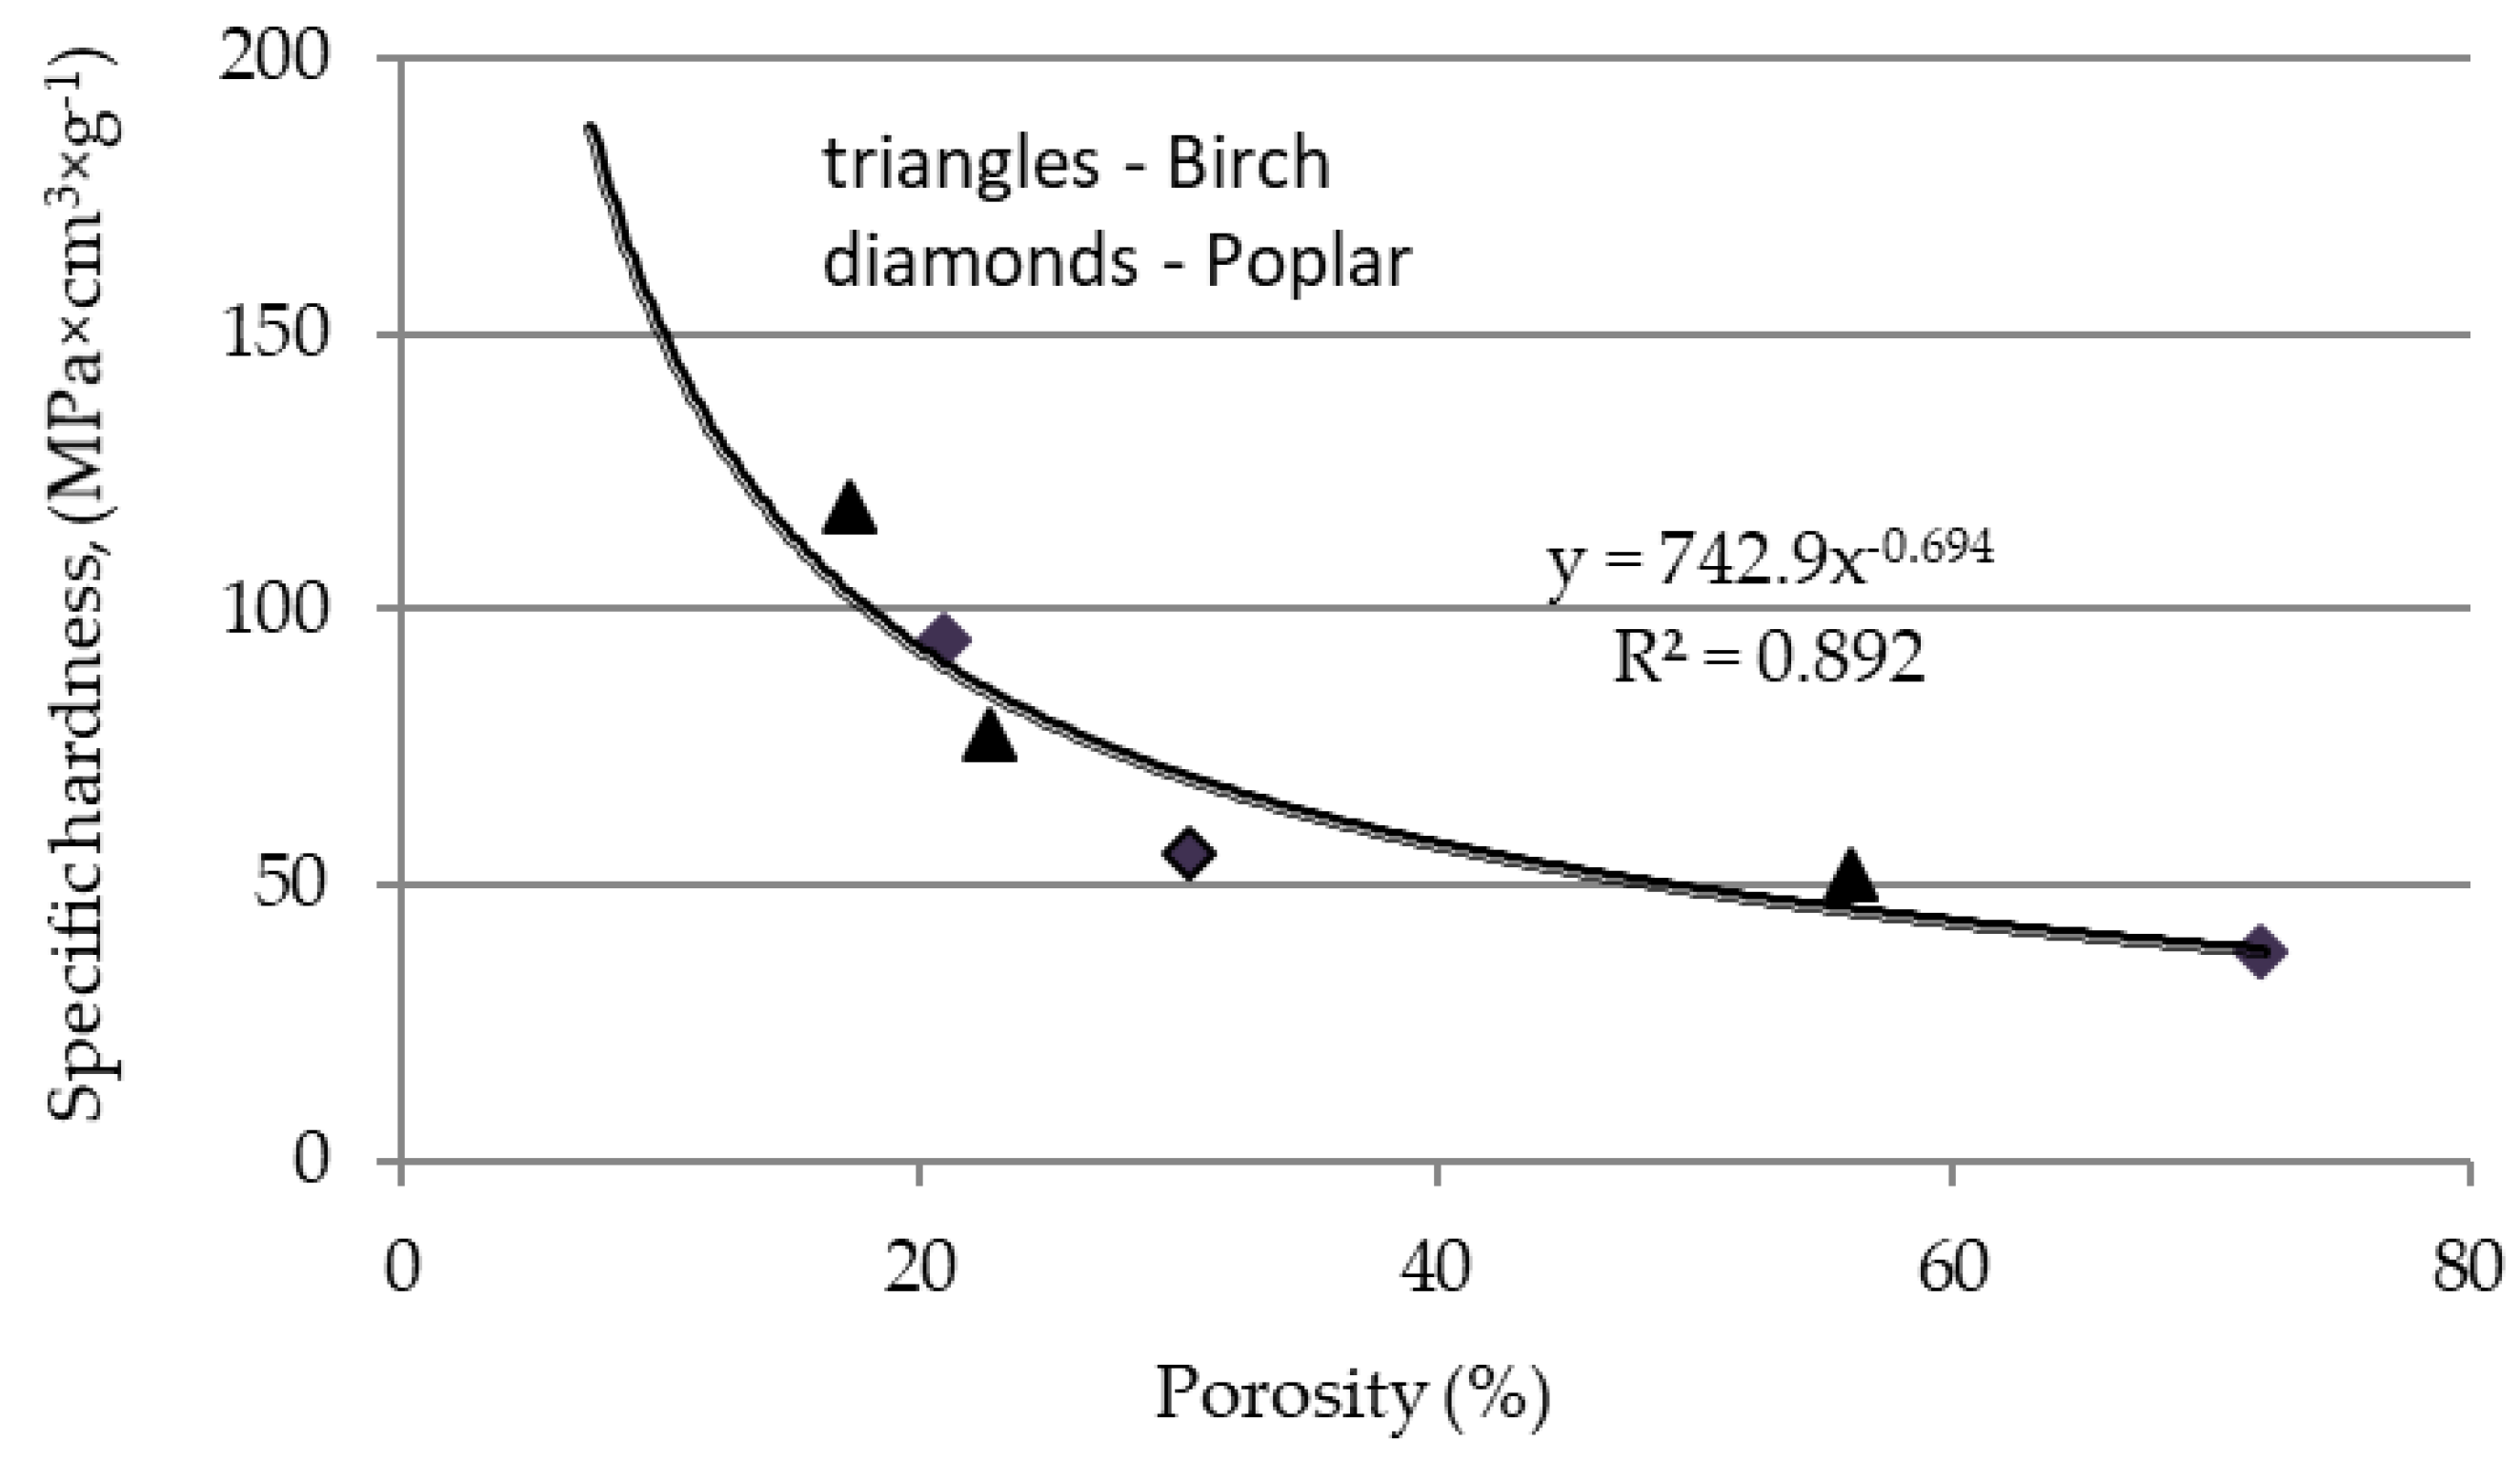
The power function, on the other hand, describes well the relationship between the specific hardness, understood as the ratio of the hardness and density of the studied wood, as a function of its porosity. The above relation plotted for the mean values of our experimental results is presented in
Figure 4. According to this relation, as the porosity of the tested materials decreases, the deformation of the cell walls, when the indenter is pressed, has a smaller impact on hardness. In the densified wood, the pore lumens get narrower, and even the dimensions of the micropores in the walls are reduced [
20,
29]. As a result of wood densification, the folded cell walls support one another at several sites, which contributes to the increased wood rigidity when pressed across the fibers. Thus, in hardness tests of densified wood, the effect of cell wall deformation under the indenter is increasingly limited as the porosity decreases. In such a case, upon total reduction of the intracellular space, the hardness value must be determined by the hardness of the cell walls.
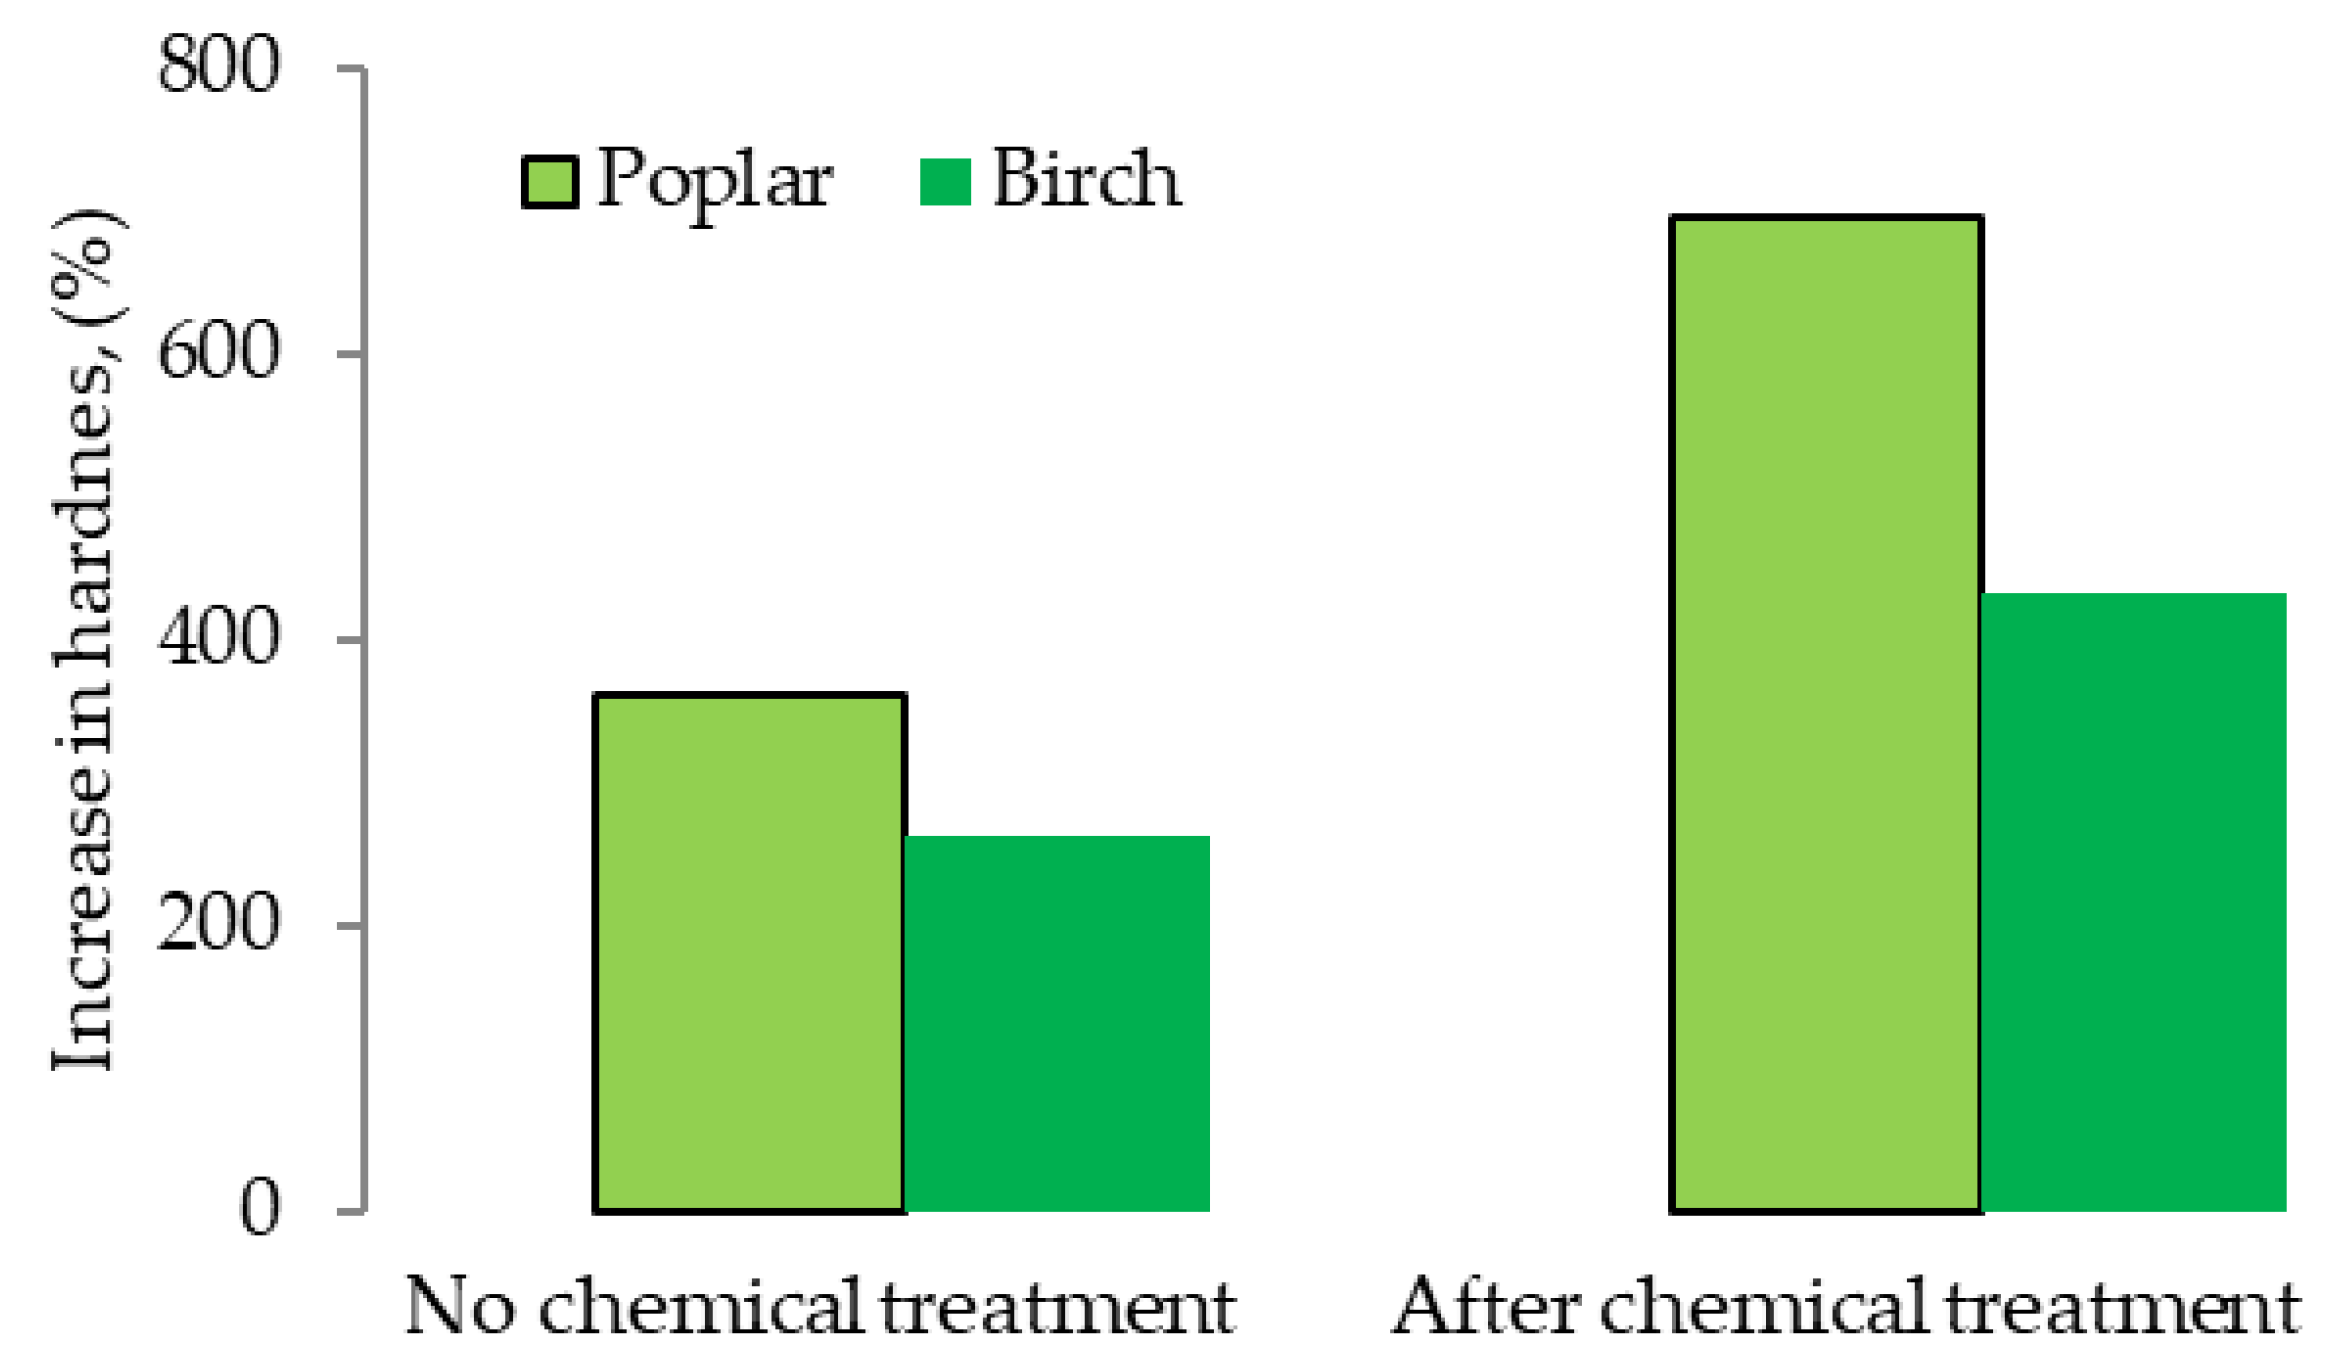
As a result of the process of wood densification without modification of its chemical composition, its hardness, determined in the tangential direction at MC of 6%–8%, increased by 3.6 times for poplar wood and by 2.6 times for birch wood. On the other hand, the hardness of densified wood after previous modification of its chemical composition increased further, by as much as 6.9 times for poplar wood, and by over 4.3 times for birch wood. The above values of increase in wood hardness, expressed as a percentage of the hardness of the control wood, are shown in
Figure 5.
The greater increase in the hardness of poplar densified wood after the earlier chemical treatment was the result of the higher density of this wood achieved in the compression process in the tangential direction. For this species, as can be seen from the data in
Table 3, the density of densified wood after previous chemical treatment was higher than that of densified wood without chemical pre-treatment.
4. Conclusions
The above presented and discussed results of our experiments have led to the following conclusions.
1. Partial reduction of the compounds forming the cell wall has brought about the following modifications. In birch wood, the lignin content decreased by 20%, while that of cellulose decreased by 9.7%, and that of hemicellulose decreased by 64.9%. In poplar, the lignin content decreased by 34.1%, that of cellulose decreased by 13.5%, and that of hemicellulose decreased by 58.0%.
2. The densification, or the increase in the degree of density of birch and poplar samples, was 188% and 281%, respectively; for comparison, the density of the samples without chemical modification was 176% and 238%, respectively.
3. The hardness (HB) of densified wood without modification of its chemical composition, determined in the tangential direction at a moisture content of 6%–8%, increased relative to that of the control wood: by 3.6 times for poplar wood, and by 2.6 times for birch wood. On the other hand, the hardness of densified wood after previous modification of its chemical composition increased further, by as much as 6.9 times for poplar wood, and by over 4.3 times for birch wood.
4. Achieving full stabilization of dimensions after the densification process will contribute to the use of wood, for example, from plantations, in structures exposed to heavy loads, as well as floor materials, where they have not been used so far.

 ,
, 


