Article

Soil Erosion Reduction by Grain for Green Project in Desertification Areas of Northern China

1
Research Institute of Forest Ecology, Environment and Protection, Chinese Academy of Forestry, Beijing 100091, China
2
Liaoning Academy of Forestry, Shenyang 110032, China
3
Key Laboratory of Forest Ecology and Environment of National Forestry and Grassland Administration, Beijing 100091, China
4
Dagangshan National Key Field Observation and Research Station for Forest Ecosystem, Xinyu 338033, China
*
Author to whom correspondence should be addressed.
Forests 2020, 11(4), 473; https://doi.org/10.3390/f11040473
Submission received: 14 March 2020 / Revised: 8 April 2020 / Accepted: 20 April 2020 / Published: 22 April 2020
(This article belongs to the Section Forest Ecology and Management)

Abstract

:
The Grain for Green Project (GGP) encompasses most desertification areas in northern China where fragile soils are susceptible to erosion given the arid and semi-arid climate, low vegetation cover, and strong winds. We collected relevant data through ecological surveys and literature review to quantify total sand fixation and dust retention in 2015 based on different restoration methods, forest types, ecological function zones, and key desertification areas. Our results showed that cropland and wasteland afforestation increased sand fixation and dust retention, whereas facilitate afforestation was less effective in doing so. Further, sand fixation and dust retention values were higher in ecological and shrub forests compared with economic forests, as well as in wind erosion zones compared with wind-water erosion and water erosion zones. Moreover, 43.28% and 44.75% of total sand fixation and dust retention, respectively, were concentrated in important windbreak and sand fixation areas. Similarly, 60% and 30% of total sand fixation and dust retention, respectively, occurred in sandstorm paths and sources. Lastly, policy factors primarily influenced the spatial distribution patterns of both sand fixation and dust retention. Based on these results, enhancement of GGP efficacy into the future will rely on increased restoration efforts specifically aimed at planting more drought-resistant shrubs and native vegetation as doing so will enhance sand fixation, dust retention, and thus, the ecological integrity of these valuable and fragile desert ecosystems in northern China.

1. Introduction

Land desertification is a serious environmental issue in northern China. Despite decades of desertification control efforts, desertified land comprises an area of 300,000 km2, nearly 18% of the country’s arable land, and is continuously expanding [1]. Degraded farmlands suffer significant nutrient loss in topsoil fine particles, which reduces soil fertility and productivity and negatively impacts agricultural and animal husbandry practices [2,3,4]. Due to the arid and semi-arid conditions, the lands in northern China are fragile and thus easily degraded; subsequently, they are slow to recover under natural conditions, particularly given increasing population pressures, urbanization, and overgrazing [5,6,7].
Researchers have revealed that vegetation can effectively reduce soil erosion [2]. Plant roots reinforce soils and thus improve soil structure and reduce soil erodibility; additionally, aboveground plant parts increase surface roughness and reduce wind speed, soil loss, and desertification [8,9]. In northern China, studies found that increasing vegetation coverage is strongly associated with decreasing sandstorm events [10,11].
Consequently, several ecological projects, such as the Beijing-Tianjin Sandstorm Source Control Project (BTSSCP), Three North Shelterbelt project (TNS), and Grain for Green Project (GGP), have been launched since the 1990s to increase vegetation cover and control ecosystem degradation [2,12]. However, the ecological effects of these projects need to be evaluated with regard to their effectiveness in controlling soil erosion [13] in order to assess and improve their efficacy. Few studies have focused on quantifying soil erosion following initiation of these projects; however, one report revealed that under BTSSCP in the Inner Mongolia area, the cumulative amount of sand fixation was 13.70 × 10⁸ t during 2001–2013 [14].
GGP, the focus of the present study, was initiated in China in 1999 [15]. GGP is aimed at improving desertified lands in northern China, comprising a total area of 4.01 × 10⁶ hm2. The implementation of GGP has indeed increased vegetation coverage, reduced soil erosion, controlled land desertification, and thus improved the ecological function of degraded ecosystems in this region [16,17,18,19]. However, there is a lack of systematic review regarding the assessment and quantification of the ecological effects of GGP.
Therefore, in this study, we attempted to quantify sand fixation and dust retention based on total desertification area in northern China, as well as specified key areas within this greater region (e.g., sandstorm path and source areas and ecological function zones critical for wind and sand fixation). Further, we analyzed various factors (including climate, land surface, policy and socioeconomic factors) influencing sand fixation and dust retention in these areas to determine which of these were most influential in controlling these important ecological services. Comprehensive evaluation of the ecological effects of GGP in northern China desertification areas from a multi-directional and multi-perspective view is required for mitigating wind erosion and providing guidance towards strengthening the future implementation of GGP in each region. In doing so, we could enhance ecological protection, management, and restoration of key protected areas and thus improve overall efficiency of this project. Therefore, the present study provides a multi-level evaluation (covering restoration methods, forest types, ecological function zones, key desertification areas under GGP, sandstorm paths and sources) of the ecological effects of GGP, particularly regarding sand fixation and dust retention, for selection and allocation of appropriate restoration approaches. Thus, we further provide a useful scientific basis towards improving policymaking, system planning, and project construction to strengthen GGP in desertification areas of northern China. Lastly, we provide valuable insights into wind erosion and desertification control efforts for China which will also be useful throughout the world.

2. Methods

2.1. Overview of Grain for Green Project in Northern China

By the end of 2014, the total area under GGP initiatives in northern China comprised 4.01 × 10⁶ hm2 of desertified land (Figure 1). Various restoration methods (e.g., cropland afforestation, facilitate afforestation, and wasteland afforestation), inclusive of three forest types (e.g., ecological forest, economic forest, and shrubs), have been utilized towards ecological restoration of this land (Table 1). Cropland afforestation was that afforestation was done on the returned farmland, wasteland afforestation was that afforestation was done on the barren hills and wasteland, and facilitate afforestation was that forests were closed to promote vegetation restoration.

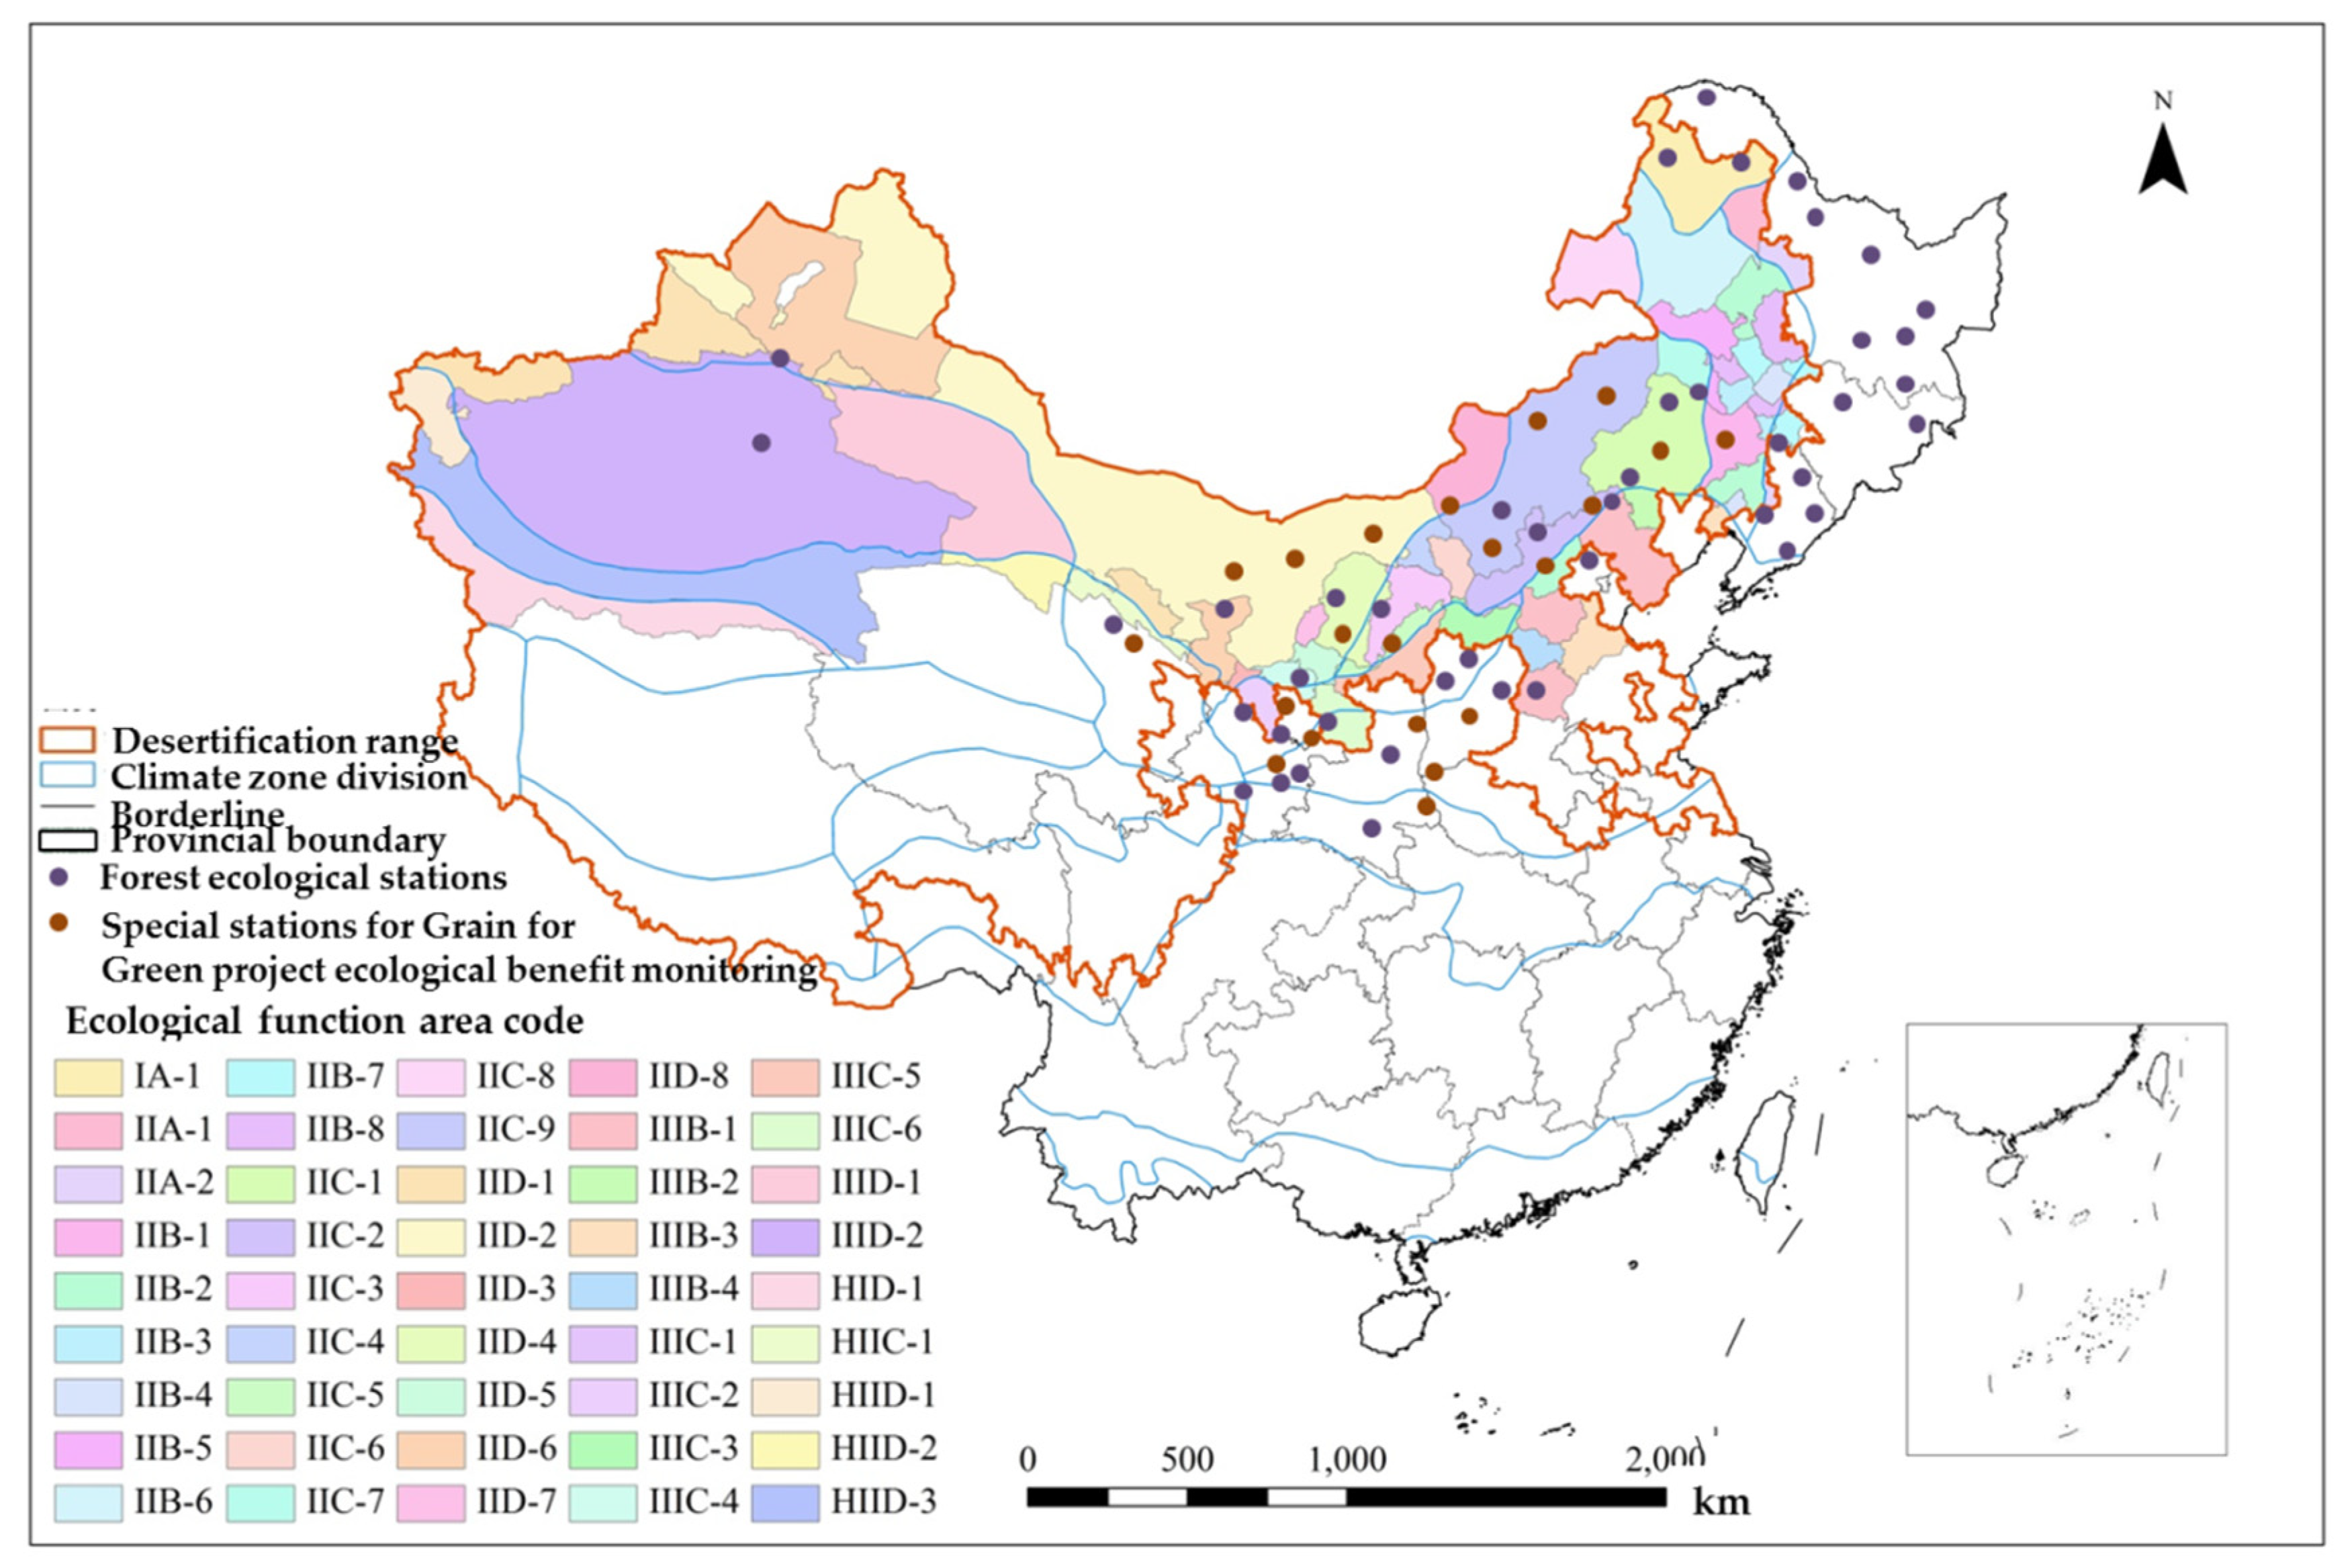
2.2. Ecological Regionalization of Grain for Green Project in Northern China

The ecological regionalization of GGP in northern China was determined based on hydrothermal conditions and soil erosion levels in differing areas. A literature review was conducted to acquire relevant information regarding regionalization (ecological and geographical) and vegetation in China [20,21,22,23,24]. Further, the distribution of desertification areas in northern China was determined by using various resources from the State Forestry Administration (2015) [1].
The geographic coordinate system was redefined as WGS84 coordinate system (World Geodetic System 1984) by applying ArcGIS (ArcGIS 9.3, ESRI, RedLands, CA, USA). The maps of the GGP scope, the administrative and the desertification land were spatially overlaid in ArcGIS to gain the map of the research area. Temperature was used for the index of level 1, soil erosion type and intensity for level 2, and precipitation for level 3. Using ArcGIS, the map of level 1, level 2 and level 3 indices were sequentially clipped at the boundary of the research area, then converted them to vector data, and the real value were reserved in the grid_code field in the property sheet. The information of provinces and cities was successively assigned to level 1, level 2 and level 3 map elements. Finally, the ecological regionalization map was obtained by spatial superposition analysis, which revealed 45 distinct ecological function zones categorized according to types of soil erosion: wind (22), wind-water (11), and water (12) (Figure 1; Table 2).

2.3. Distribution of Monitoring Sites

We selected and distributed GGP monitoring sites across the 45 ecological function zones (Figure 1; Table 2). GGP monitoring sites included 41 forest ecological stations of the Chinese Forest Ecosystem Research Network (CFERN) (349 sampling plots), 16 special stations for ecological monitoring of GGP (136 sampling plots), 120 auxiliary monitoring sites for forestry ecological projects (379 sampling plots), and 4000 fixed sampling points (Figure 1).

2.4. Distributed Evaluation System for Assessing Dust Retention and Sand Fixation

The assessment of the GGP on regional scale was a very large and complex project, and it was suitable to divide into multiple homogeneous ecological assessment units for evaluation. We conducted scale transformation of dust retention and sand fixation utilizing a distributed evaluation system (Figure 2). This system evaluated the ecological benefits associated with GGP at five different levels: ecological function areas (or sandstorm path/source) [23,25,26], administrative region (districts and counties), restoration method, forest type, and dominant species (Figure 2; Table 3). The first level assessment was made by ecological function zones and sandstorm paths and sources, the second level by administrative region (districts and counties), the third level by restoration methods, and the fourth level by forest types, and the fifth level by dominant species (Figure 2), and the numbers of relatively homogeneous assessment units were determined ultimately (Table 3). The regional results were obtained through converting the results of all relatively homogeneous assessment units. Sandstorms originate from Taklimakan Desert and the surrounding areas, southern Xinjiang, Junggar Basin in northern Xinjiang, Gansu Hexi Corridor, and Qaidam Basin in Qinghai Province; and from Inner Mongolia Desert as well which included Hongshandake Sandy Land, Mu Us Sandy Land, Ulan Buh Desert, Kubuqi Desert, and Badanjilin Desert; these storms then move south along Hami in eastern Xinjiang to Xilin Gol in Inner Mongolia as well as east from Kashi in the northwest Tarim Basin, Xinjiang through Aksu and northern Yining to Klamayi [26].

2.5. Data Collection

The data used in this study [total suspended particulate matter quantity of leaves (QTSP), leaf area index (LAI), soil erosion depth, soil bulk density, annual elution times, and slope] were obtained by conducting field surveys and collecting vegetation samples from GGP ecological monitoring and CFERN forest ecological stations (Figure 1). We collected vegetation and soil samples from the auxiliary observation and fixed sampling points (Figure 1) to measure LAI, soil bulk density, and annual elution time. For all preexisting GGP ecological monitoring sites, trees were sampled using five randomly selected 20 m × 20 m plots (10 m × 10 m plots for shrubs and in the control area without GGP initiatives). Laboratory and sampling procedures were described in depth in the appropriate methodological sections below. Data collection followed the standards of the People’s Republic of China [27,28,29,30,31].
Furthermore, land reclamation data under GGP were provided by the State Forestry Administration of the GGP management center. The provincial administrative departments are responsible for scientific and technological support of the GGP project.

2.6. Dust Retention Assessment

Dust retention was determined by measuring dust reduction in plant shoots and leaves using a dust falling device [32]. The dust descent process was considered complete when particulate matter on the leaf surface reached saturation. Shoots were then removed from the dust falling device and maintained in a natural position until particulate matter quantity remained constant. The ability to capture particulate matter was measured in a wind tunnel (0.5 m wide, 0.5 m high, and 1 m in length) [33]. According to the principle of wind erosion, the particles on the leaves were blown up and suspended, remixed to form aerosols. First, sampled leaves were placed in the wind tunnel, then pure air without particulate matter was introduced into the wind tunnel through a plenum with several openings. Second, a fan operating at a wind speed of 20 m·s−1 was used to blow air across the leaves in the tunnel. This process continued for about 6–10 min, to ensure that all of the particulate matter on the leaf surface was suspended in the tunnel space. The amount of TSP which was removed from leaves was calculated based on the TSP concentration in the wind tunnel determined by a DUSTMATE handheld environmental dust detector (DUSTMATE, Turnkey, Cheshire, UK). Equation (1) was used to calculate the amount of TSP per unit leaf area of different tree species:
Q T S P i = 1 n M i / S i
where QTSPi represents the leaves surface absorbed TSP per unit leaf area of different tree species (μg·cm−2), i represents the different tree species, n represents three replicates, Si represents the leaf surface areas (cm2), and mi represents the TSP on leaves measured (μg).
A 100 g sample of needles was collected. Needle diameters and lengths were measured. The average surface area of pine needles was calculated by assuming they were truncated cones, and the average surface area of pine needles was calculated using Equation (2).
S n e e d l e = 1 2 π · ( D 1 + D 2 ) · [ 1 4 · ( D 2 D 1 ) 2 + l 2 ] 1 2
where D1 is the average diameter of pine needles at the upper tip; D2 is the average diameter of pine needles at the lower tip; and l is average length. Thus, the total surface area of pine needles was calculated by multiplying the number of pine needles by the average surface area of pine needles.
The leaves of broad-leaved trees were scanned by an image scanner (Canon LIDE 110, Canon, Tokyo, Japan), and the images were converted into pictures that appeared black with a white background. The black area was obtained using Adobe Photoshop software (Photoshop CS2, Adobe, San Jose, CA, USA) and indicated the leaf surface area of these broad-leaved trees.
A digital camera with a fisheye lens was used to acquire hemispherical images or cover images with a narrower view angle once a week in April, May, and November, as well as every two weeks in the remaining months, except for deciduous species in January, February, and December. Images were processed with WinSCANOPY software (WinSCANOPY, Regent, Lethbridge, Canada) to measure LAI.
Particle elution was generally between 70% and 90% when rainfall exceeded 15.9 mm; therefore, the number of precipitation events in which rainfall exceeded 15.9 mm indicated elution times. In the study area, precipitation mainly occurs from May to September, with relatively more intense rainfall events occurring between July and September. According to the phenological characteristics of plant species under GGP, total annual rainfall was required for removal of particles from the needles of evergreen species, whereas rainfall exceeding 15.9 mm successfully eluted suspended particulate matter on the surfaces of deciduous leaves during the growing season.
The dust capture ability of leaves belonging to annual plants was calculated using the following formula:
G T S P = 10 Q T S P × L A I × n × A
where GTSP is the amount of TSP retention by a particular forest type (kg·a−1), QTSP is the amount of TSP retention per leaf area (μg·cm−2), LAI is leaf area index, n is annual elution times, and A is forest area (hm2).

2.7. Sand Fixation Evaluation

Soil erosion was monitored with erosion pins made of steel for benchmarks (5 mm diameter and 50 mm length) vertically inserted 150 mm into the ground. Three transects were arranged perpendicular to the direction of prevailing winds within the monitoring plots, with three monitoring points randomly distributed on each transect. This experimental setup was replicated in the nearby control areas (non-GGP). Wind erosion depth (h, mm·a−1) was calculated at each monitoring point by measuring soil depth daily when the wind speed were stronger than 10 m·s−1, and measuring soil depth weekly when the wind speed were weaker than 10 m·s−1. Annual wind erosion depth was estimated at each monitoring point by measuring soil depth daily, weekly, or monthly depending upon climate and wind conditions.
Annual soil erosion was calculated using the following formula:
E s = Δ h × ρ / 10 = ( h s h e ) × C O S θ × ρ / 10
where Es is soil erosion (t·hm−2·a−1), hs is the soil erosion depth at the beginning of 2015 (mm·a−1), he is the soil erosion depth at the end of 2015 (mm·a−1), θ is slope (°) determined using the “Slope” function of the GRID module in ArcGIS 9.3 software, and ρ is soil bulk density (g·cm−3) measured using the soil ring method for one time in 2015 in each sampling sites.
Annual sand fixation was calculated using the following formula:
G = ( E s 2 E s 1 ) × A
where G is sand fixation (t·a−1), ES1 is annual soil erosion in the experimental areas (t·hm−2·a−1), ES2 is annual soil erosion in the control areas (t·hm−2·a−1), and A is total forest area (hm2).

2.8. Driving Factors Analysis

Structural equation modeling (SEM) is a multivariate statistical method which can distinguish complex path relations among multiple factors [34]. Factors affecting the spatial patterns of sand fixation and dust retention in the GGP areas included climate factors (annual average temperature and annual average precipitation), land surface factors (terrain slope, serious desertification rate, and wind erosion modulus), policy factors (policy governance of each area under GGP, GGP investment, and ecological forest ratio) and socio-economic factors (population density, farmer’s net income, industrial and agricultural production proportion, and crop output) (Table 4). Using AMOS24.0 software, SEM was used to determine the correlation between these categorized factors and sand fixation/dust retention. Optimization of the equation was achieved through an iterative process that involved increasing or decreasing the factors. Thus, we determined which factors strongly influenced the spatial patterns of sand fixation and dust retention in the GGP area, along with the relative contribution rates of these factors.

3. Results

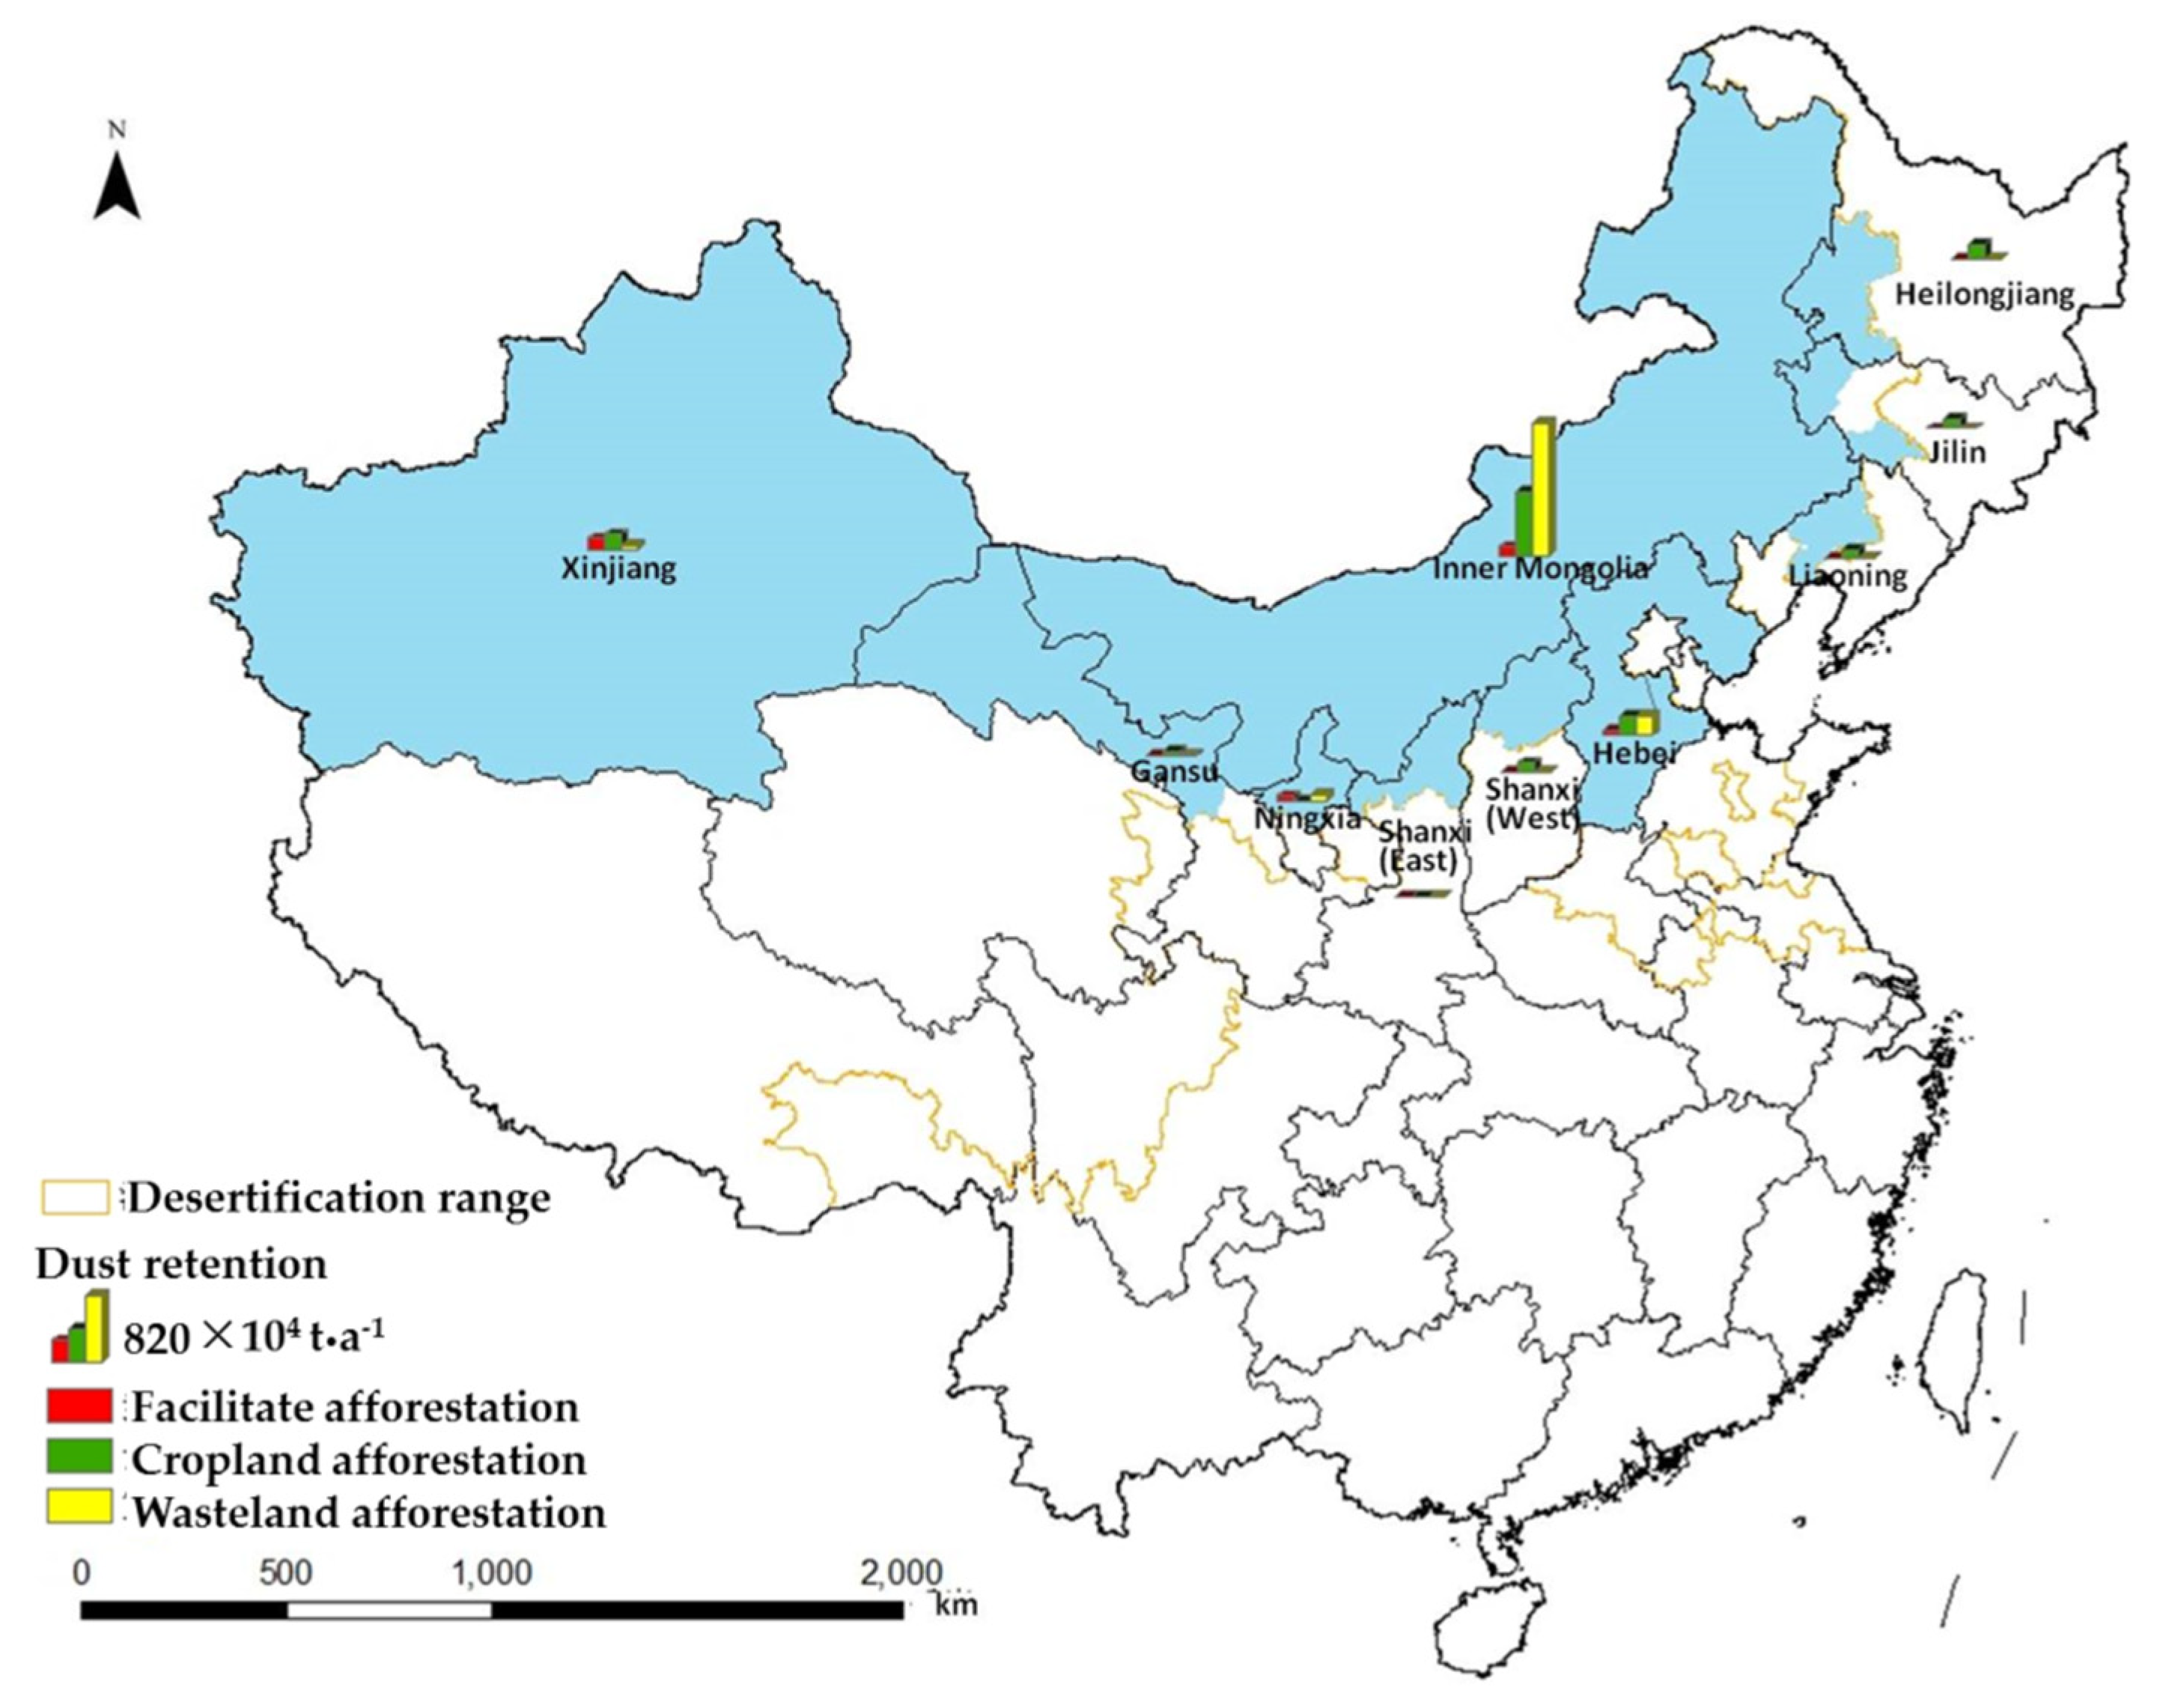
3.1. Sand Fixation and Dust Retention Associated with Different Restoration Methods

In the GGP area of northern China, total sand fixation and dust retention were 919.19 × 10⁶ t·a−1, and 42.51 × 10⁶ t·a−1, respectively (Table 5). Sand fixation and dust retention as a result of cropland and wasteland afforestation accounted for 88.27% and 90.49% of the project totals, respectively.
High sand fixation and dust retention due to cropland and wasteland afforestation were mainly estimated within the eastern-central regions of the project area (Figure 3). Additionally, high sand fixation due to facilitate afforestation occurred in the west, whereas high dust retention was equally distributed from west to east (Figure 4).

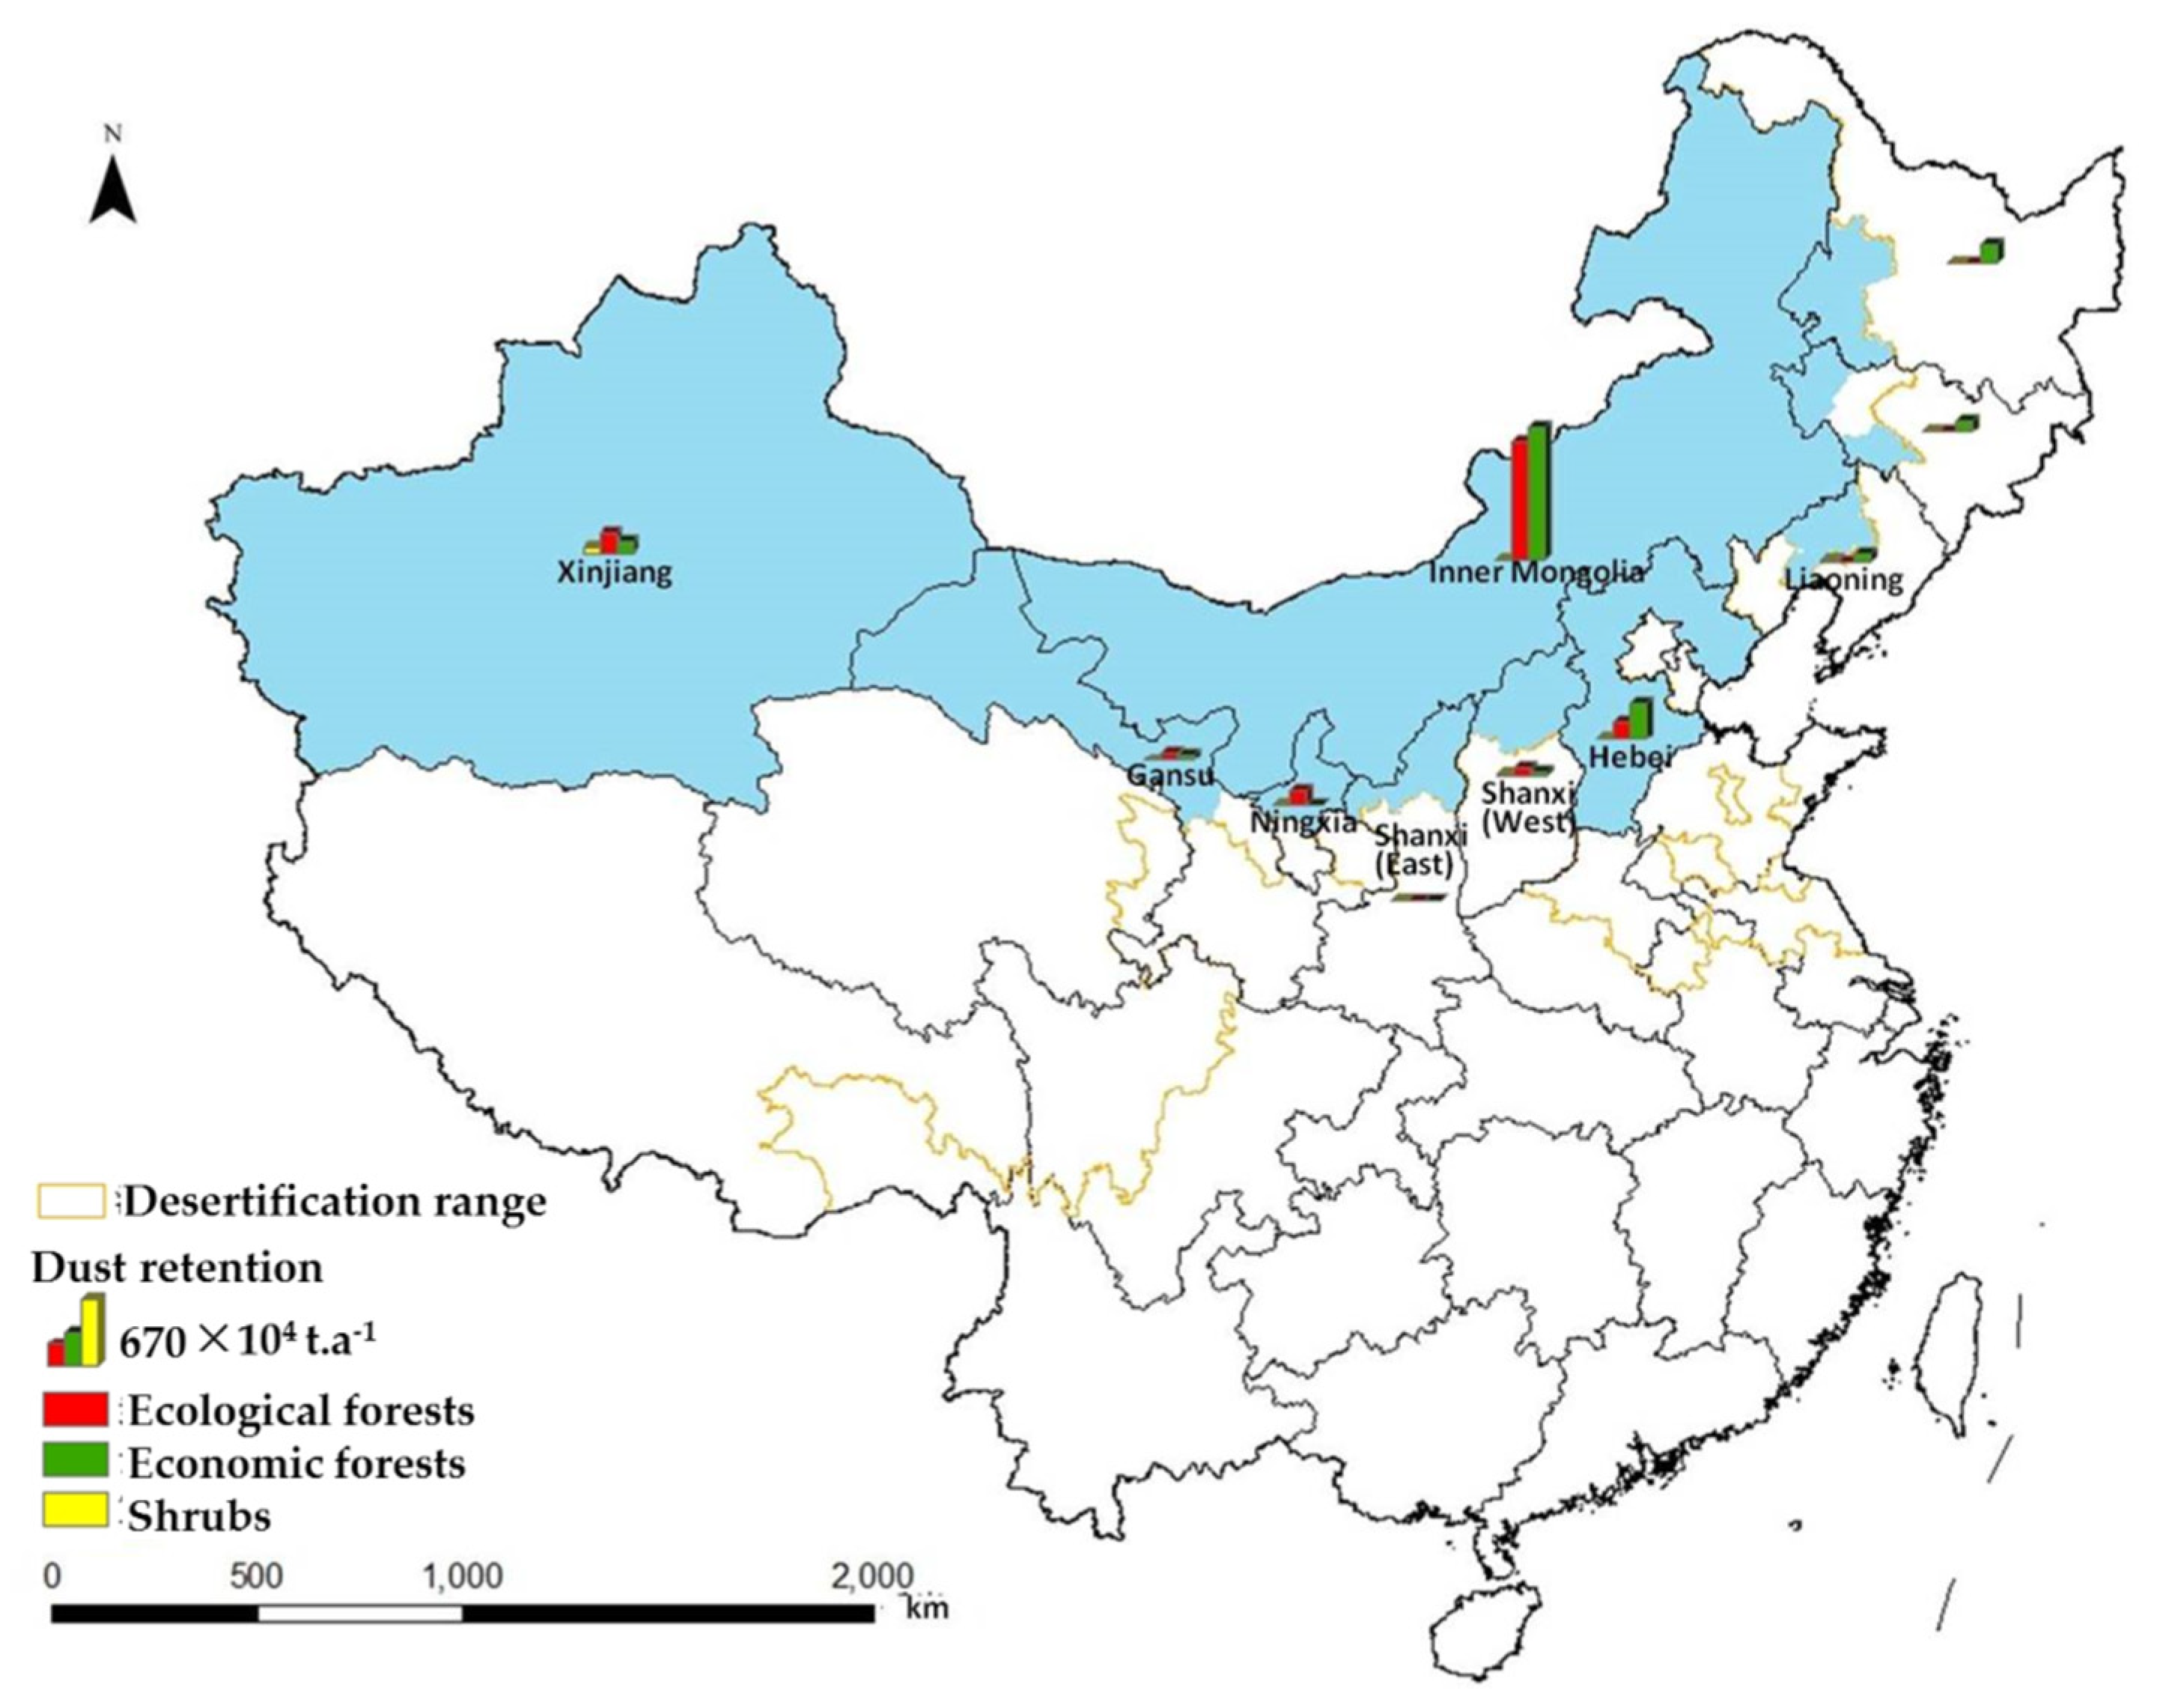
3.2. Sand Fixation and Dust Retention Associated with Different Forest Types

Sand fixation and dust retention by ecological and shrub forests accounted for 96.60% and 97.51% of the total project, respectively (Table 5). Eastern-central GGP regions were characterized by high sand fixation and dust retention by ecological and economic forests (Figure 5), whereas high sand fixation and dust retention by shrub forests occurred in the west (Figure 6).

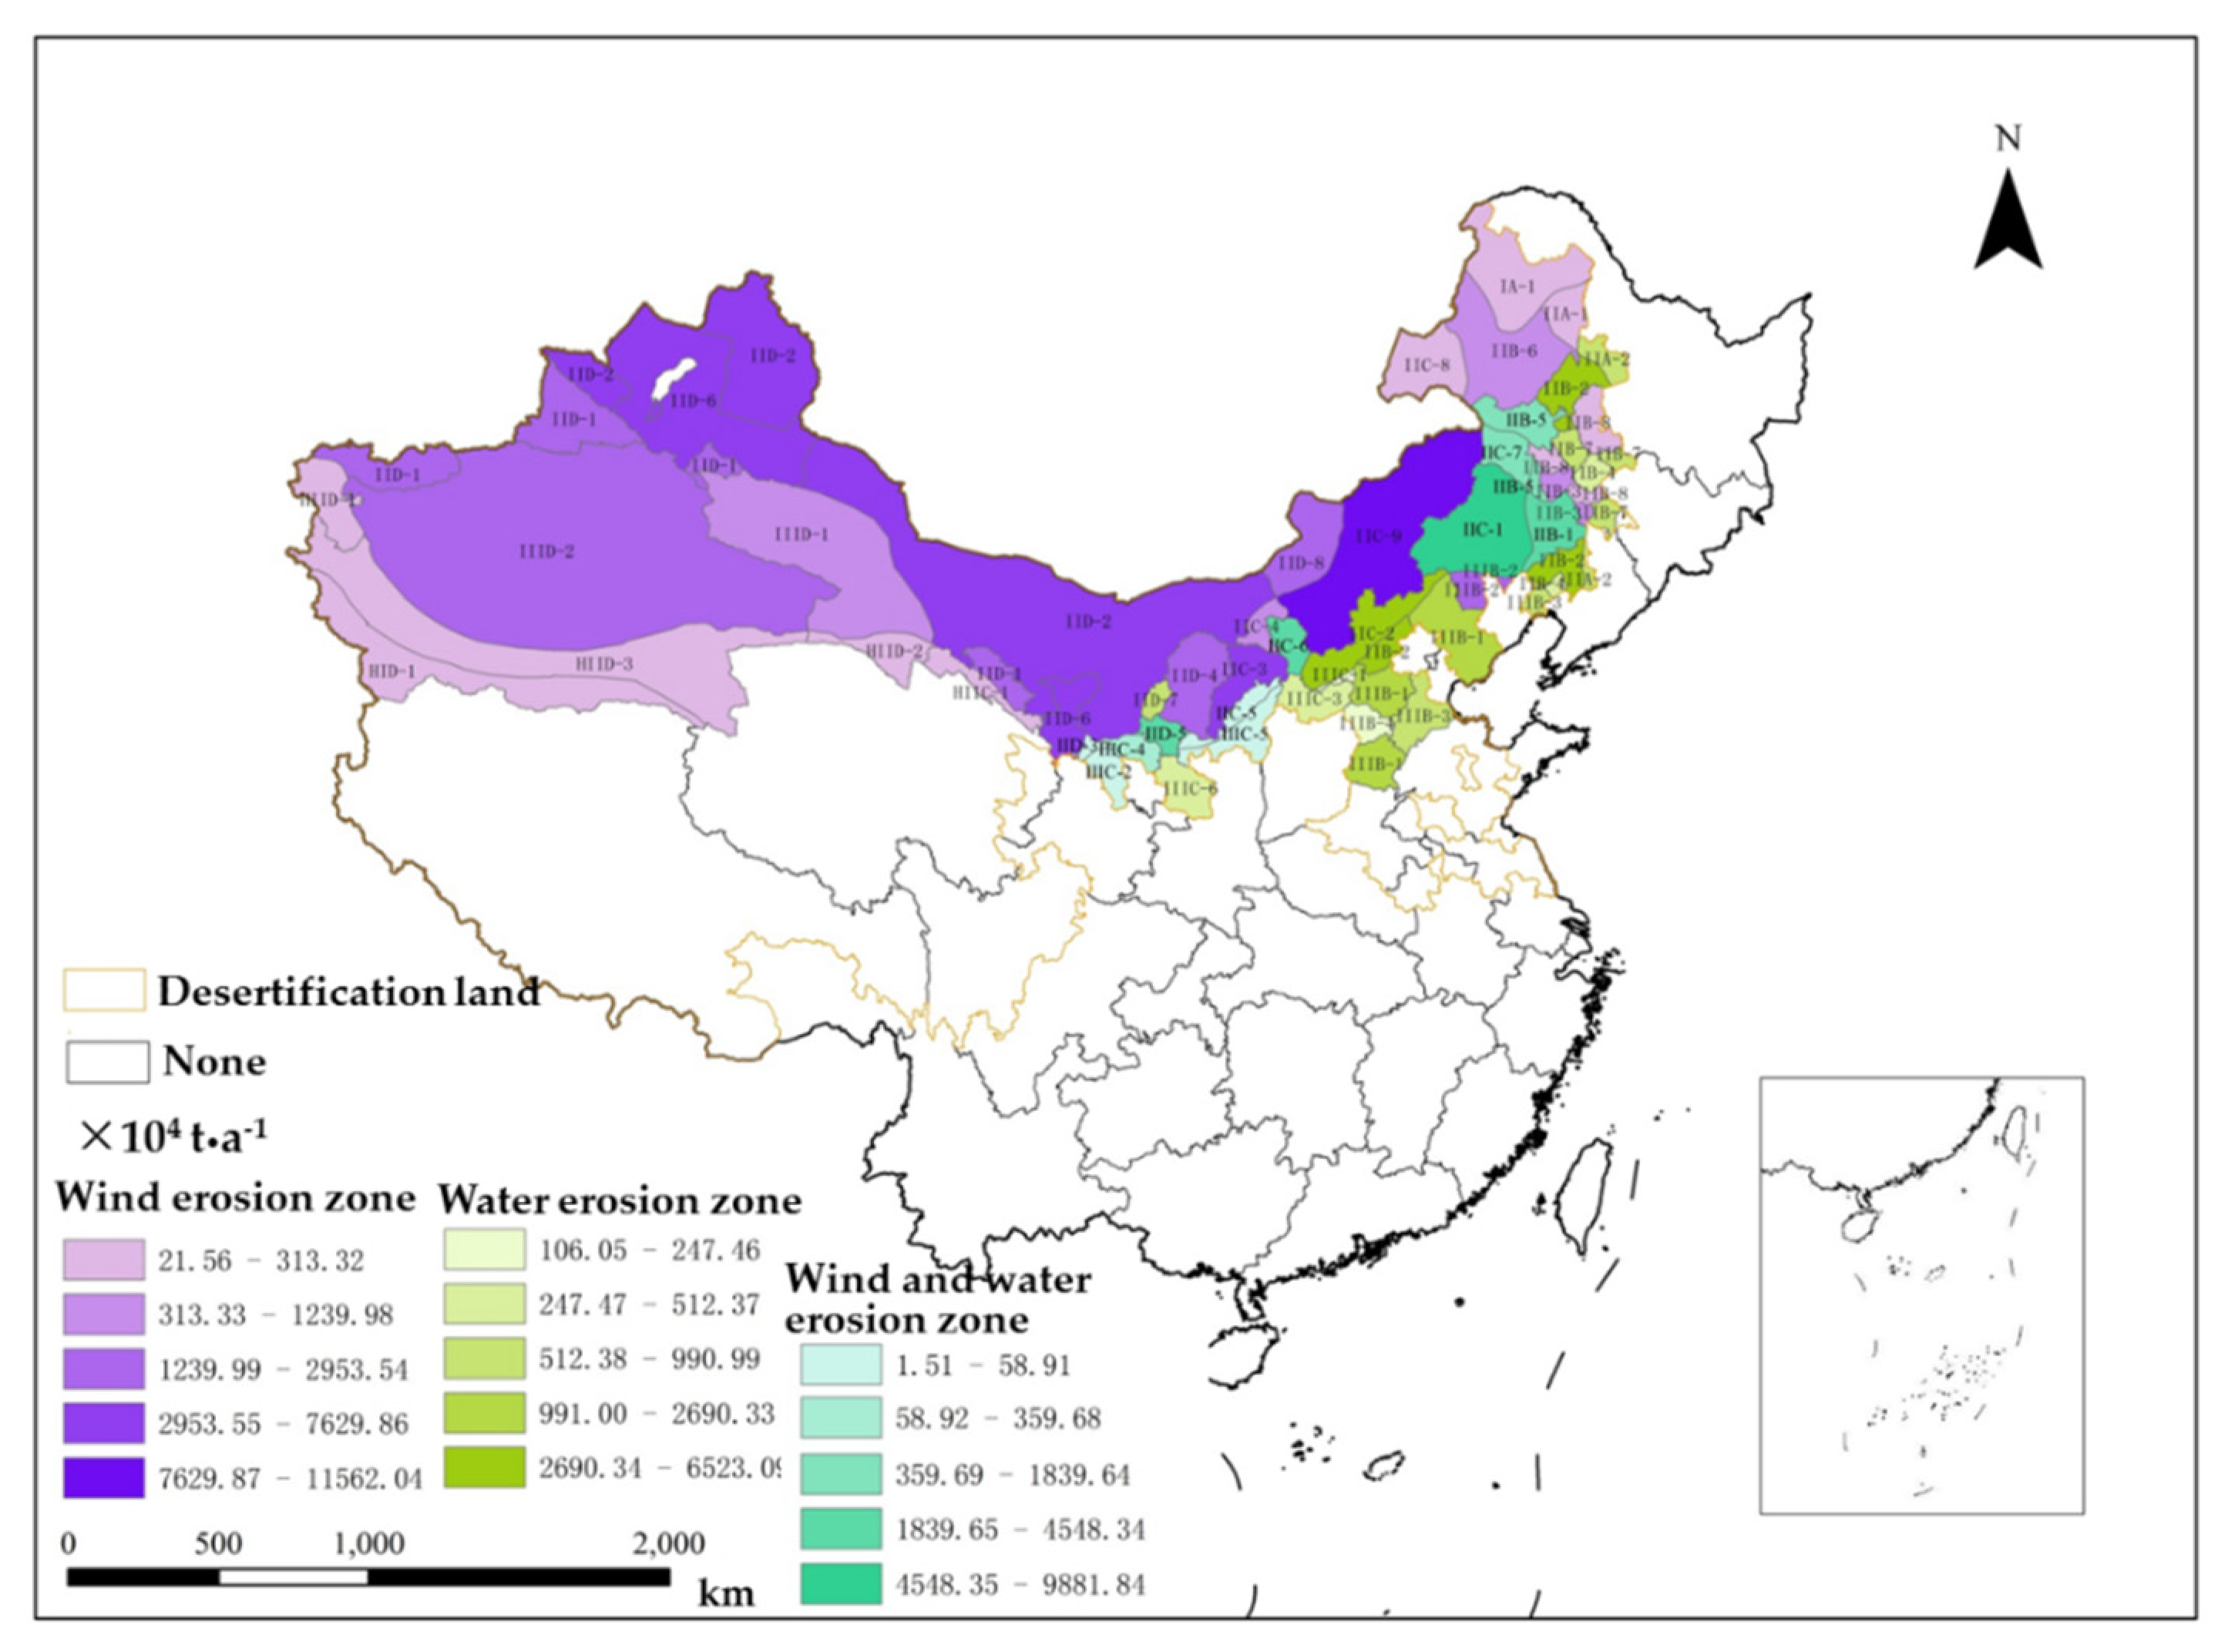
3.3. Sand Fixation and Dust Retention in Different Ecological Function Zones

Sand fixation in wind erosion zones was 174.90 × 10⁶ t·a−1, accounting for 51.67% of the project total. Sand fixation in wind-water erosion zones was similar to that in water erosion zones, equivalent to 25.91% and 22.42% of the project total, respectively (Table 5; Figure 7).
Dust retention in wind erosion zones was 19.39 × 10⁶ t·a−1, accounting for 51.67% of the project total, whereas dust retention in wind-water erosion zones was similar to that in water erosion zones (29.58% and 24.79% of the project total, respectively) (Table 5; Figure 8).

3.4. Sand Fixation and Dust Retention in Key Desertification Areas under Grain for Green Project

Sand fixation and dust retention were concentrated in seven key windbreak and sand fixation areas, was 397.83 × 10⁶ t·a−1, accounting for 43.28% and 44.75% of the project totals, respectively (397.83 × 10⁶ t·a−1 and 19.02 × 10⁶ t·a−1, respectively) (Table 6). Total sand fixation and dust retention in three of these seven areas (northern Yinshan, Hunshandake Sandy Land, and Ordos Plateau (northern GGP region)) was 309.56 × 10⁶ t·a−1 and 15.24 × 10⁶ t·a−1, accounting for 77.81% and 80.13% of the totals for these key areas, respectively (Table 5 and Table 6).

3.5. Erosion Reduction along Sandstorm Paths and Sources

Sand fixation and dust retention along the sandstorm path was 627.28 × 10⁶ t·a−1 (68.24%) and 27.55 × 10⁶ t·a−1 (64.81%). Sand fixation in the sandstorm source areas was 329.38 × 10⁶ t·a−1 (35.83%), whereas dust retention in these areas was 12.67 × 10⁶ t·a−1 (29.80%).

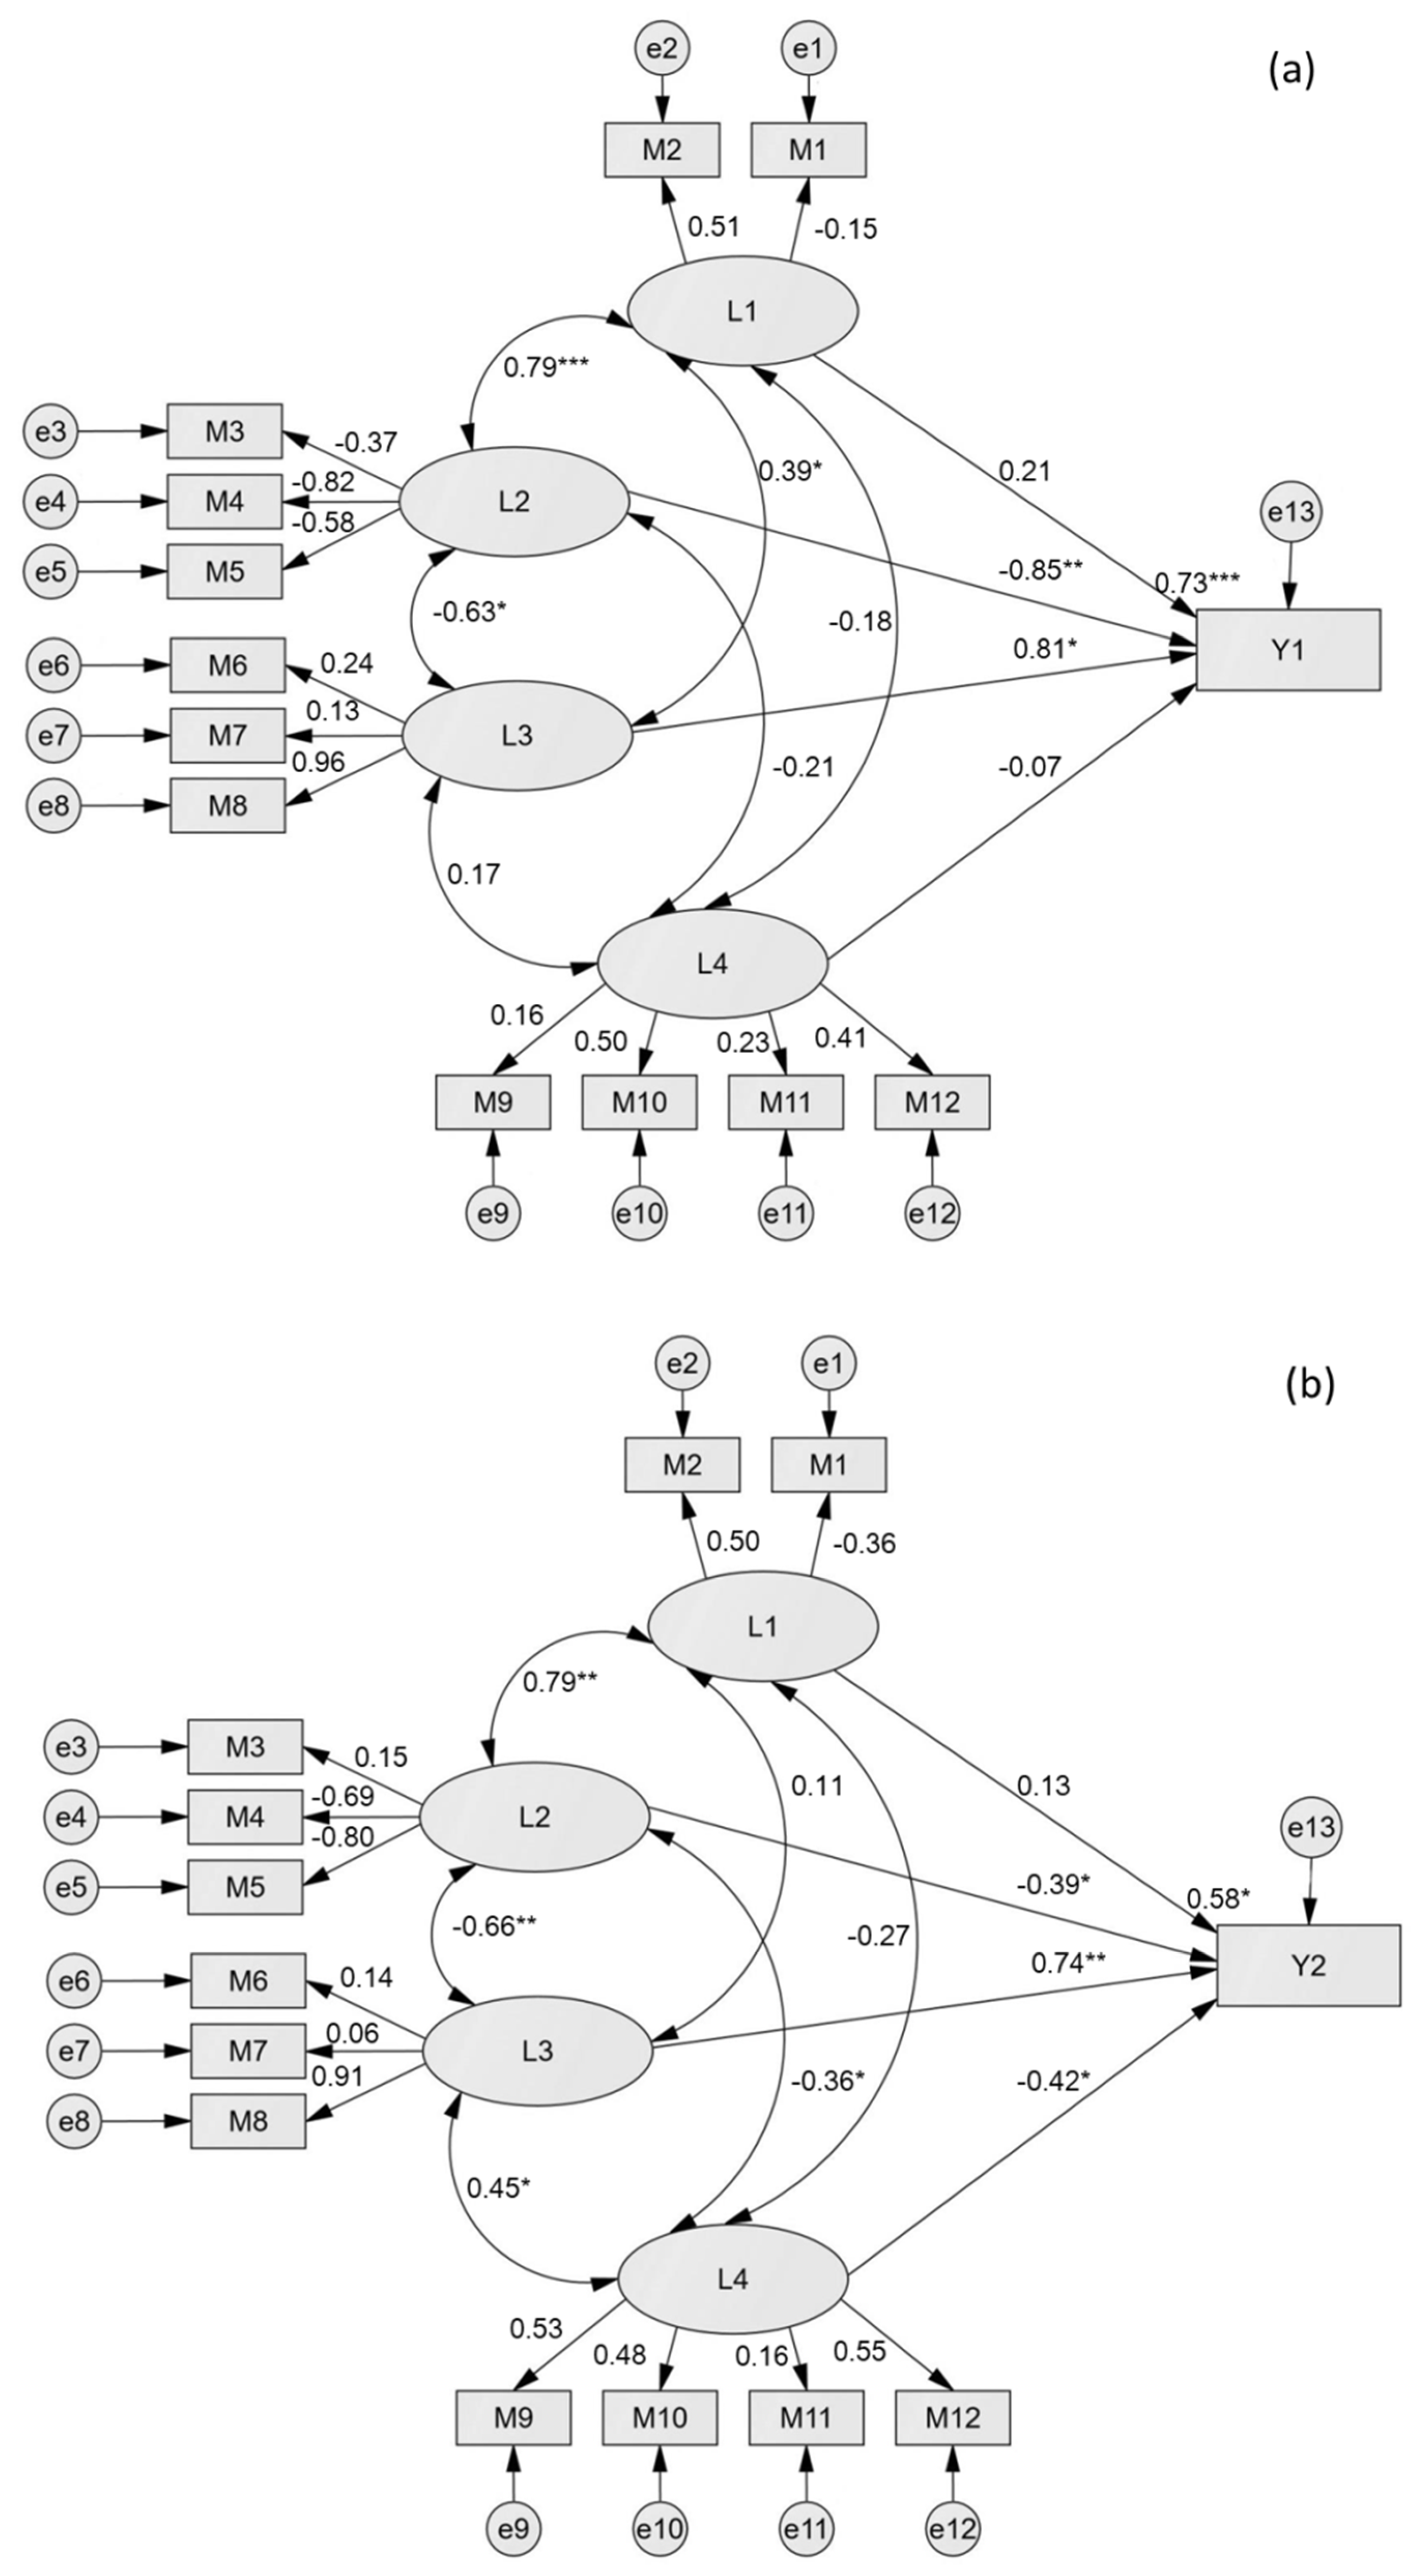
3.6. Driving Factors Influencing Sand Fixation and Dust Retention Variation in Grain for Green Project Areas

Climate, land surface, policy, and socioeconomic factors explained 73% and 58% of the regional differences in the functions of sand fixation and dust retention, respectively, in GGP desertification areas of northern China (Figure 9a). Spatial heterogeneity of sand fixation was mainly influenced by policy and land surface factors. Policy factors had a significantly positive effect on sand fixation (path coefficient = 0.81; p < 0.05), whereas the effect of land surface factors was opposite (path coefficient = −0.85; p < 0.01). Alternatively, the effects of climate and socio-economic factors were relatively weak (Figure 9a). Dust retention spatial patterns were primarily influenced by policy factors (path coefficient = 0.74; p < 0.01), socio-economic factors (path coefficient = −0.42; p < 0.05), and land surface factors (path coefficient = −0.39; p < 0.05). Alternatively, climate factors only weakly influenced dust retention spatial patterns (path coefficient = 0.13) (Figure 9b).

4. Discussion

4.1. Characteristics of Sand Fixation and Dust Retention in Grain for Green Project Areas

The GGP indeed substantially reduces soil erosion, as indicated by previous studies [16,21,35,36]. In the entire GGP area, natural vegetation is scattered, and restoration efforts have primarily involved planting shrubs. Due to their smaller leaf area, shrubs fix sand more efficiently and retain dust less efficiently compared with trees. In the present study, we found that shrub forests in GGP areas indeed fixed sand more efficiently than other forest types; however, we also revealed that these forests retained dust efficiently. Moreover, as found by Breshears (2010), the contribution of economic forests to dust retention is relatively low in comparison with ecological forests [37], likely due to management activities (e.g., pruning) which promote fruit/nut production and reduce the number of branches and leaves. Accordingly, we revealed that ecological forests contributed more to dust retention in the GGP area than economic forests.

4.2. Soil Erosion Reduction by Grain for Green Project Initiatives in Key Desertification Areas

Most of the desertified lands comprised by GGP are located within sandstorm paths and sources. Ecologic barriers have been constructed in many of these GGP areas, including the Sino-Mongolian border, west-central Inner Mongolia, Ordos, Mu Us Sandy Land, Beijing, and Tianjin, in order to improve irrigation practices, control the occurrence of sandstorms at the source, reduce dust transportation, and thus enhance the ecological integrity of these important habitats.
We revealed that sand fixation and dust retention were not evenly distributed within the GGP areas. For example, the contribution of northwestern and southeastern areas to sand fixation and dust retention was relatively low. Specifically, Keerqin Sandy Lands and Tarim River Basin are characterized by a dry, windy climate with a fragile environment; however, sand fixation and dust retention only contributed to 19.54% and 16.66% of the project totals, respectively. Therefore, future efforts should focus on facilitate afforestation and restoration of these GGP areas.
The overall goal of GGP is to balance economic growth and ecological benefits in the fragile desertification areas of northern China [38]. For example, GGP efficacy would increase by planting more drought-resistant shrubs and native trees which produce fruits of both ecological and economic significance [39]. Further, enhanced project monitoring and multi-angle assessments are required to refine restoration techniques and thus increase GGP benefits and overall success [40,41].

4.3. Main Driving Factors Influencing Sand Fixation and Dust Retention in Grain for Green Project Areas

Many studies have shown that the spatial heterogeneity of ecosystem service functions in vegetation restoration projects is influenced by multiple factors, including ecological, socio-economic, and policy factors [15,42,43]. In the present study, we concluded that policy factors mainly influenced the spatial distribution patterns of sand fixation and dust retention. However, there was a relatively large difference between the impact of primary and secondary control factors (land surface for sand fixation and socio-economic for dust retention). Policy factors such as increased and enhanced vegetation restoration and ecological forest areas would further improve sand fixation and dust retention in GGP areas and thus improve overall project efficacy. Alternatively, greater wind erosion, steeper slope, and other land surface factors reduce sand fixation and dust retention and thus increase desertification; therefore, these factors are not conducive to the development and enhancement of GGP initiatives and we accordingly revealed that these factors negatively influenced the spatial patterns of both dust retention and sand fixation. Therefore, in accordance with our results, previous research suggested that the main driving factor of sand fixation and dust retention in GGP areas is policy management of this ecological services project [43]. Further, according to our results, regional desertification degree, wind erosion conditions, industrial structure adjustment, farmers’ income, grain production, and population distribution, among other land use conditions and socio-economic factors, were also key factors influencing changes in ecological function. In contrast, climate factors (e.g., average precipitation and temperature) more weakly influenced both sand fixation and dust retention.

5. Conclusions

The implementation of GGP encompasses most desertification areas in northern China has indeed increased vegetation coverage, reduced soil erosion, and improved the ecological function of degraded ecosystems in this region. The cropland and wasteland afforestation increased sand fixation and dust retention, whereas facilitate afforestation was less effective in doing so. The ecological forests and shrubs in this GGP areas indeed fixed sand and retained dust more efficiently than economic forests, as well as in wind erosion zones compared with wind-water erosion and water erosion zones. Moreover, 43.28% and 44.75% of total sand fixation and dust retention, respectively, were concentrated in important windbreak and sand fixation areas. Similarly, 60% and 30% of total sand fixation and dust retention, respectively, occurred in sandstorm paths and sources. However, we revealed that sand fixation and dust retention were not evenly distributed within the GGP areas. For example, the contribution of northwestern and southeastern areas to sand fixation and dust retention was relatively low. Specifically, Keerqin Sandy Lands and Tarim River Basin are characterized by a dry, windy climate with a fragile environment; however, sand fixation and dust retention only contributed to 19.54% and 16.66% of the project totals, respectively. Therefore, future efforts should focus on facilitate afforestation and restoration of these GGP areas. Lastly, policy factors primarily influenced the spatial distribution patterns of both sand fixation and dust retention. Policy factors such as increased and enhanced vegetation restoration and ecological forest areas would further improve sand fixation and dust retention in GGP areas and thus improve overall project efficacy.

Author Contributions

B.W. conceived and designed the experiments, and W.W. performed the experiments. X.N. analyzed the data, W.W. and X.N. contributed materials/analysis tools and W.W. wrote the paper. All authors have read and agreed to the published version of the manuscript.

Funding

This study was funded by the Fundamental Research Funds for the Central Non-profit Research Institution of CAF (CAFYBB2020ZE003), the National key research and development program of China (2017YFC0503804), the research on the accounting of forest resources and the green development of forestry in China (2019131046). Financial support was also provided by CFERN & BEIJING TECHNO SOLUTIONS Award Funds on excellent academic achievements.

Conflicts of Interest

The authors declare no conflict of interest.

References

  1. State Forestry Administration. Bulletin of Desertification and Sandification State of China; State Forestry Administration: Beijing, China, 2015. (In Chinese)
  2. Gong, G.L.; Liu, J.Y.; Shao, Q.Q.; Zhai, J. Sand-fixing function under the change of vegetation coverage in a wind erosion area in northern China. J. Res. Ecol. 2014, 5, 105–114. [Google Scholar]
  3. Chalise, D.; Kumar, L.; Shriwastav, C.P.; Lamichhane, S. Spatial assessment of soil erosion in a hilly watershed of Western Nepal. Environ. Earth Sci. 2018, 77, 685. [Google Scholar] [CrossRef]
  4. Chalise, D.; Kumar, L.; Kristiansen, P. Land degradation by soil erosion in Nepal: A review. Soil Syst. 2019, 3, 12. [Google Scholar] [CrossRef] [Green Version]
  5. Fang, J.Y.; Piao, S.L.; He, J.S. Vegetation of China invigorated in last 20 years. Sci. China Ser. C 2003, 33, 554–565. (In Chinese) [Google Scholar]
  6. Chalise, D.; Kumar, L.; Spalevic, V.; Skataric, G. Estimation of sediment yield and maximum outflow using the IntErO model in the Sarada river basin of Nepal. Water 2019, 11, 952. [Google Scholar] [CrossRef] [Green Version]
  7. Chalise, D.; Kumar, L.; Sharma, R.; Kristiansen, P. Assessing the impacts of tillage and mulch on soil erosion and corn yield. Agronomy 2020, 10, 63. [Google Scholar] [CrossRef] [Green Version]
  8. Leenders, J.K.; Sterk, G.; Boxel, J.H. Wind erosion reduction by scattered woody vegetation in farmers’ fields in Northern Burkina Faso. Land Degrad. Dev. 2014, 27, 1863–1872. [Google Scholar] [CrossRef]
  9. Zhang, G.P.; Zhang, Z.X.; Liu, J.Y. Spatial distribution of aeolian erosion of soil and its driving factors in China. Acta Geogr. Sin. 2001, 56, 158–169, (In Chinese with English abstract). [Google Scholar]
  10. Gu, W.; Ca, X.P.; Xie, F.; Li, Z.J.; Wu, X.H. Study on relationship between vegetation cover and distribution of days of sandstorm-taking central and western Inner Mongolia for example. Adv. Earth Sci. 2002, 17, 273–277, (In Chinese with English abstract). [Google Scholar]
  11. Zhang, T.R.; Chai, X.M.; Li, Z.Z. Characteristics of vegetation coverage in northern China and its relationship with sandstorm. Plateau Meteorol. 2010, 29, 137–145, (In Chinese with English abstract). [Google Scholar]
  12. Long, H.L.; Heilig, G.K.; Wang, J.; Li, X.B.; Luo, M.; Wu, X.Q.; Zhang, M. Land use and soil erosion in the upper reaches of the Yangtze River: Some socio-economic considerations on China’s Grain-for-Green Programme. Land Degrad. Dev. 2006, 17, 589–603. [Google Scholar] [CrossRef]
  13. Qin, Y.B.; Xin, Z.B.; Yi, Y.; Yang, M.C. Spatiotemporal variation of sandstorm and its response to vegetation restoration in Beijing-Tianjin sandstorm source area. Trans. Chin. Soc. Agric. Eng. 2012, 28, 196–204, (In Chinese with English abstract). [Google Scholar]
  14. Yu, B.L.; Wu, W.J.; Zhao, X.J.; Wu, E.T.; Cai, L.Y.; Yang, F.J. Benefits of soil wind erosion control of the Beijing-Tianjin Sand Source Control Project in Inner Mongolia. Arid Zone Res. 2016, 33, 1278–1286. (In Chinese) [Google Scholar]
  15. Liu, J.G.; Li, S.X.; Ouyang, Z.Y.; Tam, C.; Chen, X.D. Ecological and socioeconomic effects of China’s policies for ecosystem services. Proc. Natl. Acad. Sci. USA 2008, 105, 9477–9482. [Google Scholar] [CrossRef] [Green Version]
  16. Deng, L.; Shangguan, Z.P.; Li, R. Effects of the grain-for-green program on soil erosion in China. Int. J. Sediment Res. 2012, 27, 120–127. [Google Scholar] [CrossRef]
  17. He, H.J.; Zhuo, J.; Wang, J.; Dong, J.F.; Quan, W.T. Relationship between fractional vegetation cover and humidity index after returning farmland to forest in Shaanxi Province. Acta Ecol. Sin. 2016, 36, 439–447. [Google Scholar]
  18. Wang, Z.J.; Jiao, J.Y.; Rayburg, S.; Wang, Q.L.; Su, Y. Soil erosion resistance of “Grain for Green” vegetation types under extreme rainfall conditions on the loess plateau, China. Catena 2016, 141, 109–116. [Google Scholar] [CrossRef]
  19. Zhao, A.Z.; Zhang, A.B.; Liu, H.X.; Liu, Y.X.; Wang, H.F.; Wang, D.L. Spatiotemporal variation of vegetation coverage before and after implementation of grain for green project in the loess plateau. J. Nat. Resour. 2017, 32, 449–460. [Google Scholar]
  20. Zheng, D. 2008 Ecological Geographical Regional System Research in China; Commercial Press: Beijing, China, 2008. (In Chinese) [Google Scholar]
  21. Wang, J.A.; Zuo, W. Geographic Atlas in China; China Map Press: Beijing, China, 2009. (In Chinese) [Google Scholar]
  22. Huang, B.W. Comprehensive Natural Zoning in China; Science Press: Beijing, China, 1989. (In Chinese) [Google Scholar]
  23. Chinese Academy of Sciences. Vegetation in China; Science Press: Beijing, China, 1960. (In Chinese) [Google Scholar]
  24. Wu, Z.Y. Vegetation Zoning in China; Science Press: Beijing, China, 1980. (In Chinese) [Google Scholar]
  25. China’s Environmental Protection Ministry. The National Ecological Function Zoning in China (Revised Version); China’s Environmental Protection Ministry: Beijing, China, 2015. (In Chinese)
  26. Qiu, X.F.; Zeng, Y.; Miao, Q.L. Temporal-spatial distribution as well as tracks and source areas of sand-dust storms in China. Acta Geogr. Sin. 2001, 56, 316–322, (In Chinese with English abstract). [Google Scholar]
  27. Wang, B.; Zhou, H.S.; Ao, A.Q.; Li, B.Y.; Lu, S.W.; Li, S.N.; Niu, X.; Wang, J.S.; Chen, B.; Zhou, M.; et al. Monitoring and Evaluation of Ecological Benefits of the Grain for Green Project (LY/T 2573-2016); China Standard Press: Beijing, China, 2016. (In Chinese) [Google Scholar]
  28. Wang, B.; Yang, F.W.; Guo, H.; Li, S.N.; Wang, Y.; Ma, X.Q.; Yu, X.X.; Lu, S.W.; Wang, H.W. Specifications for Assessment of Forest Ecosystem Services in China; LY/T 1721-2008; Standards Press of China: Beijing, China, 2008; pp. 9–10. (In Chinese) [Google Scholar]
  29. Wang, B.; Lu, S.W.; Li, H.J.; Chang, W.; Yu, C.Q.; Xue, P.P. Observation Methodology for Long-Term Forest Ecosystem Research; LY/T1952-2011; Standards Press of China: Beijing, China, 2011; p. 8. (In Chinese) [Google Scholar]
  30. Wang, B.; Niu, X.; Jiang, Y.X.; Wang, X.S.; Wang, D.; Song, Q.F.; Lu, S.W.; Zhou, M.; Ding, F.J.; You, W.Z.; et al. Methodology for Field Long-Term Observation of Forest Ecosystem (GB/T33027-2016); Standard Press: Beijing, China, 2016. (In Chinese) [Google Scholar]
  31. Wang, B.; Niu, X.; Jiang, Y.X.; Guo, Q.S.; Liu, S.R.; Yang, F.W.; Song, Q.F. Indicators System for Long-Term Observation of Forest Ecosystem (GB/T35377-2017); Standard Press: Beijing, China, 2017. (In Chinese) [Google Scholar]
  32. Fang, Y.Y.; Wang, B.; Niu, X. Effects of surface roughness on leaf particulate matter capture capability and rain wash-off characteristics. J. Soil Water Conserv. 2015, 29, 110–115, (In Chinese with English abstract). [Google Scholar]
  33. Zhang, W.K.; Wang, B.; Niu, X. Study on the adsorption capacities for airborne particulates of landscape plants in different polluted regions in Beijing (China). Int. J. Environ. Res. Public Health 2015, 12, 9623–9638. [Google Scholar] [CrossRef] [Green Version]
  34. Qiu, H.Z.; Lin, B.F. Principle and Application of Structural Equation Model; China Light Industry Press: Beijing, China, 2012; pp. 86–90. (In Chinese) [Google Scholar]
  35. Wang, T. Soil erosion is influenced by grain for green policy in loess plateau area of northern Shaanxi, China. Int. J. Environ. Prot. Policy 2015, 3, 129–136. [Google Scholar] [CrossRef] [Green Version]
  36. Zhou, Z.C.; Gan, Z.T.; Shangguan, Z.P.; Dong, Z.B. China’s grain for green program has reduced soil erosion in the upper reaches of the Yangtze River and the middle reaches of the Yellow River. Int. J. Sustain. Dev. World Ecol. 2009, 16, 234–239. [Google Scholar] [CrossRef]
  37. Breshears, D.D.; Whicker, J.J.; Johansen, M.P.; Pinder, J.E. Wind and water erosion and transport in semi-arid shrubland, grassland and forest ecosystems: Quantifying dominance of horizontal wind-driven transport. Earth Surf. Proc. Land. 2010, 28, 1189–1209. [Google Scholar] [CrossRef]
  38. Wang, X.H.; Lu, C.H.; Fang, J.F.; Shen, Y.C. Implications for development of grain-for-green policy based on cropland suitability evaluation in desertification-affected north China. Land Use Policy 2007, 24, 417–424. [Google Scholar] [CrossRef]
  39. Lin, F.; Xu, J. Farmers’ willingness to participate in the next-stage grain-for-green project in the three gorges reservoir area, China. Environ. Manag. 2015, 56, 505–518. [Google Scholar]
  40. Musick, H.B.; Gillette, D.A. Field evaluation of relationships between a vegetation structural parameter and sheltering against wind erosion. Land Degrad. Dev. 1990, 2, 87–94. [Google Scholar] [CrossRef]
  41. Okin, G.S.; Gillette, D.A. Distribution of vegetation in wind-dominated landscapes: Implications for wind erosion modeling and landscape processes. J. Geophys. Res. Atmos. 2001, 106, 9673–9683. [Google Scholar] [CrossRef]
  42. Huang, L.S.; Wang, B.; Niu, X.; Gao, P.; Song, Q.F. Changes in ecosystem services and an analysis of driving factors for China’s natural forest conservation program. Ecol. Evol. 2019, 9, 3700–3716. [Google Scholar] [CrossRef]
  43. Wang, B.; Gao, P.; Niu, X.; Sun, J.N. Policy-driven China’s grain to green program: Implications for ecosystem services. Ecosyst. Serv. 2017, 27, 38–47. [Google Scholar] [CrossRef]
Figure 1. The ecological function zones (State Forestry Administration 2016) and monitoring sites of Grain for Green project in northern China.
Forests 11 00473 g001
Figure 2. Distributed evaluation system for ecological function areas. Note: The distributed evaluation system for sandstorm path/source was the same as for ecological function areas.
Forests 11 00473 g002
Figure 3. Sand fixation by different restoration methods.
Forests 11 00473 g003
Figure 4. Dust retention by different restoration methods.
Forests 11 00473 g004
Figure 5. Sand fixation by different forest types.
Forests 11 00473 g005
Figure 6. Dust retention by different forest types.
Forests 11 00473 g006
Figure 7. Sand fixation by different ecological function zones.
Forests 11 00473 g007
Figure 8. Dust retention by different ecological function zones.
Forests 11 00473 g008
Figure 9. Results of Structural Equation Models for the effects of impact factors on the variation of sand fixation (a) and dust retention (b) for Grain for Green project.
Forests 11 00473 g009
Table 1. Grain for Green project areas by restoration methods and forest types in different provinces, Northern China.
ProvincesTotal
(×104 hm2)
Restoration Methods (×104 hm2)Forest Types (×104 hm2)
Cropland AfforestationWasteland AfforestationFacilitate AfforestationEcological ForestsEconomic ForestsShrubs
Heilongjiang17.7217.7217.680.04
Jilin11.8911.8910.850.280.76
Liaoning9.129.127.471.540.11
Hebei45.9820.5420.884.5626.580.6418.76
Inner Mongolia246.3777.25158.0211.184.021.6160.76
Shanxi (West)9.339.331.440.757.14
Shanxi (East)0.030.03<0.010.03
Gansu13.280.397.145.754.598.69
Ningxia10.726.252.651.820.480.1710.07
Xinjiang36.6618.156.2612.2510.795.5120.36
Total401.1170.67194.9535.48163.910.52226.68
Table 2. Condition of 45 ecological functional areas.
CodeCondition of Ecological Functional Areas
TemperatureMoistureSoil Erosion
IA-1Cold temperate zoneHumidMild wind erosion
IIA-1Middle temperate zoneHumidMild wind erosion
IIA-2Middle temperate zoneHumidModerate water erosion
IIB-1Middle temperate zoneSemi-humidModerate water erosion & intensity wind erosion
IIB-2Middle temperate zoneSemi-humidModerate water erosion
IIB-3Middle temperate zoneSemi-humidIntensity wind erosion
IIB-4Middle temperate zoneSemi-humidMild water erosion
IIB-5Middle temperate zoneHumidMild wind erosion & moderate water erosion
IIB-6Middle temperate zoneSemi-humidMild wind erosion
IIB-7Middle temperate zoneSemi-humidSlight water erosion
IIB-8Middle temperate zoneSemi-humidSlight wind erosion
IIC-1Middle temperate zoneSemi-aridModerate water erosion & intensity wind erosion
IIC-2Middle temperate zoneSemi-aridModerate water erosion
IIC-3Middle temperate zoneSemi-aridIntensity wind erosion
IIC-4Middle temperate zoneSemi-aridSevere wind erosion
IIC-5Middle temperate zoneSemi-aridIntensity water erosion & extreme intensity wind erosion
IIC-6Middle temperate zoneSemi-aridIntensity water erosion & slight wind erosion
IIC-7Middle temperate zoneSemi-aridModerate water erosion & mild wind erosion
IIC-8Middle temperate zoneSemi-aridMild wind erosion
IIC-9Middle temperate zoneSemi-aridSlight wind erosion
IID-1Middle temperate zoneAridModerate wind erosion
IID-2Middle temperate zoneAridSevere wind erosion
IID-3Middle temperate zoneAridIntensity water erosion & intensity wind erosion
IID-4Middle temperate zoneAridIntensity wind erosion
IID-5Middle temperate zoneAridExtrem intensity water erosion & extrem intensity wind erosion
IID-6Middle temperate zoneAridExtrem intensity wind erosion
IID-7Middle temperate zoneAridSlight water erosion
IID-8Middle temperate zoneAridSlight wind erosion
IIIB-1warm temperate zoneSemi-humidModerate water erosion
IIIB-2warm temperate zoneSemi-humidModerate wind erosion
IIIB-3warm temperate zoneSemi-humidMild water erosion
IIIB-4warm temperate zoneSemi-humidIntensity water erosion
IIIC-1warm temperate zoneSemi-aridModerate water erosion
IIIC-2warm temperate zoneSemi-aridIntensity water erosion & intensity wind erosion
IIIC-3warm temperate zoneSemi-aridIntensity water erosion
IIIC-4warm temperate zoneSemi-aridExtrem intensity water erosion & extrem intensity wind erosion
IIIC-5warm temperate zoneSemi-aridIintensity water erosion & extrem intensity wind erosion
IIIC-6warm temperate zoneSemi-aridExtrem intensity water erosion
IIID-1warm temperate zoneAridSevere wind erosion
IIID-2warm temperate zoneAridExtrem intensity wind erosion
HID-1Plateau subfrigid zoneAridExtrem intensity wind erosion
HIIC-1Plateau subfrigid zoneSemi-aridModerate wind erosion
HIID-1Plateau subfrigid zoneAridModerate wind erosion
HIID-2Plateau subfrigid zoneAridSevere wind erosion
HIID-3Plateau subfrigid zoneAridExtrem intensity wind erosion
Table 3. Distribution of assessment units by assessment levels.
Classification 1st Assessment Units2nd Assessment Units3rd Assessment Units4th Assessment Units5th Assessment UnitsTotal
Ecological function zonesTypesEcological function zonesCounties, districtsRestoration typesForest typesTree species
Number4544233261986
Important windbreak and sand fixation areasTypesImportant ecological function zones for windbreak and sand fixationCounties, districtsRestoration typesForest typesTree species
Number7783311309
Sandstorm pathTypesSandstorm pathCounties, districtsRestoration typesForest typesTree species
Number11553315650
Sandstorm sourceTypesSandstorm sourceCounties, districtsRestoration typesForest typesTree species
Number11033312536,103
Table 4. Driving factors on the variation of sand fixation (Y1) and dust retention (Y2) for Grain for Green project based on Structural Equation Model.
Driving FactorsTitleUnitsData Source
Climatic Factors (L1)Annual average precipitation (M1)mmChina Statistical Yearbook (2015)
Annual average temperature (M2)°CChina Statistical Yearbook (2015)
Land Surface
factors (L2)
Terrain slope (M3)°The altitude based on Digital Elevation Model in China from SRTM (Shuttle Radar Topography Mission) (1 km)
Serious desertification rate (M4)%Bulletin of Desertification and Sandification State of China (2015)
Wind erosion modulus (M5)t·hm−2·a−1Spatial distribution of soil erosion in China
Policy Factors (L3)Policy governance area of the GGP (M6)hm2Investigation of GGP; Forest resources inventory data
Investment amount of GGP (M7)×108 CNY·a−1Investigation of GGP; Forest resources inventory data
Ecological forest ratio (M8)%Investigation of GGP; Forest resources inventory data
Socio-Economic factors (L4)Population density (M9)Person·km−2China Statistical Yearbook (2015)
Farmer’s net income (M10)CNY·a−1China Statistical Yearbook (2015)
Industrial and agricultural production proportion (M11)%China Statistical Yearbook (2015)
Crop output (M12)×104 tChina Statistical Yearbook (2015)
Table 5. Sand fixation and dust retention by different restoration methods, and forest types and ecological function zones.
Forest Ecosystem ServicesSand Fixation (×104 t·a−1)Dust Retention (×104 t·a−1)
Restoration TypesCropland AfforestationWasteland AfforestationFacilitate AfforestationCropland AfforestationWasteland AfforestationFacilitate Afforestation
Quantities38,177.4742,958.8710,782.321809.382037.13404.20
Proportion41.53%46.74%11.73%42.57%47.92%9.51%
Forest TypesEcological forestsEconomic forestsShrubsEcological forestsEconomic forestsShrubs
Quantities38,069.603123.6150,725.452280.72105.841864.15
Proportion41.42%3.40%55.18%53.66%2.49%43.85%
Ecological Function AreaWind erosion dominant areaWind and water erosion co-dominant areaWater erosion dominant areaWind erosion dominantWind and water erosion co-dominant areaWater erosion dominant area
Quantities47,490.2823,817.5620,610.821939.411257.741053.56
Proportion51.67%25.91%22.42%45.63%29.58%24.79%
Table 6. Sand fixation and dust retention in seven important windbreak and sand fixation areas.
Important Windbreak and Sand Fixation AreasSand Fixation
(×104 t·a−1)
Contribution Rate (%)Dust Retention
(×104 t·a−1)
Contribution Rate (%)
Horqin sandy land5615.6814.12%239.7612.61%
Hulunbeier Prairie344.770.87%32.551.71%
Hunshandake sandy land11,552.929.04%524.7727.59%
North of Yinshan mountain10,158.3725.53%585.0630.76%
Ordos Plateau9244.8423.24%414.321.78%
Heihe middle and lower reaches709.211.78%28.491.50%
Tarim River Basin2156.825.42%77.124.05%
Total39,782.59 1902.05

