Article

Carbon and Macronutrient Budgets in an Alder Plantation Grown on a Reclaimed Combustion Waste Landfill

1
Department of Ecology and Silviculture, Faculty of Forestry, University of Agriculture in Krakow, Al. 29 Listopada 46, 31-425 Krakow, Poland
2
Department of Soil Science and Agrophysics, Faculty of Agriculture and Economics, University of Agriculture in Krakow, Al. Mickiewicza 21, 30-120 Krakow, Poland
3
Department of Environmental Management and Protection, AGH University of Science and Technology, Al. Mickiewicza 30, 30-059 Krakow, Poland
4
Institute for Environmental Studies, Faculty of Science, Charles University, Benátská 2, CZ128 00 Prague, Czech Republic
*
Author to whom correspondence should be addressed.
Forests 2020, 11(4), 430; https://doi.org/10.3390/f11040430
Submission received: 21 February 2020 / Revised: 30 March 2020 / Accepted: 6 April 2020 / Published: 10 April 2020
(This article belongs to the Section Forest Ecology and Management)

Abstract

:
Combustion waste landfills are unfavorable for revegetation due to nitrogen deficiency, and therefore, the introduction of nitrogen-fixing organisms, such as alder species (Alnus sp.), may be promising for reclamation and restoration of these sites. We investigated the carbon and macronutrient stocks in the combustion waste technosols and biomass of black alder (Alnus glutinosa) and grey alder (Alnus incana) 10 years after introduction onto a combustion waste landfill. The alder species were planted with or without lignite addition in planting holes, the latter acting as control plots. Black alder biomass was higher than that of grey alder. The total macronutrient stocks were higher in the uppermost technosol layer (0–30 cm) than in the biomass nutrient stocks. However, the K and P stocks in the black alder biomass were still greater than the exchangeable K+ and available phosphorus (Pav) stocks in technosols. This is important for the nutrition of the trees planted in combustion waste landfills and confirms the Pav deficit in investigated technosols. The differentiation of nutrients in biomass shows that the largest stock was found in the wood of trunks and branches (40–70% of the stock of individual biomass macronutrients). Although foliage biomass represented approximately 7% of the total tree biomass, the nutrient stocks therein represented a significant proportion of total nutrient stocks: approximately 27–29% nitrogen, 17–22% calcium, 28% magnesium, 7–10% potassium and 12–16% phosphorus. This is particularly important in the context of the turnover of nutrients from litterfall and soil organic matter and the circulation of nutrients in the ecosystem developed on combustion waste technosols.

1. Introduction

Production of electricity from lignite involves the creation of a large amount of combustion waste. Combustion waste is used, among other purposes, as a cement component in concrete [1,2] and as an additive for improving reclaimed mine soils (RMS) or other degraded soils for forestry and agriculture [3]. However, most combustion waste is stored on different types of landfills [4], which is environmentally problematic because of wind erosion and dust pollution. Their adverse effects could be limited, however, by biological stabilization [5,6], which may be difficult due to the unfavorable properties of combustion waste in soil [7,8].
Combustion waste is characterized by poor air and water ratios, strong susceptibility to compaction, high alkalinity, and lack of soil organic matter (SOM) and nutrients, particularly N and P [9,10]. Therefore, in assessments of the biological stabilization of combustion waste disposal sites, particular attention has been devoted to the N–fixing species [6,11,12]. In a temperate climate, alder species (Alnus spp.) may be a promising N–fixing species for the revegetation of combustion waste landfills [6,7]. Previous studies have revealed good growth and adaptation of black (Alnus glutinosa Gaertn.) and grey alder (A. incana (L.) Moench) to combustion waste landfills during the first 10 years of growth [6,7]. However, under such unfavorable conditions, the nutrient uptake by trees is the primary obstacles to survival and growth of introduced species [6]. Observations from reclaimed post-mining areas indicate the gradual death of alder populations within 15–20 years [6,13]. This is beneficial for further forest maintenance, since after preparing the habitat for more demanding target species such as oak, the alders disappear, reducing competition for light and nutrients [7,13].
The most critical issue in new ecosystem development is the establishment of sustainable circulation of nutrients and energy [14]. Understanding C and nutrient stock changes in the developed ecosystem components (e.g., soil, litter and biomass) is a vital step in developing management practices that enhance ecosystem functions [15,16]. Nutrient supply and accumulation in biomass are indicators of stand vitality and growth [17]. In post-industrial areas, after a period of intensive tree growth, it is possible to harvest the alders for energy production purposes [18]. Understanding nutrient allocation in the individual ecosystem components allows for the determination of the total nutrient pool loss caused by the harvesting of trees [17]. This is particularly important in reclaimed post-industrial sites with frequent deficiencies and disturbed nutrient relationships in the soil [6,19].
Carbon sequestration (Cseq) in technosols and accumulation in biomass may provide the additional benefit of restoring new ecosystems on post-industrial sites [15,20] and of phytoremediation [21]. Due to their frequent placement in urbanized and densely populated regions, post-industrial facilities such as combustion waste landfills may provide a means for increased local carbon sequestration. Similar to that of reclaimed post-mining sites, the rate of Cseq in post-industrial areas such as combustion waste disposal sites may even be higher than that of natural forest soils [15,22]. Nitrogen-fixing species are considered to contribute to a greater increase in the rate of Cseq than other plant species [23,24]. The stabilization of SOM under N–fixing species is most likely associated with biological changes in the soil due to the inflow of N–rich litterfall [24,25]. A high N content accelerates the process of litterfall mineralization in the first stages of decomposition, while in the later phases, N contributes to the formation of degradation–resistant humic compounds [25].
Considering the N–fixation and restoration potential of alder species, the objectives of the present study were to determine the C and nutrient stocks in the biomass of two alder species grown in technosols after a 10-year restoration experiment (autumn 2015). We continued the assessment of black and grey alder growth and adaptation in this long-term experiment by performing a full randomized experiment at the Bełchatów Power Plant disposal site. We tested three hypotheses: (i) carbon and nutrients stocks in the biomass will depend on the species of alder and soil treatments (lignite amendments); (ii) a significant proportion of the nutrient pool will have accumulated in the leaves and fine roots that play a central role in the formation of SOM; and (iii) the stock of carbon and macronutrients accumulating in the development of technosol will be greater than that in alder biomass.

2. Materials and Methods

2.1. Study Site

The research area was the Lubień combustion waste disposal site (Central Poland, 51.2752 N; 19.2624 E; Figure 1), which stores waste, comprised of ca. 85% ash and 15% slag, from lignite combustion at the Bełchatów Power Plant. The disposal site currently occupies approximately 440 ha and has been in use since 1980 [7,11].
The research was conducted on a permanent experimental field established in 2006 and designed to evaluate the growth and adaptation of different alder species on the combustion waste disposal site. In September 2005, the Bełchatów Power Plant hydro–seeded the experimental field with sludge (4 Mg per hectare) mixed with grass seed (200 kg per hectare; primarily cat grass (Dactylis glomerata) and Italian rye (Lolium multiflorum). In the same year, NPK fertilizer was applied to the field at 60-36-36 kg ha−1. In the spring of 2006, black, grey and green alder (Alnus glutinosa, A. incana and A. viridis, respectively) were planted in randomly selected plots (6 × 13 m in 3 blocks, 50 seedlings per plot). The plots were separated by 2 m wide strips. The three alder species (Sp) were planted using two treatments with 4 replications of each species/treatment combination. The two treatments (Tr) consisted of adding lignite culm (pH = 5.6, 3 dm3 per planting hole) or no soil amendments in control plots [6,7]. The properties of the lignite culm used as an amendment were reported by Krzaklewski et al. [7]. Green alder introduced to the combustion waste landfill experienced gradual regression and is a shrub species, while black and grey alder did not. For this reason, plots with green alder were not included in this study. The following variants were selected: B-FA—black alder planted in pure combustion waste, G-FA—grey alder planted in pure combustion waste, B-FA+L—black alder planted in combustion waste with lignite addition in planting holes and G-FA+L—grey alder planted in combustion waste with lignite addition in planting holes (Figure 2).

2.2. Soil Study

In the autumn of 2015, mixed soil samples were collected from the 0–30 cm horizons of 5 points distributed diagonally across each plot. Independently, samples with intact structures were collected with 250 cm3 cylinders to determine the bulk density (BD). In addition, four samples of freshly deposited combustion waste were collected to determine the initial properties of the waste. Samples of the organic horizons (litter layer, Oi + Oe) were collected from five 1.0-m2 squares within each study plot. Each sample of the litter layer in the fresh state was weighed with an electronic balance to an accuracy of 1 g, and mixed samples were considered representative of each test area.
For the samples of mineral horizons (0–30 cm), the following parameters were determined: the texture was measured with a Fritsch GmbH Laser Particle Sizer ANALYSETTE 22, pH was measured potentiometrically in 1 M KCl with a 1:2.5 soil-solution ratio, and the total organic carbon (TOC) and total nitrogen (Ntot) contents were determined using a LECO TruMac® CNS. Before determining the carbon content, the soil samples were treated with 10% HCl to remove carbonates. The total concentrations of all forms of macronutrients (Catot, Mgtot, Ktot, and Ptot) were determined after digestion in HNO3 (d = 1.40) and 60% HClO4 in a 4:1 ratio, and exchangeable forms (Ca2+, Mg2+ and K+) in 1 M NH4Ac using an ICP-OES iCAP™ 6000 Series spectrophotometer. The content of phosphorus available for plants (Pav) was determined in an extract of calcium lactate ((CH3CHOHCOO)2Ca) according to the Egner–Riehm method [26,27].
Samples collected intact with cylinders were sieved (2-mm mesh size), weighed, dried at 105 °C for 5 h and reweighed. The final weight was used to calculate the dry weight of the original sample, which was then divided by the volume to obtain the BD of the fine fraction (<2 mm) [16,28].
The samples of organic horizons (Oi + Oe) were oven-dried to remove moisture, and the measured moisture loss was used to calculate the dry mass. Dried samples were ground, and C and N content was determined using a LECO TruMac® CNS, pH was measured potentiometrically in 1 M KCl in a 1:5 ratio. Calcium, Mg, K and P were measured after digestion in a mixture of HNO3 acids (d = 1.40) and 60% HClO4 on an ICP-OES iCAP™ 6000 Series spectrophotometer [26,27].

2.3. Alder Biomass Study

The diameter at breast height (DBH) and height (H) of the planted alder trees were measured in autumn 2015. The aboveground biomass of trees and leaves was estimated according to an allometric equation developed for young stands (6–20 years) growing in the climate of Poland (according to Ochał [29]). The coarse root biomass (>2 mm) was estimated as 25% of the total biomass [30]. The coarse roots and wood samples were collected from five trees regularly distributed along the diagonal of each plot. Leaves were also collected in summer from the crown top of the southwest exposure of five trees regularly distributed along the diagonal of each plot.
To determine the biomass of fine roots (diameter < 2 mm), five-volume samples (500 cm3) of the rooted soil layer were collected to a depth of 30 cm. The samples were pre-sieved in the field using a 2 mm mesh and transported in plastic bags to the laboratory.
Samples of fine roots were stored at 4 °C for no more than 2 weeks. To isolate the roots, the samples were successively rinsed in distilled water. The fine root fraction (<2 mm) was measured with calipers, then dried at 65 °C and weighed on a laboratory scale with an accuracy of ±10 mg.
In the samples of biomass components (wood, leaves, and coarse and fine roots), the C and N contents were determined using a LECO TruMac® CNS and the Ca, Mg, K and P contents using an ICP-OES iCAP™ 6000 Series spectrophotometer after digestion in a mixture of HNO3 acids (d = 1.40) and 60% HClO4 acid in a 4:1 ratio.

2.4. Nutrient Stock and Carbon Accumulation

The nutrient stocks (C, N, Ca, Mg, K and P) in organic (Oi + Oe) and mineral (0–30 cm) horizons of technosols were calculated by the equation:
Estock(Oi+Oe) (Mg ha−1) = MOi+Oe (Mg ha−1) × Econc(Oi+Oe) (%)/100,
in which Estock(Oi+Oe) represents the nutrient stock in organic horizons (Oi+Oe), MOi+Oe is the dry mass of Oi+Oe and Econc is the nutrient concentration in Oi+Oe
Estock(mineral) (Mg ha−1) = Econc(mineral) (%) × BD (g cm−3) × T (cm),
in which Estock(mineral) represents the nutrient stock in the mineral horizons, Econc(mineral) is the nutrient concentration in mineral horizons, BD is the bulk density of the fine fraction (<2 mm), and T is the thickness of the soil layer.
To determine the soil organic carbon (SOC) and N stocks in technosols, the carbon and N contents in samples of freshly deposited combustion waste were subtracted from that determined for the soil samples collected from the alder plots. The contents of C and N in the samples of freshly deposited combustion waste corresponded approximately to the content of unburned organic carbon generated during the lignite combustion process at the power plant [31].
The nutrient stocks in alder biomass were calculated from the formula:
Estock(B) (Mg ha−1) = Σ(B (Mg ha−1) × Econc(B) (%)/100),
in which Estock(B) represents the nutrient stocks in total biomass of trees, B is the biomass of components (fine roots, coarse roots, wood and leaves) and Econc(B) is the nutrient concentration in components of biomass.
Carbon accumulation was calculated by dividing the C stocks in technosols and alder biomass by the tree age.

2.5. Statistical Analyses

The effects of soil treatment (Tr) and alder species (Sp) on the studied technosol and biomass parameters were analyzed using two-way ANOVA. The differences (significance assigned at p < 0.05) between mean values of the measured parameters were calculated using Tukey’s test (HSD). Statistical analyses were performed using STATISTICA 13.1 software [32].

3. Results

3.1. Basic Soil Parameters

Freshly deposited combustion waste (fly ash, FA) was characterized by alkalinity (pH [in H2O] = 8.52), and low unburned C (1.56%) and N (0.025%) content. The P and Mg contents in freshly deposited FA were similar to those of technosols under alder species. Potassium content in freshly deposited FA was significantly lower than in technosols, and the Ca content in freshly deposited FA was higher than in technosols under alder species (Table 1).
The alder species and soil treatment had no impact on BD, pH and concentrations of macronutrient (P, K, Ca and Mg) in technosols. The SOC content (after subtracting unburnt lignite in the balance sheet) ranged from 1.48% (G+FA) to 33.35% (G+FA+L). The Ntot content in technosols (after subtracting unburnt N in the balance sheet) varied from 0.01% to 0.02% (Table 1).

3.2. Carbon and Macronutrient Stocks in Technosols
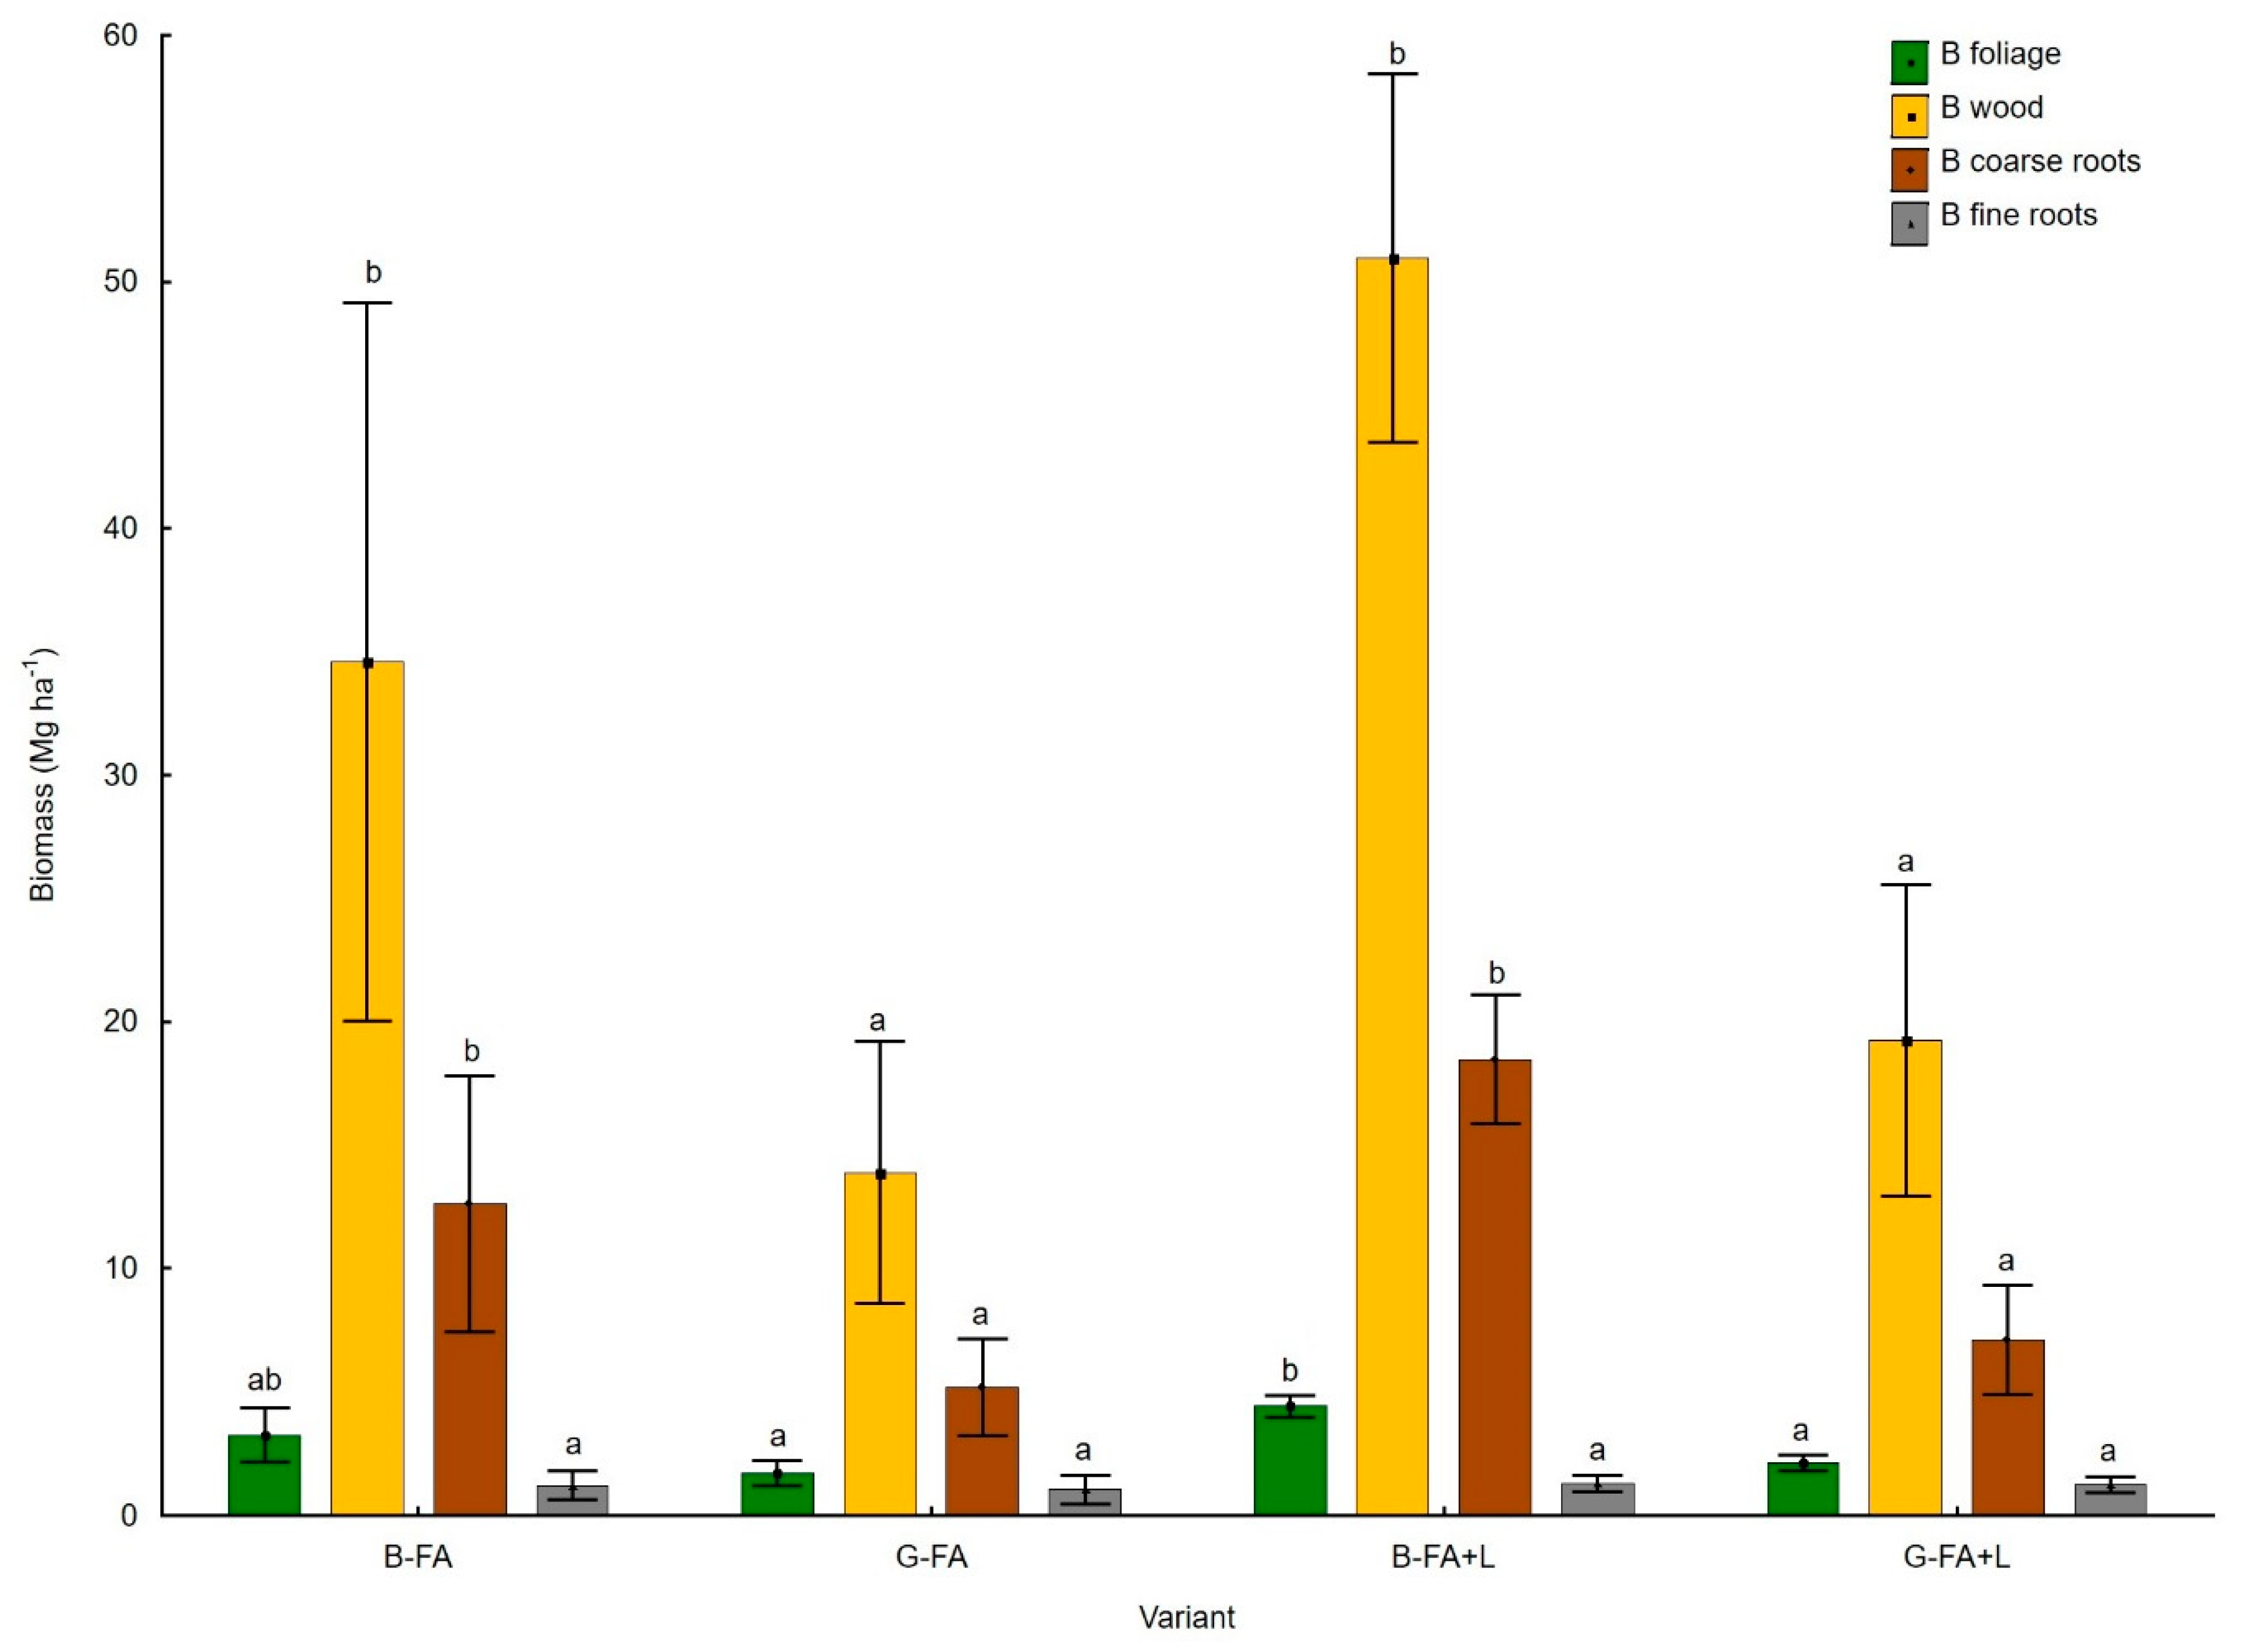
Both alder species and lignite amendment had no impact on the carbon and different forms of macronutrient (N, P, K, Ca and Mg) stocks in technosols (Table 2). The C stocks in the uppermost litter (Oi + Oe) horizon varied from 1.02 Mg ha−1 in G-FA to 1.39 Mg ha−1 in B-FA+L. The C stocks in the 0–30 layer ranged from 5.37 Mg ha−1 in G-FA to 8.95 Mg ha−1 in B-FA. The Ntot stocks in Oi + Oe horizon varied from 0.062 Mg ha−1 in B-FA to 0.074 Mg ha−1 in B-FA+L and the 0–30 layer from 0.441 Mg ha−1 in G-FA+L to 0.516 Mg ha−1 in B-FA (Table 2).
In technosols, the available Pav stocks represented 8–15% of the Ptot stocks, and the exchangeable K+ represented 6–9% of Ktot stocks. The exchangeable Ca2+ stocks represented approximately 13–15% of Catot stocks and exchangeable Mg2+ 3–4% of Mgtot stocks (Table 2).

3.3. Alder Biomass

Both the alder species and the modified lignite had an impact on the biomass parameters (Table 3). Black alder displayed higher biomass values than the grey alder. Only the fine root biomass was not significantly different between the two alder species. The total biomass (sum of wood, leaves, coarse and fine roots) ranged from 19.77 to 67.80 Mg ha−1 and aboveground biomass from 15.6 to 55.41 Mg ha−1, respectively, for G-FA and B-FA+L variants (Figure 3).

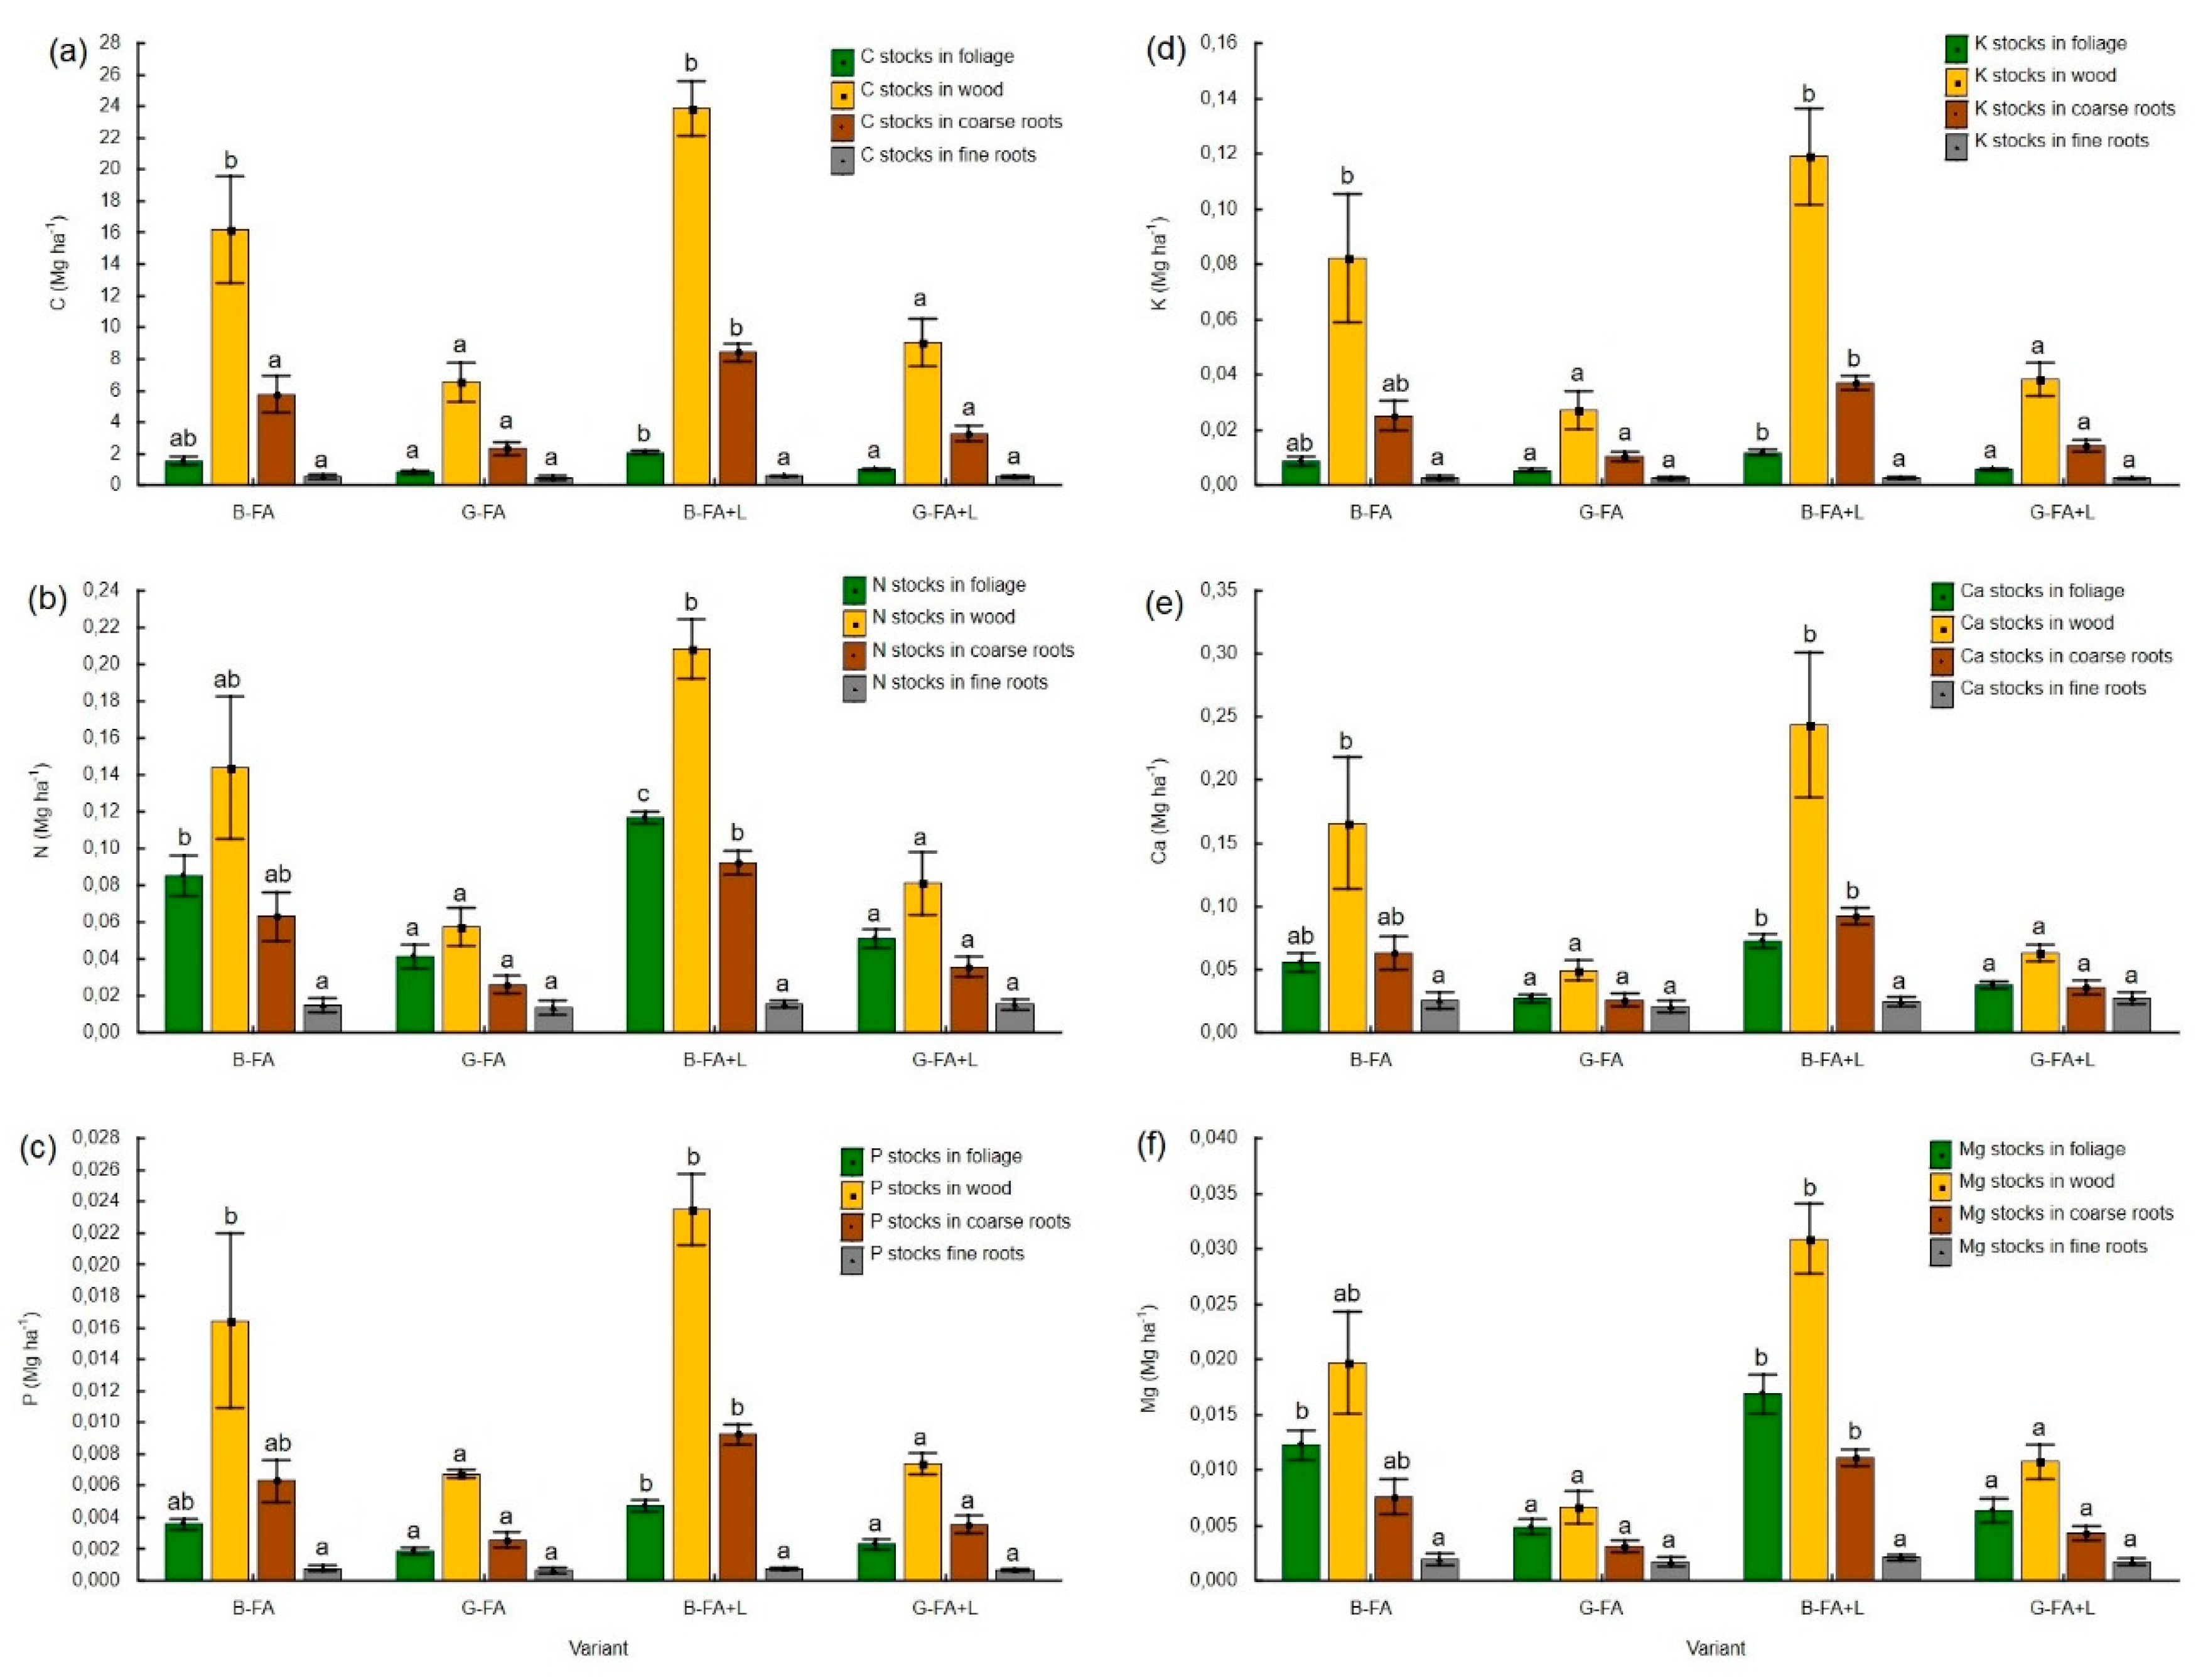
3.4. Carbon and Macronutrient Stocks in Biomass

Similar to the alder biomass, the total carbon stocks in the biomass depended both on the tree species and lignite amendments (Table 3). The total carbon stocks (in below and aboveground biomass) ranged from 10.13 Mg ha−1 in G-FA to 34.95 Mg ha−1 in B-FA+L (Figure 4a). The wood accumulated from 64% (G-FA) to 68% (B-FA+L) of C stocks in total biomass. Coarse roots accounted for approximately 24% of C stocks, foliage accounted for 6% (B-FA+L) to 8% (G-FA), and fine roots accounted for from 2% (B-FA+L) to 5% (G-FA) of the total carbon stock of the biomass (Figure 5).
The total N stocks in the biomass depended both on the alder species and lignite amendment (Table 3). The total N stocks (in below and aboveground biomass) ranged from 0.14 Mg ha−1 in G-FA to 0.43 Mg ha−1 in B-FA+L (Figure 4b). The wood biomass accumulated 41% (G-FA) to 48% (B-FA+L) of N stocks. The coarse root biomass accounted for 18% (G-FA) to 21% (B-FA+L) of N stocks, foliage accounted for 27% (B-FA+L) to 30% (G-FA), and fine roots accounted for 4% (B-FA+L) to 10% (G-FA) of the total N stock of the biomass (Figure 5).
The total P, K and Ca stocks in the biomass depended on the alder species but did not depend on the lignite amendment. In contrast, the total Mg stocks in the biomass depended both on the alder species and on the lignite amendment (Table 3). Variant B+FA+L was characterized by the largest accumulation of the remaining nutrients (P, K, Ca and Mg) in the total biomass, and the smallest accumulation was observed for variant G-FA (Figure 4).
The total P stocks in the biomass were 0.012–0.038 Mg ha−1 (Figure 4c). The foliage accounted for 13% (B-FA+L) to 17% (G-FA+L) of P in the total biomass, the wood accounted for 53% (G-FA+L) to 61% (B-FA+L), the coarse roots accounted for 21% (G-FA) to 25% (G-FA+L) and fine roots accounted for 2% (B-FA+L) to 6% (G-FA) (Figure 5).
The total K stocks in the biomass ranged from 0.05 to 0.17 Mg ha−1 (Figure 5d). The foliage accounted for from 8% (B-FA+L) to 12% (G-FA) of K stocks in biomass, and the wood accounted for 59% (G-FA) to 69% (B-FA+L), the coarse roots accounted for approximately 23% in each variant and fine roots 2% (B-FA+L) to 6% (G-FA) (Figure 5).
The total Ca stocks in the biomass ranged from 0.12 to 0.43 Mg ha−1 (Figure 4e). The foliage accumulation accounted for 17% (B-FA+L) to 24% (G-FA+L) of the total Ca in the biomass, the wood accounted for 39% (G-FA+L) to 54% (B-FA+L), coarse roots accounted for 21% (B-FA) to 23% (B-FA+L) and fine roots accounted for 6% (B-FA+L) to 17% (G-FA) (Figure 5).
The total Mg stocks in the biomass ranged from 0.02 to 0.06 Mg ha−1 (Figure 4f). The foliage accumulation accounted for from 27% (G-FA+L) to 31% (B-FA) of the Mg in the total biomass, accumulation in the wood was 40% (G-FA) to 51% (B-FA+L), coarse roots accounted for approximately 18% in each variant, and fine roots accounted for 3% (B-FA+L) to 11% (G-FA) (Figure 5).

3.5. Whole Ecosystem Carbon Accumulation

The ecosystem (soil and biomass) C accumulation varied from 4.47 to 8.94 Mg ha−1 yr−1 and was higher in the black alder variants than the grey alder variants on FA. The alder species and soil treatment had no impact on C accumulation in the technosols, which varied from 2.31 to 4.67 Mg ha−1 yr−1 (Table 4).

3.6. Relationship between the Carbon and Nutrient Stocks in the Biomass and Soil

The alder species affected the ratio of P, K, Ca and Mg stocks in the biomass and Ptot, Pav, K+, Mgtot, Mg2+ Catot and Ca2+ stocks in technosols. For black alder, the biom:soil ratio was usually higher than in the grey alder. The black alder had larger P and K stocks in the biomass relative to the potential resources of Pav and exchangeable K+ in the 0–30 cm technosol horizon (Table 5).

4. Discussion

The estimated biomass obtained for the two alder species (from 19.77 Mg ha−1 for A. incana to 67.80 Mg ha−1 for A. glutinosa) is similar to published data obtained from forests on natural soils. The total aboveground biomass of black alder stands aged 7–18 years in Sweden varied from 35.1 to 77.3 Mg ha−1 [33]. The aboveground biomass of black alder stands in natural sites in Poland varied from 8 to 75 Mg ha−1 at 6–20 years [29]. In a literature review surveying Scandinavia and Eastern Europe (Baltic countries and Russia), the total aboveground biomass of grey alder was reported to vary from 18.5 to 98.6 Mg ha−1 at 9–10 years [34]. Such high biomass confirms the alder species are highly adaptable to growing in combustion waste landfills [6].
The amendment of lignite culm did not affect the nutrient stock values in technosols but affected the nutrient stock in biomass of alders. This is because lignite was used in a small dose (3 dm3) only to the planting holes, which were, in fact, not sampled around at the nearest trunk location. Instead, we collected the soil samples from 5 points distributed diagonally across each plot, not near the root collar of trees. However, the culm improved the conditions of tree growth in the years immediately after planting and achieving growth parameters [7], which would result in higher C, N and Mg stock in alder biomass. The largest stocks of nutrients were found in the stem and branch biomass (Bwood). These results were similar to those obtained from three 21–year-old experimental plantations of black alder (A. glutinosa) in Estonia. The largest amount of N (57.3–67.1%) and P (71.1–83.0%) was allocated to alder stems [35]. Although foliage biomass represented only approximately 7% of the total alder biomass, the nutrient stocks in the foliage biomass represented a significant part of the total nutrient stocks, i.e., approximately 27–29% N, 17–22% Ca, approximately 28% Mg, 7–10% K and 12–16% P. This is particularly important in the context of the creation of soil organic matter from litterfall and the circulation of nutrients in the developing ecosystem on fly ash technosols. In addition to the litterfall from the aboveground biomass, through an annual turnover process of death and renewal, fine roots can significantly contribute to the SOC and nutrient pool in the soil [36,37]. However, our research indicates that fine roots do not constitute a large pool of nutrients (up to 10% for N, P and K) compared to the other components of alder biomass.
The total forms of nutrient (Ntot, Ptot, Ktot, Catot and Mgtot) stocks were greater in the technosols than in the total biomass of the alder species. However, the K and P stocks in black alder biomass were greater than exchangeable K+ and available Pav stocks in technosols. This is important for the nutrition of the trees planted on combustion waste landfills in the future and confirms the deficit of available Pav in combustion waste [6,9]. On oligotrophic sites, the accumulation of nutrients is often greater in the tree biomass than in the soil [38]. The deficits of nutrients in poor soils are balanced by a higher nutrient uptake efficiency [39]. In zones of abundant root biomass, a lower concentration of nutrients is often found in the zone immediately surrounding the roots than in bulk soil. This indirectly confirms that litterfall and its rapid decomposition can play a vital role in the supply of nutrients [40]. However, the rapid production of large amounts of biomass cannot always be the goal of forest management, especially on reclaimed post-industrial sites, as this will result in the depletion of available nutrient resources in soils [38,41]. Black alder, as an N-fixing species, can accelerate the availability of P in soil due to the increased production of phosphatase enzymes [42]. However, Compton and Cole [43] observed a decrease in P availability in soils under red alder (Alnus rubra Bong.) stands, whereas Giardina et al. [44] observed an increase.
Carbon accumulation in technosols under alder species was similar (to 6 Mg ha−1 yr−1) to that for post-mining soils in a temperate climate [15,45] and similar to C accumulation in technosols (3–4 Mg ha−1 yr−1) built from three technogenic parent materials: papermill sludge, thermally-treated industrial soil and green-waste compost [22]. Carbon accumulation in combustion waste technosol was greater than that in reclaimed sandy soils under Scots pine (Pinus sylvestris L.) stands on the sandy mine (0.73–1.08 Mg ha−1 yr−1) and the spoil heap of a sulfur mine (1.15 Mg ha−1 yr−1) [15] and is higher than that in sandy soils under natural succession with Scots pine and common birch (0.14 Mg ha−1 yr−1) on a sandy mine in Poland [14]. Similar results were also obtained on the spoil heap of the Sokolov lignite mine (Czech Republic), where C accumulation in neogene clayey sediments was 0.15 Mg ha−1 yr−1 under natural succession, and 1.28 Mg ha−1 yr−1 under linden (Tilia cordata Mill.) stands [46]. This may be because alders as N–fixing species can promote a more significant increase in the C accumulation rate in soil than other plant species [23,24]. However, our results also demonstrated greater C accumulation than in the reclaimed mine soils under alder stands on the spoil heap of the Sokolov lignite mine (0.92 Mg ha−1 yr−1) [47]. The rate of C accumulation in alder biomass (2.16–5.89 Mg ha−1 yr−1) was similar to or higher than those reported in the literature. For example, the rate of C accumulation in the aboveground plant biomass in the Sokolov spoil heap varied from 0.60 Mg ha−1 yr−1 at the unreclaimed sites to 2.31 Mg ha−1 yr−1 at the larch sites [46]. Carbon accumulation in the biomass depends on the growth dynamics at a young age. Alder species are a pioneer and are characterized by rapid growth at a young age [34,48]. Our results also confirm the high adaptability of alder species to the unfavorable soil conditions of combustion waste landfills [6,7].

5. Conclusions

Our results confirm the high adaptability of the alder species, particularly black alder, and this should be an essential characteristic of the species utilised in the first phase of the biological stabilization of combustion waste disposal sites. However, the K and P stocks were greater in biomass of black alder than exchangeable K+ and available Pav stocks in technosols. This is important for the nutrition of the trees planted on combustion waste landfills in the future and confirms the deficit of the available Pav in combustion waste.
The black alder was characterized by higher biomass than grey alder. The addition of lignite into planting holes positively influenced the ingrowth of the biomass of alder species. The highest amount of nutrients was that which accumulated in the wood of the trunks and branches (40–70% of the stock of the individual macronutrients in the biomass). Although the foliage biomass represented only approximately 7.0% of the total biomass of the trees, the nutrients accumulated in the foliage biomass represented a significant part of the total nutrient stocks, approximately 27–29% N, 17–22% Ca, approximately 28% Mg, 7–10% K and 12–16% P. This is particularly important in the context of SOM recycling from litterfall and the circulation of nutrients in the developing ecosystem on fly ash technosols and the next stage of afforestation by target (climax) species, e.g., oaks or Norway maples. However, vital field study is still needed on the adaptability of such species on combustion waste landfills.

Author Contributions

Conceptualization, M.P. (Marcin Pietrzykowski) and B.W.; methodology, M.P. (Marcin Pietrzykowski) and B.W.; validation, B.W. and A.J.; investigation, M.P. (Marcin Pietrzykowski), M.P. (Marek Pająk), A.J., B.W.; writing—original draft preparation, B.W.; writing—review and editing, M.P. (Marcin Pietrzykowski), A.J., M.P. (Marek Pająk), M.C. and J.F.; visualization, B.W.; supervision, M.P. (Marcin Pietrzykowski) and J.F.; funding acquisition, M.P. (Marcin Pietrzykowski) All authors have read and agreed to the published version of the manuscript.

Funding

This work was supported by The National Science Centre, Poland (grant no. 2015/17/B/ST10/02712) and by the Polish Ministry of Science and Higher Education (no. BM-4459/ZELiR/17, Department of Forest Ecology, Agricultural University of Krakow).

Conflicts of Interest

The authors declare no conflict of interest.

References

  1. McCarthy, M.; Dhir, R.K. Development of high volume fly ash cements for use in concrete construction. Fuel 2005, 84, 1423–1432. [Google Scholar] [CrossRef]
  2. Sua-iam, G.; Makul, N. Utilization of high volumes of unprocessed lignite-coal fly ash and rice husk ash in self-consolidating concrete. J. Clean. Prod. 2014, 78, 184–194. [Google Scholar] [CrossRef]
  3. Ram, L.C.; Masto, R.E. Fly ash for soil amelioration: A review on the influence of ash blending with inorganic and organic amendments. Earth-Sci. Rev. 2014, 128, 52–74. [Google Scholar] [CrossRef]
  4. Iyer, R.S.; Scott, J.A. Power station fly ash—A review of value-added utilization outside of the construction industry. Resour. Conserv. Recycl. 2001, 31, 217–228. [Google Scholar] [CrossRef]
  5. Żołnierz, L.; Weber, J.; Gilewska, M.; Strączyńska, S.; Pruchniewicz, D. The spontaneous development of understory vegetation on reclaimed and afforested post-mine excavation filled with fly ash. Catena 2016, 136, 84–90. [Google Scholar] [CrossRef]
  6. Pietrzykowski, M.; Woś, B.; Pająk, M.; Wanic, T.; Krzaklewski, W.; Chodak, M. Reclamation of a lignite combustion waste disposal site with alders (Alnus sp.): Assessment of tree growth and nutrient status within 10 years of the experiment. Environ. Sci. Pollut. Res. 2018, 25, 17091–17099. [Google Scholar] [CrossRef] [Green Version]
  7. Krzaklewski, W.; Pietrzykowski, M.; Woś, B. Survival and growth of alders (Alnus glutinosa (L.) Gaertn. and Alnus incana (L.) Moench) on fly ash technosols at different substrate improvement. Ecol. Eng. 2012, 49, 35–40. [Google Scholar] [CrossRef]
  8. Weber, J.; Strączyńska, S.; Kocowicz, A.; Gilewska, M.; Bogacz, A.; Gwiżdż, M.; Debicka, M. Properties of soil materials derived from fly ash 11 years after revegetation of post-mining excavation. Catena 2015, 133, 250–254. [Google Scholar] [CrossRef]
  9. Haynes, R.J. Reclamation and revegetation of fly ash disposal sites-challenges and research needs. J. Environ. Manag. 2009, 90, 43–53. [Google Scholar] [CrossRef]
  10. Uzarowicz, Ł.; Zagórski, Z.; Mendak, E.; Bartmiński, P.; Szara, E.; Kondras, M.; Oktaba, L.; Turek, A.; Rogoziński, R. Technogenic soils (Technosols) developed from fly ash and bottom ash from thermal power stations combusting bituminous coal and lignite. Part I. Properties, classification, and indicators of early pedogenesis. Catena 2017, 157, 75–89. [Google Scholar] [CrossRef]
  11. Pietrzykowski, M.; Krzaklewski, W.; Woś, B. Preliminary assessment of growth and survival of green alder (Alnus viridis), a potential biological stabilizer on fly ash disposal sites. J. For. Res. 2015, 26, 131–136. [Google Scholar] [CrossRef]
  12. Pandey, V.C.; Bajpai, O.; Singh, N. Plant regeneration potential in fly ash ecosystem. Urban For. Urban Green. 2016, 15, 40–44. [Google Scholar] [CrossRef]
  13. Pietrzykowski, M. Tree response to soil reconstruction on reclaimed post-mining sites—A key issue in forest ecosystem restoration. In Problems of Forestry in the Mountains and Industrial Region; Orzeł, S., Ed.; Agricultural University of Krakow Publishing: Krakow, Poland, 2015; Chapter 1; pp. 15–39, (In Polish, English Summary). [Google Scholar]
  14. Pietrzykowski, M.; Krzaklewski, W. Soil organic matter, C and N accumulation during natural succession and reclamation in an opencast sand quarry (southern Poland). Arch. Agron. Soil Sci. 2007, 53, 473–483. [Google Scholar] [CrossRef]
  15. Pietrzykowski, M.; Daniels, W.L. Estimation of carbon sequestration by pine (Pinus sylvestris L.) ecosystems developed on reforested post-mining sites in Poland on differing mine soil substrates. Ecol. Eng. 2014, 73, 209–218. [Google Scholar] [CrossRef]
  16. Čížková, B.; Woś, B.; Pietrzykowski, M.; Frouz, J. Development of soil chemical and microbial properties in reclaimed and unreclaimed grasslands in heaps after opencast lignite mining. Ecol. Eng. 2018, 123, 103–111. [Google Scholar] [CrossRef]
  17. Balboa-Murias, M.A.; Rojo, A.; Álvarez, J.G.; Merino, A. Carbon and nutrient stocks in mature Quercus robur L. stands in NW Spain. Ann. For. Sci. 2005, 63, 557–565. [Google Scholar] [CrossRef] [Green Version]
  18. Bungart, R.; Hüttl, R.F. Production of biomass for energy in post-mining landscapes and nutrient dynamics. Biomass Bioenergy 2001, 20, 181–187. [Google Scholar] [CrossRef]
  19. Pietrzykowski, M.; Woś, B.; Haus, N. Scots pine needles macronutrient (N, P, K, CA, MG, and S) supply at different reclaimed mine soil substrates–as an indicator of the stability of developed forest ecosystems. Environ. Monit. Assess. 2013, 185, 7445–7457. [Google Scholar] [CrossRef] [Green Version]
  20. Pandey, V.C. Suitability of Ricinus communis L. cultivation for phytoremediation of fly ash disposal sites. Ecol. Eng. 2013, 57, 336–341. [Google Scholar] [CrossRef]
  21. Mendez, M.O.; Maier, R.M. Phytoremediation of mine tailings in temperate and arid environments. Rev. Environ. Sci. Biol. 2008, 7, 47–59. [Google Scholar] [CrossRef]
  22. Rees, F.; Dagois, R.; Derrien, D.; Fiorelli, J.-L.; Watteau, F.; Morel, J.L.; Schwartz, C.; Simonnot, M.O.; Séré, G. Storage of carbon in constructed technosols: In situ monitoring over a decade. Geoderma 2019, 337, 641–648. [Google Scholar] [CrossRef]
  23. Resh, S.C.; Binkley, D.; Parrotta, J.A. Greater soil carbon sequestration under Nitrogen-fixing trees compared with Eucalyptus species. Ecosystems 2002, 5, 217–231. [Google Scholar] [CrossRef]
  24. Binkley, D. How nitrogen-fixing trees change soil carbon. In Tree Species Effects on Soils: Implications for Global Change; Binkley, D., Menyailo, O., Eds.; Kluwer Academic Publishers: Dordrecht, The Netherlands, 2005; pp. 155–164. [Google Scholar]
  25. Berg, B. Litter decomposition and organic matter turnover in northern forest soils. For. Ecol. Manag. 2000, 133, 13–22. [Google Scholar] [CrossRef]
  26. Ostrowska, S.; Gawlinski, Z.; Szczubialka, Z. Procedures for Soil and Plants Analysis; Institute of Environmental Protection: Warsaw, Poland, 1991. (In Polish) [Google Scholar]
  27. van Reeuwijk, L.P. Procedures for Soil Analysis; ISRIC: Wageningen, The Netherlands, 2002. [Google Scholar]
  28. De Vos, B.; Van Meirvenne, M.; Quataert, P.; Deckers, J.; Muys, B. Predictive quality of pedotransfer functions for estimating bulk density of forest soils. Soil Sci. Am. J. 2005, 69, 500–510. [Google Scholar] [CrossRef]
  29. Ochał, W. The above-ground biomass of trees in young black alder (Alnus glutinosa (L.) Gaertn.) stands. Acta Agrar. Silvestria Ser. Silvestris 2013, 51, 75–89, (In Polish, English Summary). [Google Scholar]
  30. Frouz, J.; Dvorščík, P.; Vávrová, A.; Doušová, O.; Kadochová, Š.; Matějíček, L. Development of canopy cover and woody vegetation biomass on reclaimed and unreclaimed post-mining sites. Ecol. Eng. 2015, 84, 233–239. [Google Scholar] [CrossRef]
  31. Külaots, I.; Hurt, R.H.; Suuberg, E.M. Size distribution of unburned carbon in coal fly ash and its implications. Fuel 2004, 83, 223–230. [Google Scholar] [CrossRef]
  32. StatSoft Inc. (1984–2018) STATISTICA (Data Analysis Software System); Version 13.1. Available online: https://www.statsoft.pl/statistica_13/ (accessed on 8 March 2020).
  33. Johansson, T. Biomass equations for determining fractions of common and grey alders growing on abandoned farmland and some practical implications. Biomass Bioenergy 2000, 18, 147–159. [Google Scholar] [CrossRef]
  34. Aosaar, J.; Varik, M.; Uri, U. Biomass production potential of grey alder (Alnus incana (L.) Moench.) in Scandinavia and Eastern Europe: A review. Biomass Bioenergy 2012, 45, 11–26. [Google Scholar] [CrossRef]
  35. Vares, A. Biomass, nitrogen and phosphorus allocation in above-ground parts of black alder (Alnus glutinosa (L.) Gaertn.) plantations. Balt. For. 2000, 6, 47–52. [Google Scholar]
  36. Burke, M.K.; Raynal, D.J. Fine root growth phenology, production and turnover in a northern hardwood forest ecosystem. Plant Soil 1994, 162, 135–146. [Google Scholar] [CrossRef] [Green Version]
  37. Józefowska, A.; Woś, B.; Pietrzykowski, M. Tree species and soil substrate effects on soil biota during early soil forming stages at afforested mine sites. Appl. Soil Ecol. 2016, 102, 70–79. [Google Scholar] [CrossRef]
  38. Pietrzykowski, M. Scots pine (Pinus sylvestris L.) ecosystem macronutrients budget on reclaimed mine sites–stand trees supply and stability. Nat. Sci. 2010, 2, 590–599. [Google Scholar] [CrossRef] [Green Version]
  39. Aerts, R.; Chapin, F.S. The Mineral Nutrition of Wild Plants Revisited: A Re-evaluation of Processes and Patterns. Adv. Ecol. Res. 1999, 30, 1–67. [Google Scholar]
  40. Marchner, P.; Rengel, Z. Nutrient availability in soils. In Marschner’s Mineral Nutrition of Higher Plants, 3rd ed.; Marschner, P., Ed.; Elservier Ltd.: Oxford, UK, 2012; pp. 315–330. [Google Scholar]
  41. Pietrzykowski, M.; Woś, B.; Pająk, M.; Wanic, T.; Krzaklewski, W.; Chodak, M. The impact of alders (Alnus spp.) on the physico-chemical properties of technosols on a lignite combustion waste disposal site. Ecol. Eng. 2018, 120, 180–186. [Google Scholar] [CrossRef]
  42. Orczewska, A.; Piotrowska, A.; Lemanowicz, J. Soil acid phosphomonoesterase activity and phosphorus forms in ancient and post-agricultural black alder [Alnus glutinosa (L.) Gaertn.] woodlands. Acta Soc. Bot. Pol. 2012, 81, 81–86. [Google Scholar] [CrossRef]
  43. Compton, J.E.; Cole, D.W. Phosphorus cycling and soil P fractions in Douglas-fir and red alder stands. For. Ecol. Manag. 1998, 110, 101–112. [Google Scholar] [CrossRef]
  44. Giardina, C.P.; Huffman, S.; Binkley, D.; Caldwell, B.A. Alders increase soil phosphorus availability in a Douglas-fir plantation. Can. J. For. Res. 1995, 25, 1652–1657. [Google Scholar] [CrossRef]
  45. Vindušková, O.; Frouz, J. Soil carbon accumulation after open-cast coal and oil shale mining in Northern Hemisphere: A quantitative review. Environ. Earth Sci. 2013, 69, 1685–1698. [Google Scholar] [CrossRef]
  46. Frouz, J.; Pižl, V.; Cienciala, E.; Kalčík, J. Carbon storage in post-mining forest soil, the role of tree biomass and soil bioturbation. Biogeochemistry 2009, 94, 111–121. [Google Scholar] [CrossRef]
  47. Bartuska, M.; Frouz, J. Carbon accumulation and changes in soil chemistry in reclaimed open-cast coal mining heaps near Sokolov using repeated measurement of chronosequence sites. Eur. J. Soil Sci. 2015, 66, 104–111. [Google Scholar] [CrossRef]
  48. Claessens, H.; Oosterbaan, A.; Savill, P.; Rondeux, J. A review of the characteristics of black alder (Alnus glutinosa (L.) Gaertn.) and their implications for silvicultural practices. Forestry 2010, 83, 163–175. [Google Scholar] [CrossRef] [Green Version]
Figure 1. Location of the study site.
Forests 11 00430 g001
Figure 2. Conceptual model of the alder species experiment on the Lubień combustion waste disposal site. B-FA—black alder planted in pure combustion waste; G-FA—grey alder planted in pure combustion waste, B-FA+L—black alder planted in combustion waste with lignite addition in planting holes, G-FA+L—grey alder planted in combustion waste with lignite addition. In empty places represent plots with green alder and Miocene sand amendments not included in this study.
Forests 11 00430 g002
Figure 3. Biomass (B) of two alder species grown on a combustion waste landfill.
Forests 11 00430 g003
Figure 4. Nutrient stocks in biomass components of alder species grown on combustion waste landfill: (a) C, (b) N, (c) P, (d) K, (e) Ca and (f) Mg.
Forests 11 00430 g004
Figure 5. The share of nutrient stocks in individual biomass components in total stocks: (a) C, (b) N, (c) P, (d) K, (e) Ca, and (f) Mg.
Forests 11 00430 g005
Table 1. Technosol parameters in freshly deposited fly ash and after 10 years of growth of two alder species, planted with and without lignite amendment.
VariantSiltClayBD 1pH in H2OSOC 6NtotPtotKtotCatotMgtot
Oi + Oe0–30 cmOi + Oe0–30 cmOi + Oe0–30 cmOi + Oe0–30 cmOi + Oe0–30 cmOi + Oe0–30 cmOi + Oe0–30 cm
(%)(g cm−3)(%)
Freshly deposited fly ash1 ± 0a 31 ± 0a--8.52 ± 0.08b-1.56 ± 0.01a-0.025 ± 0.001a-0.02 ± 0.00a-0.05 ± 0.00a-5.55 ± 0.08b-0.37 ± 0.00b
B-FA 219 ± 13b1 ± 1a0.43 ± 0.11a6.39 ± 0.09a7.86 ± 0.03a38.42 ± 2.38a3.33 ± 0.90a1.94 ± 0.14a0.04 ± 0.01a0.07 ± 0.00a0.01 ± 0.00a0.11±0.01ab0.04 ± 0.01a3.37 ± 0.47a6.30 ± 0.55a0.33 ± 0.03a0.32 ± 0.03a
G-FA15 ± 3b1 ± 1a0.56 ± 0.10a6.56 ± 0.19a7.83 ± 0.03a36.17 ± 5.47a1.48 ± 0.68a1.84 ± 0.32a0.03 ± 0.00a0.10 ± 0.01b0.01 ± 0.00a0.12±0.02ab0.04 ± 0.01a3.53 ± 0.63a4.58 ± 1.38a0.30 ± 0.07a0.25 ± 0.05a
B-FA+L10 ± 3b1 ± 0a0.49 ± 0.06a6.45 ± 0.33a7.79 ± 0.07a35.66 ± 8.41a1.83 ± 0.65a1.86 ± 0.25a0.03 ± 0.01a0.07 ± 0.01a0.01 ± 0.00a0.10±0.03a0.04 ± 0.01a3.66 ± 1.14a5.18 ± 0.15a0.34 ± 0.08a0.28 ± 0.01a
G-FA+L23 ± 15b2 ± 1a0.41 ± 0.05a6.35 ± 0.04a7.86 ± 0.03a42.07 ± 2.36a3.35 ± 0.71a2.14 ± 0.15a0.04 ± 0.01a0.10 ± 0.01b0.01 ± 0.00a0.15±0.01b0.04 ± 0.00a2.67 ± 0.29a6.14 ± 1.32a0.25 ± 0.01a0.32 ± 0.05a
Sp 4n.s. 5n.s.n.s.n.s.n.s.n.s.n.s.n.s.n.s.n.s.n.s.n.s.n.s.n.s.n.s.n.s.n.s.
Trn.s.n.s.n.sn.s.n.s.n.s.n.s.n.s.n.s.50.05; 0.000n.s.8.47; 0.013n.s.n.s.n.s.n.s.n.s.
Sp × Trn.s.n.s.5.89; 0.032n.s.n.s.n.s.n.s.n.s.n.s.n.s.n.s.n.s.n.s.n.s.n.s.n.s.n.s.
1 BD bulk density of fine fraction (<0.02 mm); 2 B-FA—variant with black alder planted in pure combustion waste; G-FA—variant with grey alder planted in pure combustion waste; B-FA+L—variant with black alder planted in combustion waste with lignite addition in planting holes; G-FA+L—variant with grey alder planted in combustion waste with lignite addition in planting holes; 3 mean ± SE, within columns, means followed by the different letter (a, b, c) are significantly different; 4 Sp—tree species; Tr—soil treatment; Sp × Tr—interaction alder species and soil treatment; 5 results of two-way ANOVA for the effect of species and treatment, i.e.,: n.s.—differences not significant (p = 0.05); 6 SOC in freshly deposited fly ash = unburned carbon content (Külaots et al. 2004).
Table 2. Carbon and macronutrient (N, Ca, Mg, K and P) stocks in combustion waste technosols developed after 10 years of growth of two alder species, planted either with or without lignite amendment.
VariantSOCTotal FormsAvailable and Exchangeable Forms
NtotPtotKtotCatotMgtotPavK+Ca2+Mg2+
Oi + Oe0–30 cmOi + Oe0–30 cmOi + Oe0–30 cmOi + Oe0–30 cmOi + Oe0–30 cmOi + Oe0–30 cm0–30 cm
(Mg ha−1)
B-FA 11.23 ± 0.29a 245.45 ± 12.7a0.062 ± 0.015a0.516 ± 0.192a0.002 ± 0.001a0.19 ± 0.04a0.004 ± 0.001a0.54 ± 0.19a0.108 ± 0.028a84.1 ± 16.34a0.010 ± 0.002a4.18 ± 0.75a0.02 ± 0.01a0.05 ± 0.01a12.71 ± 2.23a0.16 ± 0.03a
G-FA1.02 ± 0.52a22.11 ± 9.28a0.053 ± 0.030a0.504 ± 0.050a0.003 ± 0.001a0.20 ± 0.02a0.004 ± 0.002a0.77 ± 0.22a0.095 ± 0.028a72.34 ± 15.90a0.009 ± 0.004a3.96 ± 0.54a0.03 ± 0.01a0.05 ± 0.00a9.98 ± 1.13a0.14 ± 0.02a
B-FA+L1.39 ± 0.10a26.7 ± 10.28a0.074 ± 0.010a0.441 ± 0.164a0.003 ± 0.001a0.18 ± 0.01a0.004 ± 0.001a0.56 ± 0.18a0.157 ± 0.084a75.10 ± 2.84a0.014 ± 0.007a4.01 ± 0.08a0.02 ± 0.01a0.05 ± 0.00a10.09 ± 0.76a0.13 ± 0.01a
G-FA+L1.27 ± 0.50a41.96 ± 9.37a0.066 ± 0.028a0.492 ± 0.056a0.003 ± 0.001a0.17 ± 0.03a0.005 ± 0.002a0.54 ± 0.07a0.082 ± 0.034a77.39 ± 17.76a0.008 ± 0.003a4.01 ± 0.66a0.02 ± 0.00a0.04 ± 0.01a10.92 ± 2.47a0.14 ± 0.03a
Sp 3 n.s. 4 n.s.n.s.n.s.n.s.n.s.n.s.n.s.n.s.n.s.n.s.n.s.n.s.n.s.n.s.n.s.
Trn.s.n.s.n.s.n.s.n.s.n.s.n.s.n.s.n.s.n.s.n.s.n.s.n.s.n.s.n.s.n.s.
Sp × Trn.s.n.s.n.s.n.s.n.s.n.s.n.s.n.s.n.s.n.s.n.s.n.s.n.s.n.s.n.s.n.s.
1 B-FA—variant with black alder planted in pure combustion waste; G-FA—variant with grey alder planted in pure combustion waste; B-FA+L—variant with black alder planted in combustion waste with lignite addition in planting holes; G-FA+L—variant with grey alder planted in combustion waste with lignite addition in planting holes; 2 mean ± SE, within columns, means followed by the different letter (a, b, c) are significantly different; 3 Sp—tree species; Tr—soil treatment; Sp × Tr—interaction alder species and soil treatment; 4 results of two-way ANOVA for the effect of species and treatment, i.e.,: n.s.—differences not significant (p = 0.05).
Table 3. Results of two–way ANOVA of the biomass, carbon and macronutrient stocks in the biomass of alder species on fly ash technosols.
CharacteristicSpecies (Sp)Soil Treatment (Tr)Interaction Sp × Tr
FpFpFp
Btot 132.120.00015.590.0358n.s.1n.s.
C stocks32.130.00015.660.0348n.s.n.s.
N stocks28.790.00024.800.0490n.s.n.s.
P stocks24.730.0003n.s.n.s.n.s.n.s.
K stocks23.460.0004n.s.n.s.n.s.n.s.
Ca stocks18.740.0010n.s.n.s.n.s.n.s.
Mg stocks37.430.00016.460.0259n.s.n.s.
1 Btot—total biomass of alder species.
Table 4. Carbon accumulation in alder systems grown on combustion waste landfill.
VariantC Accumulation
(Mg ha−1 yr−1)
SoilBiomassEcosystem
B-FA 14.67 ± 1.26a 24.28 ± 0.81bc8.94 ± 0.88b
G-FA2.31 ± 0.95a2.16 ± 0.34a4.47 ± 1.16a
B-FA+L2.81 ± 1.03a5.89 ± 0.38c8.70 ± 0.72b
G-FA+L4.32 ± 0.96a2.80 ± 0.29ab7.12 ± 1.17ab
Sp 3n.s. 427.23; 0.0009.10; 0.011
Trn.s.5.10; 0.043n.s.
Sp × Trn.s.n.s.n.s.
1 B-FA—variant with black alder planted in pure combustion waste; G-FA—variant with grey alder planted in pure combustion waste; B-FA+L—variant with black alder planted in combustion waste with lignite addition in planting holes; G-FA+L—variant with grey alder planted in combustion waste with lignite addition in planting holes; 2 mean ± SE, within columns, means followed by the different letter (a, b, c) are significantly different; 3 Sp—tree species; Tr—soil treatment; Sp × Tr—interaction alder species and soil treatment; 4 results of two-way ANOVA for the effect of species and treatment, i.e.,: n.s.—differences not significant (p = 0.05).
Table 5. The ratio of the carbon and nutrient resources in the total biomass (Btot) to that in the soils (0–30 cm).
VariantsBtot:SOCBtot:NtotBtot:PtotBtot:KtotBtot:CatotBtot:MgtotBtot:PavBtot:K+Btot:Ca2+Btot:Mg2+
B-FA 11.37 ± 1.02a 20.64 ± 0.22a0.21 ± 0.11a0.38 ± 0.16a0.005 ± 0.002ab0.012 ± 0.005a1.32 ± 0.68a3.03 ± 1.09b0.033 ± 0.016ab0.35 ± 0.14a
G-FA1.21 ± 0.71a0.28 ± 0.07a0.06 ± 0.01a0.08 ± 0.03a0.002 ± 0.000a0.004 ± 0.000a0.48 ± 0.10a0.95 ± 0.13a0.013 ± 0.003a0.12 ± 0.01a
B-FA+L1.91 ± 0.56a0.98 ± 0.64a0.21 ± 0.02b0.65 ± 0.37a0.006 ± 0.001b0.015 ± 0.001b7.28 ± 3.77b3.63 ± 0.54b0.045 ± 0.010b0.48 ± 0.06b
G-FA+L0.40 ± 0.12a0.53 ± 0.12a0.09 ± 0.02a0.12 ± 0.01a0.003 ± 0.001ab0.006 ± 0.001a0.72 ± 0.08a1.83 ± 0.34ab0.019 ± 0.005ab0.19 ± 0.05a
Sp 3n.s. 4n.s.5.22; 0.04n.s.6.00; 0.0312.01; 0.0048.46; 0.0079.45; 0.0095.64; 0.0359.99; 0.008
Trn.s.n.s.n.s.n.s.n.s.n.s.n.s.n.s.n.s.n.s.
Sp × Trn.s.n.s.n.s.n.s.n.s.n.s.n.s.n.s.n.s.n.s.
1 B-FA—variant with black alder planted in pure combustion waste; G-FA—variant with grey alder planted in pure combustion waste; B-FA+L—variant with black alder planted in combustion waste with lignite addition in planting holes; G-FA+L—variant with grey alder planted in combustion waste with lignite addition in planting holes; 2 mean ± SE, within columns, means followed by the different letter (a, b, c) are significantly different; 3 Sp—tree species; Tr—soil treatment; Sp × Tr—interaction alder species and soil treatment; 4 results of two-way ANOVA for the effect of species and treatment, i.e.,: n.s.—differences not significant (p = 0.05).

