Abstract
Lack of knowledge of individual tree growth in species-rich, mixed forest ecosystems impedes their sustainable management. In this study, species-specific models for predicting individual diameter at breast height (dbh) and total tree height (h) growth were developed for 30 tree species growing in mixed and uneven-aged forest stands in Durango, Mexico. Growth models were also developed for all pine, all oaks, and all other species of the genus Arbutus (strawberry trees). A database of 55,158 trees with remeasurements of dbh and h of a 5-year growth period was used to develop the models. The data were collected from 217 stem-mapped plots located in the Sierra Madre Occidental (Mexico). Weighted regression was used to remove heteroscedasticity from the species-specific dbh and h growth models using a power function of the tree size independent variables. The final models developed in the present study to predict dbh and total tree height growth included size variables, site factors, and competition variables in their formulation. The developed models fitted the data well and explained between 98 and 99% and of the observed variation of dbh, and between 77 and 98% of the observed variation of total tree height for the studied species and groups of species. The developed models can be used for estimating the individual dbh and h growth for the analyzed species and can be integrated in decision support tools for management planning in these mixed forest ecosystems.
1. Introduction
Accurate estimates of both current resource levels and the expected resource changes from implementing selected management alternatives are needed to develop tools to support forest management informed decision-making (e.g., [1]). Forest growth models describe the change in size of a tree or another tree attribute or stand-level variable with age. They are used to analyze and estimate different relationships in forest stand development such as species composition, site characteristics, tree competitive status, and silvicultural management (e.g., [2,3,4]). Such models, together with stand regeneration, harvesting, and mortality models, are important tools in long-term forest management systems because they can simulate stand development and production under various management alternatives (e.g., [3,5,6,7]).
Empirical forest tree growth models predict growth as a function of tree attributes (such as tree size, crown ratio, vigor and tree competition) and plot or stand level variables (such as age site index and stand density) [8,9,10,11,12]. In particular, individual-tree diameter and height growth models are a fundamental component of forest growth and yield frameworks and constitute very important tools for sustainable forest management planning [5,7]. Although many factors such as tree size, neighborhood competition and environmental variables, have been proposed as being important in explaining patterns of tree growth, their relative contribution for different species and ecosystems are still subject to debate (e.g., [5,13,14,15]). Improving our knowledge of the controls influencing tree growth is central to better understand forest community organization and dynamics [15], and is also important to the development of sustainable management of forest ecosystems [16].
Understanding the factors that should be included into growth models to explain patterns in mixed-species forest with high species richness is critical for modeling ecological dynamics in such stands [16]. In uneven-aged, mixed-species natural forests, tree-to-tree variation in growth can be considerable within and among species, as well as spatially within a stand (e.g., [17]). This variability results from the structural and compositional complexity that often characterize these forests (e.g., [13,17,18,19]). In this context, an improved understanding of the factors regulating variability in growth rates can lead to better anticipation of individual tree success and community dynamics [17]. Such understanding can help in developing biometric tools to support forest management decision-making in mixed-species stands, including the development of management strategies based on natural stand dynamics (e.g., [18,20,21]). Nevertheless, factors influencing tree growth in structurally complex forests remain poorly understood [18]. Most previous studies of competition and tree growth have focused on plantations, managed forests, and even-aged, relatively young natural forests (e.g., [22,23]). In contrast, studies analyzing individual tree growth in mixed forest ecosystems are relatively more scarce (e.g., [13,17,18,24]), but have received increased attention in the last decades due to a worldwide trend in managing such forests to improve the biodiversity and ecosystems services and to assure long-term sustainable forest resources [3,25].
The Sierra Madre Occidental in the Mexican State of Durango constitutes a hotspot of forest biodiversity, being home to about five million hectares of species-rich and uneven-aged forest stands [26]. It is the first forest reserve in Mexico with an estimate of 422.1 million m3 of timber volume, and represents 22.4% of the total estimated production at the national level [27,28]. In 2015, Durango produced 28.5% of the total timber volume harvested in Mexico [3]. These forests are dominated by irregular and multispecies stands [29], and have been subject to selective harvesting for more than a century to provide a mix of services to local communities [30]. Although the main objective of forestry in Durango has been timber production, increased emphasis is being given to the concepts of ecological sustainability and biodiversity. Consequently, the development of forest growth models for mixed and uneven-aged stands is imperative to be used as important tools to support the informed decision-making in this type of forest ecosystems. To date in Durango, forest growth studies have been conducted on site quality [31,32,33], stand density management [28], dbh growth models [3], tree competition [34,35], tree volume and biomass equations [27,36,37] and tree diameter-height relationships [38]. However, most of the previous studies dealt with only one or a few tree species and there have been very limited efforts to develop individual-tree dbh or height growth models for most of the commercial tree species in mixed-species forests. Definitely, we are not aware of studies that have developed individual-tree height growth models for the main tree species in Durango using data of stem-mapped and re-measured plots. In this situation, more research and studies become necessary to better understand stand growth and predict the effect of silvicultural practices in these species-rich and uneven-aged forests that are among the richest in the country. Therefore, the objective of this study was to develop new species-specific models for predicting individual-tree dbh and total tree height growth for 30 commercial species growing in the mixed and uneven-aged stands in Durango, Mexico. Some generic growth equations were also developed for all pines, all oaks, and all strawberry species. Such generic group equations can provide useful estimates for a few remaining tree species with still not enough remeasurements of dbh and total tree height in the area of study.
2. Materials and Methods
2.1. Study Area and Data
The data used in this study were collected in the Sierra Madre Occidental in the State of Durango, Northwestern Mexico, located between the geographic coordinates 22°20′ and 26°46′ N latitude and from 103°46′ to 107°11′ W longitude. The data are part of a network of stem-mapped re-measured plots, which were established to monitor the stand dynamics of Durango’s forests [38]. Plot establishment began in 2007 and re-measurements started in 2012, after a five-year interval. Each plot covers an area of 50 × 50 m. The plots are generally distributed systematically, with a variable grid ranging from 3 to 5 km (Figure 1). The tree number, genus, species, dbh outside bark (dbh; cm), total tree height (h; m), and other variables of all trees with dbh ≥ 7.5 cm were recorded. The installation and re-measurement of the plots followed the methodology developed by Corral-Rivas et al. [39]. Only undisturbed plots without intermediate harvesting between measurements were selected and considered for this study. A total of 217 re-measured plots were available for the development of the individual-tree dbh and total tree height growth models. The research plots included a variety of stand site conditions, tree sizes and competition levels. A description of the main plot-level variables for the re-measured plots is summarized in Table 1.
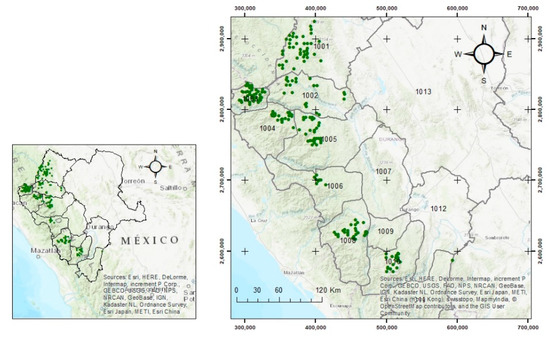
Figure 1.
Study area, and location of 217 stem-mapped plots in Durango, Mexico (plot size is of 50 × 50 m).

Table 1.
Summary statistics of the 217 re-measured plots used in this study.
The re-measured dbh (dbh2) and total tree height (h2) after a 5-year period were obtained from 55,158 sampled trees of 30 species (each species included more than 100 trees for both variables). The considered species were: Abies durangensis Martínez, Alnus firmifolia Fernald, Arbutus arizonica Sargent, A. bicolor González Elizondo, A. madrensis González Elizondo, A. tessellata Sørensen, A. xalapensis Kunth, Cupressus lusitanica Mill., Juniperus deppeana Steud, Pinus arizonica Engelm., P. cooperi C.E. Blanco, P. durangensis Martínez, P. engelmannii Martínez, P. herrerae Martínez Martínez, P. leiophylla Schiede, P. lumholtzii B.L. Rob., P. strobiformis Engelm., P. teocote Schltdl., Quercus arizonica Sarg., Q. crassifolia Bonpl., Q. durifolia Seemen, Q. emoryi Porter & J.M. Coult., Q. fulva Liebmann, Q. jonesii Trelease, Q. laeta Liebm., Q. mcvaughii Spellenberg, Q. radiata Trelease, Q. rugosa Née, Q. sideroxyla Bonpl, Q. urbanii Trel. The information for studied tree species is summarized in Table 2.
Table 2.
Summary statistics of the tree species and species groups used to develop the diameter and height growth equations.
2.2. Procedures for Developing the Species-Specific Individual-Tree Growth Equations
We used the following empirical model form as starting point of the model selection (1). The equation can be also considered a form of the growth equation proposed by Wykoff [40] for mixed conifer stands in the Northern Rocky Mountains. It predicts the observed dbh and total tree height for a growth period (5-year in our study) as a function of tree initial size (dbh or height), stand level variables and tree competition as predictor variables.
where y is the dependent variable (dbh —in cm— or total tree height —in m—) re-measured in 2012; T are initial tree size variables (dbh or total tree height) measured in 2007; S represents the effect of stand variables that commonly include stand density and dominant height; C represents the effect of tree competition; α, β, γ and δ are the regression coefficients of the equation; and ε is the model error term.
Initially, a regression procedure was used to select the definitive tree and stand variables for the individual tree dbh and height growth models. The significance level of 5% was used for the selection of candidate predictive variables in the model. These predictive variables were the measurements at the beginning of the selected 5-year growth period. They included initial tree dbh (dbh1, cm); initial tree total height (h1, m); the sum of the basal area of the trees larger than the subject tree (BAL, proposed by Wykoff et al. [41]), a modified BAL (BALMOD, proposed by Schröder and Gadow [42]) which includes the relative spacing index (i.e., BALMOD = (1 − (1 − (BAL/G))/IH, where IH = 100/H0N1/2); the stand quadratic mean diameter (QMD, cm); stand density (N, number of trees per hectare); the total basal area of the plot (G, m2ha−1); stand dominant height (H0, m); and crown competition factor (CCF) [43]. H0 was calculated from the proportion of the 100 thickest trees of pines per hectare. Data from trees with broken or dead tops were not used to calculate H0. These predictive variables, along with their various combinations were tested separately by each species or species group using the lm and nls functions of R software environment [44]. In order to avoid problems related to multicollinearity, the value of the variance inflation factor (VIF) was computed for the groups of variables that best predicted the dependent variables. Candidate variables with a VIF larger than 10 were excluded, as suggested by Myers [45]. Non-significant parameters at 5% were also removed in the modeling process (i.e., they were fixed at 1 in the final model fitting). Therefore, a little bit different models were used for such species, resulting in the following two dbh and height models as the best candidate model formulations for describing both dbh and height growth in general among the models tested:
where dbh2 is the diameter at breast height after the selected 5-year growth period (cm), dbh1 is the initial tree diameter (cm), H0 is the stand dominant height (m), BAL is the sum of the basal area of the trees larger than the subject tree proposed by Wykoff et al. [41], h2 is the total tree height after a 5-year growth period (m), h1 is the initial total tree height (m), a0–b3 are the regression coefficients, and ε is the model error term.
The models were first fitted under the assumption that the errors within equation were independent and identically distributed [46]. As only two measurements were available for each tree in the dataset, autocorrelation among measurements within a tree was not considered in the present study. However, residual analysis revealed the presence of heteroscedasticity in most species-specific dbh and total tree height growth equations. To deal with this problem weighted regression was used, modelling the error variances as a power function of the independent size variables (e.g., [46,47]). For the diameter growth model, the error variance was modelled with a power function of dbh1 as independent variable (i.e., ). Using the method suggested by Park [48], squared residuals () were regressed against dbh1 to obtain an estimate of k as follows: =, this expression was linearized by the use of the natural logarithm: ln = ln and parameters were then estimated by linear least squares regression; the species-specific k value was subsequently included in the weighting factor (). The same was done for the species-specific height growth models (3), but using h1 as the independent variable.
2.3. Model Comparison
Evaluation of the performance of the dbh and height growth equations was based on numerical and graphical analysis of the residuals. Two goodness-of-fit statistics were calculated: the root mean square error (RMSE) and the coefficient of determination (R2). These statistics were computed on the basis of the unweighted residuals because these are the values of most interest by users of the equations. The expressions of these statistics are:
where , and are the observed, predicted, and mean values of the dependent variable, respectively; and n and p are the total number of observations and the number of parameters used to fit the models, respectively.
Plots of studentized residuals against predicted values of the dependent variables were used for visual evaluation of the models [49,50]. These graphs are very important for indicating areas for which the equations provide especially poor or good predictions.
3. Results
3.1. Diameter Growth Equations
The parameter estimates and the goodness-of-fit statistics for predicting dbh after a 5-year growth period with model 2 for each analyzed tree species are presented in Table 3. Most of the parameter estimates were significant at α = 0.05. All non-significant parameters were dropped from model 2. The initial tree diameter was the most significant and important predictor of dbh2. In all cases the coefficients a0 and a1 were positive, and a1 was less than 1.0 in all cases, indicating that dbh1 limits diameter growth by itself. The term H0 was positive in all species except for Pinus engelmannii and Quercus arizonica (see a2 in Table 3), resulting in increasing diameter with increasing stand dominant height. On the other hand, coefficient a3 multiplying the BAL competition index was negative in all species except for Pinus engelmannii and P. herrerae, indicating a decrease in diameter growth as individual tree competition increases.
Table 3.
Parameter estimates and goodness-of-fit statistics of the individual tree dbh growth equations developed.
The developed equations fitted the data well and generally explained between 98 and 99% of the observed variation of dbh2 for all studied tree species. Average RMSE values for pines, other conifers (Abies durangensis, Cupressus lusitanica, and Juniperus deppeana), oaks, and other broadleaf species were 0.93 cm ±0.17 cm, 0.83 cm ±0.12 cm, 0.84 cm ±0.03 cm, and 0.92 cm ±0.06 cm, respectively. The RMSE values estimated for all pines, all oaks, and all strawberries species groups were 0.96, 0.93 and 0.85 cm, respectively.
The graphs of studentized residuals against predicted dbh values showed no evidence of heterogeneous variance over the full range of predicted values for all species after fitting the models with weighted regression.
In accordance with Huang et al. [50], plots of RMSE were obtained across tree sizes to evaluate the accuracy and precision of diameter predictions of model 2 for the developed equations. Figure 2 shows the plots for the three generic equations developed in this paper (species groups: all pines, all oaks, and all strawberries). It can be inferred that the final equations performed quite well for all sampled diameter classes. All strawberries model produced larger prediction errors for large-sized trees in comparison with all oaks and all pines models.
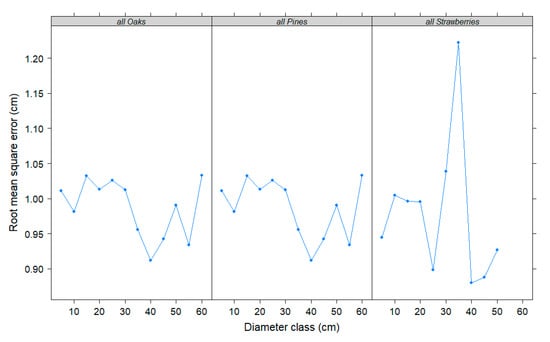
Figure 2.
Root mean square error averaged over 5-cm dbh classes for three generic individual diameter growth equations developed in this study.
3.2. Height Growth Equations
The parameter estimates and the goodness-of-fit statistics for predicting total tree height after a 5-year growth period with model 3 for each species are presented in Table 4. Most of the parameter estimates were significant at α = 0.05. All non-significant parameters were removed from model 3. The initial total tree height was the most significant and important predictor of height after a 5-year growth period. In all cases, the coefficients b0 and b1 were positive, b1 was less than 1.0 in all cases (except for Quercus urbanii), indicating than h1 limits height growth by itself. The term H0 was positive in all species except for Quercus urbanii and Cupressus lusitanica (see b2 in Table 3), resulting in increasing height growth with increasing stand dominant height. On the other hand, coefficient a3 multiplying the BAL competition index was negative in all species except for Cupressus lusitanica, indicating a decrease in height growth as individual tree competition increases.
Table 4.
Parameter estimates and goodness-of-fit statistics of the total individual tree height growth equations developed.
The developed equations fitted the data well and generally explained between 77 and 98% of the observed variation of the total tree height for all studied species. Average RMSE values of total tree height of pines, other conifers, oaks, and other broadleaf species were 1.16 m ±0.25 m, 0.99 m ±0.29 m, 1.03 m ±0.12 m, and 1.41 m ±0.26 m, respectively. The RMSE values estimated for all pine, all oak, and all strawberries species groups were 1.23, 1.10 and 1.03 m, respectively.
The graphs of studentized residuals against predicted total height values showed no evidence of heterogeneous variance over the full range of predicted values for all species after fitting the models with weighted regression.
Figure 3 shows the plots of RMSE obtained across tree height classes for the three generic equations developed in this paper to predict total tree height after a 5-year growth period with model 3. It can be seen that the final models performed quite well for all sampled height classes. The prediction errors for the all strawberries equation can be only evaluated for trees less than 25 m in height due to these tree species occupy always the subdominant vertical layers when mature and are small-sized trees [51].
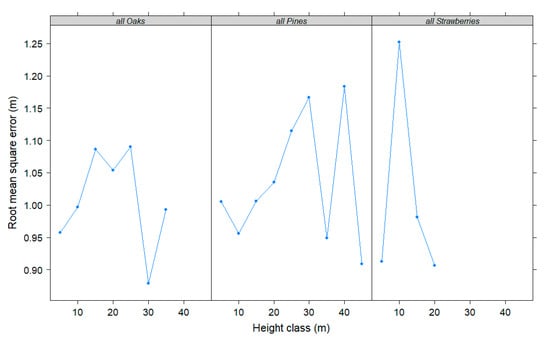
Figure 3.
Root mean square error averaged over 5-m height classes for three generic individual height growth equations developed in this study.
4. Discussion
The species-specific growth models developed in the present study to predict dbh and total tree height of individual trees after a 5-year growth period included size variables (dbh1, h1), site factors (i.e., H0), and competition variables (BAL) in their formulation. In our study, the most important contribution of the variance explained by equations 2 and 3 came from size variables, followed by competition and site factors, respectively. These variables have also been selected by other authors for individual dbh, basal area and height increment models (e.g., [11,15,40,47,52,53]), although the most important variable has largely varied between ecosystems and species (e.g., [5,15,54,55]).
Our observed significant positive role of tree size on tree growth for all species agrees with studies that have observed that larger trees tend to grow faster (e.g., [15,17,56]). For example Stephenson et al. [57] presented a global analysis showing that lager trees had higher growth rates than smaller trees. Higher growth rates of larger trees are likely associated with increased access to resources; for example, larger trees generally have prominent position in the canopy, greater leaf area, and therefore have more access to light and other resources (e.g., [17]). In contrast, other studies have reported that growth rates increase to a maximum with tree size and then either levels off or decreases for the largest trees, as a result of reduced efficiency, accumulated stress, or senescence [16,17,55,58,59,60]. We did not observe a decrease in tree growth for the largest trees for our observed diameter range, which included diameters of up to 50–70 cm for most of the species. Some authors have found declines above this diameter range, sometimes at ages above 50 years (e.g [55,61]). Such very mature and larger trees are relatively scarce in most forests under management schemes and our sample was not big enough to find them.
Significant competition and site effects associated with BAL and H0 were observed for most of the studied tree species both for individual dbh and height growth models. For dbh growth models, only five tree species showed no competition effect, while a non-significant site effect was found for thirteen tree species. In contrast, for height growth models a non-significant competition effect associated with BAL was found for eleven tree species, and only four of the studied species showed non-significant site factor effects. This appears to indicate that competition is a more important key driving factor for individual dbh growth in the study area than site factor (i.e., H0), while the latter appears to be more appropriate for predicting height growth, as it significantly contributes to describing this variable. This higher sensitivity of diameter growth to competitive stress is probably explained because of a higher dependence of this process on light interception, whereas height growth is less affected (e.g., [62,63,64]).
Our results agree with previous studies that have shown improvements in diameter growth prediction for different species when a competition index was included (e.g., [36,55,65,66,67,68]). Competition is an important driver of tree growth since the degree of shadowing emanating from competing neighbors substantially determines the amount and quality of solar radiation that is available for the target tree [64,69], together with the role of neighboring plants in competing for growing space and resources including water, and soil nutrients [17,70]. The consideration of competition after tree size for explaining diameter growth in our study agrees with previous studies that have also found that competition indices were the second most important variables, after tree size, in explaining individual tree diameter growth, for a variety of tree species. For example, in the studies of Wykoff [40], Monserud and Sterba [11] or Crecente-Campo et al. [46], the main variables in explaining growth were size variables (dbh or crown ratio), followed by the BAL competition index. In contrast, other studies have found competitive position, measured by BAL or modifications of BAL, to be the strongest individual predictor of diameter growth in both even-aged and uneven-aged stands [5,58,71,72].
In our study, BAL index explained a higher variance of tree growth than BALMOD or CCF indices. These results are similar to the findings of Crecente-Campo et al. [46], who found that BAL showed better results than BALMOD in terms of predicting basal area growth of Scots pine in NW Spain, unlike results from other studies where the latter has outperformed BAL (e.g., [43,73]), including a previous study in even-aged Pinus cooperi stands in the area of study by Corral-Rivas et al. [36] where BALMOD was selected.
In this study, significant site effects associated with H0 were found for seven out of the eight developed individual dbh growth models for the pine species. Also, a significant H0 effect was observed for the height growth models in all pine species, and indeed in almost all the studied tree species. Thus, H0 appears to be an appropriate variable for predicting individual dbh and height growth for the study area, as it significantly contributes to describe individual tree growth within different stands. This finding is very interesting because more than 80% of Durango’s forests are covered by mixed and uneven-aged stands, for which the most traditional growth modeling variables such as site index and age which appear to be important in describing the growth of individual trees within different stands, at least in even-aged forests [47]) are generally not available [74]. H0 has also previously been included in generalized h–d models developed for some of the tree species studied in this paper in the same study area (e.g., [38,75]). Therefore, the inclusion of H0 in the models might be used to indicate the stage of development of a stand, thus compensating better sites with lower age [11,76]. Nevertheless, the effect of dominant height on growth varied between species, similar to previous studies that have documented that the effect of site quality on tree growth was not consistent across species (e.g., [5]).
Individual tree species in forests have adapted to specific site conditions and are capable of responding to a range of complex environmental challenges to improve their chances of survival, reproduction, and growth. Some species are shade tolerant, others are light demanding. Some require high humidity and others are adapted to dry conditions [26]. In our study some trees species did not show significant competition or site factor effects, and therefore it is interesting to examine the possible reasons for the observed lack of sensitivity to those factors.
The species Quercus urbanii, Arbutus arizonica, A. tessellata, A. xalapensi and A. madrensis showed a non-significant effect of tree competition on dbh growth. According to Lujan-Soto et al. [51], these tree species occupy always the subdominant vertical layer when are mature, and consequently are shade-tolerant and possibly less sensitive to competition for light. In addition, Quercus crassifolia, Q. fulva, Q. laeta, Q. mcvaughii, Q. urbanii, Abies durangensis, Arbutus arizonica and A. xalapensis showed non-significant competition effects (i.e., BAL) on height growth, also being species adapted to the subdominant strata [51]. Similarly, in the area of study, the previous study by Quiñonez et al. [3] found that oak species seemed to have an advantageous competition in the mixed-species stands, since their growth was not significantly influenced by competition from other species. These results agree with observations from other studies in mixed-species conifer forests that have noted a lower sensitivity to competition for the more shade-tolerant species (e.g., [13,15,55,64]).
Non-significant site factor effects (i.e., H0) on diameter growth were observed for Pinus herrerae, Quercus durifolia, Q. jonesii, Q. laeta, Arbutus bicolor and the group of Arbutus spp., which are tree species that are found growing in a vast geographic area of contrasting soils and site conditions [26]. The large plasticity of these tree species may suggest that such variation in dbh growth was not possible to be explained with dominant height [77,78], given their successful capacity of adaptation to very varied site quality conditions. On the other hand, the species Abies durangensis, Alnus firmifolia, and Cupressus lusitanica, which are species found in a very limited range of site conditions, also showed no significant competition effects on diameter growth. These are the most shade-tolerant species considered in our study which are growing only in a few plots with high humidity [26]. Similarly, Quercus radiata and Alnus firmifolia, which occurred on a very limited range of site conditions [26], showed no significant effects of site quality on tree height growth. The fact that these tree species occur on a very limited range of site conditions, possibly limited the inclusion of dominant height as a diameter growth predictor variable, given the low variability in this variable covered by the natural distribution of these species in our study area.
Future studies expanding the range of observed environmental conditions should also analyze the role of climatic and edaphic variables on tree growth, allowing to integrate the role of climatic or soil limitations on tree growth predictions (e.g., [16,17,58,79,80]) for improving our decision making capacity under climatic or management scenarios.
Although individual-tree dbh and height growth models as the ones developed in this paper are key components in many forest growth and yield prediction systems, their use would have restricted applicability without other model components such as ingrowth and mortality [11]. Hopefully, these model components will be developed for the studied tree species in the future. Thus, a reliable prediction system will be available for managing these natural species-rich and irregular forests in Durango, Mexico. However, the growth models developed in our study represent useful operational tools to support decision making for a comprehensive variety of tree species in Durango’s forests. They may provide good simulation of growth (diameter, height, volume) for short term projections, provide detailed information about stand structure development (diameter and height distribution), calculate biomass and carbon stocks projection, and allow considerations of a wide variety of silvicultural treatments/prescriptions, among others.
5. Conclusions
The predictive variables used in the models to predict dbh and total tree height after a 5-year growth period were tree initial dbh and total tree height, respectively, the dominant height as a site factor (H0), and the sum of the basal area in trees larger than the subject tree as a competition index (BAL). Some of the studied trees species did not show significant competition or site factor effects in the developed models, being the species-specific shade-tolerance and plasticity, respectively, the main reasons for the observed lack of sensitivity to those factors. Because these new species-specific growth models were developed with a large and unique dataset provided by and extensive network of stem-mapped and re-measured plots that covers a large variation of individual tree growth, they can be recommended not only for the forests of Durango but also for the surrounding regions with similar growth conditions. For other tree species that exist in the study area, but that were not considered in the study due to the lack of enough data, the generic models fitted on the combined data sets could be used for dbh and total tree height growth prediction. It is recommended that further studies on individual-tree growth for the studied species and species groups are continued with the aim to develop a reliable prediction system for managing these natural species-rich forests. Future models should analyze the role of species-specific ecological aspects on individual tree growth, once this knowledge has been generated.
Author Contributions
J.B.-R. designing the research, analyzing the data and wrote the manuscript; J.J.C.-R. contributed with the data, in designing the research, in analyzing the data and in revising the manuscript; R.S.-M. participated in revising the manuscript; J.R.P.-M. participated in analyzing the data and in revising the manuscript; D.J.V.-N. participated in revising the manuscript; P.M.L.-S. participated in revising the manuscript; B.V.-L. participated in revising the manuscript, U.D.-A. assisted in analysis of the results and revised the manuscript; G.Q.-B. participated in revising the manuscript and C.A.L.-S. assisted in revising the manuscript. All authors have read and agreed to the published version of the manuscript.
Acknowledgments
This study was supported by the National Forestry Commission (CONAFOR) and the Mexican National Council for Science and Technology (CONACYT).
Funding
Data collection for this research was funded by the National Forestry Commission (CONAFOR) and the Juárez University of Durango State.
Conflicts of Interest
The authors declare no conflict of interest.
References
- Tenzin, J.; Tenzin, K.; Hasenauer, H. Individual tree basal area increment models for broadleaved forests in Bhutan. For. Int. J. For. Res. 2017, 90, 367–380. [Google Scholar] [CrossRef]
- Perin, J.; Claessens, H.; Lejeune, P.; Brostaux, Y.; Hébert, J. Distance independent tree basal area growth models for Norway spruce Douglas-fir and Japanese larch in Southern Belgium. Eur. J. For. Res. 2016, 136, 193–204. [Google Scholar] [CrossRef]
- Quiñonez-Barraza, G.; Zhao, D.; Héctor, M.; Corral-Rivas, J.J. Considering neighborhood effects improves individual dbh growth models for natural mixed-species forests in Mexico. Ann. For. Sci. 2018, 75, 78. [Google Scholar] [CrossRef]
- Pretzsch, H. Forest Dynamics, Growth and Yield; Springer: Berlin/Heidelberg, Germany, 2009. [Google Scholar]
- Lhotka, J.M.; Loewenstein, E.F. An individual-tree diameter growth model for managed uneven-aged oak-shortleaf pine stands in the Ozark Highlands of Missouri, USA. For. Ecol. Manag. 2011, 261, 770–778. [Google Scholar] [CrossRef]
- Andreassen, K.; Tomter, S.M. Basal area growth models for individual trees of Norway spruce, Scots pine, birch and other broadleaves in Norway. For. Ecol. Manag. 2003, 180, 11–24. [Google Scholar] [CrossRef]
- Burkhart, H.E.; Tomé, M. Growth and Yield Models for Uneven-Aged Stands. In Modeling Forest Trees and Stands, 1st ed.; Springer: New York, NY, USA, 2012; pp. 339–361. [Google Scholar]
- Kiviste, A.; González, J.G.Á.; Alboreca, A.R.; González, A.D.R. Funciones de Crecimiento de Aplicación en el ámbito Forestal, 1st ed.; Instituto Nacional de Investigación y Tecnología Agraria y Alimentaría (INIA): Madrid, España, 2002. [Google Scholar]
- Vanclay, J.K. Modelling Forest Growth and Yield: Applications to Mixed Tropical Forests, 1st ed.; CAB International: Wallingford, UK, 1994. [Google Scholar]
- Martin, G.L.; Ek, A.R. A comparison of competition measures and growth models for predicting plantation red pine diameter and height growth. For. Sci. 1984, 30, 731–743. [Google Scholar]
- Monserud, R.A.; Sterba, H. A basal area increment model for individual trees growing in even-and uneven-aged forest stands in Austria. For. Ecol. Manag. 1996, 80, 57–80. [Google Scholar] [CrossRef]
- Hökkä, H.; Groot, A. An individual-tree basal area growth model for black spruce in second-growth peatland stands. Can. J. For. Res. 1999, 29, 621–629. [Google Scholar] [CrossRef]
- Contreras, M.A.; Affleck, D.; Chung, W. Evaluating tree competition indices as predictors of basal area increment in western Montana forests. For. Ecol. Manag. 2011, 262, 1939–1949. [Google Scholar] [CrossRef]
- Russel, M.B.; Weiskittel, A.R. Comparing strategies for modeling individual-tree height and heigth-to-crown base increment in mixed-species Acadian forests of northeastern North America. Eur. J. For. Res. 2014, 133, 1121–1135. [Google Scholar] [CrossRef]
- Zhang, Z.; Papaik, M.J.; Wang, X.; Hao, Z.; Ye, J.; Lin, F. The effect of tree size, neighborhood competition and environment on tree growth in an old-growth temperate forest. J. Plant Ecol. 2017, 10, 970–980. [Google Scholar] [CrossRef]
- Canham, C.D.; Papaik, M.J.; Uriarte, M.; Mc Williams, W.H.; Jenkins, J.C.; Twery, M.J. Neighborhood analyses of canopy tree competition along environmental gradients in New England forests. Ecol. Appl. 2006, 16, 540–554. [Google Scholar] [CrossRef]
- Fien, E.K.P.; Fravera, S.; Teets, A.; Weiskittel, A.R.; Hollinger, D.Y. Drivers of individual tree growth and mortality in an uneven-aged, mixed-species conifer forest. For. Ecol. Manag. 2019, 449, 117446. [Google Scholar] [CrossRef]
- Aakala, T.; Fraver, S.; D’Amato, A.W.; Palik, B.J. Influence of competition and age on tree growth in structurally complex old-growth forests in northern Minnesota, USA. For. Ecol. Manag. 2013, 308, 128–135. [Google Scholar] [CrossRef]
- Franklin, J.F.; Spies, T.A.; Van Pelt, R.; Carey, A.B.; Thornburgh, D.A.; Berg, D.R.; Chen, J. Disturbances and structural development of natural forest ecosystems with silvicultural implications, using Douglas-fir forests as an example. For. Ecol. Manag. 2002, 155, 399–423. [Google Scholar] [CrossRef]
- Zhao, D.; Borders, B.; Wilson, M.; Rathbun, S.L. Modeling neighborhood effects on the growth and survival of individual trees in a natural temperate species-rich forest. Ecol. Model 2006, 196, 90–102. [Google Scholar] [CrossRef]
- Roberts, S.D.; Harrington, C.A. Individual tree growth response to variable-density thinning in coastal Pacific Northwest forests. For. Ecol. Manag. 2008, 255, 2771–2781. [Google Scholar] [CrossRef]
- Woodall, C.; Fiedler, C.; Milner, K. Intertree competition in uneven-aged ponderosa pine stands. Can. J. For. Res. 2003, 33, 1719–1726. [Google Scholar] [CrossRef]
- Soares, P.; Tomé, M. GLOBTREE: An individual tree growth model for Eucalyptus globulus in Portugal. In Modelling Forest Systems, 1st ed.; Amaro, A., Reed, D., Soares, P., Eds.; CAB International: Wallingford, UK, 2003; pp. 97–110. [Google Scholar]
- Larocque, G.R.; Luckai, N.; Adhikary, S.N.; Groot, A.; Bell, F.W.; Sharma, M. Competition theory-science and application in mixed forest stands: review of experimental and modelling methods and suggestions for future research. Environ. Rev. 2013, 21, 71–84. [Google Scholar] [CrossRef]
- Porté, A.; Bartelink, H.H. Modelling mixed forest growth: A review of models for forest management. Ecol. Model 2002, 150, 141–188. [Google Scholar] [CrossRef]
- González-Elizondo, M.S.; González-Elizondo, M.; Márquez-Linares, M.A. Vegetación y Ecorregiones de Durango, 1st ed.; Instituto Politécnico Nacional: México DF, México, 2007. [Google Scholar]
- Simental-Cano, B.; López-Sánchez, C.A.; Wehenkel, C.; Vargas-Larreta, B.; Álvarez-González, J.G.; Corral-Rivas, J.J. Species-specific and regional volume models for 12 forest species in Durango, Mexico. Rev. Chapingo Ser. Cie. 2017, 23, 155–171. [Google Scholar] [CrossRef]
- Corral-Rivas, S.; Álvarez-González, J.G.; Corral-Rivas, J.J.; López-Sánchez, C.A. Characterization of diameter structures of natural forests of northwest of Durango, Mexico. Rev. Chapingo Ser. Cie. 2015, 21, 221–236. [Google Scholar] [CrossRef]
- Corral-Rivas, S.; Álvarez-González, J.G.; Crecente-Campo, F.; Corral-Rivas, J.J. Local and generalized height-diameter models with random parameters for mixed, uneven-aged forests in Northwestern Durango, Mexico. For. Ecosyst. 2014, 1, 6. [Google Scholar] [CrossRef]
- Silva-Flores, R.; Pérez-Verdín, G.; Wehenkel, C. Patterns of Tree Species Diversity in Relation to Climatic Factors on the Sierra Madre Occidental, Mexico. PLoS ONE 2014, 9, e105034. [Google Scholar] [CrossRef]
- Corral-Rivas, J.J.; González, J.G.Á.; González, A.D.R.; Von Gadow, K. Compatible height and site index models for five pine species in El Salto, Durango (Mexico). For. Ecol. Manag. 2004, 201, 145–160. [Google Scholar] [CrossRef]
- Vargas-Larreta, B.; Corral-Rivas, J.; Aguirre-Calderón, Ó.; Nagel, J. Modelos de crecimiento de árbol individual: Aplicación del Simulador BWINPro7. Madera Bosques 2010, 16, 81–104. [Google Scholar] [CrossRef]
- Castillo López, A.; Vargas-Larreta, B.; Corral Rivas, J.J.; Nájera Luna, J.A.; Cruz Cobos, F.; Hernández, F.J. Modelo compatible altura-índice de sitio para cuatro especies de pino en Santiago Papasquiaro, Durango. Rev. Mex. Cienc. For. 2013, 4, 89–103. [Google Scholar]
- Valles-Gándara, A.G.; Valadez-Castro, R.C. Evaluación de índices de competencia independientes de la distancia para predecir el crecimiento de bosques mezclados en San Dimas, Durango. Rev. Chapingo Ser. Cie. 2006, 12, 39–44. [Google Scholar]
- Corral, J.R.; Álvarez, J.G.; Aguirre, O.; Hernandez, F. The effect of competition on individual tree basal area growth in mature stands of Pinus cooperi Blanco in Durango (Mexico). Eur. J. For. Res. 2005, 124, 133–142. [Google Scholar]
- Corral-Rivas, J.J.; Diéguez-Aranda, U.; Castedo, F.; Corral-Rivas, S. A merchantable volume system for major pine species in El Salto, Durango (Mexico). For. Ecol. Manag. 2007, 238, 118–129. [Google Scholar] [CrossRef]
- Vargas-Larreta, B.; Corral-Rivas, J.J.; Aguirre-Calderón, O.A.; López-Martínez, J.O.; Santos-Posadas, H.M.; Zamudio-Sánchez, F.J.; Aguirre-Calderón, C.G. SiBiFor: Forest Biometric System for forest management in Mexico. Rev. Chapingo Ser. Cie. 2017, 23, 437–455. [Google Scholar]
- Crecente-Campo, F.; Corral-Rivas, J.J.; Vargas-Larreta, B.; Wehenkel, C. Can random components explain differences in the height–diameter relationship in mixed uneven-aged stands? Ann. For. Sci. 2014, 71, 51–70. [Google Scholar] [CrossRef]
- Corral Rivas, J.J.; Larreta, V.; Calderón, A.; Alberto, O. Guía Para el Establecimiento de Sitios de Investigación Forestal y de Suelos en Bosques del Estado de Durango, 1st ed.; Editorial de la Universidad Juárez del Estado de Durango: Durango, México, 2009. [Google Scholar]
- Wykoff, W.R. A basal area increment model for individual conifers in the Northern Rocky Mountains. For. Sci. 1990, 36, 1077–1104. [Google Scholar]
- Wykoff, W.R.; Crookston, N.L.; Stage, A.R. User’s Guide to the Stand Prognosis Model, 1st ed.; US Department of Agriculture, Forest Service, Intermountain Forest and Range Experiment Station: Utah, UT, USA, 1982. [Google Scholar]
- Schröder, J.; Gadow, K.V. Testing a new competition index for Maritime pine in northwestern Spain. Can. J. For. Res. 1999, 29, 280–283. [Google Scholar] [CrossRef]
- Krajicek, J.E.; Brinkman, K.A.; Gingrich, S.F. Crown competition-a measure of density. For. Sci. 1961, 7, 35–42. [Google Scholar]
- R Core Team. R: A Language and Environment for Statistical Computing; R Foundation for Statistical Computing: Vienna, Austria; Available online: https://www.R-project.org/ (accessed on 20 June 2019).
- Myers, R.H. Classical and modern regression with applications, 1st ed.; Duxbury Press: Belmont, CA, USA, 1990; Volume 2. [Google Scholar]
- Crecente-Campo, F.; Soares, P.; Tomé, M.; Diéguez-Aranda, U. Modelling annual individual-tree growth and mortality of Scots pine with data obtained at irregular measurement intervals and containing missing observations. For. Ecol. Manag. 2010, 260, 1965–1974. [Google Scholar] [CrossRef]
- Hann, D.W. An adjustable predictor of crown profile for stand-grown Douglas-fir trees. For. Sci. 1999, 45, 217–225. [Google Scholar]
- Park, R.E. Estimation with heteroscedastic error terms. Econometrica (pre-1986) 1966, 34, 888. [Google Scholar] [CrossRef]
- Neter, J.; Wasserman, W.; Kutner, M.H. Applied Linear Models, Regression, Analysis of Variance and Experimental Designs, 3rd ed.; Burr Ridge Irwin: Boston, MA, USA, 1990. [Google Scholar]
- Huang, S.; Price, D.; Titus, S.J. Development of ecoregion-based height–diameter models for white spruce in boreal forests. For. Ecol. Manag. 2000, 129, 125–141. [Google Scholar] [CrossRef]
- Lujan-Soto, J.E.; Corral-Rivas, J.J.; Aguirre-Calderón, O.A.; Gadow, K.V. Grouping forest tree species on the Sierra Madre Occidental, Mexico. Allg. Forst. Jagdztg. 2015, 186, 63–71. [Google Scholar]
- Zhang, L.; Peng, C.; Dang, Q. Individual-tree basal area growth models for jack pine and black spruce in northern Ontario. For. Chron. 2004, 80, 366–374. [Google Scholar] [CrossRef]
- Baluarte, J.B.; Alvarez, J.G. Modelamiento del crecimiento del tornillo (Cedrelinga catenaeformis) en plantaciones en Jenarno Herrera, Departamento de Loreto, Perú. Folio Amazonica 2015, 24, 33–57. [Google Scholar]
- Sánchez-Gómez, D.; Zavala, M.A.; Van Schalkwijk, D.B.; Urbieta, I.R.; Valladares, F. Rank reversals in tree growth along tree size, competition and climatic gradients for four forest canopy dominant species in Central Spain. Ann. For. Sci. 2008, 65, 605. [Google Scholar] [CrossRef]
- Das, A. The effect of size and competition on tree growth rate in old-growth coniferous forests. Can. J. For. Res. 2012, 42, 1983–1995. [Google Scholar] [CrossRef]
- Russo, S.E.; Wiser, S.K.; Coomes, D.A. Growth-size scaling relationships of woody plant species differ from predictions of the Metabolic Ecology Model. Ecol. Lett. 2007, 10, 889–901. [Google Scholar] [CrossRef]
- Stephenson, N.L.; Das, A.J.; Condit, R.; Russo, S.E.; Baker, P.J.; Beckman, N.G.; Coomes, D.A.; Lines, E.R.; Morris, W.K.; Rüger, N.; et al. Rate of tree carbon accumulation increases continuously with tree size. Nature 2014, 507, 90–93. [Google Scholar] [CrossRef]
- Gómez-Aparicio, L.; Garcia-Valdes, R.; Ruiz-Benito, P.; Zavala, M.A. Disentangling the relative importance of climate, size, and competition on tree growth in Iberian forests: Implications for forest management under global change. Glob. Change Biol. 2011, 17, 2400–2414. [Google Scholar] [CrossRef]
- Holzwarth, F.; Kahl, A.; Bauhus, J.; Wirth, C. Many ways to die – partitioning tree mortality dynamics in a near-natural mixed deciduous forest. J. Ecol. 2013, 101, 220–230. [Google Scholar] [CrossRef]
- Fraver, S.; D’Amato, A.W.; Bradford, J.B.; Jonsson, B.G.; Jönsson, M.; Esseen, P.A. Tree growth and competition in an old-growth Picea abies forest of boreal Sweden: Influence of tree spatial patterning. J. Veg. Sci. 2014, 25, 374–385. [Google Scholar] [CrossRef]
- Bowman, D.M.J.S.; Brienen, R.J.W.; Gloor, E.; Phillips, O.L.; Prior, L.D. Detecting trends in tree growth: Not so simple. Trends Plant Sci. 2013, 18, 11–17. [Google Scholar] [CrossRef]
- Simard, S.W.; Zimonick, B.J. Neighborhood size effects on mortality, growth and crown morphology of paper birch. For. Ecol. Manag. 2005, 214, 251–265. [Google Scholar]
- King, D.A.; Davies, S.J.; Nur Supardi, M.N.; Tan, S. Tree growth is related to light interception and wood density in two mixed dipterocarp forests of Malaysia. Funct. Ecol. 2005, 19, 445–453. [Google Scholar]
- Metz, J.; Seidel, D.; Schall, P.; Scheffer, D.; Schulze, E.D.; Ammer, C. Crown modeling by terrestrial laser scanning as an approach to assess the effect of aboveground intra-and interspecific competition on tree growth. For. Ecol. Manag. 2013, 310, 275–288. [Google Scholar]
- Tomé, M.; Burkhart, H.E. Distance-dependent competition measures for predicting growth of individual trees. For. Sci. 1989, 35, 816–831. [Google Scholar]
- Biging, G.S.; Dobbertin, M. Evaluation of competition indices in individual tree growth models. For. Sci. 1995, 41, 360–377. [Google Scholar]
- Canham, C.D.; LePage, P.T.; Coates, K.D. A neighborhood analysis of canopy tree competition: Effects of shading versus crowding. Can. J. For. Res. 2004, 34, 778–787. [Google Scholar]
- Coates, K.D.; Canham, C.D.; LePage, P.T. Above- versus below-ground competitive effects and responses of a guild of temperate tree species. J. Ecol. 2009, 97, 118–130. [Google Scholar]
- Pretzsch, H.; Bielak, K.; Block, J.; Bruchwald, A.; Dieler, J.; Ehrhart, H.-P.; Kohnle, U.; Nagel, J.; Spellmann, H.; Zasada, M.; et al. Productivity of mixed versus pure stands of oak (Quercus petraea (Matt.) Liebl. and Quercus robur L.) and European beech (Fagus sylvatica L.) along an ecological gradient. Eur. J. For. Res. 2013, 132, 263–280. [Google Scholar]
- Keddy, P.A. Studying Competition. In Competition, 2nd ed.; Usher, M.B., DeAngelis, D.L., Eds.; Springer Science & Business Media: Louisiana, LA, USA, 2001; pp. 1–58. [Google Scholar]
- Adame, P.; Hynynen, J.; Canellas, I.; del Río, M. Individual-tree diameter growth model for rebollo oak (Quercus pyrenaica Willd.) coppices. For. Ecol. Manag. 2008, 255, 1011–1022. [Google Scholar]
- Pukkala, T.; Lahde, E.; Laiho, O. Growth and yield models for uneven-sized forest stands in Finland. For. Ecol. Manag. 2009, 258, 207–216. [Google Scholar]
- Álvarez-Taboada, M.F.; Barrio-Anta, M.; Gorgoso-Varela, J.; Alvarez-González, J.G. Influence of the competition on the section growth in Pinus radiata D. Don. Inv. Agrar.-Sist. Rec. F. 2003, 12, 25–35. [Google Scholar]
- Corral-Rivas, J.J.; González-Elizondo, M.S.; Lujan-Soto, J.E.; Gadow, K.V. Effects of density and structure on production in the communal forests of the Mexican Sierra Madre Occidental. South. For. J. For. Sci. 2019, 81, 1–10. [Google Scholar] [CrossRef]
- Vargas-Larreta, B.; Castedo-Dorado, F.; Álvarez-González, J.G.; Barrio-Anta, M.; Cruz-Cobos, F. A generalized height-diameter model with random coefficients for uneven-aged stands in El Salto, Durango (Mexico). Forestry 2009, 84, 445–462. [Google Scholar] [CrossRef]
- Abetz, P. Zur Standraumregulierung in Mischbeständen und Auswahl von Zukunftsbäumen. AFZ 1974, 29, 871–873. [Google Scholar]
- Monserud, R.A.; Rehfeldt, G.E. Genetic and environmental components of variation of site index in inland Douglas-fir. For. Sci. 1990, 36, 1–9. [Google Scholar]
- Hasenauer, H.; Burkhart, H.E.; Sterba, H. Variation in potential volume yield of loblolly pine plantations. For. Sci. 1994, 40, 162–176. [Google Scholar]
- Sánchez-Salguero, R.; Linares, J.C.; Camarero, J.J.; Madriga-Gonzalez, J.; Hevia, A.; Sanchez-Miranda, A.; Ballesteros-Canovas, J.A.; Alfaro-Sanchez, C.; Garcia-Cervignon, A.K.; Bigler, C.; et al. Disentangling the effects of competition and climate on individual tree growth: A retrospective and dynamic approach in Scots pine. For. Ecol. Manag. 2015, 358, 12–25. [Google Scholar] [CrossRef]
- Bigelow, S.W.; Runkle, J.R.; Oswald, E.M. Competition, Climate, and Size Effects on Radial Growth in an Old-Growth Hemlock Forest. Forests 2020, 11, 52. [Google Scholar] [CrossRef]
© 2020 by the authors. Licensee MDPI, Basel, Switzerland. This article is an open access article distributed under the terms and conditions of the Creative Commons Attribution (CC BY) license (http://creativecommons.org/licenses/by/4.0/).