Abstract
Leaf habits (e.g., evergreen or deciduous) can reflect strategies of species adapting to varied environmental conditions. However, how species with different leaf habits coexist within a plant community is still poorly understood. Trait gradient analysis is a new approach to partition plant functional trait variations into alpha (within-community) and beta (among-community) components to quantify the effects of environmental filtering and biotic competition on community assembly. Here, on the basis of establishing forty-eight forest dynamic plots in a subtropical evergreen and deciduous broadleaved mixed forest in central China and measuring of seven functional traits, we compared the trait variation patterns and influencing factors of evergreen and deciduous species by using the trait gradient analysis method. The results showed that there were significant differences between functional traits for evergreen and deciduous species. Alpha trait components consistently varied more widely than beta components. The correlation between species trait mean and the alpha of each trait was highly significant, but there was no significant correlation between beta and alpha trait values. There were relatively weak or nonexistent significant correlations among species mean trait values and alpha trait values of different functional traits. However, the beta trait value showed high and significant correlations in both evergreen and deciduous species. Our results indicated that evergreen and deciduous species adopt similar adaptation strategies (beta component) in the context of environmental change in the community. However, the species initially came to coexist via the ecological positioning of traits (alpha component), which helped reduce competition so individuals could obtain more resources.
1. Introduction
Functional traits are defined as morpho-physio-phenological traits that impact fitness indirectly via their effects on growth, reproduction, and survival, which are the three components of individual performance [1]. Thus, traits reflect both ecological and evolutionary aspects of community assembly [2] and studying them reveals underlying mechanisms of species distributions along an environmental gradient [3,4]. Large-scale variation in functional traits is caused by the difference in traits among coexisting species on a small scale in local communities. Thus, studying the distribution pattern and coexistence mechanisms of functional traits in local communities plays an important role in understanding distribution patterns on a large scale [5].
Environmental filtering and biotic competition are the two most important mechanisms in community assemblage [6]. In habitats with poor conditions, such as arid and high altitude areas, traits tend to converge due to environmental filtering. In contrast, competition is stronger in environments with higher quality resources, which leads to a more scattered distribution of community traits [7,8]. The adaptation of species along an environmental gradient is the basis of species coexistence. Therefore, environmental gradients play an important role in community composition and species coexistence [9,10,11]. The effect of environmental filtering on plant species is directly manifested in the changing distribution of plant species [10]. Co-existing species in communities are usually affected by environmental filtering and biotic competition, so the value of their species’ traits is distributed within the range of variation in their community trait means [12].
Trait variation analyses have been dominated by examinations on interspecific trait variations in most studies, which involve systems with pronounced environmental gradients [13]. Trait differences among species primarily explain the greater extent and denser filling of community trait space at increased plant diversity. The trait plasticities among species in response to environmental gradients did not increase community-wide trait space or decrease niche overlap between species [14]. However, intraspecific differences in trait values emerge additionally in the function of environmental differences among different stands. There is a growing body of evidence showing that the role of intraspecific trait variability is increasingly recognized as a key factor shaping plant fitness and community assembly worldwide [15]. Intraspecific trait variation, due to phenotypic plasticity or local adaptation, has a significant and non-negligible effect on species properties and ecosystem function. For instance, accounting for intraspecific trait variation helps to better understand phenotypic plasticity, community assembly and ecosystem processes in community ecology [16]. At the community level, it is more complex to disentangle the relative magnitude of intra- and interspecific trait variation in community assembly [17]. Habitat filtering indeed reduces both intra- and interspecific trait variation through adaptation to abiotic constraints [11], while niche differentiation can reduce intraspecific trait variation (reduction of niche width through increasing species packing) and increase interspecific trait variation. The limit of coexistence (limiting similarity) of species depends on the ratio between interspecific niche differences (defined by interspecific trait variation) and species’ niche width (i.e., intraspecific trait variation) [17]. Therefore, quantifying the relative extent of intra- and interspecific variability in communities may help us in understanding species coexistence and maintenance of species diversity.
The range in variation of species functional traits is related to the ecological strategies of species. Ackerly and Cornwell [18] proposed a new research method, trait gradient analysis (TGA), to categorize species traits in the community into two trait components, alpha and beta. The beta trait value is the relative position of the species on the trait gradient formed by the average ranking of species-weighted traits in multiple communities. It represents the species relative to the average trait value in other communities. The range of beta trait values reflects how well-adapted species are to the environment. The alpha trait value refers to the difference between a species’ traits and the value of the average trait of the community. The variation range of the alpha trait values reflects how similar the species is to the coexisting species in the community [18]. The variation in alpha and beta trait values along the environmental gradient can be used to explain the coexistence mechanisms of the species in the community. Exploring the alpha trait values of the species in the community and the variation range of beta trait values between communities provides a new perspective on understanding the ecological strategy of the species and the effect of trait ranges on community composition and species coexistence in a specific environment. At the same time, this method can also be used to calculate the niche width of each trait under different environmental gradients so that the traits can be quantitatively compared. Kooyman et al. [19] studied the eucalyptus community in New South Wales, Australia and successfully explained succession in the community using TGA. The TGA method partitions trait components across these scales to identify the extent and strength of trait correlations in relation to both environmental gradients and interactions between co-occurring species [18]. However, few studies have employed this method to compare variation in community species traits in more species-rich communities.
The composition and structure of subtropical evergreen and deciduous broadleaved mixed forests are complex, providing suitable habitat for different types of organisms and playing an important role in maintaining the regional ecological environment and the global carbon balance [20]. This forest provides a strong candidate for the study of coexistence mechanisms and trait variation among different leaf habits. Here, we established 48 forest dynamic monitoring plots in a subtropical evergreen deciduous broadleaved mixed forest in central China. Community and functional trait data were obtained from 2982 individuals (DBH ≥ 10 cm) of 170 species across the sites. We measured seven important functional traits: specific leaf area, leaf dry matter content, leaf area, wood density, leaf nitrogen content, leaf phosphorus content, and nitrogen-phosphorus ratio, to explore the variation in functional traits and community assembly. We propose the hypothesis that evergreen and deciduous species adopt different ecological strategies to obtain living resources and space, therefore, there are significant differences in traits. And there are different correlations between different traits which act synergistically on plant growth. We asked the following questions: (1) Do evergreen and deciduous species differ in their trait variations in the evergreen and deciduous broad-leaved mixed forest community? To explore the variation in ecological strategies between coexisting evergreen and deciduous species, we used a wider range of trait data, including leaf traits, wood traits, and nutritional elements. (2) What effect do biotic competition and habitat filtering have on trait variation communities where evergreen and deciduous species coexist? We used TGA to answer this question. Alpha trait values are generally considered to be affected by biotic competition in small regions, while beta values are considered to be affected by habitat filtration in large regional environments [18]. The correlation between traits differs at different scales and signals the coexistence mechanisms of various species.
2. Methods
2.1. Study Site
Xingdou Montane National Nature Reserve is located in Enshi, Hubei Province in Central China. Its geographical location is 29 °57′–30 °10 ’N, 108 °57′–109 °27′ E, with a total area of 68,339 ha. The main peak, Xingdou Montane, rises 1751.2 m above sea level. The area is in the central subtropical to northern subtropical transitional zone, with a dominant continental monsoon climate. The annual average hours of sunshine is 1298.9 h. The annual average temperature is 12 °C. The annual average precipitation is 1471.7 mm. The annual average evaporation is 1109.2 mm, and the distribution of precipitation is uneven with precipitation generally more frequent in June-August and less frequent in October-December. The main soil types were yellow soil below 800 m above sea level, yellow-brown soil from 800–1500 m above sea level, and brown soil at over 1500 m above sea level. The main vegetation type in this area is subtropical evergreen deciduous broadleaved mixed forest, for which Xingdou Montane Nature Reserve plays an important role in biodiversity conservation. The main dominant species of the arbor layer in subtropical evergreen deciduous broadleaved mixed forest communities are Fagus lucida Rehd. et Wils. (Fagaceae), Cyclobalanopsis multinervis Cheng et T. Hong (Fagaceae), and Carpinus fargesiana H. Winkl. (Betulaceae). The main companion species are Machilus lichuanensis Cheng ex S. Lee (Lauraceae) and Enkianthus serrulatus (Wils.) Schneid. Ill. Handb. Laubh. (Ericaceae). The dominant shrub species is Eurya alata Kobuski (Theaceae). The main companion species are Weigela japonica Thunb. (Caprifoliaceae) and Viburnum setigerum Hance (Caprifoliaceae). All botanical names were provided by the Flora of China (http://www.efloras.org/).
2.2. Data Collection and Analysis
We established forty-eight permanent forest dynamics plots (0.04 ha) in Xingdou Montane National Nature Reserve in Hubei Province of central China. The area is in the central subtropical to northern subtropical transitional zone, with a dominant continental monsoon climate. The elevational gradient of the Reserve ranges from 360 m to 1751.2 m. The elevational range of our forest dynamics plots is from 900 m to 1200 m, where typical old-growth evergreen-deciduous broadleaved mixed forests are distributed. For each plot, the diameter at breast height (DBH) and height (H) of all woody stems ≥1 cm DBH were recorded and identified to species level with the help of local botanists.
Specific leaf area, leaf area, and leaf dry matter content are part of the leaf economic spectrum, collectively describing variation in light capture and carbon economy [5]. Wood density is known to co-vary with other hydraulic traits and is thought to reflect variation in water acquisition and drought tolerance strategies [21,22]. Leaf nitrogen and phosphorus content have a significant effect on the photosynthetic efficiency of plants [5], while the nitrogen-phosphorus ratio can serve as an indicator of which nutrient element is restricting plant community productivity. The most recent method determining plant functional traits [23] was adopted in our study [7]. Our study focused on seven functional traits, including specific leaf area (SLA), leaf area (LA), leaf dry matter content (LDMC), wood density (WD), leaf nitrogen content (LNC), leaf phosphorus content (LPC), and nitrogen/phosphorus ratio (N:P). The leaf area was first measured with a LI-3000A leaf area meter (LI-COR Inc., Lincoln, NE, USA). After weighing the mass of the fresh leaves, samples were then dried for 72 h in a 60 °C oven. We calculated SLA as the ratio of leaf area to leaf dry mass (cm2/g). We further quantified leaf nutrients (LNC and LPC) in the lab at Hainan University. To avoid negative effects on tree growth from the sampling process, we did not take tree trunk cores in forest stands. Instead, WD was calculated from measurements of 1–2 cm diameter branches. Bark was removed from the branches before measuring branch volume using an electronic balance. We dried branches in a 105 °C oven for 72 h and then recorded the dry weight. Nitrogen/phosphorus ratio was the ratio of leaf nitrogen content to leaf phosphorus content.
In each permanent forest dynamics plot, branches and leaves were collected from all individuals with DBH ≥ 10 cm. For individuals whose DBH was less than 10 cm, the five largest individuals of each species were sampled. If there were fewer than five individuals of a species in a sample plot, then all individuals of the species in the sample plot were sampled. In all, 2982 individuals were sampled and measured which represented all species present, including 99 deciduous species (1236 trees) and 72 evergreen species (1746 trees) in the 48 plots.
2.3. Trait Gradient Analysis
The community was sorted according to the weighted average trait values of the species (the trait values of the species were weighted by species abundance). As such, the functional traits of the species were divided into two trait values, alpha and beta. The position of a species on the gradient of this trait is called beta trait, which reflects the response of the species to environmental change in the community. The difference between the average properties of the species and the community averages for where they are located is called an alpha trait. This reflects the difference in the adaptation strategies of coexisting species to the same community environment [18]. These were calculated with the formulas of Ackerly and Cornwell [18]:
ti = alpha+beta
Trait gradient analysis is used to decompose the traits according to the following steps: the abundance of species i in sample j is aij. For sample j, the average trait pj can be obtained by a weighted calculation of abundance in sample j (Formula (1)). All samples are then sorted according to the average (pj) of their traits, and that becomes the trait gradient. The beta trait value of species i is the average trait of species () in all samples: the average value calculated by weighted i species abundance (Formula (2)). ti indicates the average range; the alpha trait of species i is the difference between the average trait value (ti) and its beta trait (Formula (3)).
For example, we illustrate the trait gradient analysis for specific leaf area (log) of species in a subtropical evergreen deciduous broadleaved mixed forest in Figure 1. We chose two dominant evergreen (Cyclobalanopsis multinervis, Fagaceae) and deciduous species (Carpinus fargesiana, Betulaceae) highlighted for illustration. First, we calculated the mean trait value for each plot, considering all species in the plot. Then the plots were arranged along a gradient according to their trait means, forming the x-axis of Figure 1 (the‘trait-gradient’). Each species has a point-location for each plot it was found in Figure 1. The x-value is the plot mean for the trait (beta values), and the y-value is the trait value for the individual species (ti). Beta components are the x-axis means for each species, as depicted with larger symbols (yellow circles for evergreen species: Cyclobalanopsis multinervis). Beta components describe the habitats where each species occurs, relative to the mean trait value across all species at those sites. The niche breadth of a species is then characterized as the range of plots occupied. Alpha components measure the deviation of species trait values from the cross-species mean at each site, that is, the deviation in the y dimension from the Y = X line in Figure 1. Alpha components reflect the trait differentiation of each species relative to co-occurring taxa [18].
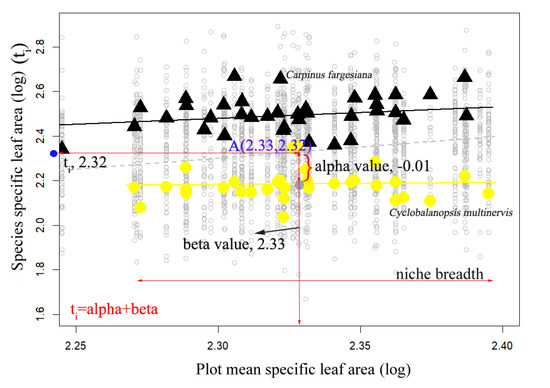
Figure 1.
Scatterplot of species trait values vs. abundance-weighted plot mean trait values for log10 specific leaf area (cm2/g) in a subtropical evergreen deciduous broadleaved mixed forest. Dashed line is X = Y. Values for two species are highlighted for illustration: Cyclobalanopsis multinervis (circles, evergreen species), Carpinus fargesiana (triangles, deciduous species). For each species, the large point shows the mean position of occupied plots (beta value, on abscissa) and mean species trait value (ti, on ordinate). The difference between these, or the distance from the X = Y line, is alpha value. The range of occupied plots on the x-axis is the species niche breadth. Regression line shows abundance-weighted least squares regression of species trait values relative to plot mean trait values. For Cyclobalanopsis multinervis, beta value was 2.33, towards the low end of the gradient, and alpha value was −0.01, so the mean species trait value was 2.32.
We used the TGA method to partition the functional traits and analyze the variation between alpha and beta and other trait values. Next, the skewness analysis method was used to explore the distribution of alpha and beta values, by quantifying the direction of the distribution (to the right or left, or whether it was completely symmetrical or uniform), and calculating the degree of freedom of the distribution. Finally, the purpose of this paper is to compare the difference between evergreen species and deciduous species in functional features. Therefore, the pairwise correlation is a correlation between evergreen and deciduous species, which has been done by correlating the trait matrix of the evergreen species to that of the deciduous one in each examined trait in R. The pairwise correlation test was used because the number of evergreen and deciduous species was not consistent, and the chi-square test and other methods were performed to analyze the correlation between traits. Before running the correlation test of trait parameters, species that occurred only once (singletons) were removed from the analysis, leaving 154 of the 170 species (* p < 0.05; ** p < 0.01; *** p < 0.001). Because SLA, LA, LNC and N:P do not satisfy the normal distribution, only these four trait values were transformed by log10. R 3.2.5 software [24] was used for all analyses.
3. Results
3.1. Comparative Characteristics of the Seven Traits between Evergreen and Deciduous Species
There were significant differences in the seven functional traits between the evergreen and deciduous species. Deciduous species had higher mean values of SLA, LA, LNC, and LPC and lower mean values of LDMC, WD, and N:P than evergreen species. The deciduous and evergreen species had similar niche widths (Table 1). The alpha values of each trait were larger for deciduous than evergreen species (Table 1). The distribution of alpha trait values showed that the SLA, LA, LNC, and LPC are positive in most deciduous species and negative in evergreen species. LDMC, WD, and N:P showed the opposite tendency. The distribution of beta trait values was more consistent across evergreen and deciduous species (similar skewness), with all values positive (Figure 2).

Table 1.
Summary statistics for the seven traits measured across 170 evergreen and deciduous species in Central China. All results and measurements of the various components of TGA are shown in back-log10 transformed (actual) trait values.
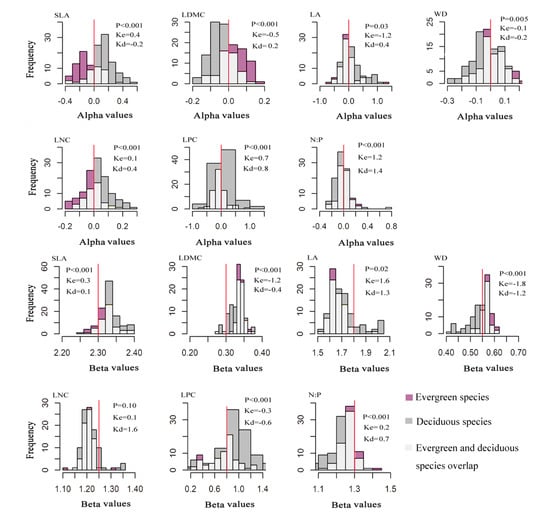
Figure 2.
The distribution of frequency of alpha and beta values for evergreen and deciduous species’ seven functional traits. Note that: The abscissa was alpha values or beta values, and the ordinate was the frequency of alpha or beta values. P indicates whether the correlation is significant (p < 0.05; p < 0.01; p < 0.001. Significant correlation). Ke indicates the degree of skewness of evergreen species. Kd indicates the degree of skewness of deciduous species. K < 0 , the distribution skews to the right of the average. K > 0, the distribution skews to the left of the average.
3.2. Relationship of Alpha and Beta Trait Values between Evergreen and Deciduous Species
The alpha trait values were significantly and positively correlated (p < 0.001, Revergreen > 0.91, Rdeciduous > 0.85) to species mean trait values. There were no significant correlations between niche width and other trait values (species mean, alpha or beta trait value). The beta and alpha trait values did not correlate significantly in either evergreen or deciduous species. However, deciduous species showed a more significant correlation between species mean and beta trait values than did evergreen species (Table 2).
Table 2.
Pairwise correlation coefficients between evergreen and deciduous species for mean trait values, beta values, alpha values, and niche breadth for the seven functional traits measured in a subtropical evergreen deciduous broadleaved mixed forest in Central China. * p < 0.05; ** p < 0.01; *** p < 0.001.
The correlation among different trait parameters varied greatly for both evergreen and deciduous species, but covariance was strongest among beta trait values. Most species’ mean traits had weakly significant correlations or no significance at all (Figure 3). SLA and LDMC, WD and LDMC, and LPC and LNC showed significant and consistent correlation patterns in both evergreen and deciduous species. However, there was some variation in species’ mean traits among the two leaf habits. WD showed a significant correlation to LA and NP in deciduous species, but not in evergreen species (Figure 3).
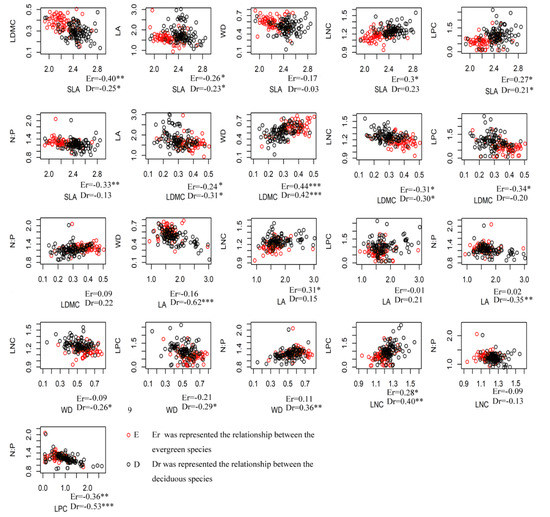
Figure 3.
Scatterplots of species’ mean trait values for all pairwise combinations between evergreen and deciduous species for the seven functional traits in a subtropical evergreen deciduous broadleaved mixed forest in Central China. (* p < 0.05; ** p < 0.01; *** p < 0.001). Note: The red circles represent evergreen species, and the green circles represent deciduous species.
Most alpha trait values showed weakly (r < 0.4) significant correlations or none at all in both evergreen and deciduous species (Figure 4). However, beta trait values had stronger correlations (r > 0.5) than alpha trait values, especially for SLA with LDMC, LA, and WD, and WD with LDMC, LA, LPC and N:P (Figure 5). N:P also had a strong correlation with LA and LPC. In most cases, beta trait values showed similar patterns in both evergreen and deciduous species.
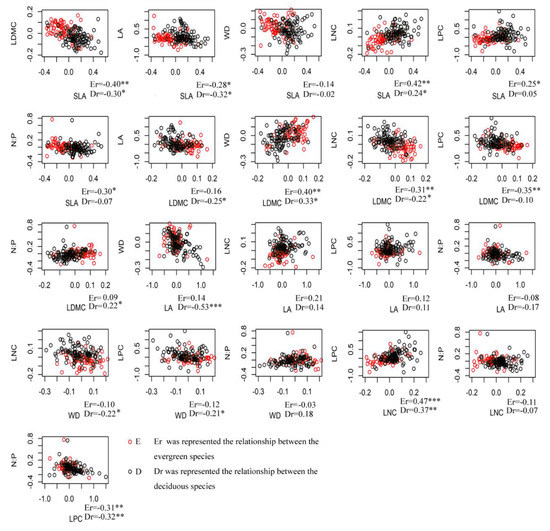
Figure 4.
Scatterplots of species’ alpha trait values for all pairwise combinations of evergreen and deciduous species for the seven functional traits in a broadleaved mixed forest in Central China. (* p < 0.05; ** p < 0.01; *** p < 0.001).
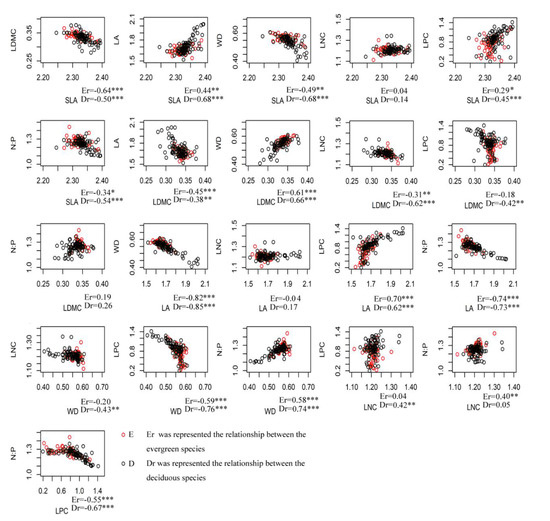
Figure 5.
Scatterplots of species’ beta trait values for all pairwise combinations of evergreen and deciduous species for seven functional traits in a subtropical evergreen deciduous broadleaved mixed forest in Central China. (* p < 0.05; ** p < 0.01; *** p < 0.001).
4. Discussion
4.1. Differences in Deciduous and Evergreen Species
Variation in functional traits among different leaf habits (deciduous and evergreen) may directly drive functional diversity in a community [25]. Based on trait data from nearly 3000 individuals, our study found significant differences in species’ mean traits between deciduous and evergreen species. The different ecological strategies of deciduous and evergreen species provide an opportunity for their stable coexistence in a subtropical montane evergreen and deciduous broadleaf mixed forest community. The deciduous species achieve faster growth rates based on their resource utilization type [26], as described with their high specific leaf area, leaf nutrient content, low leaf dry matter content, and wood density (Table 1). In contrast, evergreen species have more conservative leaf traits, with low specific leaf area and high leaf dry matter content (Table 1), which improve net photosynthesis and plant growth throughout the year [5]. The relatively short annual growth period of deciduous species requires high photosynthesis production to contribute to plant growth and to obtain more carbohydrates [27]. In contrast, evergreen species are thought to adopt conservative strategies in response to habitat conditions, and their leaf traits support lower photosynthesis and transpiration rates [25,27]. Species with a low specific leaf area tend to have low nutrient concentrations (e.g., leaf nitrogen content, leaf phosphorus content), slow maximum photosynthesis and dark respiration rates [28]. High wood density is a marker of root and stem growth, which augments a plant’s ability to intercept light [29]. The rest of the created biomass invests in increasing the hardness of branches (specific stem density) and leaf tissues (leaf dry matter content) to resist low temperature and drought environments [30].
Phosphorus is required to control the turgidity of stomatal guard cells that regulate gas exchange through the stomata, which in turn affects photosynthesis. Therefore, higher leaf phosphorus may provide more effective control over transpiration and allow for rapid growth when conditions are favorable [31]. The relatively frequent occurrence of new leaves in deciduous species creates a large demand for soil nutrients, which are considered luxuries in the context of plant nutrition. Therefore, deciduous species must obtain large amounts of nutrients such as phosphorus and nitrogen in order to form a competitive advantage in the context of coexisting with evergreen species [32]. The leaves of evergreen species have a long life and low nutrient demand for nitrogen and phosphorus. With a higher specific leaf weight and a lower photosynthetic rate, this slow investment return strategy helps evergreen species maintain nutrients in soil-poor habitats, which gives them a competitive advantage [33].
We also found that deciduous and evergreen species had similar niche widths. Niche width can explain the environmental adaptability and resource utilization ability of a population. Species with large niche overlap have similar ecological characteristics or complementary requirements for habitat factors [34]. That evergreens and deciduous species coexist in the subtropical montane evergreen and deciduous broadleaf mixed forest shows that the habitat is suitable for both. A recent study found that complementarity is an important mechanism of coexistence for deciduous and evergreen species [35]. The difference in these evergreen and deciduous ecological strategies directly reduces competition intensity at the local scale because species with different functional traits can better coexist by partitioning resources [36,37]. Species can coexist in communities for extended periods of time if they have close-to-equal performance in the same environment (Hubbell 2001) if they regenerate in different microsites and/or if they partition resources well as adults [9].
4.2. The Dimensions of Alpha and Beta Traits Reflects Intraspecific Differentiation and Interspecific Overlap
The species leaf, wood, and life-type traits were all affected by environmental conditions in the community such as light, temperature, soil moisture, and nutrients [38]. The spatial differentiation of species’ traits reflects their adaptation to different environments [39]. Because species with different traits tend to have different resource needs, competition is often weaker than with species with similar traits. Therefore, competition limits the coexistence of species with similar traits and promotes the distribution of functional patterns in species. Our result confirms that traits have strong plasticity in the contexts of environment and competition [29] and reflect their respective coexistence mechanisms and ecological strategies.
Plant functional traits are the dimension of ecological strategy variation. The dimensions of alpha and beta traits show the differences in intraspecific and interspecific variations and provide an explanation for plant community assembly [19]. We found that the variation in alpha values of functional traits had a wider range than that of beta values. This means that the interaction between coexisting species in various communities is greater than the effect of environmental factors on species’ traits [18,19]. We propose two reasons explain this: (1) The geographical distribution range of the study area was relatively small and may have similar environmental conditions throughout. Thus, the response of traits (beta trait value) to the environment may have converged. (2) Additionally, our plots were located in old, late-successional forests [40,41], and the inter- and intra-species competition may be very strong due to differentiation in traits. Kooyman et al [19] also found similar results in New South Wales, Australia, where trait variation among species was wider within plots than among plots. We found that the variation in the alpha component was more significant for deciduous than evergreen species. This indicates that deciduous species are better able to adjust their strategies in response to co-existing species than are evergreens. This finding is further supported by a recent study in this region where the dominance of deciduous species gradually decreased with succession, resulting in the deciduous species making better use of limited resources including light availability and soil phosphorus [41].
In order to adapt to the local habitat conditions, both evergreen and deciduous species showed trait convergence (overlapping beta values), as was also shown in a previous study [42]. That alpha values of each functional trait had different degrees of differentiation shows that intra-species competition leads to trait differentiation [25], which is an important factor in determining the stability of a community [8]. For example, we found that the degree of differentiation in specific leaf area was highest when it was closely related to ecological strategy [43]. The range in variation of specific leaf area reflects the different response strategies of evergreen and deciduous species to light. Evergreen species improve their utilization efficiency of light resources by lowering their specific leaf area (negative alpha value). However, most deciduous species quickly obtain light resources in the growing season with a high specific leaf area (positive alpha value).
4.3. Pairwise Trait Correlation
The alpha and beta components of traits reflect variation in ecological strategy at different scales of community composition [18]. A high correlation in alpha mean trait values acts as independent axes of differentiation among coexisting species and a high correlation in beta mean trait values show that traits respond in parallel to the dominant abiotic gradients [19]. Our results showed a high correlation in beta components and a low correlation in alpha components for both evergreen and deciduous species. Thus, our study indicates that multiple plant functional traits show higher overall divergence in local communities, but a convergent response to environmental filtering at a larger scale [18]. Many plant traits vary independently among species and across groups of species [44]. The weak correlations of alpha trait values suggest that each trait is an independent differentiation axis between co-occurring species [18]. The greater the interaction between coexisting species, the greater the deviation of species’ alpha trait from the community mean. According to limited similarity theory, species can obtain more resources when functional traits vary in the community [45]. Strong correlation among beta trait components may relate to the convergence of traits under filtering in the same habitat [35].
We observed negative correlations between wood and leaf traits in both evergreen and deciduous species. Our results were similar to other studies that showed some degree of coordination between leaf and stem traits [46]. The leaf traits showed a negative relationship with wood density, which indicates that fast resource use by leaves is accompanied by fast water conduction by the stem. Therefore, above-ground traits respond concordantly to the same habitat stresses promoting rapid resource acquisition [46]. The level of coordination between wood and leaf traits can be multidimensional, meaning that certain wood traits coordinate with leaf traits while others vary independently in determining resource acquisition strategies [47]. The weak or lack of coordination among other traits may have occurred in our study because different plant organs either respond to different selection pressures, respond to the same selection pressures in different ways, or different plant organs respond altogether [48,49,50]. At local scales, coordination among traits was found in some sites. This may have resulted from the occurrence of local processes such as environmental heterogeneity or biotic interactions that promoted a broader range of ecological strategies. For example, Kembel and Cahil [49] suggested that environmental heterogeneity within communities may promote trait coordination because it leads to the coexistence of species with different trait values. Conversely, a lack of coordination suggests that traits represent different ecological strategies that promote independent axes of niche differentiation for plant organs [18]. Local biotic processes, such as competition and/or facilitation [51], increase trait dissimilarity and allow plants to coexist by way of niche differentiation [52,53]. In sum, trade-offs among functional traits reveal major ecological strategies that may provide insight into species distributions and ecosystem processes [54].
5. Conclusions
Using trait-gradient analysis, we partitioned species’ trait values into alpha (within-community) and beta (among-community) components to quantify the effect of the environmental gradient and competition on trait variation. The non-correlation or weak correlation between traits indicated that different traits represent independent dimensions in the growth and development of species of both leaf habits. The correlation between species’ trait mean and the alpha of each trait was very significant, and no significant correlation existed between beta and alpha trait values. The species mean trait values and alpha trait values of different functional traits were weakly or not at all correlated. However, the beta trait values showed a high correlation for both evergreen and deciduous species. Our results indicated that evergreen and deciduous species adopt similar adaptation strategies (beta component) to deal with a changing environment in their community. However, species coexist through an ecological positioning of traits (alpha components) that reduces competition and allows them to obtain more resources. strong environmental filtering constrains the number of successful trait combinations and leads to community-level trait convergence and biotic interactions may eliminate excessively divergent trait combinations, and alternative functional trait combinations may confer equal fitness in the same environment. Our research contributes to a more comprehensive understanding of the mechanisms of forest community construction in a complex forest community. Therefore, an integrated definition of plant strategies is crucial to better understand how plants respond to global environmental changes in both correlative and modeling approaches.
Author Contributions
R.Z. and Y.D. designed this study and improved the English language and grammatical editing. L.Y.(Liangjin Yao) wrote the first draft of manuscript and performed the data analysis. L.Y.(Liangjin Yao) and L.Y.(Lan Yao) did the field works. X.A. gave guidance and methodological advice. All the coauthors contributed to the discussion, revision and improvement of the manuscript.
Funding
This research was financially supported by the Fundamental Research Funds for the Central Non-profit Research Institution of CAF (CAFYBB2018SZ005) and the National Natural Science Foundation of China (41671047 and 31760134).
Acknowledgments
We would like to thank Elizabeth Tokarz at the Yale University for his assistance with the English language and grammatical editing of the manuscript.
Conflicts of Interest
The authors declare no conflict of interest.
References
- Violle, C.; Navas, M.L.; Vile, D.; Kazakou, E.; Fortunel, C.; Ire`ne Hummel, I.; Garnier, E. Let the concept of trait be functional! Oikos 2007, 116, 882–892. [Google Scholar] [CrossRef]
- Cavender-Bares, J.; Kozak, K.H.; Fine, P.V.A.; Kembel, S. The merging of community ecology and phylogenetic biology. Ecol. Lett. 2009, 12, 693–715. [Google Scholar] [CrossRef]
- Lavorel, S.; Garnier, E. Predicting changes in community composition and ecosystem functioning from plant traits, revisiting the Holy Grail. Funct. Ecol. 2002, 16, 545–556. [Google Scholar] [CrossRef]
- Mouillot, D.; Graham, N.A.J.; Sébastien, V.; Mason, N.W.H.; Bellwood, D.R. A functional approach reveals community responses to disturbances. Trends Ecol. Evol. 2013, 28, 167–177. [Google Scholar] [CrossRef] [PubMed]
- Wright, I.J.; Reich, P.B.; Westoby, M.; Ackerly, D.D.; Baruch, Z.; Bongers, F.; Cavender-Bares, J.; Chapin, T.; Cornelissen, J.H.C.; Diemer, M.; et al. The worldwide leaf economics spectrum. Nature 2004, 428, 821–827. [Google Scholar] [CrossRef] [PubMed]
- Weiher, E.; Freund, D.; Bunton, T.; Stefanski, A.; Bentivenga, S. Advances, challenges and a developing synthesis of ecological community assembly theory. Philos. Trans. R. Soc. B. 2011, 366, 2403–2413. [Google Scholar] [CrossRef] [PubMed]
- Kraft, N.J.B.; Valencia, R.; Ackerly, D.D. Functional traits and niche-based tree community assembly in an amazonian forest. Science 2008, 322, 580–582. [Google Scholar] [CrossRef]
- Šímová, I.; Violle, C.; Kraft, N.B.; Storch, D.; Svenning, J.C.; Boyle, B.; Donoghue II, J.C.; Jørgensen, P.; McGill, B.J.; Morueta-Holme, N.; et al. Shifts in trait means and variances in North American tree assemblages, species richness patterns are loosely related to the functional space. Ecography 2015, 38, 649–658. [Google Scholar] [CrossRef]
- Cornwell, W.K.; Ackerly, D.D. Community assembly and shifts in plant trait distributions across an environmental gradient in coastal California. Ecol. Monogr. 2009, 79, 109–126. [Google Scholar] [CrossRef]
- Schamp, B.S.; Aarssen, L.W. The assembly of forest communities according to maximum species height along resource and disturbance gradients. Oikos 2009, 118, 564–572. [Google Scholar] [CrossRef]
- Jung, V.; Violle, C.; Mondy, C.; Hoffmann, L.; Muller, S. Intraspecific variability and trait-based community assembly. J. Ecol. 2010, 98, 1134–1140. [Google Scholar] [CrossRef]
- Messier, J.; Mcgill, B.J.; Lechowicz, M.J. How do traits vary across ecological scales? A case for trait-based ecology. Ecol. Lett. 2010, 13, 838–848. [Google Scholar] [CrossRef] [PubMed]
- Sébastien, A.; Shipley, B. Inter-specific and intra-specific trait variation along short environmental gradients in an old-growth temperate forest. J. Veg. Sci. 2013, 24, 419–428. [Google Scholar]
- Roscher, C.; Schumacher, J.; Gubsch, M.; Lipowsky, A.; Weigelt, A.; Buchmann, N.; Schulze, E.D.; Schmid, B. Interspecific trait differences rather than intraspecific trait variation increase the extent and filling of community trait space with increasing plant diversity in experimental grasslands. Perspect. Plant Ecol. Evol. Syst. 2018. [Google Scholar] [CrossRef]
- Smedt, P.; Ottaviani, G.; Wardell-Johnson, G.; Sykora, K.V.; Mucina, L. Habitat heterogeneity promotes intraspecific trait variability of shrub species in Australian granite inselbergs. Folia Geobot. 2018. [CrossRef]
- Midolo, G.; Frenne, P.D.; Norbert, H.; Wellstein, C. Global patterns of intraspecific leaf trait responses to elevation. Glob. Chang. Biol. 2019, 25. [Google Scholar] [CrossRef]
- Albert, C.H.; Grassein, F.; Schurr, F.M. When and how should intraspecific variability be considered in trait-based plant ecology? Perspect. Plant Ecol. Evol. Syst. 2011, 13. [Google Scholar] [CrossRef]
- Ackerly, D.D.; Cornwell, W.K. A trait-based approach to community assembly, partitioning of species trait values into within-and among-community components. Ecol. Lett. 2007, 10, 135–145. [Google Scholar] [CrossRef]
- Kooyman, R.; Cornwell, W.; Westoby, M. Plant functional traits in Australian subtropical rain forest, partitioning within-community from cross-landscape variation. J. Ecol. 2010, 98, 517–525. [Google Scholar] [CrossRef]
- Guo, Y.L.; Lu, Z.J.; Wang, Q.G.; Lu, J.M.; Xu, Y.Z.; Meng, H.J.; Liu, H.B.; Zhang, J.X.; Bao, D.C.; Qiao, X.J.; et al. Detecting density dependence from spatial patterns in a heterogeneous subtropical forest of central China. Can. J. For. Res. 2015, 45, 34–41. [Google Scholar] [CrossRef]
- Chave, J.; Coomes, D.; Jansen, S.; Lewis, S.L.; Swenson, N.G.; Zanne, A.E. Towards a worldwide wood economics spectrum. Ecol. Lett. 2009, 12, 351–366. [Google Scholar] [CrossRef] [PubMed]
- Bhaskar, R.; Dawson, T.E.; Balvanera, P. Community assembly and functional diversity along succession post-management. Funct. Ecol. 2014, 28, 1256–1265. [Google Scholar] [CrossRef]
- Perez-Harguindeguy, N.; Díaz, S.; Garnier, E.; Lavorel, S.; Poorter, H.; Jaureguiberry, P.; Bret-Harte, M.S.; Cornwell, W.K.; Craine, J.M.; Gurvich, D.E.; et al. New handbook for standardised measurement of plant functional traits worldwide. Aust. J. Bot. 2013, 61, 167–234. [Google Scholar] [CrossRef]
- R Development Core Team. R: A Language and Environment for Statistical Computing; R Foundation for Statistical Computing: Vienna, Austria, 2016. [Google Scholar]
- Tomlinson, K.W.; Poorter, L.; Bongers, F.; Borghetti, F.; Jacobs, L.; Van Langevelde, F. Relative growth rate variation of evergreen and deciduous savanna tree species is driven by different traits. Ann. Bot. Lond. 2014, 114, 315–324. [Google Scholar] [CrossRef]
- Markesteijn, L.; Poorter, L.; Bongers, F. Light-dependent leaf trait variation in 43 tropical dry forest tree species. Am. J. Bot. 2007, 94, 515–525. [Google Scholar] [CrossRef]
- Poorter, L.; Kitajima, K. Carbohydrate storage and light requirements of tropical moist and dry forest tree species. Ecology 2007, 88, 1000–1011. [Google Scholar] [CrossRef]
- Wright, I.J.; Reich, P.B.; Cornelissen, J.H.C.; Falster, D.S.; Groom, P.K.; Hikosaka, K.; Lee, W.; Lusk, C.H.; Niinemets, S.; Oleksyn, J.; et al. Modulation of leaf economic traits and trait relationships by climate. Glob. Ecol. Biogeogr. 2005, 14, 411–422. [Google Scholar] [CrossRef]
- Cornelissen, J.H.C.; Lavorel, S.; Garnier, E.; Díaz, S.; Buchmann, N.; Gurvich, D.E.; Reich, P.B.; ter Steege, H.; Morgan, H.D.; van der Heijden, M.G.A.; et al. A handbook of protocols for standardised and easy measurement of plant functional traits worldwide. Aust. J. Bot. 2003, 51, 335–362. [Google Scholar] [CrossRef]
- Dixon, M.A.; Grace, J.; Tyree, M.T. Concurrent measurement of stem density, leaf and stem water potential, stomatal conductance and cavitation on a sapling of Thuja occidentalis L. Plant Cell Environ. 2010, 7, 615–618. [Google Scholar] [CrossRef]
- Schroeder, J.I.; Kwak, J.M.; Allen, G.J. Guard cell abscisic acid signaling and engineering drought hardiness in plants. Nature 2001, 410, 327–330. [Google Scholar] [CrossRef]
- Givnish, T. Adaptive significance of evergreen vs. deciduous leaves, solving the triple paradox. Silva Fenn. 2002, 36, 703–743. [Google Scholar] [CrossRef]
- Richardson, S.J.; Allen, R.B.; Doherty, J.E. Shifts in leaf N, P ratio during resorption reflect soil P in temperate rainforest. Funct. Ecol. 2008, 22, 738–745. [Google Scholar] [CrossRef]
- Silvertown, J. Plant coexistence and the niche. Trends Ecol. Evol. 2004, 19, 605–611. [Google Scholar] [CrossRef]
- Jin, Y.; Russo, S.E.; Yu, M. Effects of light and topography on regeneration and coexistence of evergreen and deciduous tree species in a Chinese subtropical forest. J. Ecol. 2018, 106. [Google Scholar] [CrossRef]
- Kirby, K.R.; Potvin, C. Variation in carbon storage among tree species, implications for the management of a small-scale carbon sink project. For. Ecol. Manag. 2007, 246, 208–221. [Google Scholar] [CrossRef]
- Mcewan, R.W.; Lin, Y.C.; Sun, I.F.; Hsieh, C.F.; Su, S.H.; Chang, L.W.; Zhang, G.; Song, M.; Wang, H.H.; Hwong, J.L.; et al. Topographic and biotic regulation of aboveground carbon storage in subtropical broad-leaved forests of Taiwan. For. Ecol. Manag. 2011, 262, 1817–1825. [Google Scholar] [CrossRef]
- Moles, A.T.; Warton, D.I.; Warman, L.; Swenson, N.G.; Laffan, S.W.; Zanne, A.E.; Pitman, A.; Hemmings, F.A.; Leishman, M.A. Global patterns in plant height. J. Ecol. 2009, 97, 923–932. [Google Scholar] [CrossRef]
- Fonseca, C.R.; Overton, J.M.; Collins, B.; Westoby, M. Shifts in trait combinations along rainfall and phosphorus gradients. J. Ecol. 2000, 88, 964–977. [Google Scholar] [CrossRef]
- Yao, L.; Ai, X.R.; Lv, S.A.; Feng, G.; Liu, J.C.; Huang, Y.T. Characteristics of community types and structures, and species diversity of natural secondary forests in Xingdou Mountain of Hubei Province. Sci. Silvae Sin. 2015, 51, 1–7. [Google Scholar] [CrossRef]
- Huang, Y.; Zhang, X.; Zang, R.; Fu, S.; Ai, X.; Yao, L.; Ding, Y.; Huang, J.; Lu, X. Functional recovery of a subtropical evergreen-deciduous broadleaved mixed forest following clear cutting in central China. Sci. Rep. 2018, 8, 16458. [Google Scholar] [CrossRef]
- Westoby, M.; Wright, I.J. Land-Plant Ecol on the basis of functional traits. Trends Ecol. Evol. 2006, 21, 261–268. [Google Scholar] [CrossRef]
- Markesteijn, L.; Poorter, L. Seedling root morphology and biomass allocation of 62 tropical tree species in relation to drought- and shade-tolerance. J. Ecol. 2009, 97, 311–325. [Google Scholar] [CrossRef]
- Wardle, D.; Barker, G.; Bonner, K.; Nicholson, K. Can comparative approaches based on plant ecophysiological traits predict the nature of biotic interactions and individual plant species in ecosystems? J. Ecol. 1998, 86, 405–420. [Google Scholar] [CrossRef]
- Fornara, D.A.; Tilman, D. Plant functional composition influences rates of soil carbon and nitrogen accumulation. J. Ecol. 2008, 96, 314–322. [Google Scholar] [CrossRef]
- Carvajal, D.E.; Loayza, A.P.; Rios, R.S.; Delpiano, C.A.; Squeo, F.A. A hyper-arid environment shapes an inverse pattern of the fast-slow plant economics spectrum for above-, but not below-ground resource acquisition strategies. J. Ecol. 2019, 107, 1079–1092. [Google Scholar] [CrossRef]
- Butterfield, B.J.; Bradford, J.B.; Munson, S.; Gremer, J. Aridity increases below-ground niche breadth in grass communities. Plant Ecol. 2017, 218, 385–394. [Google Scholar] [CrossRef]
- Bergmann, J.; Ryo, M.; Prati, D.; Hempel, S.; Rillig, M.C. Root traits are more than analogues of leaf traits: The case for diaspore mass. New Phytol. 2017, 216, 1130–1139. [Google Scholar] [CrossRef] [PubMed]
- Kembel, S.W.; Cahill, J.F. Independent evolution of leaf and root traits within and among temperate grassland plant communities. PLoS ONE 2011, 6, e19992. [Google Scholar] [CrossRef] [PubMed]
- Weemstra, M.; Mommer, L.; Visser, E.J.W.; van Ruijven, J.; Kuyper, T.W.; Mohren, G.M.J.; Sterck, F.J. Towards a multidimensional root trait framework: A tree root review. New Phytol. 2016, 211, 1159–1169. [Google Scholar] [CrossRef] [PubMed]
- López, R.P.; Squeo, F.A.; Armas, C.; Kelt, D.A.; Gutiérrez, J.R. Enhanced facilitation at the extreme end of the aridity gradient in the Atacama Desert: A community-level approach. Ecology 2016, 97, 1593–1604. [Google Scholar] [CrossRef] [PubMed]
- Bernard-Verdier, M.; Navas, M.L.; Vellend, M.; Violle, C.; Fayolle, A.; Garnier, E. Community assembly along a soil depth gradient: Contrasting patterns of plant trait convergence and divergence in a Mediterranean rangeland. J. Ecol. 2012, 100, 1422–1433. [Google Scholar] [CrossRef]
- de la Riva, E.G.; Tosto, A.; Perez-Ramos, I.M.; Navarro-Fernandez, C.M.; Olmo, M.; Anten, N.P.R.; Villar, R. A plant economics spectrum in Mediterranean forests along environmental gradients: Is there coordination among leaf, stem and root traits? J. Veg. Sci. 2016, 27, 187–199. [Google Scholar] [CrossRef]
- Fortunel, C.; Fine, P.V.A.; Baraloto, C. Leaf, stem and root tissue strategies across 758 neotropical tree species. Funct. Ecol. 2012, 26. [Google Scholar] [CrossRef]
© 2020 by the authors. Licensee MDPI, Basel, Switzerland. This article is an open access article distributed under the terms and conditions of the Creative Commons Attribution (CC BY) license (http://creativecommons.org/licenses/by/4.0/).