Article

Deep Sequencing and Analysis of Transcriptomes of Pinus koraiensis Sieb. & Zucc.

1
State Key Laboratory of Tree Genetics and Breeding, School of Forestry, Northeast Forestry University, 26 Hexing Road, Harbin 150040, China
2
Academy of Forest and Environment of Heilongjiang Province, Qiqihar 161005, China
*
Author to whom correspondence should be addressed.
Authors contribute equally to this research.
Forests 2020, 11(3), 350; https://doi.org/10.3390/f11030350
Submission received: 5 February 2020 / Revised: 13 March 2020 / Accepted: 19 March 2020 / Published: 20 March 2020
(This article belongs to the Section Forest Ecophysiology and Biology)

Abstract

:
The objective of this research was to study the differences in endogenous hormone levels and the genes related to reproductive development in Chinese pinenut (Pinus koraiensis) trees of different ages. The apical buds of P. koraiensis were collected from 2-, 5-, 10-, 15-, and 30-year-old plants and also from grafted plants. There were three replicates from each group used for transcriptome sequencing. After assembly and annotation, we identified the differentially expressed genes (DEGs) and performed enrichment analysis, pathway analysis, and expression analysis of the DEGs in each sample. The results showed that unigenes related to reproductive development, such as c64070.graph_c0 and c68641.graph_c0, were expressed at relatively low levels at young ages, and that the relative expression gradually increased with increasing plant age. In addition the highest expression levels were reached around 10 and 15 years of age, after which they gradually decreased. Moreover, some unigenes, such as c61855.graph_c0, were annotated as abscisic acid hydroxylase genes, and the expression of c61855.graph_c0 gradually declined with increasing age in P. koraiensis.

1. Introduction

During the process of reproductive development, plants need to attain a certain size, age, or level of maturity before they can flower, and this pre-flowering period is called the vegetative stage. The first step in flower development is the transition from the vegetative stage (producing buds and leaves) to the reproductive stage (starting to flower) [1]. In most cases, whether or not a plant can become reproductive after a certain stage of growth is determined by environmental factors such as light and temperature [2]. Many plants respond to changes in a well-defined range of relative day and night lengths (photoperiod) and temperature. Under the combined effect of these two factors, plants can enter the reproductive stage and flower buds differentiate [3]. Once this conversion is complete, the floral meristem identity genes promote the formation of individual flowers [4]. Many studies have examined the roles of flower-related genes such as APETALA1 (AP1) [5], APETALA2 (AP2) [6], CAULIflower (CAL) [5], LEAFY (LFY) [7], FRIGIDA (FRI) [8], Arabidopsis CONSTANS (AtCO) [9], and UNUSUAL FLORAL ORGANS (UFO) [10]. At least two genes, LFY and AP1, are necessary not only for flower initiation, but are also sufficient to induce flowering in lateral shoots when overexpressed in transgenic plants [11]. Soon after floral meristem formation, floral organs began to form in a concentric order around the periphery of the meristem. Each floral organ originates from a small number of progenitor cells. These cells then follow a specific developmental pattern to form a recognizable floral primordium through cell proliferation, and then develop from the floral primordium into each organ of the flower [12]. Once all of the primordia are activated, the relative position and the total number of floral organs, as well as the basic structure, leaf order, and symmetry of the flower, are determined, and the flower buds open under appropriate conditions [13]. Thus, in the process of floral organ formation, at the molecular level the transcriptional activity is increased, and the biological pathways are activated [14]. In addition, plant hormones are involved in the process of flower formation; for example, the spatial accuracy of organ initiation depends to a large extent on the antagonistic interaction of the two plant hormones auxin and cytokinin [15]. The auxin maximum is caused by the biosynthesis and polar transport of auxin, which specifies initiation of the floral organs [16]. Related research has shown that YUCCA (YUC) [17] and PIN (PIN) [18] play important roles in controlling auxin biosynthesis and polar transport. In addition, competition between apical and lateral root auxins (apical buds vs. axillary buds) leads to the inhibition of bud growth [19]. At the same time, cytokinin (CK) helps to maintain the auxin maxima by forming an inhibitory domain on the organ primordium [20]. Perturbation of the cytokinin signaling pathway will affect the arrangement of flower organs [20].
The ABC model [21] of flower organ formation describes the genes and mechanisms that regulate flower development. In the process of flower formation, the floral organs are generated from the outside to inside, and this process can be divided into four rounds; sepal (round 1), petal (round 2), stamen (round 3), and carpel (round 4), controlled by three homologous genes (A, B, C) in which A controls round 1, A and B control round 2, B and C control round 3, and C controls round 4 [22]. It also can be explained by saying that sepal formation is controlled by gene A, petal formation is controlled by genes A and B, stamen formation is controlled by genes B and C, and carpel formation is controlled only by gene C. This is the classic ABC model [22]. Studies have shown that the ABC genes in Arabidopsis correspond to AP2, AP3/PI, and AG, respectively. Among them, APETALA1 (AP1) and APETALA2 (AP2) are functional genes, and APETALA1 (AP1) not only controls the characteristics of the sepals and petals, but is also related to the floral meristem [23]. In the process of transformation from vegetative growth to reproductive growth, AP1 is equivalent to the organizer, and its ectopic expression will cause many plants to advance to flowering [24]. In addition, AP1 is also a transcriptional activator that regulates AP3 and PI [25,26]. Class B genes such as APETALA3 (AP3) [26] and PISTILLATA (PI) [25] specify the development of petals and stamens. AGAMOUS (AG) is the only C function gene. Except for AP2, all of these genes are members of the MADS-box transcription factor family [27]. The MADS-box gene family plays an important role in the transition from vegetative growth to reproductive growth, fruit development, and especially in the formation of floral organs [5]. In addition, another group of MADS-box genes, SEP1, SEP2, and SEP3 [28], were found to be essential for petal, stamen, and carpel development; in other words, the SEP gene products are required for B and C gene activity. [28].
Pinus is an important genus of conifers in the pine family (Pinaceae) with a total of 109 species recorded [29]. Pine species are important both ecologically and economically. Pinus koraiensis Siebold & Zucc. (2n = 2x = 24) [30] is widely distributed in Northeast China, Japan, the Korean Peninsula, and the Russian Far East [31]. P. koraiensis is also a nationally protected plant in China that has attracted attention from researchers because it produces economically valuable wood and edible seeds. However, P. koraiensis grows slowly, reaches sexual maturity late, and is difficult to select early in breeding. The tree properties that researchers are most interested in require years of growth to be reliably assessed. Compared to angiosperms, the molecular mechanisms underlying the reproductive development of gymnosperms are not well known. The MADS-box gene family has been characterized in Norwegian spruce and P. radiata [32]. Similar to many angiosperms, the “flowering” of P. radiata starts with the transformation of an indeterminate axillary apex into a determinate reproductive apex, which forms the male and female strobili (cones) [33]. Some studies have shown that the P. radiata gene belonging to the meristem-identity family of FLO/LFY-like genes is a true functional homolog of the Arabidopsis LFY gene [34]. However, research on the internal molecular mechanism of P. koraiensis is still not comprehensive. In this study, we examined the changes in expression of flowering-type genes and hormones at different ages and in different parts of P. koraiensis. Our findings will be of great significance in understanding reproductive development in pines and will accelerate the breeding process and shorten selection time in P. koraiensis. The above-mentioned genes were summarized in Table 1.

2. Materials and Methods

P. koraiensis used in this study was from the Maoershan Forest Farm of Northeast Forestry University. A total of six samples of P. koraiensis apical buds were collected from 2-, 5-, 10-, 15-, and 30-year-old trees and also from grafted trees. Each sample consisted of three replicates. Among the samples, the 2-year-old and 5-year-old trees were at the early vegetative stage, the 10- and 15-year-old trees were at the transition from vegetative to reproductive growth, while the 30-year-old trees were at reproductive stage. The scions on the grafted trees were >50 years old.
Total RNA was extracted using the CTAB method [35], and the purity and concentration of the total RNA samples were determined by absorbance at 260 nm using a NanoDropTM 2000 UV spectrophotometer. For transcriptome sequencing, an equal amount of total RNA was collected from each sample.
RNA sequencing libraries were generated using the NEBNext RNA Library Prep Kit for Illumina (New England Biolabs, USA). Briefly, mRNA was purified from 18 μg of total RNA using poly-T oligo-attached magnetic beads. The RNA samples were fragmented using divalent cations at elevated temperature in NEBNext Reaction Buffer (5X), and the short fragments were then converted to double-stranded cDNA using random hexamer primers and reverse transcriptase. The remaining overhangs were converted to blunt ends via exonuclease/DNA polymerase enzymes. After adenylation of the 3′ ends of the DNA fragments, the NEBNext Adaptor with a hairpin loop structure was ligated to the fragments to prepare for hybridization. The library fragments (240 bp) were purified with the AMPure XP system (Beckman Coulter, Beverly, USA) and amplified by PCR to construct the cDNA library. Finally, the PCR products were purified using the AMPure XP system and the library quality was assessed on the Agilent Bioanalyzer 2100 system.
The library preparations were sequenced on an Illumina Hiseq 2000 instrument to generate the raw sequencing reads. The raw reads were then filtered to remove low quality reads, reads consisting of adapters, and reads containing runs of poly-Ns (unknown bases) to give clean reads. At the same time, the Q20 and Q30 scores, the GC-contents, and the level of sequence duplication in the clean data were calculated for each sample. Trinity [36] was used for transcriptome assembly to generate libraries of non-redundant unigenes.
All non-redundant transcripts were subjected to Basic Local Alignment Search Tool (BLASTx) [37] searches (E-value < 10−5) against public protein databases, including the NCBI non-redundant (nr) [38], the Swissprot protein (Swiss-Prot) [39], the Gene Ontology (GO) [40], the Clusters of Orthologous Groups (COGs) [41], KOG [42] (the database of Clusters of Protein homology), eggNOG4.5 (a database of orthologous groups of genes), [43] and the Kyoto Encyclopedia of Genes and Genomes (KEGG) databases [44]. The predicted amino acid sequences of the unigenes were then annotated using HMMER [45]. GO analysis was used to assign putative gene functions to the uncharacterized sequences. We used the information from the Nr annotation to categorize the unigenes into many functional groups using the topGO R package [46].
In order to fully understand the transcriptomic changes in the apical buds at the different developmental stages, we used DESeq2 [47] to identify DEGs between the apical buds in the different samples compared to 2-year-old trees. We compared the reads which obtained from sequencing to the unigene library, and based on the comparison results, combined with RSEM [48] to estimate the expression level. The expression abundance of the corresponding unigene was expressed by the FPKM (Fragments Per Kilobase of transcript per Million mapped reads) [49]. The DEGs were also annotated using the GO (Gene Ontology) database, and the numbers of DEGs in each GO term were calculated. GO enrichment analysis of the DEGs (DEGs) was implemented by the topGO R package based on the Kolmogorov-Smirnov test [50]. KEGG pathway analysis of the DEGs was performed to identify the associated biochemical and signal transduction pathways. We used KOBAS [51] software to test the statistical enrichment of differentially expressed genes in the KEGG pathways. We used the STRING database [52] to form protein-protein interactions for the DEGs followed by visualization with Cytoscape v3.6 [53].

3. Results

3.1. RNA Sequencing and De Novo Transcriptome Assembly

A total of 18 cDNA libraries were sequenced on an Illumina Hiseq2000 instrument, and we obtained a total of 134.62 Gb of clean reads with an average number of 6,410,479,768 bases in each library. The average GC content was 45.57%. We obtained a total of 100,585 unigenes using Trinity [36] with a total length of 83,979,734 bp. The average and N50 lengths of the unigenes were 834.91 bp and 1561 bp, respectively. Of the resulting unigenes, 33,408 (33.21%) were between 200 and 300 bp in length; 24,178 (24.04%) were 300-500 bp; 18,224 (18.12%) were 500–1000 bp; 14,194 (14.11%) were 1000–2000 bp; and 10,581 (10.52%) were >2000 bp (Figure 1).

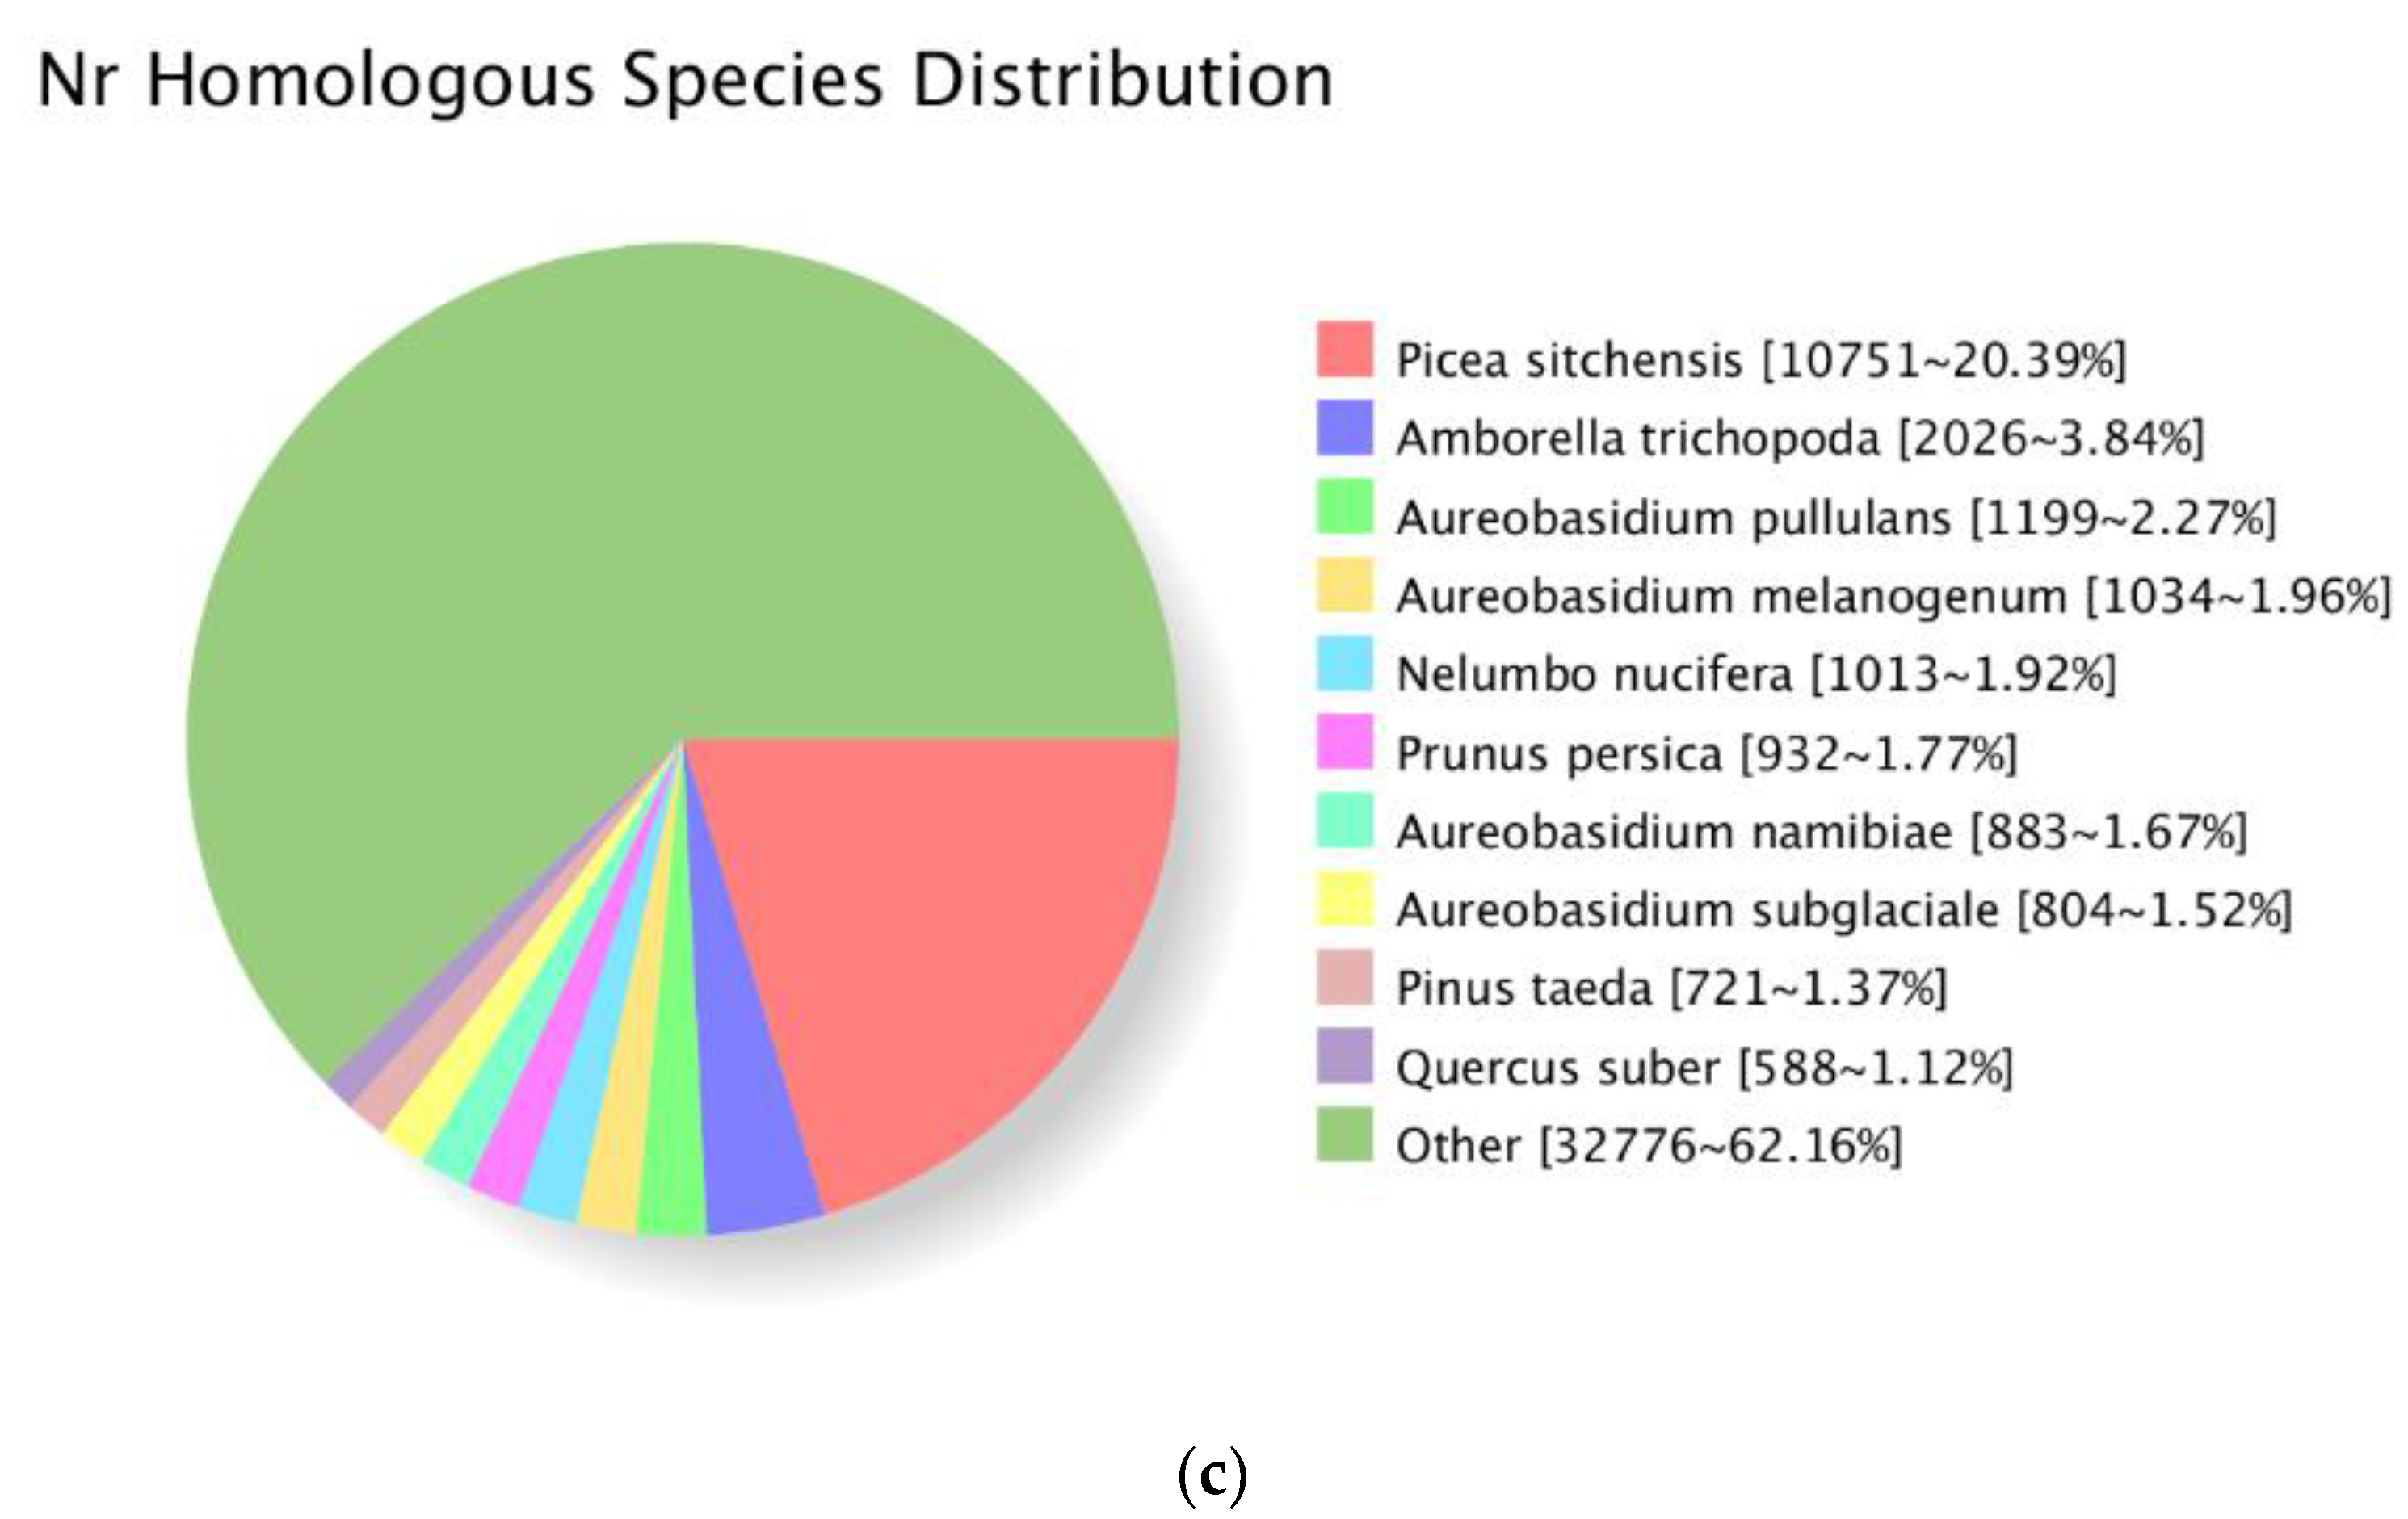
3.2. Functional Annotation of the P. Koraiensis Unigenes

For the unigene annotation, BLASTX [37] was used to search each database and HMMER was used to annotate the amino acid sequences. The results show that a total of 58,706 (58.36%) unigenes were annotated by at least one of the above seven databases.
In the GO annotation, most of the unigenes in the “biological process” category were sub-categorized into metabolic process, cellular process and single-organism process, followed by localization, biological regulation and response to stimulus. In the “cellular component” category, the GO terms “cell”, “cell part”, “membrane, and organelle predominated. While, catalytic activity, binding and transporter activity were the three most represented GO terms in the “molecular function” category. A total of 33,277 unigenes were annotated in the GO analysis.
In addition to GO annotation, a total of 18,577, 51,957, 19,726, 32,241, 30,528, 52,872, and 38,956 unigenes were annotated by the COG, eggNOG, KEGG, KOG, Swissprot, nr, and Pfam databases, respectively (Table 2). In terms of E-value distribution, 55.15% of the homologs ranged between 1e−11 and 1e−50, while a fraction of the sequences (44.85%) showed a threshold e-value < 1e−50 indicating inferior homology (Figure 2a). Among the unigenes annotated using the Nr database, 62.13% had more than 60% similarity with the corresponding gene sequence (Figure 2b). Overall, the unigene sequences exhibited most similar BLASTx matches to gene sequences from Picea sitchensis (20.39%), followed by those from Amborella trichopoda (3.84%), Aureobasidium pullulans (2.27%), Aureobasidium melanogenum (1.96%), Nelumbo nucifera (1.92%) and Prunus persica (1.77%) genes (Figure 2c).

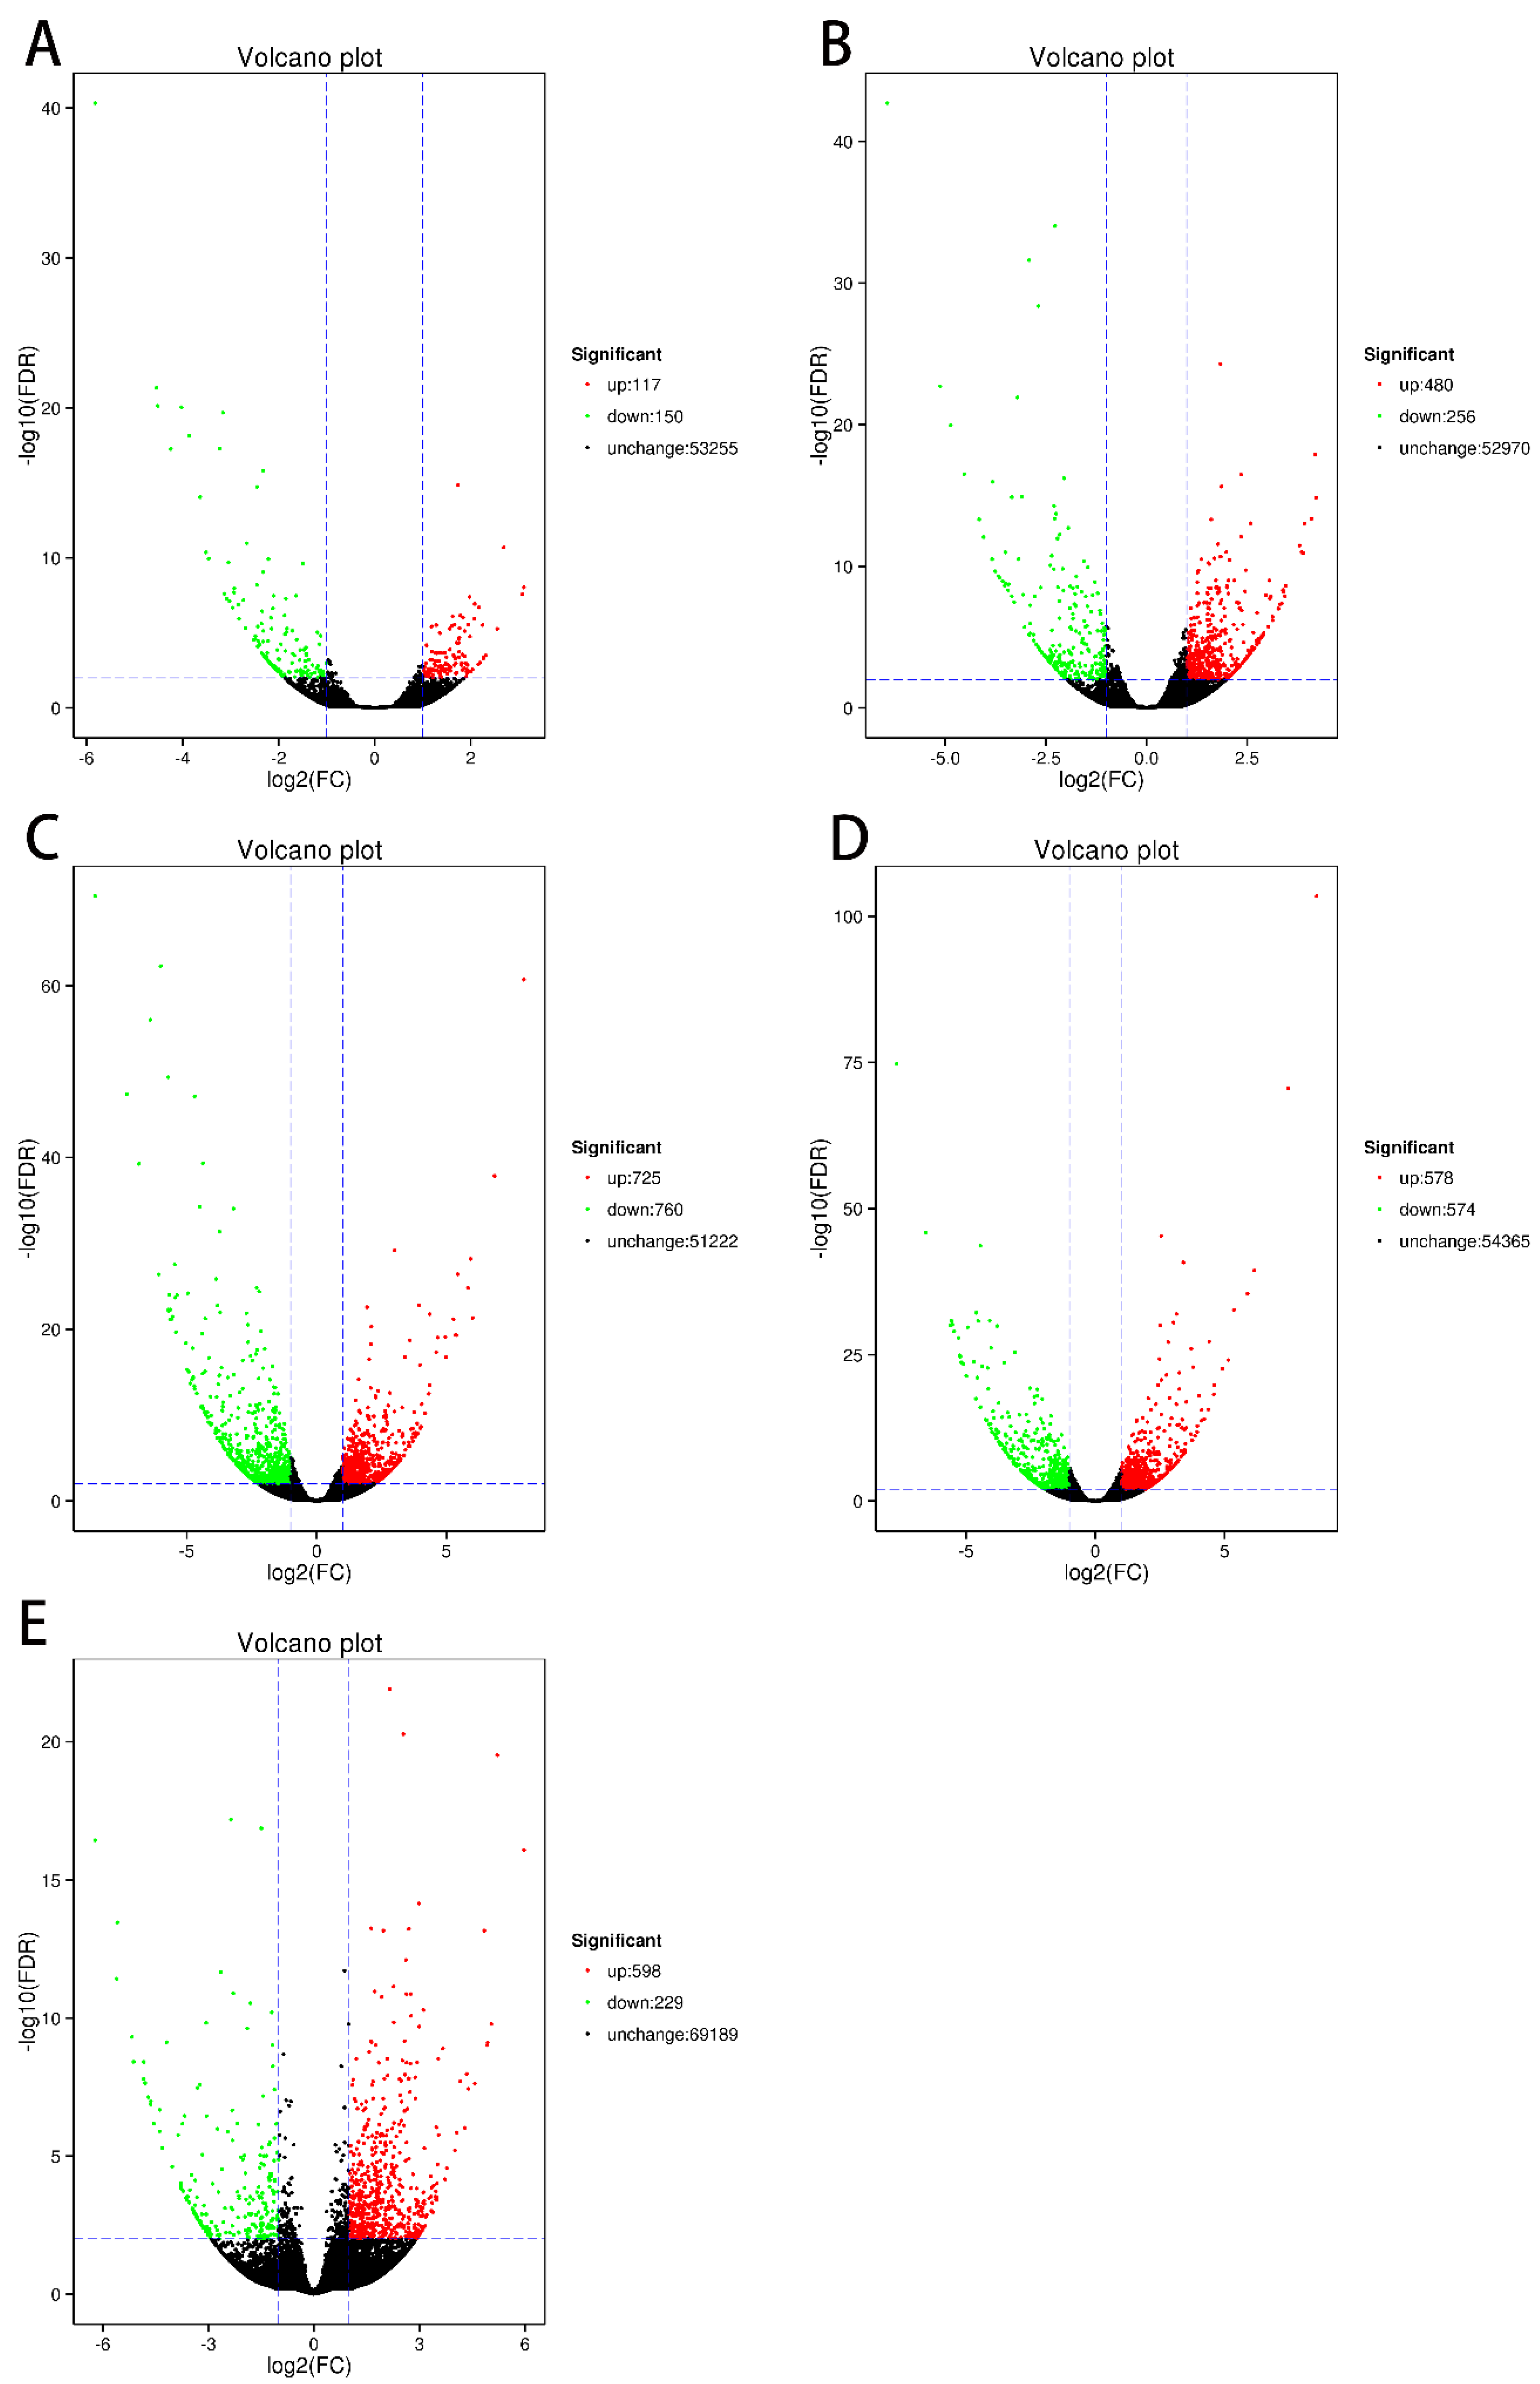
3.3. Identification of Differentially Expressed Genes (DEGs)

The results of the DEG analysis in the five sample comparisons are shown in Table 3 and Figure 3. Using the 2-year trees as the control, we identified 267 (117 up-regulated, 150 down-regulated), 736 (480 up-regulated, 256 down-regulated), 1485 (725 up-regulated, 760 down-regulated), 1152 (578 up-regulated, 574 down-regulated) and 827 (598 up-regulated, 229 down-regulated) DEGs in the 5-, 10-, 15-, 30- and 50-year-old grafted trees, respectively. A total of 671 DEGs were identified by comparing RNA samples from the upper and lower apical buds sampled from the 30-year-old trees; of these DEGs, 378 were up-regulated and 293 were down-regulated.

3.4. Gene Ontology (GO) Enrichment of the DEGs

GO enrichment analysis was performed for the DEGs identified in comparisons of RNA samples between the 2-year-old trees and the five other years using hypergeometric tests [54] (Table S1). The results indicated that GO terms in “biological process” such as “nucleocytoplasmic transport”, “ATP hydrolysis coupled proton transport”, “regulation of transcription from RNA polymerase II promoter”, “proteasomal ubiquitin-independent protein catabolic process”, and “misfolded or incompletely synthesized protein catabolic process” were significantly enriched in each sample. The P-values for these GO terms in the 5-year-old trees were the smallest, which means that the transcription, translation, and energy metabolism activities are strong in the vegetative stage in P. koraiensis. Also, the P-values of GO terms such as “transmembrane transport”, “protein folding”, “carbohydrate metabolic process”, and “intracellular protein transport” were lower in the 10- and 15-year-old trees, indicating that utilization of substances and protein post-processing are active in the transition from vegetative to reproductive growth. In addition, the term “negative regulation of short-day photoperiodism, flowering” was enriched in the “biological process” category in the 15-year-old samples, which indicates that the transition from vegetative to reproductive growth occurs at the age of 15 years in P. koraiensis (Table S1). According to the homology-based annotation, the unigene in this GO term, c68641.graph_c0, may be related to embryogenesis, gibberellin metabolism, negative regulation of floral organ shedding, auxin stimulation, and seed maturation (Table S2). In addition, the gene c68641.graph_c0 was annotated in the Swissprot database as the agamous-like MADS-box protein AGL15. Interestingly, the expression level of this gene in 15-year-old trees is almost 4-fold higher than the average gene expression level (Table S3), indicating that the 15-year-old trees are undergoing differentiation of the reproductive structures. At the same time, the GO terms “maturation of LSU-rRNA from tri-cistronic rRNA transcript (SSU-rRNA, 5.8S rRNA, LSU-rRNA)”and “reproductive fruiting body development” were enriched in 30-year-old trees. GO enrichment of the DEGs in the grafted trees compared with 2-year trees also identified an important GO term, “regulation of flower development” (Table S4). The unigene c64070.graph_c0 for this GO term showed the highest expression level in the grafted (50-year-old) trees, and expression in the 5-, 10-, 15-, and 30-year-old trees was relatively stable. The unigene c64070.graph_c0 was annotated by the NR database as the hypothetical protein GOBAR_AA39818 from Gossypium barbadense. Furthermore, another GO term “response to abscisic acid” was also enriched, and a unigene (c73235.graph_c0) in this GO term had a higher expression level in the grafted trees (Table S4). The unigene c73235.graph_c0 was annotated by the Swissprot database as the CBL-interacting protein kinase 5 from the Oryza sativa.

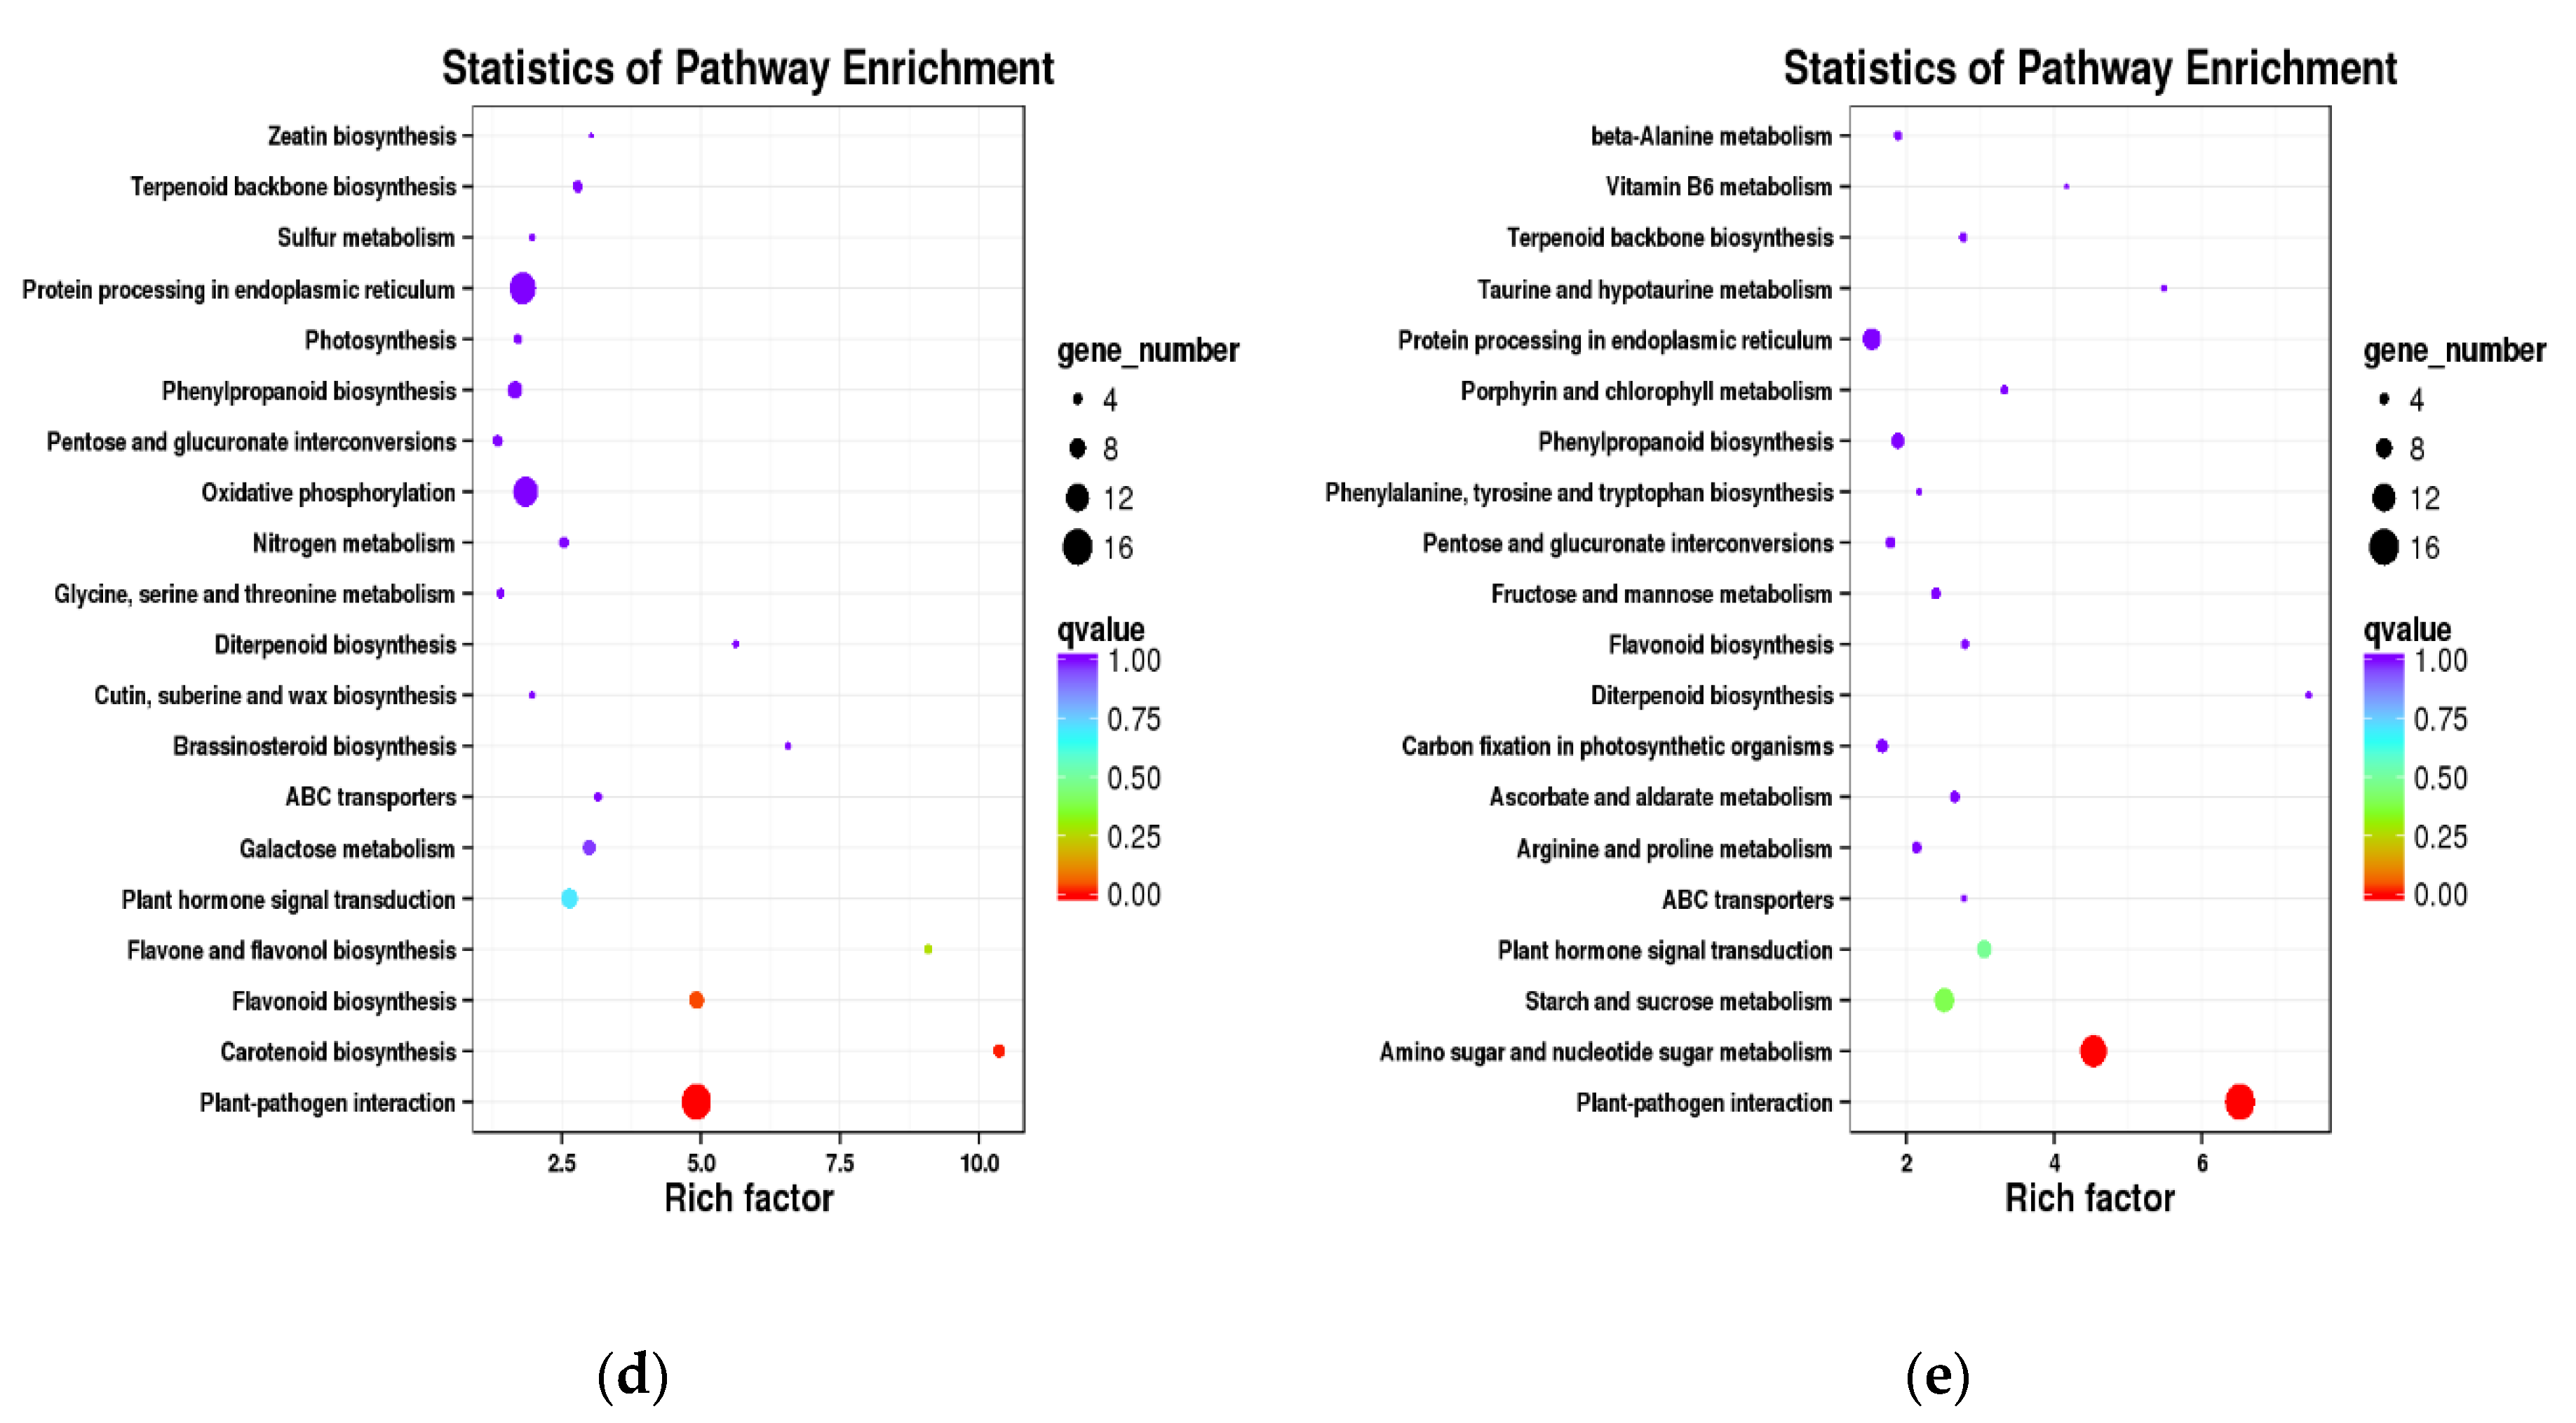
3.5. KEGG Pathway Enrichment Analysis of the DEGs

Pathway enrichment analysis was performed on the P. koraiensis DEGs using the KEGG database [44] to determine hormone-related pathways. The results of KEGG enrichment in trees of various ages is shown in Figure 4, which shows the top 20 pathways with the most significant enrichment levels. In the 5-year sample, 66 DEGs were associated with 34 KEGG pathways. The most significantly enriched pathways were “vitamin B6 metabolism”, “flavone and flavonol biosynthesis”, “protein processing in the endoplasmic reticulum”, “terpenoid backbone biosynthesis”, and “plant-pathogen interactions”. The pathway containing the most DEGs was found to be “protein processing in the endoplasmic reticulum” (17 DEGs).
The same analysis showed that, in the 10-year-old trees, 189 DEGs were associated with 58 KEGG pathways (Figure 4b). Among these, “protein processing in endoplasmic reticulum”, “plant-pathogen interaction”, “glycosphingolipid biosynthesis”, “carotenoid biosynthesis”, and “brassinosteroid biosynthesis” were the most prominent. The highest number of DEGs (27) were in the “endoplasmic reticulum protein processing” pathway. In the 15-year-old sample, 413 DEGs were associated with 86 KEGG pathways (Figure 4c), of which “betalain biosynthesis”, “diterpenoid biosynthesis”, “brassinosteroid biosynthesis”, “protein processing in endoplasmic reticulum”, “plant-pathogen interaction”, and “plant hormone signal transduction” were the most abundant. Similarly, the pathway enriched for the most DEGs (38) was also “protein processing in the endoplasmic reticulum”. In the 30-year-old sample, 255 DEGs were associated with 63 KEGG pathways (Figure 4d). Among them, “carotenoid biosynthesis”, “flavone and flavonol biosynthesis”, “brassinosteroid biosynthesis”, “plant-pathogen interaction”, “diterpenoid biosynthesis”, and “ABC transporters” were the most enriched, with “plant-pathogen interaction” containing the most (16) DEGs. Obviously, pathways such as “plant-pathogen interaction”, “protein processing”, “organic acid synthesis and metabolism”, “starch and sugar metabolism”, and “plant hormone signal transduction” were enriched in each sample,. Moreover, it can be seen from the results that the KEGG pathways are biased towards biosyntheses, such as the biosynthesis of flavonoids and terpenoid skeletons, in the 5-year-old sample. The pigment and hormone biosynthesis pathways in the 10-year-old samples were enriched for carotenoid synthesis and brassinosteroid synthesis, respectively. Moreover, both DEGs involved in carotenoid biosynthesis were up-regulated, indicating that the carotenoid content in the 10-year-old trees is predicted to be higher than that in the 2-year-old sample. Only one DEG was enriched in the brassinosteroid synthesis pathway, and it is the down-regulated gene c55558.graph_c0. and the gene c55558.graph_c0 was a cytochrome P450 gene resembling CYP85A1 from Musa acuminata The relative expression levels of this gene were 4.36, 1.14, 0.64, 0.41, 0.25 and 0.39 in the 2-, 5-, 10-, 15-, 30- and 50-year-old (grafted) samples, respectively. We observed that the expression level of this gene decreases with age. The 15-year and 30-year samples are roughly the same as the 10-year-old sample, except that the 15-year-old sample is more biased towards amino acid metabolism, while “ABC transporter” appears in the 30-year-old sample. In the grafted tree sample, 193 DEGs were associated with 60 KEGG pathways (Figure 4e), and the first five pathways with the most significant enrichment are “plant-pathogen interaction”, “diterpenoid biosynthesis”, “amino sugar and nucleotide sugar metabolism”, “taurine and hypotaurine metabolism”, and “vitamin B6 metabolism”. The grafted tree appears to be more inclined toward the metabolism of various substances, such as glucose and taurine. Also, the ABC transporter pathway appears only in the 30-year-old and grafted tree samples, but the significance of this observation is unclear and needs further research. Finally, the phytohormone signal transduction pathways in the six samples were found to be significantly enriched, and the most DEGs (16) were found in the 15-year-old sample. This indicates that hormone signaling pathways are involved in the regulation of development at different ages in P. koraiensis.

3.6. The Expression Level of Genes Related to Flowers and Hormones

We found 134 DEGs that are related to the development of reproductive structures or hormones in the annotation, and their expression levels in each of the tree RNA samples are shown in Table S5. Here, we selected 30 genes (Figure 5), of which some unigenes, including c65543.graph_c1, c77350.graph_c2 and c72714.graph_c0, are annotated as encoding MADS-box transcription factors. The expression levels of these genes in the 2- and 5-year-old trees was low, and the relative expression levels gradually increased with increasing age. Interestingly, the expression levels peaked in the 10- and 15-year-old trees. We interpreted this to mean that the genes were more actively transcribed during bud differentiation. The expression levels of these genes in the grafted trees was also high, and even exceeded that in the 30-year-old trees. In addition, some unigenes, such as c61855.graph_c0, were annotated as abscisic acid hydroxylase genes. The enzyme encoded by c61855.graph_c0 is related to the decomposition of abscisic acid, and we found that the expression of this gene gradually declined with increasing age of the trees. However, the expression level of c61855.graph_c0 was very high in the grafted trees, almost equal to that in the 2-year-old RNA sample. This shows that the expression of the abscisic acid hydroxylase gene is higher in younger trees, which leads to a lower abscisic acid content. As the trees age, the expression level of the abscisic acid hydroxylase gene declines, and the content of abscisic acid therefore increases significantly. We also found that the abscisic acid content in the grafted tree is low due to a higher relative expression level of c61855.graph_c0.

4. Discussion

4.1. Analysis of DEGs that Show Changes in Expression during Reproductive Development

Genes related to flower development have been well studied in model angiosperms. Plants can regulate flower development through the ABC model, in which the A gene controls sepal formation, the A and B genes jointly control petal formation, the B and C genes together control stamen formation, and the C gene controls carpel formation [28]. In this study, DEGs were found at different ages (2-year-old trees were the control and were compared with 5-, 10-, 15-, and 30-year-old trees and also grafted trees). Among these, a total of 267, 736, 1485, 1152, and 827 DEGs were identified in the 5-, 10-, 15-, and 30-year-old trees and the grafts, respectively. It is worth noting that the number of DEGs gradually increased with increasing age, which indicates that growth and development continue for a long time in P. koraiensis. Among the 5-, 10-, and 15-year-old seedless (non-reproductive) samples, the number of up-regulated DEGs (480) in the 10-year-old sample was far greater than the number of the down-regulated DEGs (256), and the number of DEGs peaked in the 15-year-old sample, of which 725 and 760 were up- and down-regulated, respectively. A previous study reported that the age of reproductive maturity in P. koraiensis is about 12 years [55]. Based on this, we interpreted our results as showing that the expression level of the same gene is expected to gradually increased with increasing tree age. Relative gene expression levels are low during vegetative growth and are highest during differentiation of the reproductive structures.

4.2. Tree Age Affects Flowering Time

It is well known that age is one of the main factors in determining the flowering period of a plant. It can be seen from the GO and KEGG analyses in this experiment that as age increases in P. koraiensis, the tree gradually reaches the reproductive stage. Pathways are mainly shifted away from the metabolism of sugars and organic acids to the metabolism of structural and genetic materials. This is because the plant needs to accumulate a certain amount of nutrients before it can transition to the reproductive growth stage in response to the corresponding signal stimulation, and as the plant ages, the sugar and organic acid contents that are involved in its metabolism increase due to inhibition in some metabolic pathways. Therefore, the transformation in individual plants is reflected in the developmental structures that are related to growth and reproduction. At the gene level, the expression of unigene c64070.graph_c0 increases with increasing age and is related to the regulation of pollen germination and the development of reproductive structures.

4.3. Plant Hormones Related to Flowering

Previous studies have shown that ABA and cytokinin (CK) play important roles in the flowering and development of plants, and they are antagonistic to each other [56]. In this study, we found that the genes c82790.graph_c0 which was related to hormone-mediated signaling pathways resembling a histidine kinase 5 from Herrania umbratical. The gene c76037.graph_c0 was related to cytokinin metabolism, and similar to CKX3 from Pinus tabulaeformis. The gene c55708.graph_c0 was related to ABA-activated signaling pathways, which was resembling the abscisic acid receptor PYL8 from Arabidopsis thaliana. To the best of our knowledge, the effects of flowering are mainly focused on three hypotheses; the anthesis hypothesis [57], the nutrition accumulation hypothesis [58], and the multi-factor hypothesis [59]. At present, the multi-factor hypothesis is widely accepted, and shows that in the process of plant flower formation, the accumulation of nutrients is as important as are plant hormones. The GO enrichment analysis of each P. koraiensis RNA sample showed that processes related to energy metabolism and cell development were significantly enriched. This is because the development of reproductive structures requires not only the accumulation of nutrients, but also a direct supply of energy-rich substances such as ATP [60]. The DEGs enriched in organic acid and pyruvate metabolism pathways are related to this. Also, a large amount of ATP produced during metabolism is not only related to the energy supply, but is also one of the important raw materials for the de novo biosynthesis of CK [61]. In summary, we can conclude that unigenes c82790.graph_c0, c76037.graph_c0, and c55708.graph_c0 are related to the development of reproductive structures in P. koraiensis. The gene arrangement mentioned in the article was shown in Table 4.

5. Conclusions

In this study, high-throughput RNA sequencing was used to generate a P. koraiensis transcriptome dataset containing 100,585 predicted transcripts, and analysis of differentially expressed genes in trees of different ages provided clues to the molecular mechanisms underlying the transition from vegetative to reproductive growth. We conclude from the results of GO and KEGG enrichment analyses that the vegetative period is more directed towards the accumulation of energy and materials, the “flowering” pathway is more active during differentiation of the reproductive buds, and the fruit ripening pathway is more obvious during the reproductive stage. In addition, the molecular mechanisms in the grafted tree are similar to those in the 30-year-old tree. Dynamic changes in gene expression levels were observed, and we identified genes encoding hormone signal elements and MADS-box transcription factors. The results presented here provide a valuable resource for studying the molecular biology of reproductive development and hormone levels in Pinus species.

Supplementary Materials

The following are available online at https://www.mdpi.com/1999-4907/11/3/350/s1, Table S1: GO enrichment analysis using the 2-year-old sample as the control. Each sample comparison was mapped to the DEG statistics table in each GO term. Table S2: In the GO enrichment, the GO annotation of each differentially expressed gene. Table S3: Expression levels of all DEGs identified in this study. Table S4: KEGG pathway enrichment and the DEGs contained in it. Table S5: Expression levels of genes involved in reproduction in P. koraiensis and annotations from each database.

Author Contributions

Conceptualization; H.S., C.W. and S.S. Methodology; C.W. Software; S.Y. Validation; H.S. and C.W. Formal analysis; S.Y. and C.Z. Investigation; S.S., P.Z. and L.Y. Resources; S.S. Data curation; C.Z. Writing—original draft preparation; S.S. and S.Y. Writing—review and editing; H.S. and C.W. Visualization; S.Y. Funding acquisition; H.S. All authors have read and agreed to the published version of the manuscript.

Funding

This research was financially supported by National Key R&D Program of China (2017YFD0600600), and the Heilongjiang Touyan Innovation Team Program (Technology Development Team for High-efficient Silviculture of Forest Resources).

Acknowledgments

We would like to thank the native English speaking scientists of Elixigen Company (Huntington Beach, California) for editing our manuscript.

Conflicts of Interest

The authors declare no conflicts of interest.

References

  1. Santelices, B.; Varela, D. Intra-clonal variation in the red seaweed Gracilaria chilensis. Marine Biol. 1993, 116, 543–552. [Google Scholar] [CrossRef]
  2. Heide, O.M. Primary and secondary induction requirements for flowering in Alopecurus pratensis. Physiol. Plant. 2006, 66, 251–256. [Google Scholar] [CrossRef]
  3. Summerfield, R.J.; Roberts, E.H.; Erskine, W.; Ellis, R.H. Effects of temperature and photoperiod on flowering in Lentils (Lens culinaris Medic.). Ann. Bot. 1985, 56, 659–671. [Google Scholar] [CrossRef]
  4. Sessions, A.; Nemhauser, J.L.; Mccoll, A.; Roe, J.L.; Feldmann, K.A.; Zambryski, P.C. ETTIN patterns the Arabidopsis floral meristem and reproductive organs. Development 1997, 124, 4481–4491. [Google Scholar] [PubMed]
  5. Weigel, D.; Meyerowitz, E.M. Activation of Floral Homeotic Genes in Arabidopsis. Science 1993, 261, 1723–1726. [Google Scholar] [CrossRef] [PubMed]
  6. Okamuro, J.K.; Caster, B.; Villarroel, R.; Van Montagu, M.; Jofuku, K.D. The AP2 domain of APETALA2 defines a large new family of DNA binding proteins in Arabidopsis. Proc. Natl. Acad. Sci. USA 1997, 94, 7076–7081. [Google Scholar] [CrossRef] [Green Version]
  7. Weigel, D.; Alvarez, J.; Smyth, D.R.; Yanofsky, M.F.; Meyerowitz, E.M. LEAFY controls floral meristem identity in Arabidopsis. Cell 1993, 69, 843–859. [Google Scholar] [CrossRef] [Green Version]
  8. Stinchcombe, J.R.; Weinig, C.; Ungerer, M.; Olsen, K.M.; Schmitt, J. A latitudinal cline in flowering time in Arabidopsis thaliana modulated by the flowering time gene FRIGIDA. Proc. Natl. Acad. Sci. USA 2004, 101, 4712–4717. [Google Scholar] [CrossRef] [Green Version]
  9. Martinez-Garcia, J.F.; Virgos-Soler, A.; Prat, S. Control of photoperiod-regulated tuberization in potato by the Arabidopsis flowering-time gene CONSTANS. Proc. Natl. Acad. Sci. USA 2002, 99, 15211–15216. [Google Scholar] [CrossRef] [Green Version]
  10. Wilkinson, M.D.; Haughn, G.W. UNUSUAL FLORAL ORGANS controls meristem identity and organ primordia fate in Arabidopsis. Plant Cell 1995, 7, 1485–1499. [Google Scholar] [CrossRef]
  11. Mouradov, A.; Glassick, T.; Hamdorf, B.; Murphy, L.; Fowler, B.; Marla, S.; Teasdale, R.D. NEEDLY, a Pinus radiata ortholog of FLORICAULA/LEAFY genes, expressed in both reproductive and vegetative meristems. Proc. Natl. Acad. Sci. USA 1998, 95, 6537–6542. [Google Scholar] [CrossRef] [PubMed] [Green Version]
  12. Skriabin, K.G.; Alekseev, D.V.; Ezhova, T.A.; Kozlov, V.N.; Kudriavtsev, V.B.; Nosov, M.V.; Penin, A.A.; Chub, V.V.; Shestakov, S.V.; Shul’Ga, O.A. Determination of type and spatial pattern formation of flower organs: Dynamic model of development. Izvestiâ Akademii Nauk.rossijskaâ Akademiâ Nauk.seriâ Biologiceskaâ 2006, 645–659. [Google Scholar]
  13. Ferrandiz, C.; Navarro, C.; Gomez, M.D.; Canas, L.A.; Beltran, J.P. Flower development in Pisum sativum: From the war of the whorls to the battle of the common primordia. Dev. Genet. 1999, 25, 280–290. [Google Scholar] [CrossRef]
  14. Goto, K. Molecular and genetic analyses of flower homeotic genes of Arabidopsis. J. Biosci. 1996, 21, 369–378. [Google Scholar] [CrossRef]
  15. Blazquez, M.A.; Soowal, L.N.; Lee, I.; Weigel, D. LEAFY expression and flower initiation in Arabidopsis. Development 1997, 124, 3835–3844. [Google Scholar]
  16. Yuan, Z.; Zhou, A.; Liu, Y.; Chengzhong, H. The Polar Transport and Regulatory Mechanism of Auxin in Plant. J. Yunnan. Agric. University 2013, 28, 878–884. [Google Scholar]
  17. Cheng, Y. Auxin biosynthesis by the YUCCA flavin monooxygenases controls the formation of floral organs and vascular tissues in Arabidopsis. Gene. Dev. 2006, 20, 1790–1799. [Google Scholar] [CrossRef] [Green Version]
  18. Křeček, P.; Skůpa, P.; Libus, J.; Naramoto, S.; Tejos, R.; Friml, J.; Zažímalová, E. The PIN-FORMED (PIN) protein family of auxin transporters. Genome Biol. 2009, 10. [Google Scholar]
  19. Balla, J.; Medved’ová, Z.; Kalousek, P.; Matiješčuková, N.; Friml, J.; Reinöhl, V.; Procházka, S. Auxin flow-mediated competition between axillary buds to restore apical dominance. Sci. Rep-UK 2016, 6, 35955. [Google Scholar] [CrossRef] [Green Version]
  20. Müller, C.J.; Larsson, E.; Spíchal, L.; Sundberg, E. Cytokinin-auxin crosstalk in the gynoecial primordium ensures correct domain patterning. Plant Physiol. 2017, 175, 1144–1157. [Google Scholar] [CrossRef] [PubMed]
  21. Lagoze, C.; Hunter, J. The ABC Ontology and Model. In Proceedings of the International Conference on Dublin Core and Metadata Applications, Toyota, Japan, 24–26 October 2001. [Google Scholar]
  22. Litt, A.; Kramer, E.M. The ABC model and the diversification of floral organ identity. Semin. Cell Dev. Biol. 2010, 21, 0–137. [Google Scholar] [CrossRef] [PubMed]
  23. Sussex, I.I.M. Function of the apetala-1 Gene during Arabidopsis Floral Development. Plant Cell 1990, 2, 741–753. [Google Scholar]
  24. Kotoda, N.; Wada, M.; Kusaba, S.; Kano-Murakami, Y.; Masuda, T.; Soejima, J. Overexpression of MdMADS5, an APETALA1-like gene of apple, causes early flowering in transgenic Arabidopsis. Plant Sci. 2002, 162, 679–687. [Google Scholar] [CrossRef]
  25. Goto, K.; Meyerowitz, E.M. Function and regulation of the Arabidopsis floral homeotic gene PISTILLATA. Gene Dev. 1994, 8, 1548–1560. [Google Scholar] [CrossRef] [PubMed] [Green Version]
  26. Lamb, R.S.; Hill, T.A.; Tan, K.G.; Irish, V.F. Regulation of APETALA3 floral homeotic gene expression by meristem identity genes. Development 2002, 129, 2079–2086. [Google Scholar]
  27. Pelaz, S.; Tapia-López, R.; Alvarez-Buylla, E.R.; Yanofsky, M.F. Conversion of leaves into petals in Arabidopsis. Curr. Biol. 2001, 11, 182–184. [Google Scholar] [CrossRef] [Green Version]
  28. Pelaz, S.; Ditta, G.S.; Baumann, E.; Wisman, E.; Yanofsky, M.F. B and C floral organ identity functions require SEPALLATA MADS-box genes. Nature 2000, 405, 200–203. [Google Scholar] [CrossRef]
  29. Plomion, C.; Chagne, D.; Pot, D.; Kumar, S.; Wilcox, P.L.; Burdon, R.D.; Prat, D.; Peterson, D.G.; Paiva, J.; Chaumeil, P.; et al. Pines. In Genome Mapping & Molecular Breeding in Plants; USDA: Washington, DC, USA, 2007; Volume 7, pp. 213–226. [Google Scholar]
  30. Chen, M.M.; Feng, F.; Sui, X.; Li, M.-H.; Zhao, D.; Han, S. Construction of a framework map forPinus koraiensisSieb. et Zucc. using SRAP, SSR and ISSR markers. Trees 2010, 24, 685–693. [Google Scholar] [CrossRef]
  31. Feng, F.J.; Han, S.J.; Wang, H.M. Genetic diversity and genetic differentiation of natural Pinus koraiensis population. J. For. Res. 2006, 17, 21–24. [Google Scholar] [CrossRef]
  32. Tandre, K.; Svenson, M.; Svensson, M.E.; Engström, P. Conservation of gene structure and activity regulation of reproductive organ development of conifers and angiosperms. Plant J. 1998, 15, 615–623. [Google Scholar] [CrossRef]
  33. Mouradov, A.; Glassick, T.; Hamdorf, B.; Teasdale, R.D. Molecular control of early cone development in Pinus radiata. Protoplasma 1999, 208, 3–12. [Google Scholar] [CrossRef]
  34. Müller, B.M.; Saedler, H.; Zachgo, S. The MADS-box gene DEFH28 from Antirrhinum is involved in the regulation of floral meristem identity and fruit development. Plant. J. 2001, 28, 169–179. [Google Scholar] [CrossRef] [PubMed] [Green Version]
  35. Yang, T.W.; Li-Hua, M.A. Extracting DNA from Edible Fungus by Combined Method of CTAB and DNA Gel Purification Kit. Biotechnology 2009, 19, 32–34. [Google Scholar]
  36. Grabherr, M.G.; Haas, B.J.; Yassour, M.; Levin, J.Z.; Thompson, D.A.; Amit, I.; Adiconis, X.; Fan, L.; Raychowdhury, R.; Zeng, Q. Full-length transcriptome assembly from RNA-Seq data without a reference genome. Nat. Biotechnol. 2011, 29, 644–652. [Google Scholar] [CrossRef] [PubMed] [Green Version]
  37. ALTSCHUL, S.F. Gapped BLAST and PSI-BLAST: A new generation of protein detabase search programs. Nucleic Acids. Res. 1997, 25. [Google Scholar] [CrossRef] [PubMed] [Green Version]
  38. Pruitt, K.D.; Tatiana, T.; Maglott, D.R. NCBI Reference Sequence (RefSeq): A curated non-redundant sequence database of genomes, transcripts and proteins. Nucleic Acids. Res. 2005, 33 (Suppl. 1), D501–D504. [Google Scholar] [CrossRef] [PubMed] [Green Version]
  39. Amos Bairoch, R.A. The SWISS-PROT protein sequence data bank and its supplement TrEMBL in 1999. Nucleic Acids. Res. 1999, 28, 49–54. [Google Scholar] [CrossRef]
  40. Gene, O.C.; Mulder, N. The Gene Ontology (GO) project in 2006. Nucleic Acids. Res. 2005, 34, D322–D326. [Google Scholar]
  41. Koonin, E.V.; Tatusov, R.L.; Galperin, M.Y.; Rosanov, M.N. Genome analysis using clusters of orthologous groups (COGs). In Proceedings of the International Conference on Computational Molecular Biology, Bethesda, MD, USA, March 1998; pp. 135–139. [Google Scholar]
  42. Sander, C.; Schneider, R. Database of homology-derived protein structures and the structural meaning of sequence alignment. Proteins 1991, 9, 56–68. [Google Scholar] [CrossRef] [PubMed]
  43. Sean, P.; Damian, S.; Kalliopi, T.; Alexander, R.; Michael, K.; Jean, M.; Roland, A.; Thomas, R.; Ivica, L.; Tobias, D. eggNOG v3.0: Orthologous groups covering 1133 organisms at 41 different taxonomic ranges. Nucleic Acids Res. 2011, 40, D284–D289. [Google Scholar]
  44. Minoru, K.; Susumu, G. KEGG: Kyoto Encyclopedia of Genes and Genomes. Nucleic Acids Res. 2000, 28, 27–30. [Google Scholar]
  45. Nastou, K.C.; Tsaousis, G.N.; Papandreou, N.C.; Hamodrakas, S.J. MBPpred: Proteome-wide detection of membrane lipid-binding proteins using profile Hidden Markov Models. BBA 2016, 1864, 747–754. [Google Scholar] [CrossRef]
  46. Holmes, S.; Alekseyenko, A.; Timme, A.; Nelson, T.; Pasricha, P.J.; Spormann, A. Visualization and Statistical Comparisons of Microbial Communities Using R Packages on Phylochip Data. Pac. Symp. Biocomput. 2011, 20, 142–153. [Google Scholar]
  47. Anders, S.; Huber, W. Differential expression analysis for sequence count data. Genome. Biol. 2010, 1. [Google Scholar] [CrossRef] [Green Version]
  48. Li, B.; Dewey, C.N. RSEM: Accurate transcript quantification from RNA-Seq data with or without a reference genome. Bioinformatics 2011, 12, 323. [Google Scholar] [PubMed] [Green Version]
  49. Trapnell, C.; Williams, B.A.; Pertea, G.; Mortazavi, A.; Kwan, G.; van Baren, M.J.; Salzberg, S.L.; Wold, B.J.; Pachter, L. Transcript assembly and abundance estimation from RNA-Seq reveals thousands of new transcripts and switching among isoforms. Nat. Biotechnol. 2010, 28, 511. [Google Scholar] [CrossRef] [PubMed] [Green Version]
  50. Lopes, R.H.C. Kolmogorov–Smirnov test. Int. Encycl. Stat. Sci. 2014, 10, 718–720. [Google Scholar]
  51. Xie, C.; Mao, X.; Huang, J.; Ding, Y.; Wu, J.; Dong, S.; Kong, L.; Gao, G.; Li, C.Y.; Wei, L. KOBAS 2.0: A web server for annotation and identification of enriched pathways and diseases. Nucleic Acids Res. 2011, 39, W316–W322. [Google Scholar] [CrossRef] [Green Version]
  52. von, M.C.; Martijn, H.; Daniel, J.; Steffen, S.; Peer, B.; Berend, S. STRING: A database of predicted functional associations between proteins. Nucleic Acids Res. 2003, 31, 258–261. [Google Scholar]
  53. Smoot, M.E.; Ono, K.; Ruscheinski, J.; Wang, P.L.; Ideker, T. Cytoscape 2.8: New features for data integration and network visualization. Bioinformatics 2011, 27, 431–432. [Google Scholar] [CrossRef] [Green Version]
  54. Boenn, M. Hypergea: Hypergeometric Tests. 2016. Available online: https://cran.r-project.org/web/packages/hypergea/hypergea.pdf (accessed on 5 February 2020).
  55. Jin, C. The Development of The Gametophytes of Pinus koraiensis. Bull. Bot. Res. 1985, 5, 113–126. [Google Scholar]
  56. Bari, R.; Jones, J.D.G. Role of plant hormones in plant defence responses. Plant Mol. Biol. 2009, 69, 473–488. [Google Scholar] [CrossRef]
  57. Folkerts, G.W.; Folkerts, D.R. Unique Capsule Dehiscence in Sarracenia leucophylla Raf. and a Hypothesis concerning Post-Anthesis Tilting in Sarracenia Flowers. Castanea 1989, 54, 111–114. [Google Scholar]
  58. Hillman, W.S. The physiology of flowering. Q. Rev. Biol. 1963, 109. [Google Scholar]
  59. Charles, E.D.A. A hypothesis about the control of flowering. Ann. Bot-London 1983, 52, 105–107. [Google Scholar] [CrossRef]
  60. Gang, C.; Zhong, W.; Zhang, M.; Li, W. The development of embryo and endosperm in tobacco seed and its nutrients accumulation. J. Yangzhou Uni. Nat. Sci. Ed. 1998, 1, 25–29. [Google Scholar]
  61. Hirschberg, K.; Hubner, G.; Borriss, H. Cytokinin-induzierte de novo-Synthese der Nitratreductase im Embryonen von Agrostemma githago. Planta 1972, 108, 333–337. [Google Scholar] [CrossRef]
Figure 1. Length distribution of P. koraiensis unigenes. The x-axis shows the length intervals of the unigenes, and the y-axis shows the number of unigenes.
Forests 11 00350 g001
Figure 2. Feature of homology search of unigenes against Nr database. (a) E-value distribution of BLAST hits for each unique sequence with a cut-off E-value of 1 × 10⁵; (b) Similarity distribution of top BLAST hits for each unigene; (c) Species distribution of the top BLAST hits for each unigene with a cut-off E-value of 1 × 10⁻⁵.
Forests 11 00350 g002aForests 11 00350 g002b
Figure 3. The volcano diagram of differential expression between samples. The green and red dots in the figure indicate significant DEGs, green indicates down-regulated, red indicates up-regulated, and black dots indicate no significant DEGs. (A) Y2_vs_Y5; (B) Y2_vs_Y10; (C) Y2_vs_Y15; (D) Y2_vs_Y30; (E) Y2_vs_grafted.
Forests 11 00350 g003
Figure 4. KEGG pathway enrichment analysis of the P. koraiensis DEGs showing the top 20 pathways. The abscissa shows the enrichment factors, the ordinate shows the different pathways, the circle sizes represents the number of genes, and the colors represent the q-values. (a) Y2_vs_Y5; (b) Y2_vs_Y10; (c) Y2_vs_Y15; (d) Y2_vs_Y30; (e) Y2_vs_grafted.
Forests 11 00350 g004aForests 11 00350 g004b
Figure 5. Relative expression levels of DEGs related to reproduction and plant hormones. The rows in the heat map represent the individual gene IDs, and the columns represent the samples taken from 2-year-old (Y2), 5-year-old (Y5), 10-year-old (Y10), 15-year-old (Y15), 30-year-old (Y30), and 50-year-old grafted (graft) trees. The changes in expression are indicated by colors ranging from green (down-regulated) to red (up-regulated).
Forests 11 00350 g005
Table 1. Genes associated with flower development.
Related GeneFunction
APETALA1 (AP1)control the characteristics of sepals and petals, be related to the meristem of flowers, a transcriptional activator that regulates AP3 and PI
APETALA2 (AP2)class A genes, control the characteristics of sepals and petals
APETALA3 (AP3)class B genes, specify the development of petals and stamens
PISTILLATA (PI)class B genes, specify the development of petals and stamens
AGAMOUS (AG)class C genes, control the characteristics of stamens and carpel
SEP1, SEP2, and SEP3were found to be essential for petal, stamen, and carpel development, that is the SEP gene product was required for B and C gene activity
CAULIflower (CAL)confer floral identity to emerging floral primordia, a paralogous genes of APETALA1 (AP1), act redundantly to control inflorescence architecture by affecting the domains of LFY expression as well as the relative levels of its activities
LEAFY (LFY)is expressed throughout the flower, participates in the activation of homeotic genes, are expressed in specific regions of the flower, encodes a transcription factor that determines a meristem will generate flowers, is a direct upstream regulator of floral homeotic genes
FRIGIDA (FRI)the flowering time gene, alleles were associated with accelerated flowering
Arabidopsis CONSTANS (AtCO)regulate flowering time, accelerates flowering in response to long days, exerts its inhibitory effect on tuber formation by acting in the leaves
UNUSUAL FLORAL ORGANS (UFO)controls meristem identity and organ primordia fate, related to floral-organ type
YUCCA (YUC)spatially and temporally regulated auxin biosynthesis, is essential for the formation of floral organs and vascular tissues
PIN (PIN)auxin efflux transport proteins, controlling auxin polar transport
Table 2. P. koraiensis unigenes annotated using seven protein databases.
Anno_DatabaseAnnotated_Number
COG_Annotation18,577
GO_Annotation33,277
KEGG_Annotation19,726
KOG_Annotation32,241
Pfam_Annotation38,956
Swissprot_Annotation30,528
eggNOG_Annotation51,957
nr_Annotation52,872
All_Annotated58,706
Table 3. Statistical table of the number of DEGs.
DEG_ComparisonAll_DEGsUp-RegulatedDown-Regulated
Y2_vs_Y5267117150
Y2_vs_Y10736480256
Y2_vs_Y151485725760
Y2_vs_Y301152578574
Y2_vs_grafted827598229
Table 4. Gene ID and description.
Gene_IDDescription
c64070.graph_c0Hypothetical protein GOBAR_AA39818, related to pollen germination and regulates flower development
c68641.graph_c0The SRF-type transcription factor and agamous-like MADS-box protein AGL15, and related to somatic embryogenesis.
c65543.graph_c1It has a K-box region and is a SRF-type and MADS-box transcription factor
c77350.graph_c2It has a K-box region and is a MADS-box transcription factor DAL1 (Picea abies)
c72714.graph_c0It is SRF-type and MADS-box transcription factor with transcription factor activity
c76037.graph_c0CKX3 [Pinus tabuliformis], which is involved in the metabolism of cytokinins and has oxidoreductase activity.
c55708.graph_c0The abscisic acid receptor PYR/PYL family, involved in the abscisic acid-activated signaling pathway.
c61855.graph_c0It participates in abscisic acid catabolic process and has the activity of abscisic acid 8’ hydroxylase
c73235.graph_c0It is related to the signaling mechanism and responds to abscisic acid
c82790.graph_c0Related to hormone-mediated signaling pathway, histidine kinase 5 (Herrania umbratica)
c55558.graph_c0Predicted as CYP85A1(Musa acuminata), which is a brassinosteroid-6-oxidase and involved in the synthesis of sterol hormones.

