Article

Genome-Wide Identification and Characterization of Apple P3A-Type ATPase Genes, with Implications for Alkaline Stress Responses

State Key Laboratory of Crop Stress Biology for Arid Areas/Shaanxi Key Laboratory of Apple, College of Horticulture, Northwest A&F University, Yangling 712100, China
*
Authors to whom correspondence should be addressed.
These authors contributed equally to this work.
Forests 2020, 11(3), 292; https://doi.org/10.3390/f11030292
Submission received: 4 January 2020 / Revised: 3 March 2020 / Accepted: 5 March 2020 / Published: 6 March 2020
(This article belongs to the Section Forest Ecophysiology and Biology)

Abstract

:
The P3A-type ATPases play crucial roles in various physiological processes via the generation of a transmembrane H+ gradient (∆pH). However, the P3A-type ATPase superfamily in apple remains relatively uncharacterized. In this study, 15 apple P3A-type ATPase genes were identified based on the new GDDH13 draft genome sequence. The exon-intron organization of these genes, the physical and chemical properties, and conserved motifs of the encoded enzymes were investigated. Analyses of the chromosome localization and ω values of the apple P3A-type ATPase genes revealed the duplicated genes were influenced by purifying selection pressure. Six clades and frequent old duplication events were detected. Moreover, the significance of differences in the evolutionary rates of the P3A-type ATPase genes were revealed. An expression analysis indicated that all of the P3A-type ATPase genes were specifically expressed in more than one tissue. The expression of one P3A-type ATPase gene (MD15G1108400) was significantly upregulated in response to alkaline stress. Furthermore, a subcellular localization assay indicated that MD15G1108400 is targeted to the plasma membrane. These results imply that MD15G1108400 may be involved in responses to alkaline stress. Our data provide insights into the molecular characteristics and evolutionary patterns of the apple P3A-type ATPase gene family and provide a theoretical foundation for future in-depth functional characterizations of P3A-type ATPase genes under alkaline conditions.

1. Introduction

Apple (Malus × domestica Borkh.) is one of the most important fruit crops and is primarily cultivated in arid and semiarid regions worldwide [1,2,3]. The stress conditions of salt-alkalinized soil are a major limitation to crop production worldwide. According to the statistical analysis by the Food and Agriculture organization (FAO) in 2005, about 830 million hectares of the land throughout the world are affected by salt, over half of which (434 million hectares) are alkaline [4,5]. In China, the characteristics of the northwestern Loess Plateau, which include abundant sunlight, deep soils, and considerable daily temperature variations, make it an ideal region for cultivating apple varieties. However, decreases in rainfall and increases in evaporation have resulted in the salinization and alkalinization of the soil in this region. These changes are detrimental for apple tree growth [1]. Therefore, selecting the optimal apple rootstock that is resistant to salt–alkaline stress is an important goal for apple breeding programs and apple producers.
The salinization and alkalinization of soil are the major global environmental and land resource issues [4,5]. In general, the salinization and alkalinization of soil frequently co-occurring and plant damages induced by the alkalinization (high pH) of soil due to excess NaHCO3 or Na2CO3 are greater than those caused by neutral salts such as NaCl or Na2SO4 [6,7,8]. Salinity stress can seriously influence plant growth. Several studies have revealed that the overexpression of a gene encoding a P-type H+-ATPase lacking the autoinhibitory domain can increase the salt tolerance of plants [9]. Subsequent studies confirmed that the abundance of P-type H+-ATPases changes in salt-stressed plants [10,11]. Moreover, the posttranslational regulation of P-type H+-ATPase activity is essential for the salt tolerance of halophytic species [12]. High pH stress (alkalinization) causes more severe damage on plants by causing root cell injury and death and then leads to the whole plant wilting and even dying. In plants grown in alkaline soil, a deficiency in PKS5 (salt overly sensitive 2-like protein kinase 5) reportedly increases the tolerance to alkaline stress. Moreover, PKS5 can phosphorylate Ser-931 of P-type H+-ATPases, thereby inhibiting the enzymatic activity [13]. The P-type H+-ATPases activity remains a relatively low level without any stress and increases under saline-alkali stress [14]. In Arabidopsis, the P-type H+-ATPase AHA2 can be regulated by the Ca2+ Sensor SCaBP3/CBL7 and then alkali tolerance is increased [15]. In apple, the P-type H+-ATPases play a key component in regulation rhizosphere acidification [16]. Overall, P-type H+-ATPase (P3A-type ATPase) genes are crucial for plant responses to salt–alkaline stress.
Genes encoding P-type ATPases are widely distributed and indispensable in most plant species, in which they are involved in transporting diverse small cations and phospholipids [17,18]. The “P-type” in the name of these enzymes is derived from “phosphorylated intermediate” [19,20,21]. The P-type ATPases consist of only one catalytic subunit, with considerable domain motions during transport. The structural characterization of plant P-type ATPases has revealed the presence of 8–12 transmembrane domains (TMDs), with the C and N termini of these enzymes exposed to the cytoplasm, as well as the phosphorylation and ATP-binding sites [22]. The P-type ATPase gene superfamily is one of the largest plant gene families [21,23]. These genes were divided into five major families (P1, P2, P3, P4, and P5) with subfamilies (P1B, P2A, P2B, P3A, and P3B) based on the sequence identity and ion specificity [24]. For instance, all of the heavy metal pumps that share significant sequence similarities are classified into the P1B subfamily; P1A-ATPase represents the part of the bacterial K+ transport system; Ca2+ pumps belong to the P2A-ATPases and P2B-ATPases, Na+(H+)/K+ pumps in animals and Na+ pumps in fungi are considered as P2C-ATPases and P2D-ATPases, respectively. The plasma membrane H+-ATPases, which mediate ATP-dependent H+ transport across the plasma membrane or tonoplast, are classified in the P3 family, P4-ATPases are considered as putative lipid flippases [21,22,25]. The P1B-ATPase transporters such as ATP7A and ATP7B (involved in the regulation of cytoplasmic copper homeostasis via pumping copper into the endomembrane system or out of cell) and mutation of these two genes cause neuropsychiatric disorders such as Menkes and Wilson disease [26]. The P3 family comprises two main subfamilies, namely P3A-type and P3B-type [27,28]. The P3A-type ATPase genes normally encode proton pumps that are located in the plasma membrane, where they mediate the transport of H+ across the plasma membrane and play crucial role in acidification of the aqueous fraction of the cell wall apoplast. In contrast, Ma10 belongs to the P3A-type ATPase gene family, but the encoded enzyme is localized to the tonoplast, where it promotes the vacuolar acidification of apple fruit [29]. Moreover, PhPH1, which encodes a P-type ATPase belonging to the 3B subfamily in petunia, was believed to comprise only bacterial Mg2+ transporters [30]. Furthermore, PhPH1 is present in the tonoplast and cannot transport H+ independently, but it enhances the H+ transport activity in petunia via its interaction with PhPH5 [28].
Gene duplication and selection are two of the major driving forces of morphogenetic evolution. The duplicated genes are nonfunctional or they evolve novel functions (neofunctionalization) or undergo functional differentiation (subfunctionalization) [2,3,31]. During evolution and domestication, a large proportion of the duplicated genes become nonfunctional because they accumulate deleterious mutations, whereas other duplicated genes undergo neofunctionalization; they are eventually preserved under positive selection pressure [31,32].
Apple, which is a member of the genus Malus in the family Rosaceae, has undergone one autopolyploidization event during its evolution [33,34]. Additionally, a whole genome duplication (WGD) during apple domestication increased the number of chromosomes from nine to seventeen. The duplicated genes arising from the WGD as well as random duplications and segmental duplications exhibited expressional and functional divergence [35]. Thus, deciphering the evolutionary divergence of duplicated apple genes should be investigated during the speciation process.
In this study, the P3A-type ATPase gene family was analyzed using the doubled haploid GDDH13 draft genome [32]. Fifteen P3A-type ATPase genes were identified, and the physical and chemical properties of the encoded enzymes were determined. The chromosomal localization, gene structure, gene loss and duplication, and evolution of the P3A-type ATPase genes were also investigated. Additionally, we analyzed the expression of apple P3A-type ATPase genes in various tissues and in response to alkaline stress. Moreover, the subcellular localization of one P3A-type ATPase (MD15G1104800), which is responsive to alkaline stress, was conducted. Our results uncover the molecular characteristics and evolutionary patterns of the P3A-type ATPase gene family and provide the theoretical basis for future in-depth elucidations of the biological functions of P3A-type ATPases under alkaline conditions.

2. Materials and Methods

2.1. Plant Materials and Stress Treatments

The apomictic apple rootstock ‘Fupingqiuzi’ (Malus prunifolia (Willd.) Borkh.) was used in this study. Seedlings were initially cultivated as described by Wen et al. [1], after which the seedlings with 7–8 true leaves were moved to a hydroponics system and cultured according to the previous report by Wen et al. [1]. The hydroponics system included plastic basins (35 cm × 25 cm × 10 cm) containing 5 L half-strength Hoagland nutrient solution [36] that was continuously aerated with an air pump. To simulate alkaline stress, the pH of the solution was adjusted to 9.96 ± 0.12 by adding 20 mM NaHCO3 and 20 mM Na2CO3 (1:1 volume). The positive and negative controls consisted of seedlings that were not exposed to alkaline stress and the solution under alkaline stress without seedlings, respectively. The solutions were refreshed every 3 days, and the pH of the control and alkaline treatment solutions was adjusted as needed.

2.2. Identification and Phylogenetic Analysis of P3A-Type ATPase Genes

The P3A-type ATPase (PhPH5) amino acid sequences in petunia [25] and Arabidopsis thaliana [20] were retrieved from the NCBI (https://www.ncbi.nlm.nih.gov/) and The Arabidopsis Information Resource (TAIR) (http://www.arabidopsis.org/) databases, respectively. These sequences were used as queries for identifying homologous genes in basic local alignment search tool (BLAST) searches of the reference genomes of apple [34], pear (Pyrus communis L. “Bartlett”) [37], peach (Prunus persica (L.) Batsch) [38], and black raspberry (Rubus occidentalis L.) [39] as described by Tatusov et al. [40] and Ma et al. [2,3]. Briefly, a local BLAST database was performed for each species with the BLAST 2.2.24 program (http://blast.ncbi.nlm.nih.gov/Blast.cgi), after which the putative orthologous genes were identified using an all-against-all protein BLAST search based on the reciprocal best similarity match.
Regarding the phylogenetic analysis, Clustal X2 (http://www.clustal.org/) was performed to align multiple amino acid sequences, after which a phylogenetic tree was generated based on the resulting dataset with MEGA (version 7) software (https://www.megasoftware.net/). Specifically, the neighbor-joining (NJ) and maximum-likelihood (ML) methods were used [41]. The parameters for the NJ method were as follows: positive deletion; bootstrap, 1000 replicates; and p-distance. The parameters for the ML method were as follows: bootstrap, 1000 replicates; partial deletion; Jones-Taylor-Thornton; and branch-swap filter, very strong.

2.3. Analysis of the Structure, Conserved Motifs, and Transmembrane Domains of P3A-Type ATPases

The exon–intron organization of the P3A-type ATPase genes was visualized with the Gene Structure Display Server 2.0 (http://gsds.cbi.pku.edu.cn/). The coding sequences were aligned to their corresponding genomic sequences. The alignment was manually adjusted, if necessary. The conserved TMDs of the P3A-type ATPases were predicted with the online program TMHMM version 2.0 (http://www.cbs.dtu.dk/services/TMHMM/#opennewwindow).

2.4. Estimation of Gene Duplication and Loss

Gene duplication and loss were identified based on manually checking each clade of the phylogenetic tree. Each clade was considered to include at least one P3A-type ATPase gene from each species. The classification of gene family members in more than one clade and clades with more than one gene family member from each species were assumed to be the result of one or more gene duplications. In addition, gene loss was considered to have occurred if a P3A-type ATPase gene from one or more species was absent in a clade. Gene duplication and loss were verified via searching the GenBank database with the BLASTp algorithm.

2.5. Analysis of Positive Selection

Clustal X2 was performed to align the amino acid sequences encoded by P3A-type ATPase genes, and the resulting dataset together with the corresponding coding sequences were analyzed with PAL2NAL (http://www.bork.embl.de/pal2nal/). The PAL2NAL results were conducted to calculate the ω (dN/dS) values for the different branches derived from the phylogenetic tree based on the branch-specific algorithm in Codeml from PAML (version 4.9) [42]. For the one-ratio model, the ω value is the same for all branches, whereas in the two-ratio model, the ω values vary among different branches (background and foreground branches). The likelihood ration test was used to determine the optimized ω values for both models [43].
The P3A-type ATPase gene coding sequences were aligned with Clustal X2, after which the alignment was manually adjusted. The resulting data were performed to estimate the ω value with the ML method of the KaKs Calculator package (version 2.0) [44]. Variations in the ω values were tested with a pairwise comparison as described by Ma et al. [2,3].

2.6. RNA Extraction and qRT-PCR Analysis

Five apple tissues (flowers at full bloom, roots, mature leaves, ripening fruits, and stems) were analyzed in a quantitative real-time polymerase chain reaction (qRT-PCR) assay. Total RNA was extracted with the RNAprep Pure Plant kit (Tiangen, Beijing, China). The TransScript One-Step gDNA Removal and cDNA Synthesis SuperMix kit (TRANS, Beijing, China) was used to synthesize the first-stand cDNA. The subsequent qRT-PCR assay was completed with the SYBR Green I Master Mix (TaKaRa, Dalian, China) and the 7500 Real-Time PCR System (Applied Biosystems, Foster City, CA, USA). Relative gene expression levels were determined with the 2−ΔΔCt method [45]. All analyses involved three biological replicates. A previously described actin gene [46] was used as a reference control. Details regarding the qRT-PCR primers are listed in Table S1.

2.7. Measurement of the Solution pH and Analysis of the Transcriptome

After a 15-day cultivation, seedlings were moved to a new hydroponics system, and the solution pH was adjusted to 9.96 ± 0.12. Root samples were collected at 0, 2, 4, 8, 24, and 48 h and then immediately frozen in liquid nitrogen and then stored at −80 °C for the subsequent RNA extraction, qRT-PCR analysis, and transcriptome sequencing. The RNA extraction and qRT-PCR analysis were the same as described above. The pH of the solution at various time-points was measured with a pH meter (Denver Instrument, USA). The RNA sequencing (RNA-seq) libraries were constructed as described by Lou et al. [47] by the Biomarker Biotechnology Corporation (Beijing, China). The libraries were sequenced with the HiSeq™ 2000 platform (Illumina, San Diego, CA, USA) (150-bp paired-end reads). Low quality reads, such as adapter sequencing, unknown nucleotides (N) >5%, or Q20 <20%, were removed. The Tophat2 software (version 2.1.1; http://ccb.jhu.edu/software/tophat) was used to map clean reads, which were filtered from the raw reads to the draft genome of the diploid apple cultivar “Golden Delicious” [34]. The potential duplicate molecules were removed based on the aligned records from the aligners in BAM/SAM format. Gene expression was estimated based on the reads per kilobase per million reads (RPKM) by the Cufflinks software (version 2.2.0; http://cole-trapnell-lab.github.io/cufflinks/). The DESeq and Q-value were used to evaluate differential gene expression. Gene abundance differences between samples were calculated based on the ratio of the FPKM values. The threshold of the p-value in multiple tests were used to compute the significance of the differences based on the false discovery rate (FDR) control method.

2.8. Subcellular Localization of Apple P3A-Type ATPases in Arabidopsis thaliana Protoplasts

The complete coding region of an apple P3A-type ATPase gene (MD15G1108400) was amplified from cDNA derived from the apple rootstock “Fupingqiuzi” with the following primer pair: 5′-ATGGGCCCACTCGTGGATC-3′ and 5′-TCAAACTGTATAATGTTGTTGGATTGTA-3′. The PCR product was purified and inserted into the pEASY-Blunt vector (Transgene, Beijing, China). The complete coding sequence was then inserted into the expression vector pHBT-GFP-NOS under the control of the Cauliflower mosaic virus 35S promoter, thus producing the constitutive fusion protein MD15G1108400-GFP. The recombinant plasmid was transformed into A. thaliana protoplasts according to the PEG-calcium transfection protocol described by [48]. A plasma membrane marker (pm-rk, CD3-1007) labeled with mCherry was used as the control [49]. The corresponding sequence was included in cotransformation experiments with the MD15G1108400-GFP fusion construct. The fluorescence from the GFP in A. thaliana protoplasts was detected with the TCS SP8 confocal laser scanning microscope (Leica, Germany) at 12–24 h after the transfection.

2.9. Data Analysis

The statistical analysis was performed using SPSS version 17.0 (SPSS Inc., Chicago, IL, USA). Two-tailed tests were used to estimate the significant difference values. Unless otherwise stated, differences were significant at p < 0.01.

3. Results

3.1. Identification, Characterization, and Genomic Distribution of Apple P3A-Type ATPase Genes

Fifteen putative P3A-type ATPase genes were identified in the draft genome of the diploid apple cultivar “Golden Delicious” (Table S2). The physical and chemical properties of the P3A-type ATPases were characterized with ProtParam (https://web.expasy.org/protparam/), and the results are presented in Table 1. The P3A-type ATPases consisted of 930 (MD17G1220200) to 1032 (MD15G1108400) amino acids, with predicted molecular weights ranging from 102.12 kDa to 113.75 kDa. The theoretical isoelectric point ranged from 5.37 (MD17G1155800) to 8.64 (MD17G1220200) and the grand average of hydropathicity (GRAVY) ranged from 0.02 (MD15G1108400) to 0.19 (MD03G1197800). Additionally, the instability index of the P3A-type ATPases ranged from 32.68 (MD09G1223600) to 40.21 (MD15G1108400) and the aliphatic index ranged from 100.4 (MD15G1108400) to 107.25 (MD03G1197800). We also predicted the conserved TMDs of the P3A-type ATPases. The results indicated that all P3A-type ATPase gene family members encode 7–10 TMDs (Figure S1), with most encoding eight or nine TMDs.
An analysis of the genomic distribution of the 15 P3A-type ATPase genes (Figure 1A) revealed that 11 of these genes were located on four homologous pairs of chromosomes (13 and 16, 9 and 17, 8 and 15, and 6 and 14). Additionally, chromosome 2 included two P3A-type ATPase genes, whereas chromosomes 3 and 4 had one P3A-type ATPase gene each. Chromosome 17 carried the most P3A-type ATPase genes (three), followed by chromosomes 9 and 2 (two) and eight chromosomes with one P3A-type ATPase gene. Moreover, the WGD and segmental duplication that occurred during apple domestication were important events that contributed to the expansion of the apple gene family [30,31]. Many of the duplicated genes were retained within the apple genome [2]. To determine whether the P3A-type ATPase genes were influenced by diverse selection pressures and evolutionary rates, we estimated the selection pressure and evolutionary rates based on Ka (nonsynonymous mutation), Ks (synonymous mutation), and the Ka/Ks ratio (ω). In general, ω > 1 indicates positive selection, ω < 1 corresponds to purifying selection, and ω = 1 suggests neutral evolution. Thus, we examined the selection pressures on the duplicated P3A-type ATPase genes. The ω values for each duplicated gene pair are provided in Figure S2. The ω value of all P3A-type ATPase gene pairs was less than 1, indicating the genes evolved under strong purifying selection pressure during apple domestication.
To more thoroughly characterize the exon/intron organization of the P3A-type ATPase genes, exon–intron diagrams were generated according to the coding and genomic sequences (Figure 1B). The number of exons ranged from 13 to 21. Of the 15 analyzed P3A-type ATPase genes, five contained 20 exons, three contained 16 exons, three contained 21 exons, two (MD09G1223600 and MD17G1220200) contained 14 exons, one (MD02G1011600) contained 13 exons, and one (MD15G1108400) contained 17 exons. These findings suggested that P3A-type ATPase genes gained and lost exons during apple domestication.

3.2. Phylogenetic Relationship Analysis, Gene Duplication, and Gene Loss of the P3A-Type ATPase Gene Family in Four Rosaceae Species

To analyze the evolutionary relationships among P3A-type ATPase genes from apple, peach, black raspberry, and pear, we constructed a phylogenetic tree of P3A-type ATPase genes with the NJ and ML methods, which yielded very similar topologies (Figure 2). The results indicate that the P3A-type ATPase genes are classified into six clades. All clades were clustered with bootstrap values greater than 50%, and the P3A-type ATPase genes from each species were clearly separated in each clade. The 15 P3A-type ATPase genes were grouped into clades as follows: clades I (two genes), IIa (one gene), IIb (three genes), IIc (two genes), IId (three genes), and IIe (four genes).
Gene duplication events were classified as recent or old based on the evolutionary timeline [50]. Gene duplications that occurred within species were considered recent duplications, whereas gene duplications that occurred prior to the species radiation of Rosaceae were categorized as old duplications [51]. An examination of P3A-type ATPase genes revealed two recent duplications and seven old duplications, indicating that all of the P3A-type ATPase genes, except for PCP019260.1, PCP019257.1, and PCP019253.1, existed prior to the species radiation of Rosaceae. Moreover, old duplications were detected in clades IIb, IId, and IIe, implying these clades underwent at least one duplication event before the species radiation of Rosaceae. Furthermore, a recent loss of a Rubus occidentalis gene was detected in clade IIa (Figure 2). There was no evidence of an old gene loss event for the P3A-type ATPase genes.

3.3. Estimation of Selection Pressures Affecting P3A-Type ATPase Genes in Four Rosaceae Species

To assess whether the P3A-type ATPase genes in each clade are controlled by different evolutionary constraints, the pairwise ω (dN/dS) values within each clade for all tested P3A-type ATPase genes were estimated using pairwise comparison model (Table S3). In addition, we compared the pairwise ω values of the P3A-type ATPase genes in each clade. The following pattern for the average ω values of the P3A-type ATPase genes among six clades was observed: clade I > clade IIc > clade IIa > clade IIe > clade IId > clade IIb (Figure 3). However, although the P3A-type ATPase genes in clade I had the highest ω values (p < 0.01), the differences in the ω values for the P3A-type ATPase genes among the other clades were not significant (Figure 3). Overall, the pairwise ω values indicated a significant difference in the evolutionary rates of the P3A-type ATPase genes in each clade. Additionally, the ω values of members of the same clade were less than 1, indicating that the genes had evolved mainly under strong purifying selection pressure.
To clarify the evolutionary rate of each P3A-type ATPase clades, which was derived from a recent common ancestor, the branch-specific model of PAML was used to calculate the ω values (Ka/Ks) for each P3A-type ATPase clades. As presented in Table 2, the one-ratio model was favored for two pairs of P3A-type ATPase clades, namely IId and IIe, as well as IIc and IId + IIe (p > 0.05). The two-ratio model was favored for the other pairs of P3A-type ATPase clades (p < 0.01).

3.4. Analysis of P3A-Type ATPase Gene Expression in Various Apple Tree Tissues

An examination of the P3A-type ATPase gene expression patterns in five apple tissues (roots, stems, mature leaves, flowers at full bloom, and ripening fruits) (Figure 4, Table S4) revealed significant differences among the tested tissues and four distinctive expression patterns were identified. Nine genes were expressed in all five tested tissues. Additionally, eight genes were most highly expressed in ripening fruits, with a relative expression level greater than 1.0. Similarly, 12, 15, 8, and 10 apple P3A-type ATPase genes were most highly expressed in the mature leaves, flowers at full bloom, roots, and stems, respectively. Furthermore, two genes (MD03G1197800 and MD02G1011600) were specifically expressed in the mature leaves and flowers at full bloom, suggesting these genes play crucial roles in mature leaves and flowers.

3.5. Transcriptome Analysis and Identification of Candidate Genes Responsive to Alkaline Stress

A transcriptome analysis of M. prunifolia roots exposed to alkaline conditions for 0 or 24 h was completed to identify candidate genes responsive to alkaline stress. Six RNA-seq libraries were constructed, with the libraries representing samples collected at 0 and 24 h designated as C and T, respectively (Table S5). The Q20 and Q30 value ranged from 97.41% to 97.50% and 91.54 % to 91.71%, respectively, indicating the high quality of the RNA sequencing data. The GC content of the RNA sequencing reads ranged from 46.78% to 47.62%. The number of clean reads for each library ranged from 43,022,734 to 57,795,922, with an average of 49,625,614. The size of the clean reads for each sample ranged from 6.44 Gb to 8.65 Gb, with an average of 7.42 Gb. Approximately 60% of the clean reads were mapped to the draft genome of the diploid apple cultivar “Golden Delicious” [34].
Of the 34,095 genes identified as expressed in the tested root samples, 492 exhibited 2-fold or greater differences in expression levels between the roots collected at 0 and 24 h after initiating the alkaline treatment. Gene expression analysis indicated that the expression levels of 245 and 247 genes were significantly up- and downregulated, respectively, in the roots between the 0 h and 24 h time-points (Figure 5A). Additionally, the pH of the hydroponics solution was determined at 0 and 24 h after initiating the alkaline treatment (Figure 5B). The average pH of the hydroponics solution was significantly lower at 24 h than at 0 h. Thus, we concentrated on the candidate genes that were expressed in the roots at high and low levels at 24 and 0 h, respectively. We subsequently functionally annotated the 245 upregulated genes based on the TAIR database (https://www.arabidopsis.org/). One gene (MD15G1104800) encoding a P3A-type ATPase that mediates H+ transport activity was identified. The MD15G1104800 expression level was approximately 2.5-fold higher in the roots collected at 24 h than in the roots collected at 0 h (Figure 5C).

3.6. Expression Profiles of Apple P3A-Type ATPase Genes in the Roots Under Alkaline Conditions

A qRT-PCR assay was completed to investigate the expression profiles of apple P3A-type ATPase genes in the roots under the control and alkaline condition (Figure 6). The expression of six apple P3A-type ATPase genes was undetectable in the roots at all examined time-points. The expression levels of nine P3A-type ATPase genes remained almost unchanged throughout all the examined time-points under the control condition. In addition, all the expressed P3A-type ATPase genes exhibited a higher expression level throughout all the examined time-points under the alkaline stress, compared to control, excepted at 8 h and 48 h of the MD16G1254200, 2 h of MD14G1192600, and 48 h of MD06G1186400 and MD13G1247200.
Under the alkaline condition, three apple P3A-type ATPase genes (MD08G1130200, MD09G1171300, and MD17G1046600) were similarly expressed, with peak expression levels in the roots at 24 h, which was followed by a significant decrease at 48 h. The expression levels of two P3A-type ATPase genes (MD14G1192600 and MD17G155800) increased from 0 to 8 h and then decreased from 8 to 48 h. In contrast, complex and diverse expression trends were observed for MD06G1186400, MD13G1247200, and MD16G1254200 under alkaline conditions; however, the expression levels of all three genes were lowest at 48 h. The expression of another P3A-type ATPase gene (MD15G1108400) was highly upregulated in response to alkaline stress.
To further characterize the P3A-type ATPase genes responsive to alkaline stress, the average pH of the hydroponics solution was determined with a pH meter (Figure 7). The average pH of the hydroponics solution with the apple rootstock “Fupingqiuzi” decreased from 0 to 48 h. The average pH in the absence of the apple rootstock was similar but decreased a little following the alkaline treatment. To clarify the relationship between P3A-type ATPase gene expression and the pH of the hydroponics solution, Spearman correlation coefficients for the P3A-type ATPase gene expression levels and the hydroponics solution pH were calculated. The results indicated that only MD15G1108400 expression was significantly negatively correlated with the hydroponics solution pH (R2 = 0.90, p < 0.01), implying that MD15G1108400 is important for responses to alkaline stress.

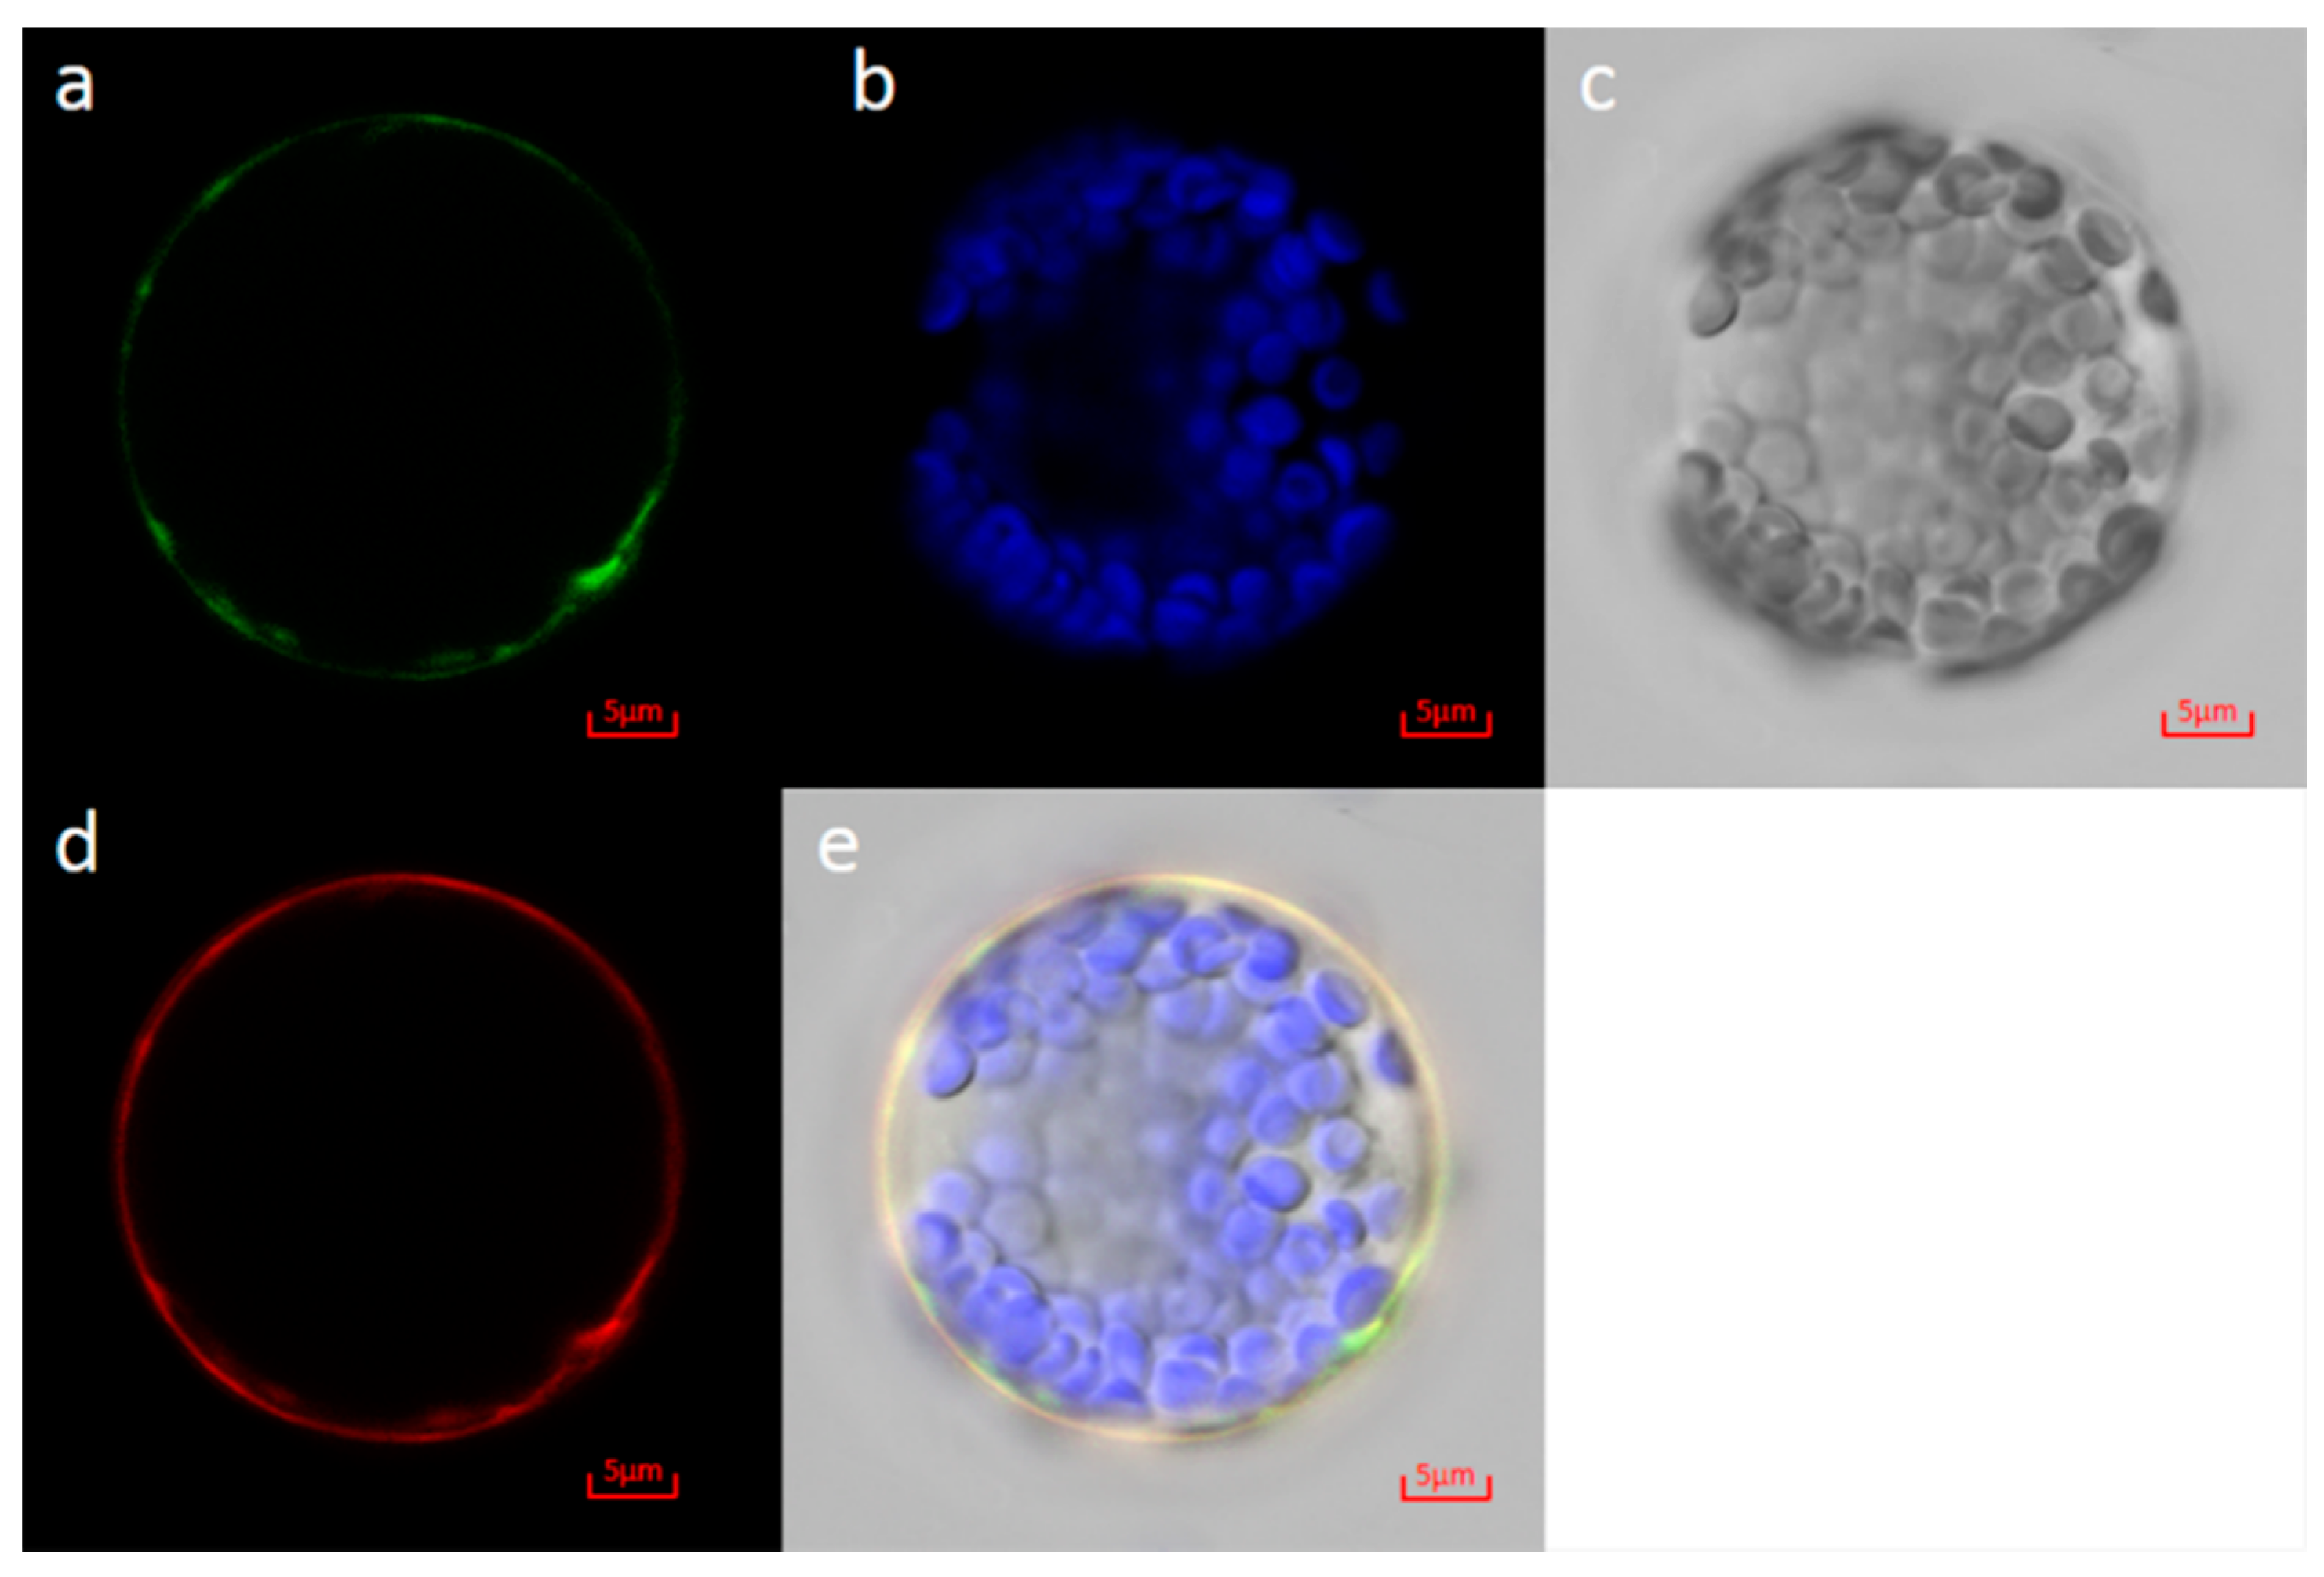
3.7. Subcellular Localization of MD15G1108400

To determine the subcellular localization of the enzyme encoded by MD15G1108400, an MD15G1108400-GFP fusion construct was transiently expressed in A. thaliana mesophyll protoplasts. Confocal microscopy indicated that the MD15G1108400-GFP fusion protein was targeted to the plasma membrane (Figure 8a). To further clarify the plasma membrane localization of MD15G1108400, a colocalization experiment was conducted with the pm-rk standard plasma membrane marker (Figure 8d). The fluorescence of the MD15G1108400-GFP fusion protein completely overlapped the mCherry fluorescence of the plasma membrane marker (Figure 8e). These results indicated that MD15G1108400 is localized to the plasma membrane.

4. Discussion

The P3A-type ATPase genes are important for various physiological processes, including plant growth, stomatal movement, and stress responses. With the release of whole genome sequences, members of the P3A-type ATPase gene family have been identified and investigated in many species. For example, 11 P3A-type ATPase genes were identified in the model plant species A. thaliana [52]. A high-quality de novo “GDDH13” draft genome sequence was recently released [34], which enabled the identification and investigation of the P3A-type ATPase gene family. In this study, 15 members of the P3A-type ATPase gene family were identified in the GDDH13 apple reference genome and then comprehensively characterized. The resulting data provide the foundation for future investigation on the roles for the identified apple genes.
Domesticated apple is an autopolyploid species with 34 diploid chromosomes [33,34]. During apple domestication, a WGD as well as segmental and random duplications altered the apple genome [2,33,34,53]. In this study, we identified 15 P3A-type ATPase genes, 11 of which were detected on eight pairs of homologous chromosomes (Figure 1A). For instance, chromosomes 6 and 14 (homologous pair) contain one P3A-type ATPase gene. Similar results were obtained for the other homologous chromosome pairs (13 and 16, 9 and 17, and 8 and 15) (Figure 1A). These findings indicate that the duplication of the apple P3A-type ATPase genes is related to the WGD. Moreover, the tandem duplication of P3A-type ATPase genes was not observed. A comparison of chromosomes 9 and 17 revealed that one P3A-type ATPase gene on chromosome 17 was not detected on chromosome 9. Similar findings were obtained for homologous chromosome pairs 2 and 15, 3 and 11, and 4 and 12 (Figure 1A) [2,33,34,53]. Thus, the duplicated genes resulting from a WGD rapidly diverged and many were subsequently lost.
In this study, a phylogenetic analysis grouped 15 apple P3A-type ATPase genes and the P3A-type ATPase genes from three other Rosaceae species into six subclades (Figure 2). Specifically, the apple P3A-type ATPase genes were clustered with the P3A-type ATPase genes from pear (P. communis L. “Bartlett”), indicating an intimate genetic relationship between P3A-type ATPase genes from apple and pear. Apple, pear, and peach genomes contain 15, 19, and 15 P3A-type ATPase genes, respectively, despite the fact that the apple genome (approximately 750 Mb) and pear genome (approximately 512 Mb) are more than 2-times larger than the peach genome (approximately 256 Mb) [38]. The similarity in the number of P3A-type ATPase genes suggests these species evolved with a considerable preexisting repertoire of P3A-type ATPase genes. To more comprehensively investigate the evolution of P3A-type ATPase genes, the gene structures and encoded conserved motifs were studied. The number of exons and the conserved motifs were similar for most of the analyzed P3A-type ATPase genes (Figure 1B, Figure S3), and the ω values for the duplicated genes derived from polyploidization events were less than 1 (Figure S2). These results imply the apple P3A-type ATPase genes evolved slowly and under purifying selection pressure during domestication.
Gene duplication is considered as the major driving force for the development of novel genetic functions enabling plants to adapt to environmental conditions [31,32]. The expression levels of most duplicated genes are highly diverse [35]. In the current study, we examined the expression patterns of apple P3A-type ATPase genes. Diverse expression patterns were observed for two homologous P3A-type ATPase genes (MD09G1223600 and MD17G1220200) located on chromosomes 9 and 17 (homologous pair) (Figure 1A and Figure 4). These two genes were expressed in ripening fruits, mature leaves, flowers at full bloom, and stems. However, MD09G1223600 was most highly expressed in flowers at full bloom, whereas MD17G1220200 was most highly expressed in stems. Similar expression patterns were observed for the following homologous gene pairs: MD08G1130200 and MD15G1108400, MD06G1186400 and MD14G1192600, MD09G1171300 and MD17G1155800, and MD16G1254200 and MD13G1247200. Thus, the expression patterns of the duplicated P3A-type ATPase genes resulting from a WGD were conserved during apple domestication. This finding is consistent with the results of a previous study that confirmed that the P3A-type ATPase gene expression levels are surprisingly consistent regardless of the environmental conditions (e.g., nutrient availability) [54].
A previous investigation proved that P3A-type ATPase genes are crucial for various physiological processes such as salt tolerance, stomatal opening, etc., because they generate a transmembrane H+ gradient (∆pH) [52]. Alkaline stress is characterized by a high soil pH due to the hydrolysis of Na2CO3 and NaHCO3 [55]. Plants must be able to mitigate the adverse effects of alkaline soil because they are sessile organisms. Thus, plants have evolved several alkaline stress tolerance mechanisms, including the accumulation of osmoprotectants to facilitate water uptake and the secretion of organic acids to acidify the rhizosphere [56,57,58,59]. In plants, the acidification of the rhizosphere was related with an increase in P3A-type ATPase activity to extrude protons. P3A-type ATPase genes play crucial roles in transporting protons and pumping H+ out of the roots, thus plants can be able to acidify the root apoplast and increase the tolerance to environmental stress [60,61,62]. In the current study, we investigated the responses of P3A-type ATPase genes to alkaline stress. We determined that the expression level of one P3A-type ATPase gene (MD15G1108400) is highly correlated with the pH of a hydroponics solution (p < 0.01). All P3A-type ATPase genes are considered to be important for transporting H+ [63]. A P3A-type ATPase Ma10 which located to the tonoplast, has the capacity for proton pumping and plays a vital role in vacuolar acidification of apple fruit [29]. Moreover, gene functions are closely associated with the subcellular localization of the encoded protein [2]. The subcellular localization of the MD15G1108400-GFP fusion protein revealed it is present in the plasma membrane (Figure 8). Thus, we speculate that MD15G1108400 is involved in plant responses to alkaline stress. In plants, the P3A-type ATPase genes induced acidification of the cell wall apoplast by H+ excretion play critical roles in plant growth, and two proton pumps (AtAHA1 and AtAHA2) which belong to the P3A-type ATPase gene family are necessary to regulate apoplastic pH [64]. Therefore, we hypothesize that the P3A-type ATPase encoded by MD15G1108400 can enhance the transport of H+ across the plasma membrane, thereby decreasing the rhizosphere pH to protect plants from alkaline stress.

5. Conclusions

In this study, the evolutionary pattern of the P3A-type ATPase gene in apple was investigated. In general, a total of 15 P3A-type ATPase genes were identified in the draft genome of the diploid apple cultivar “Golden Delicious”. The chromosomal localization indicated that gene duplication of apple P3A-type ATPase is related to the WGD and many duplicated genes from a WDG were lost. The ω value indicated that the duplicated P3A-type ATPase genes evolved under strong purifying selection pressure during apple domestication.
The phylogenetic relationship analysis was performed using the amino acid sequences of P3A-type ATPase genes from four Rosaceae species, and the P3A-type ATPase genes are classified into six clades. Base on the phylogenetic tree, two recent duplications, seven old duplications, and one recent loss of a Rubus occidentalis gene were identified. In addition, significant differences were observed in the evolutionary rate of the P3A-type ATPase genes’ members and clades. Furthermore, expression profiling of P3A-type ATPase genes exhibited significant divergence among five apple tissues. The expression of one gene, MD15G1104800, which located to the plasma membrane, was highly upregulated in response to alkaline stress and was significantly negatively correlated with the hydroponics solution pH. Thus, our results indicated that MD15G1104800 is a likely candidate gene involved in alkaline stress.

Supplementary Materials

The following are available online at https://www.mdpi.com/1999-4907/11/3/292/s1, Figure S1: A schematic diagram showing the conserved transmembrane domain of P3A-Type ATPase. TMD: transmembrane domain. The dotted line represents the boundary of N-terminal and C-terminal, Figure S2: Estimation of ω values of apple P3A-Type ATPase genes using the ML method, Table S1: Primer sequences used for quantitative real-time PCR. Table S2: The CDS sequences and deduced amino acid sequences of P3A-type ATPase genes. Table S3: Estimation of ω values of P3A-Type ATPase gene using the ML method. The ω value higher than one is highlighted in black bold. Table S4: Expression levels of apple P3A-Type ATPase genes in five different tissues from apple, Table S5: Summary of RNA-seq data for roots of Malus prunifolia (Willd.) Borkh. under alkaline treatment at 0 h (C) and 24 h (T).

Author Contributions

B.M., Y.Y. and F.M. conceived and designed the experiments. B.M., M.G. and L.Z. performed the experiments. Y.Y., H.Z., L.Z., J.S. and C.L. analyzed the data. B.M. and Y.Y. wrote the manuscript. M.L. and F.M. revised the manuscript. All authors have read and agreed to the published version of the manuscript.

Funding

This work was supported by the National Natural Science Foundation of China (Grant Number 31701875), and China Postdoctoral Science Foundation (Grant Numbers 2017M613225, 2017M613226).

Acknowledgments

We thank Liwen Bianji, Edanz Editing China (www.liwenbianji.cn/ac) for editing the English text of a draft of this manuscript.

Conflicts of Interest

None of the authors has any relevant conflicts of interests to declare.

References

  1. Wen, T.; Dong, L.; Wang, L.; Ma, F.; Zou, Y.; Li, C. Changes in root architecture and endogenous hormone levels in two Malus rootstocks under alkali stress. Sci. Hortic. 2018, 235, 198–204. [Google Scholar] [CrossRef]
  2. Ma, B.; Yuan, Y.; Gao, M.; Qi, T.; Li, M.; Ma, F. Genome-Wide Identification, Molecular Evolution, and Expression Divergence of Aluminum-Activated Malate Transporters in Apples. Int. J. Mol. Sci. 2018, 19, 2807. [Google Scholar] [CrossRef] [Green Version]
  3. Ma, B.; Yuan, Y.; Gao, M.; Xing, L.; Li, C.; Li, M.; Ma, F. Genome-wide Identification, Classification, Molecular Evolution and Expression Analysis of Malate Dehydrogenases in Apple. Int. J. Mol. Sci. 2018, 19, 3312. [Google Scholar] [CrossRef] [PubMed] [Green Version]
  4. Jin, H.; Plaha, P.; Park, J.Y.; Hong, C.P.; Lee, I.S.; Yang, Z.H.; Jiang, G.B.; Kwak, S.S.; Liu, S.K.; Lee, J.S.; et al. Comparative EST profiles of leaf and root of Leymus chinensis, a xerophilous grass adapted to high pH sodic soil. Plant Sci. 2006, 170, 1081–1086. [Google Scholar] [CrossRef]
  5. Li, J.; Xu, H.H.; Liu, W.C.; Zhang, X.W.; Lu, Y.T. Ethylene inhibits root elongation during alkaline stress through AUXIN1 and associated changes in auxin accumulation. Plant Physiol. 2015, 168, 1777–1791. [Google Scholar] [CrossRef] [PubMed] [Green Version]
  6. Shi, D.C.; Sheng, Y.M. Effect of various salt-alkaline mixed stress conditions on sunflower seedlings and analysis of their stress factors. Environ. Exp. Bot. 2005, 54, 8–21. [Google Scholar] [CrossRef]
  7. Shi, D.C.; Wang, D.L. Effects of various salt-alkaline mixed stresses on Aneurolepidium chinense (Trin.) Kitag. Plant Soil 2005, 271, 15–26. [Google Scholar] [CrossRef]
  8. Chen, W.C.; Cui, P.J.; Sun, H.Y.; Guo, W.Q.; Yang, C.W.; Jin, H.; Fang, B.; Shi, D.C. Comparative effects of salt and alkali stresses on organic acid accumulation and ionic balance of seabuckthorn (Hippophae rhamnoides L.). Ind. Crop. Prod. 2009, 30, 351–358. [Google Scholar] [CrossRef]
  9. Gévaudant, F.; Duby, G.; von Stedingk, E.; Zhao, R.; Morsomme, P.; Boutry, M. Expression of a constitutively activated plasma membrane H+-ATPase alters plant development and increases salt tolerance. Plant Physiol. 2007, 144, 1763–1776. [Google Scholar] [CrossRef] [Green Version]
  10. Monneuse, J.M.; Sugano, M.; Becue, T.; Santoni, V.; Hem, S.; Rossignol, M. Towards the profiling of the Arabidopsis thaliana plasma membrane transportome by targeted proteomics. Proteomics 2011, 11, 1789–1797. [Google Scholar] [CrossRef]
  11. Zhang, H.; Han, B.; Wang, T.; Chen, S.; Li, H.; Zhang, Y.; Dai, S. Mechanisms of plant salt response: Insights from proteomics. J. Proteome Res. 2012, 11, 49–67. [Google Scholar] [CrossRef] [PubMed]
  12. Bose, J.; Rodrigo-Moreno, A.; Lai, D.; Xie, Y.; Shen, W.; Shabala, S. Rapid regulation of the plasma membrane H+-ATPase activity is essential to salinity tolerance in two halophyte species, Atriplex lentiformis and Chenopodium quinoa. Ann. Bot. 2015, 115, 481–494. [Google Scholar] [CrossRef] [PubMed] [Green Version]
  13. Fuglsang, A.T.; Guo, Y.; Cuin, T.A.; Qiu, Q.; Song, C.; Kristiansen, K.A.; Bych, K.; Schulz, A.; Shabala, S.; Schumaker, K.S.; et al. Arabidopsis protein kinase PKS5 inhibits the plasma membrane H+-ATPase by preventing interaction with 14-3-3 protein. Plant Cell. 2007, 19, 1617–1634. [Google Scholar] [CrossRef] [PubMed] [Green Version]
  14. Yang, Y.; Qin, Y.; Xie, C.; Zhao, F.; Zhao, J.; Liu, D.; Chen, S.; Fuglsang, A.T.; Palmgren, M.G.; Schumaker, K.S.; et al. The Arabidopsis chaperone J3 regulates the plasma membrane H+-ATPase through interaction with the PKS5 kinase. Plant Cell. 2010, 22, 1313–1332. [Google Scholar] [CrossRef] [Green Version]
  15. Yang, Y.; Wu, Y.; Ma, L.; Yang, Z.; Dong, Q.; Li, Q.; Ni, X.; Kudla, J.; Song, C.; Guo, Y. The Ca2+ Sensor SCaBP3/CBL7 Modulates Plasma Membrane H+-ATPase Activity and Promotes Alkali Tolerance in Arabidopsis. Plant Cell. 2019, 31, 1367–1384. [Google Scholar] [CrossRef]
  16. Zhou, L.J.; Zhang, C.L.; Zhang, R.F.; Wang, G.L.; Li, Y.Y.; Hao, Y.J. The SUMO E3 Ligase MdSIZ1 Targets MdbHLH104 to Regulate Plasma Membrane H+-ATPase Activity and Iron Homeostasis. Plant Physiol. 2019, 179, 88–106. [Google Scholar] [CrossRef] [Green Version]
  17. Møller, J.V.; Juul, B.; leMaire, M. Structural organization, ion transport, and energy transduction of P-type ATPases. Biochim. Biophys. Acta 1996, 1286, 1–51. [Google Scholar] [CrossRef]
  18. Palmgren, M.G.; Axelsen, K.B. Evolution of P-type ATPases. Biochim. Biophys. Acta 1998, 1365, 37–45. [Google Scholar] [CrossRef] [Green Version]
  19. Pedersen, P.; Carafoli, E. Ion motive ATPases. I. Ubiquity, properties, and significance to cell function. Trends Biochem. Sci. 1987, 4, 146–150. [Google Scholar] [CrossRef]
  20. Serrano, R. Structure and function of proton translocating ATPase in plasma membranes of plants and fungi. Biochim. Biophys. Acta 1989, 947, 1–28. [Google Scholar] [CrossRef]
  21. Axelsen, K.B.; Palmgren, M.G. Evolution of substrate specificities in the P-Type ATPase superfamily. J. Mol. Evol. 1998, 46, 84–101. [Google Scholar] [CrossRef]
  22. Pedersen, C.N.; Axelsen, K.B.; Harper, J.F.; Palmgren, M.G. Evolution of plant P-type ATPases. Front. Plant Sci. 2012, 3. [Google Scholar] [CrossRef] [Green Version]
  23. Baxter, I.; Tchieu, J.; Sussman, M.R.; Boutry, M.; Palmgren, M.G.; Gribskov, M.; Harper, J.F.; Axelsen, K.B. Genomic comparison of P-type ATPase ion pumps in Arabidopsis and rice. Plant Physiol. 2003, 132, 618–628. [Google Scholar] [CrossRef] [Green Version]
  24. Axelsen, K.B.; Palmgren, M.G. Inventory of the superfamily of P-type ion pumps in Arabidopsis. Plant Physiol. 2001, 126, 696–706. [Google Scholar] [CrossRef] [PubMed] [Green Version]
  25. Palmgren, M.G.; Nissen, P. P-type ATPases. Annu. Rev. Biophys. 2011, 40, 243–266. [Google Scholar] [CrossRef] [PubMed]
  26. Hartwig, C.; Zlatic, S.A.; Wallin, M.; Vrailas-Mortimer, A.; Fahrni, C.J.; Faundez, V. Trafficking mechanisms of P-type ATPase copper transporters. Curr. Opin. Cell Biol. 2019, 59, 24–33. [Google Scholar] [CrossRef] [PubMed]
  27. Verweij, W.; Spelt, C.; Di Sansebastiano, G.P.; Vermeer, J.; Reale, L.; Ferranti, F.; Koes, R.; Quattrocchio, F. An H+ P-ATPase on the tonoplast determines vacuolar pH and flower colour. Nat. Cell Boil. 2008, 10, 1456. [Google Scholar] [CrossRef]
  28. Faraco, M.; Spelt, C.; Bliek, M.; Verweij, W.; Hoshino, A.; Espen, L.; Prinsi, B.; Jaarsma, R.; Tarhan, E.; de Boer, A.H.; et al. Hyperacidification of vacuoles by the combined action of two different P-ATPases in the tonoplast determines flower color. Cell Rep. 2014, 6, 32–43. [Google Scholar] [CrossRef] [Green Version]
  29. Ma, B.; Liao, L.; Fang, T.; Peng, Q.; Ogutu, C.; Zhou, H.; Ma, F.; Han, Y. A Ma10 gene encoding P-type ATPase is involved in fruit organic acid accumulation in apple. Plant Biotechnol. J. 2019, 17, 674–686. [Google Scholar] [CrossRef] [Green Version]
  30. Kühlbrandt, W. Biology, structure and mechanism of P-type ATPases. Nat. Rev. Mol. Cell Biol. 2004, 5, 282–295. [Google Scholar] [CrossRef]
  31. Rensing, S.A. Gene duplication as a driver of plant morphogenetic evolution. Curr. Opin. Plant Biol. 2014, 17, 43–48. [Google Scholar] [CrossRef] [PubMed]
  32. Panchy, N.; Lehti-Shiu, M.; Shiu, S.H. Evolution of gene duplication in plant. Plant Physiol. 2016, 171, 2294–2316. [Google Scholar] [CrossRef] [PubMed] [Green Version]
  33. Velasco, R.; Zharkikh, A.; Affourtit, J.; Dhingra, A.; Cestaro, A.; Kalyanaraman, A.; Fontana, P.; Bhatnagar, S.K.; Troggio, M.; Pruss, D.; et al. The genome of the domesticated apple (Malus domestica Borkh.). Nat. Genet. 2010, 42, 833–839. [Google Scholar] [CrossRef] [PubMed]
  34. Daccord, N.; Celton, J.M.; Linsmith, G.; Becke, C.; Choisne, N.; Schijlen, E.; van de Geest, H.; Bianco, L.; Micheletti, D.; Velasco, R.; et al. High-quality de novo assembly of the apple genome and methylome dynamics of early fruit development. Nat. Genet. 2017, 49, 1099–1106. [Google Scholar] [CrossRef] [PubMed]
  35. Blanc, G.; Wolfe, K.H. Functional divergence of duplicated genes formed by polyploidy during Arabidopsis evolution. Plant Cell 2004, 16, 1679–1691. [Google Scholar] [CrossRef] [PubMed] [Green Version]
  36. Hoagland, D.R.; Arnon, D.I. The water-culture method for growing plants without soil. Circ. Calif. Agric. Exp. Stat. 1950, 347, 357–359. [Google Scholar]
  37. Chagné, D.; Crowhurst, R.N.; Pindo, M.; Thrimawithana, A.; Deng, C.; Ireland, H.; Fiers, M.; Dzierzon, H.; Cestaro, A.; Fontana, P.; et al. The Draft Genome Sequence of European Pear (Pyrus communis L. ‘Bartlett’). PLoS ONE 2014, 9, 92644. [Google Scholar] [CrossRef]
  38. Verde, I.; Jenkins, J.; Dondini, L.; Micali, S.; Pagliarani, G.; Vendramin, E.; Paris, R.; Aramini, V.; Gazza, L.; Rossini, L.; et al. The Peach v2.0 release: High-resolution linkage mapping and deep resequencing improve chromosome-scale assembly and contiguity. BMC Genom. 2017, 18, 225. [Google Scholar] [CrossRef] [Green Version]
  39. VanBuren, R.; Bryant, D.; Bushakra, J.M.; Vining, K.J.; Edger, P.P.; Rowley, E.R.; Priest, H.D.; Michael, T.P.; Lyons, E.; Filichkin, S.A.; et al. The genome of black raspberry (Rubus occidentalis). Plant J. 2016, 87, 535–547. [Google Scholar] [CrossRef] [Green Version]
  40. Tatusov, R.L.; Galperin, M.Y.; Natale, D.A.; Koonin, E.V. The COG database: A tool for genome-scale analysis of protein functions and evolution. Nucleic Acids Res. 2000, 28, 33–36. [Google Scholar] [CrossRef] [Green Version]
  41. Kumar, S.; Stecher, G.; Tamura, K. MEGA7: Molecular evolutionary genetics analysis version 7.0. Mol. Biol. Evol. 2016, 33, 1870–1874. [Google Scholar] [CrossRef] [PubMed] [Green Version]
  42. Yang, Z. PAML 4: A program package for phylogenetic analysis by maximum likelihood. Mol. Biol. Evol. 2007, 24, 1586–1591. [Google Scholar] [CrossRef] [PubMed] [Green Version]
  43. Yang, Z. Likelihood ratio tests for detecting positive selection and application to primate lysozyme evolution. Mol. Boil. Evol. 1998, 15, 568–573. [Google Scholar] [CrossRef]
  44. Wang, D.; Zhang, Y.; Zhang, Z.; Zhu, J.; Yu, J. KaKs Calculator 2.0: A toolkit incorporating gamma-series methods and sliding window strategies. Genom. Proteom. Bioinform. 2010, 8, 77–80. [Google Scholar] [CrossRef] [Green Version]
  45. Livak, K.J.; Schmittgen, T.D. Analysis of relative gene expression data using real-time quantitative PCR and the 2−ΔΔCT method. Methods 2001, 25, 402–408. [Google Scholar] [CrossRef]
  46. Ma, B.Q.; Liao, L.; Zheng, H.Y.; Chen, J.; Wu, B.H.; Ogutu, C.; Li, S.H.; Korban, S.S.; Han, Y.P. Genes encoding aluminum-activated malate transporter II and their association with fruit acidity in apple. Plant Genome 2015, 8, 1–14. [Google Scholar] [CrossRef] [Green Version]
  47. Lou, Q.; Liu, Y.; Qi, Y.; Jiao, S.; Tian, F.; Jiang, L.; Wang, Y. Transcriptome sequencing and metabolite analysis reveals the role of delphinidin metabolism in flower colour in grape hyacinth. J. Exp. Bot. 2014, 65, 3157–3164. [Google Scholar] [CrossRef] [PubMed] [Green Version]
  48. Yoo, S.D.; Cho, Y.H.; Sheen, J. Arabidopsis mesophyll protoplasts: A versatile cell system for transient gene expression analysis. Nat. Protoc. 2007, 2, 1565–1572. [Google Scholar] [CrossRef] [Green Version]
  49. Nelson, B.K.; Cai, X.; Nebenführ, A. A multicolored set of in vivo organelle markers for co-localization studies in Arabidopsis and other plants. Plant J. 2007, 51, 1126–1136. [Google Scholar] [CrossRef]
  50. Taylor, J.S.; Raes, J. Duplication and divergence: The evolution of new genes and old ideas. Annu. Rev. Genet. 2004, 38, 615–643. [Google Scholar] [CrossRef] [Green Version]
  51. Wang, W.; Zhou, H.; Ma, B.Q.; Owiti, A.; Korban, S.S.; Han, Y.P. Divergent evolutionary pattern of sugar transporter genes is associated with the difference in sugar accumulation between grasses and eudicots. Sci. Rep. 2016, 6, 29153. [Google Scholar] [CrossRef] [PubMed] [Green Version]
  52. Falhof, J.; Pedersen, J.T.; Fuglsang, A.T.; Palmgren, M. Plasma Membrane H+-ATPase Regulation in the Center of Plant Physiology. Mol. Plant. 2016, 9, 323–337. [Google Scholar] [CrossRef] [PubMed] [Green Version]
  53. Han, Y.; Zheng, D.; Vimolmangkang, S.; Khan, M.A.; Beever, J.E.; Korban, S.S. Integration of physical and genetic maps in apple confirms whole-genome and segmental duplications in the apple genome. J. Exp. Bot. 2011, 62, 5117–5130. [Google Scholar] [CrossRef] [PubMed]
  54. Maathuis, F.J.; Filatov, V.; Herzyk, P.; Krijger, G.C.; Axelsen, K.B.; Chen, S.; Green, B.J.; Li, Y.; Madagan, K.L.; Sánchez-Fernández, R.; et al. Transcriptome analysis of root transporters reveals participation of multiple gene families in the response to cation stress. Plant J. 2003, 35, 675–692. [Google Scholar] [CrossRef] [PubMed]
  55. Tang, R.J.; Yang, Y.; Yang, L.; Liu, H.; Wang, C.T.; Yu, M.M.; Gao, X.S.; Zhang, H.X. Poplar calcineurin B-like proteins PtCBL10A and PtCBL10B regulate shoot salt tolerance through interaction with PtSOS2 in the vacuolar membrane. Plant Cell Environ. 2014, 37, 573–588. [Google Scholar] [CrossRef] [PubMed] [Green Version]
  56. Cha-Um, S.; Supaibulwattana, K.; Kirdmanee, C. Comparative effects of salt stress and extreme pH stress combined on glycinebetaine accumulation, photosynthetic abilities and growth characters of two rice genotypes. Rice Sci. 2009, 16, 274–282. [Google Scholar] [CrossRef]
  57. Liu, J.; Guo, W.Q.; Shi, D.C. Seed germination, seedling survival, and physiological response of sunflowers under saline and alkaline conditions. Photosynthetica 2010, 48, 278–286. [Google Scholar] [CrossRef]
  58. Wang, X.; Jiang, P.; Ma, Y.; Geng, S.; Wang, S.; Shi, D.C. Physiological strategies of sunflower exposed to salt or alkali stresses: Restriction of ion transport in the cotyledon node zone and solute accumulation. Agron. J. 2015, 107, 2181. [Google Scholar] [CrossRef]
  59. Babgohari, M.Z.; Niazi, A.; Moghadam, A.A.; Deihimi, T.; Ebrahimie, E. Genome-wide analysis of key salinity-tolerance transporter (HKT1;5) in wheat and wild wheat relatives (A and D genomes). Vitro Celluar Dev. Biol. Plant 2013, 49, 97–106. [Google Scholar] [CrossRef]
  60. Kim, J.H.; Oh, Y.; Yoon, H.; Hwang, I.; Chang, Y.S. Iron nanoparticle-induced activation of plasma membrane H (+)-ATPase promotes stomatal opening in Arabidopsis thaliana. Environ. Sci. Technol. 2015, 49, 1113–1119. [Google Scholar] [CrossRef] [Green Version]
  61. Ohwaki, Y.; Sugahara, K. Active extrusion of protons and exudation of carboxylic acids in response to iron deficiency by roots of chickpea (Cicer arietinum L.). Plant Soil 1997, 189, 49–55. [Google Scholar] [CrossRef]
  62. Wang, Y.; Noguchi, K.; Ono, N.; Inoue, S.I.; Terashima, I.; Kinoshita, T. Overexpression of plasma membrane H+-ATPase in guard cells promotes light-induced stomatal opening and enhances plant growth. Proc. Natl. Acad. Sci. USA 2014, 111, 533–538. [Google Scholar] [CrossRef] [PubMed] [Green Version]
  63. Pedersen, B.P.; Buch-Pedersen, M.J.; Morth, J.P.; Palmgren, M.G.; Nissen, P. Crystal structure of the plasma membrane proton pump. Nature 2007, 450, 1111. [Google Scholar] [CrossRef] [PubMed]
  64. Pacifici, E.; Di Mambro, R.; Dello Ioio, R.; Costantino, P.; Sabatini, S. Acidic cell elongation drives cell differentiation in the Arabidopsis root. EMBO J. 2018, 37, 99134. [Google Scholar] [CrossRef] [PubMed]
Figure 1. Genes encoding P3A-Type ATPase genes in apple genome. (A) Chromosomal localization of apple P3A-Type ATPase. (B) Exon/intron organization of apple P3A-Type ATPase. Yellow boxes indicate exons; black line indicates introns.
Forests 11 00292 g001
Figure 2. Phylogenetic tree derived from amino acid sequences of P3A-Type ATPase genes in Rosacease genomes based on NJ method. The red triangle and square represent recent and old duplication events. Gene loss is shown by the red dotted line. All the bootstrap values are higher than 50% and indicated near branched lines.
Forests 11 00292 g002
Figure 3. Mean ω values of P3A-Type ATPase genes in different clades. Different lowercase letters represent significant differences among clades (t-test, LSD test at p < 0.01). Error bars show the SE of means.
Forests 11 00292 g003
Figure 4. Expression profiles of apple P3A-Type ATPase genes in five kinds of tissue, Fruit (ripening fruit), Leaf (mature leaf), Flower (full-bloom flower), Root, and Stem. The heat map was generated via Mev software using relative expression data, which are expressed as normalized log2 transformed values. The hierarchical cluster indicates the differential expression pattern.
Forests 11 00292 g004
Figure 5. Transcriptome analysis of roots of Malus prunifolia (Willd.) Borkh. under alkaline treatment at 0 h (C) and 24 h (T). (A): Hierarchical clustering which represents the differential expression pattern indicated up- and downregulated genes. The numbers 1, 2, and 3 represent three biological replicates. (B): The change of hydroponics solution pH under alkaline stress. C and T represent the treat time 0 h and 24 h. (C): Digital expression of candidate gene MD15G1108400 based on transcriptome data under alkaline treatment at 0 h (C) and 24 h (T). The signification differences (t-test, LSD test at p < 0.01) among C and T were indicated by different lowercase letters.
Forests 11 00292 g005
Figure 6. Expression profiling of the apple P3A-Type ATPase genes in roots of Malus prunifolia (Willd.) Borkh. under control and alkaline condition at different treatment times. The values indicate the average of three biological replicates. Error bars indicate the SD of the mean, and the double asterisks show significant differences between control and treatments (t-test, p < 0.01).
Forests 11 00292 g006
Figure 7. The time course of in hydroponics solution pH under alkaline stress for 48h. The points, triangles, and squares represent mean value ± SD of three biological repeats. CK: the hydroponics solution with the apple rootstock without alkaline stress.
Forests 11 00292 g007
Figure 8. Subcellular localization of the MD15G1108400-GFP fusion protein in Arabidopsis mesophyll protoplast. From a to e: (a) MD15G1108400-GFP fusion protein fluorescence, (b) chlorophyll auto-fluorescence, (c) optical photomicrographs (bright field), (d) pm-rk (plasma membrane marker: CD3-1007) protein fluorescence, and (e) overlay of bright and fluorescence illumination.
Forests 11 00292 g008
Table 1. Detailed information of physiological and biochemical characteristics of the apple P3A-Type ATPases proteins.
Gene IDAnimo AcidsMW (kDa)pIGRAVYInstability IndexAliphatic IndexTMD
MD17G1155800950104.385.370.1538.08106.378
MD09G1171300948104.455.500.1536.68107.109
MD15G11084001032113.756.860.0240.21100.408
MD08G1130200954105.037.240.0434.55101.4510
MD13G1247200955105.216.510.0936.47101.278
MD06G1186400956105.265.990.1238.33105.338
MD16G1254200955105.016.130.0936.11103.119
MD14G1192600956105.186.100.1138.51104.628
MD02G1011600947103.686.050.0934.82101.449
MD09G1223600954104.816.170.0732.68103.149
MD17G1046600956105.316.450.1235.64104.018
MD02G1216000991108.877.060.0834.10101.408
MD04G1058300973106.866.250.1735.45107.079
MD03G1197800966105.846.170.1934.59107.257
MD17G1220200930102.128.640.0733.80103.848
MW: Molecular weight, pI: theoretical isoelectric point, GRAVY: grand average of hydropathicity, TMD: Transmembrane domains.
Table 2. The statistic and parameters from Branch model of PAML based on likelihood-ratio test (LRT).
CladesNull HypothesisAlternative HypothesisLRT
AB−In Lω−In Lω1ω2Statisticp
IIdIIe6436.650.146435.150.150.123.00>0.05
IIc(IId+IIe)8149.430.148148.490.170.141.88>0.05
IIb(IIc+IId+IIe)10,632.660.1310,624.970.150.0915.38<0.01
IIa(IIb+IIc+IId+IIe)10,466.180.1310,458.890.150.1014.58<0.01
I(IIa+IIb+IIc+IId+IIe)10,176.170.1810,145.070.510.1562.20<0.01

