Abstract
Research Highlights: We present statistical methods for using crown measurement data from multiple destructive sampling studies to model crown profiles in the Tree and Stand Simulator (TASS) and evaluate it using component (branch-level) and aggregate (tree-level) predictions. Combining data collected under different sampling protocols offered unique challenges. Background and Objectives: The approach to modelling crown profiles was based on Mitchell’s monograph on Douglas-fir growth and simulated dynamics. The functional form defines the potential crown size and shape and governs the rate of crown expansion. With the availability of additional data, we are able to update these functions as part of ongoing TASS development and demonstrate the formulation and fitting of new crown profile equations for stand-grown western hemlock (Tsuga heterophylla (Raf.) Sarg. Materials and Methods: Detailed measurements on 1616 branches from 153 trees were collected for TASS development over a 40-year period. Data were collected under two different sampling protocols and the methods were designed to allow the use of data from both protocols. Data collected on all branches were then introduced through the application of the ratio of length of each of the selected branches to the largest branch in the internode (RL). Results: A mixed-effects model with two random effects, which accounted for tree-level variation, provided the best fit. From that, a model that expressed one parameter as a function of another with one random effect was developed to complement the structure of the Tree and Stand Simulator (TASS). The models generally over-estimated crown size when compared to the projected crown area recorded from field measurements, and a scalar adjustment factor of 0.89 was applied that minimised mean-squared error of the differences. The new model is fit from direct measures of crown radius and predicts narrower crown shapes than previous functions used in TASS.
1. Introduction
The size and shape of a tree crown influences the interception of radiation [1,2,3] and hence, the production and allocation of carbon [4]. Crown structure also plays an important role in the competitive interactions among trees, in which feedback from neighbouring trees modifies the size and rate of branch extension through shading and physical abrasion [5]. The interaction among tree crowns exerts a strong influence on stem form and fibre quality [6,7,8,9].
Many simulation models of forest trees and stands, particularly growth and yield models, have incorporated crown metrics either in the predictive functions or in the descriptive outputs (e.g., ORGANON [10], the Forest Vegetation Simulator (FVS-PROGNOSIS) [11], and the Tree and Stand Simulator (TASS) [6]). A depiction of crown size and shape is also required for functional structural models [12,13] that combine physiological functions with a three-dimensional (3-D) representation of the tree architecture.
Direct measurement of crown shape or profile, especially of large trees, is difficult. Researchers traditionally focus on one of two approaches: component (branch-level) measures or aggregate (tree-level) measures. Component measures are attributes of individual branches, such as branch length or branch reach [14]. Aggregate measures describe the two-dimensional or three-dimensional outline of a crown without explicit recognition of the individual branches. Examples of aggregate measures include the vertical or overhead projection onto a horizontal plane (i.e., crown projection area), the horizontal “side-view” projected area acquired with specialised instruments such as the crown window [15] or through destructive sampling [16]; or contour maps made from high resolution digital images [17,18] or from terrestrial [19] or airborne laser scanning (e.g., [20]).
The component approach requires an appropriate abstraction of crown size and shape. The location of the perimeter of the crown is ambiguous (see [21]). Investigators express their perspective explicitly (e.g., [22]) or implicitly through their branch selection criteria. Where defining a crown profile is the main objective, it is common to ignore interwhorl branches (see [23] for definitions) and select from only the whorl branches (e.g., [6,21]) or largest branches [14]. Obtaining unbiased estimates of foliar biomass or branch biomass, however, requires non-zero inclusion probabilities for all branches [24].
Our approach to modelling crown profiles is based on Mitchell’s [6] monograph, which lead to the development of TASS, a spatially explicit, individual-tree growth and yield simulation model that is widely used in British Columbia to predict the growth and future yield of managed stands. In TASS, crowns of simulated trees compete for growing space in a three-dimensional raster grid, expanding and contracting over time in response to interactions with the crowns of neighbouring trees. The crowns expand horizontally using a function developed from detailed measurements of branch growth and height growth [6]. The function (Equation (1)), predicts annual branch growth in year t () from height growth in year t (), and distance from the tree apex to the base of the branch in the previous year ():
Mitchell [6] showed that this implies a crown profile of the following form (Equation (2)) using the same parameters:
In TASS, the function predicts the potential rate of horizontal crown expansion, at different points on the crown, into space not occupied by neighbouring trees. In this context, “potential” implies growth rates not impeded by physical interactions with other trees making the function similar in concept to the architectural models of Hallé et al. [25] that offer a blueprint of the modular construction of a tree, a growth pattern inherent in the species or a “set of rules that remain unchanged with age” [26] but are modified in implementation by environment and interaction with neighbours. In TASS, separate routines govern the interaction with adjacent neighbours seeking to occupy the same space. From the perspective of a single tree, these interactions may impair or terminate expansion in some part of the crown, or they may cause the surrendering of space gained by crown expansion in previous time steps. The detailed, three-dimensional representation of the crown in TASS provides the flexibility to have unimpeded expansion in one region of a tree’s crown and crown recession occurring in another region of the same crown, leading to an asymmetric crown shape. Crown dynamics in TASS, therefore, are the combined result of several functions working in concert, allowing crowns to expand or contract in response to inter-tree competition.
Recognizing how the profile function is implemented in TASS provides guidance for data collection and analysis. To predict the potential expansion rates of unimpeded crowns, the fitting data are restricted to branches located above the point of crown contact identified for each crown quadrant in the field. TASS differs from models such as ORGANON [10] or FVS-PROGNOSIS [11] in how crown metrics such as crown length, maximum crown radius and crown ratio are used. In general, TASS reports changes in those metrics as outcomes of crown dynamics, not as predictors. They might possibly be used as covariates in the crown expansion function if the data support their inclusion in the analysis phase. These metrics also have value when simulations are initiated with measurements of existing stands, but many TASS simulations start with bare ground and grow trees from seedlings.
The protocols for the component sampling for TASS development have evolved over the years as the focus expanded from measuring only the branch axis (e.g., diameter and axial growth) to measuring leaf area and foliar biomass [27]. All the sampling strategies were developed to support analysis in a framework of model-based inference, which influenced the selection of sites, trees within sites and branches within trees [28]. The procedures for selecting and measuring branches, while consistent within any single study, changed over the years, and this can pose problems when data from different studies are combined.
For TASS, the aggregate measure is crown projection area (CPA)—the two-dimensional vertical projection of the crown. This was calculated from radial measurements from the centre of the tree to 8-15 key points that are vertically below the crown perimeter around the crown (see data collection for details). The method attempts to capture the increasing roughness of the projected crown area as trees age and grow tall. In previous analyses, CPA played no role in the development of the crown expansion functions for TASS; however, it might be used as a check on how well a low-level function (e.g., crown expansion function) predicts a higher-level or aggregate measure (e.g., CPA), a topic relevant to many individual-tree models [29].
As part of our ongoing development of TASS, we are updating the crown expansion functions for a range of tree species. This paper focusses on western hemlock (Tsuga heterophylla (Raf.) Sarg., the tree species with the largest number of sample trees in our database. Western hemlock is a shade tolerant conifer of considerable commercial value. Its distribution ranges along the western coast of North America, reaching north to the Kenai peninsula in Alaska and south to California. Although its shallow roots restrict western hemlock to areas where soils do not freeze, it tolerates a wide range of soil conditions, growing in almost pure stands or mixed with Douglas-fir (Pseudotsuga menziesii (Mirb.) Franco).
The original parameterization of the TASS crown profile function for western hemlock was based on the data available in the late 1980s, and many more trees have been sampled since then. We present here new statistical methods for estimating the parameters of the crown expansion function in the crown profile form using a data set that includes more trees from a wider range of stand conditions and more variables than previously available. Beyond using these data, our objectives in the analysis were (1) to develop statistical methods that allowed data collected under different sampling protocols to be used in the modelling of crown profiles, (2) to use direct measures of crown radius rather than branch length and branch angle in the model fitting and (3) to incorporate explicitly both aggregate and component measures of crown size in the evaluation of a crown profile model.
2. Materials and Methods
2.1. Data Collection
Data were assembled from three sources (G86, W98, P99, see Table 1) that together provided 153 western hemlock trees from various locations in coastal B.C. The G86 data were collected from naturally regenerated stands on five locations along the eastern coast of Vancouver Island; 20 trees were sampled between October and November 1986. The W98 data were collected from naturally regenerated stands in the Cowichan Lake (25 trees) and Malcolm Knapp Research Forests (21 trees) as well as at Port Renfrew (22 trees) on the western coast, and Port McNeil (18 trees) on the eastern coast of Vancouver Island. Trees were selected at all four locations from different stands representing four age classes: 20, 40, 60 and over 90 years old. The P99 data came from a progeny trial established on two sites: one established in 1981 in the Fraser Valley at Mission and the other in 1982 on Tree Farm License (TFL) 47 on Vancouver Island at 2 m square spacing. Four trees were chosen from each of the six families on each site for a total of 48 trees.

Table 1.
Summary statistics from sample trees from three different sources.
Tree selection procedures were common to stands sampled at all three sources. Within each stand, trees were selected purposively to represent the range of tree sizes, ages and social status. The selection was restricted to those that could be felled easily without creating large openings and those having symmetrical crown shapes with no obvious evidence of severe damage or disease.
Before felling, location of breast height (1.3m) and cardinal directions were marked on the tree bole with paint, and the crown vertical projection was mapped for each standing sample tree. The map was constructed with measurements of horizontal distance and azimuth from the centre of the tree stem to the perimeter of the crown at 8–15 key points around the crown using a measuring tape, compass and 90-degree clinometer. Those measurements of radius and azimuth were converted to Cartesian x-y coordinates that form the vertices of a crown projection polygon, the area of which was calculated using the continuous product method [30] and denoted as CPAG.
After felling, the height to lowest live branch (H2L) and height to crown contact (H2C) were measured in each of the four crown quadrants. The point of crown contact was the highest point on the crown with evidence of branch abrasion from interaction with neighbouring trees. Typically, the point of crown contact is also the widest point of the crown in that quadrant. Cross-sectional disks from the stem were cut at three fixed heights (0.3, 0.7, 1.3 m) and 7–10 other heights equally spaced between 1.3 m and the top of the tree. The disk locations defined the limits of stem sections used in subsequent sampling of branches. Western hemlock forms annual terminal buds surrounded by a whorl of branches, which is not as distinct as in other conifer species but is recognizable [31]. The location of each stem node within the live crown was identified and the height to each node was recorded. Nodes within 7–10 years of the top of the tree could be identified by persistent bud scars, while the locations of nodes lower in the crown were determined by the presence of branch whorls. The number of stem nodes identified in each stem section was cross-referenced with ring counts from disks cut at the ends of each section, and any discrepancies were resolved. In some cases, it was necessary to cleave the stem sections vertically and expose the pith nodes to correctly identify the location of each node.
The procedures for branch selection evolved from 1986 to 1999, but overall, the methods were some variant of two-stage sampling. In the first stage, a subset of the stem internodes within the crown was selected. This selection was either systematic from all internodes along the stem or at random from equally sized regions of the stem. In the second stage, branches within those internodes were selected in one of two ways: longest two branches (LNG2) or three branches selected with probability proportional to branch basal diameter (PPS3). Branches with severe damage from felling or other causes were identified and excluded from sampling.
For the G86 source, crews selected the stem internode nearest the top of each stem section, and the two longest whorl branches in that internode for detailed measurements (LNG2, Table 2). The procedures used for sources W98 and P98 followed the PPS3 protocol and were guided by a custom-built data collection program (Stem and Tree Analysis Recording System, STARS), running on a hand-held computer. STARS selected, at random, one undamaged internode from each of the stem sections within the live crown. If this selection yielded fewer than six internodes, additional internodes were drawn from the middle third of the crown to ensure a minimum of six. Before branches were measured, each stem section that included a sample internode was secured in a vertical position with ropes in an open space between trees to allow the branches to return to their normal position (see Figure 1). Within sample internodes, the location (azimuth and height) and basal diameter (inside and outside bark, vertical and horizontal) and total length (BL) were recorded for every live branch. For detailed stage 2 measurements, three branches in each internode were selected with probability proportional to size (PPS3), where basal cross-sectional area (outside bark) was the size metric. The detailed measurements of branch size and orientation were similar in all sources (Table 3, Figure 1).
Table 2.
Details on sources of data.
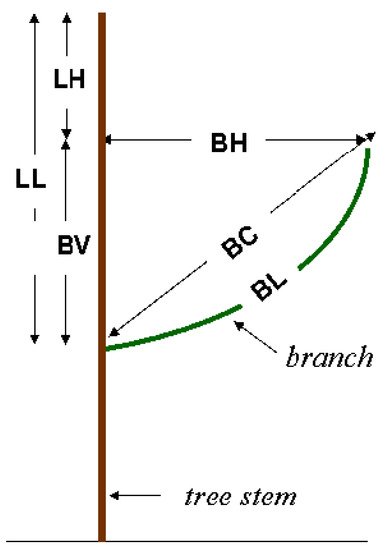
Figure 1.
Schematic of detailed branch measurements.
Table 3.
Definitions of detailed branch measurements.
2.2. Analyses
The analyses comprised two phases: first the development of a crown profile function based on the component measures of crown size, the branch measurements; and second, the estimation of the final parameter of the profile model using the aggregate measure of crown size, crown projected area (CPA).
2.2.1. Modelling the Component Measures
As shown earlier, Mitchell [6] developed an equation to predict branch length (BL) as a function of the distance from the tree apex to the base of the branch (LL) (Equation (2)). At that time, the parameters (c0 and c1) were estimated from data restricted to a subset of the largest branches at each sample internode. With scalar adjustments for branch angle and curvature, this equation has served as the crown profile function of TASS [6,32].
Our analysis uses the same equation form (Equation (3)) to predict the branch horizontal extent (BH) directly from the distance from the apex to the point of horizontal extent (LH, see Figure 1):
When the selection of branches is restricted to the P largest branches, (e.g., whorl branches) then the function describes points along the crown profile, BHPi, as per Mitchell [6]:
To include inter-whorl branches, we developed a more general approach, recognizing that for any branch i with horizontal extent BHi at a location LHi on the stem, there is an associated point BHPi on the perimeter of crown (Figure 2). We define RHi as the ratio of the branch horizontal extent relative to the horizontal distance from the stem to the crown perimeter at that location, LHi:
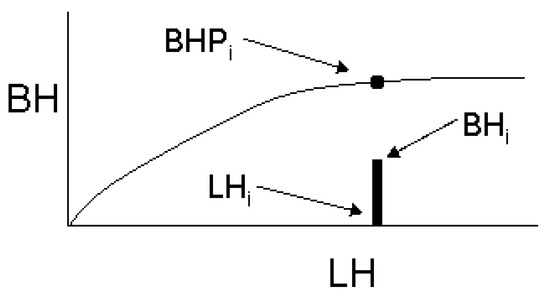
Figure 2.
Schematic of the crown profile.
RHi cannot be calculated, however, because BHPi is unknown and we also cannot be sure the branch with the maximum BH in the internode was selected for measurement when the selection is stochastic. Instead, we substituted a related measure, RLi, that is derived from auxiliary information measured on every branch in the sample internode. RLi is the ratio of branch length, BLi, to the length of the longest branch, BLmax, in the internode that contains branch i:
We posited that the relationship between RLi versus RHi could be approximated by either a linear model (Equation (7)) or a power function (Equation (8)):
Next, we substitute into Equation (5) the expression for RH from Equation (8) and the expression for BHPi from Equation (3), which, after rearranging the terms, produces:
To recognise the tree-level clustering of the branch observations and to capture the variation in crown profile among trees and, we use a mixed-effects model to predict BH for branch i on tree j with random, tree-level effects introduced for the b0 and b1 parameters. We examined three variations:
(a) a mixed-effects model (ML) with the linear function for RL:
(b) a mixed-effects model (MP) with the power function for RL:
and, (c) a mixed-effects model (MB0) with parameter b1 as a linear function of b0 and RL as a power function. This was included to assess the potential of a more parsimonious model which reduced the number of parameters by one (dropped: b1, s12, ρ; added: d0, d1), and which might be more readily applied in TASS:
where
= fixed effects parameters
~
~
The NLMIXED procedure of SAS/STAT software, version 9.4 [33] was used to fit the models.
2.2.2. Adjusting the Crown Profile with Ground Estimates of Crown Projection Area (CPAG)
Once parameters for the above models have been estimated, setting RL = 1.0 produces a crown profile model that describes the outer envelope of the crown expressed as a predicted crown radius. The second phase involves a comparison of the crown projection area estimated from the crown profile function, CPAP, and the crown projection area estimated from ground measurements, CPAG, the aggregate measure described earlier. To calculate CPAP, we used the parameter estimates from the MB0 model, including random effects (BLUPs) from each tree, to predict the crown radius at contact () for each quadrant, q, on the crown of each tree:
where
= Tree height
= Height to crown contact in quadrant q
The estimate of CPAP is the sum of the areas in the four quadrants, where the area of each quadrant is one-quarter of a circle with a radius that is the crown radius at contact for that quadrant:
We evaluated the differences between the two estimates of CPA: (viz., CPAG – CPAP) and derived an adjustment ratio, RA (Equation (15)), for the predicted crown radius, which was estimated by minimizing the mean of the squared differences.
3. Results
3.1. Component Measures
The maximum likelihood estimates of parameter values for models ML, MP, MB0 and goodness of fit, statistics are presented in Table 4. Likelihood ratio tests [34] suggested the data support the use of the exponent b2 for RL (Equation (11), LR = 26.83, DF = 1, P < 0.0001). The model with b1 as a function of b0 performed well and graphs of the crown profiles showed that for most trees, the MB0 model provided an equivalent representation of the crown to the MP model (see Figure 3).
Table 4.
Parameter estimates, standard errors (SE) and fit statistics for crown profile models ML (Equation (10)), MP (Equation (11)) and MB0 (Equation (12)) for western hemlock.
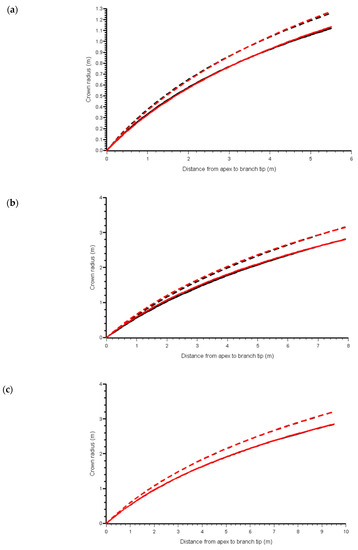
Figure 3.
Predicted crown profiles of western hemlocks showing a range of lengths to crown contact (a) from the first quartile length to contact, (b) from the median and (c) from the third quartile, and the predictions of the MP (red) and MB0 (black) models with (solid line) and without (dashed line) reduction factor applied.
We examined the pattern of residuals versus stand and tree attributes of interest including site index, age, tree height, tree diameter at breast height (dbh), crown length, crown ratio and CPAG, and found well-balanced patterns for all. Box plots of residuals by crown class suggest slight under-prediction in suppressed trees, but no trends in the other crown classes. We note that suppressed trees were sampled in about one-third of the stands.
We also examined trends in the best linear unbiased predictions (BLUPs) for the b0 coefficient versus the same stand and tree covariates. This coefficient acts as a scalar in the function, thus, the expected trend with CPAG was observed, but there were no trends with any of the other variables. In stands with variation in social status among trees, there were visible differences in crown profile of suppressed trees in some of the stands, but no consistent differences among stands (Figure 4). Figure 5 shows the means by crown class of the BLUPs for b0 from the MB0 model.
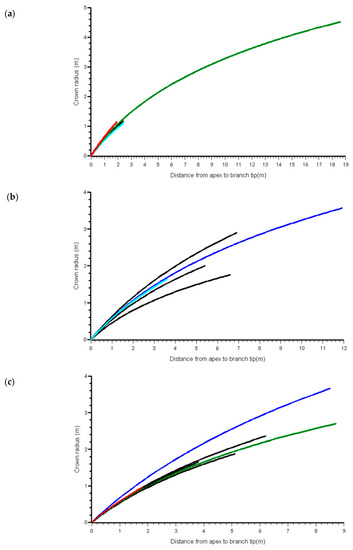
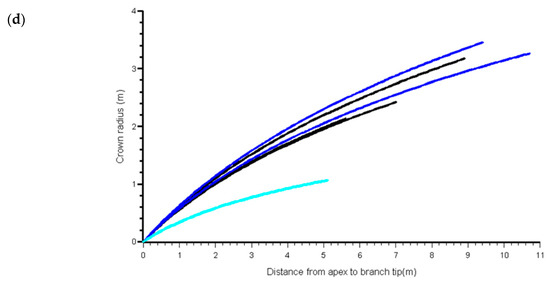
Figure 4.
Predicted western hemlock crown profiles from MB0 model, from apex to point of crown contact, within four selected stands showing variation in social status: (a) 60-year age class at Franklin River (G86), (b) 60-year age class at Port McNeil (W98), (c) 20 year age class at Port Renfrew (W98) and (d) 40 year age class at Port Renfrew (W98). Green = Open-grown, Blue = Dominant, Black = Co-dominant, Cyan = Intermediate, Red = Suppressed. Note that not all stands had all social status categories.
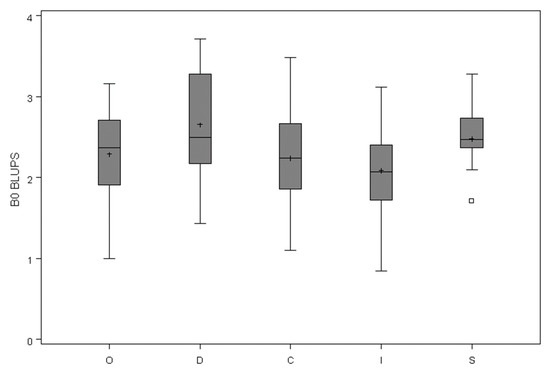
Figure 5.
The distribution of means, standard deviation, and range of best linear unbiased predictions (BLUPs) from the MB0 model by crown class. O = open-grown, D = dominant, C = co-dominant, I = intermediate, S = suppressed.
3.2. Adjusting the Crown Profile with Ground Estimates of Crown Projection Area (CPAG)
The value of ratio adjustment for the crown profile, RA (Equation (15)), was 0.89 for both the two random parameter model (Equation (11)) and the MB0 model (Equation (12)). Comparisons of measured and the predicted values of CPA show reasonable agreement (Figure 6), especially for trees ≤ 30m tall, and for which the predicted CPA was usually < 40m2.
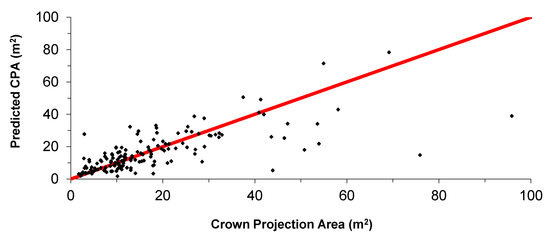
Figure 6.
Predicted versus measured values of Crown Projection Area (CPA). The red line indicates 1:1 ratio.
We examined the crown profiles of individual trees in the database. Some have the largest branches and hence crown radii below the point of crown contact. This is especially true for shade tolerant trees where branch extension can exploit space and branch growth is less influenced by shading from competitors. From this, we infer that the ground estimate, CPAG, accounted for irregularities in the crown shape more accurately than the fitted profile model.
4. Discussion
Incorporating relative branch length (RL)—based on the longest branch in each internode—in the profile model allowed us to include data from all measured branches and combine data sets collected under different branch selection protocols, in this case either the largest two branches or branches selected with probability proportional to size. This model shows considerable utility in modelling the profile in the unimpeded sections of the crown. When RL is set at 1.0, the model approximates the outer envelope of the crown, much like the results achieved with stochastic frontier analysis (see [22]). Using a stochastic frontier model with our data, however, would be inappropriate because the branch selection methods used in all the various studies emphasised selection of the larger branches and produced too few measurements of the smaller, interwhorl branches needed for good estimates of the one-sided component of the composed error term [22].
Using a mixed-effects model recognised the within-tree clustering of branch measurement, leading to an appropriate variance-covariance structure for the model error. It also allowed recognition of separate tree-level and inter-tree level sources of variation [35]. With many sites having only four or five sample trees, however, we did not model tree-to-tree variation within site. Within TASS, the tree-to-tree variability in crown expansion is estimated in data collected specifically for that purpose.
Our examination of model residuals and BLUPs for b0 versus important stand and tree metrics confirmed that the models address the continuous variables very well and do not suggest that additional covariates are necessary. We also examined social status as a categorical variable (Figure 5) and as its continuous surrogate, height-DBH ratio [36]. Although the social status of a tree has been shown to affect the shape of the crown profile of Pseudotsuga menziesii [Mirb.] Franco in the Pacific northwest [36], and of other conifers e.g., Cunninghamia lanceolata [37], we found for western hemlock, like Marshall et al. [38], that crown profiles were little influenced by social status.
We also examined the residuals and BLUPs to assess the influence of including the trees from the progeny trial in our data set. The residuals by family are well balanced, meaning that the existing covariates are sufficient to provide good predictions for the trees in the progeny trial. The means of BLUPs for b0 show the differences amongst families, but the overall mean of BLUPs changes by less than 2% when the entire progeny trial is excluded.
We calculated the aggregate metric, CPAP, estimated profiles to crown contact, and compared that with the ground measurement, CPAG, as a check for a profile constructed from component branch measures. In general, we found that the crown areas estimated from the profile, CPAP, were larger than those based on measurements in the field, CPAG. There are several possible explanations for this. One explanation is that we presumed that the potential growth rate of branches was radially symmetric. Many papers have reported crown radial asymmetry in conifers (e.g., [39,40,41]. Buds and branches on annual shoots, however, tend to be well distributed in an annual whorl and rarely grow near each other at similar azimuths [42,43]. Cannell and Bowler [42] suggested that this arrangement helps to minimise mutual shading of branches, to ensure that trees are evenly weighted on all sides, and to use vascular pathways evenly around the trunk. Branch extension, however, follows no simple rules. In the northern hemisphere, Rouvinen and Kuuluvainen [40] measured asymmetric Scots pine (Pinus sylvestris L.) and Gao et al. [44], working with Larix olgensis A. Henry, found the crown to be strongly oriented towards the south and southwest probably resulting from the combination of light availability and wind direction [45]. For Sitka spruce (Picea sitchensis (Bong.) Carrière), the biggest branches tended to be on the south side but were more numerous on the north side [46]. Grace et al. [41] found the azimuth angle of the largest branch on radiata pine (Pinus radiata D. Don) was variable but for two thirds of trees there was a preferred angle for the largest branch to be on the northern side of the tree in the southern hemisphere. Component approaches to crown profile modelling (e.g., [21,38]) and aggregated ones (e.g., [15,16,17]) have explicitly measured crown asymmetry. However, in both approaches the measures were combined to develop a model of average crown profile for each tree in order to be useful in process or structural functional models.
The upper segment of the crown usually contains the densest foliage [47], although Kantola and Mäkelä [48] found that in Norway spruce (Picea abies (L.) Karst.) this was age dependent and foliage was densest in the lower crown in young trees, prior to crown closure. Raulier et al. [47] divided the crown of black spruce into light and shade segments based on crown contact; other authors, whether using component (e.g., [36,38] or aggregated measures (e.g., [15]) have found it useful to divide the crown into upper and lower segments, using the point of maximum crown width serving as the transition point. In contrast, Gao el al. [44] did not use this approach for plantation Larix olgensis, using a single function instead.
Another potential cause for overestimating the crown area is that the outer perimeter of the lower crown in conifers becomes more ragged, with large gaps between long branches, as stands mature after crown closure. This portion of the crown is self-shaded as well as shaded and abraded from neighbouring trees. When the profile is used to compute CPAP by quadrant, we assume that an entire quadrant is occupied and that may not be true.
Finally, we are aware there could be errors in the measurement and calculation of the field measurement, CPAG, that could produce an underestimate of that metric. We know from experience that locating the perimeter of the crown with a 90-degree clinometer is problematic, and this could lead to errors in area estimation. Of more concern, however, is the calculation of CPAG, where radial measurements of critical points on the crown perimeter are used to create a projection map and the continuous product method is used to compute the area of that map. While this method has been applied for two decades, the statistical properties are not known. An alternative, unbiased estimator for crown projection area is available for radial measurements when the azimuths are chosen either randomly or systematically rather than purposively [49], and some preliminary comparisons suggest the map method may underestimate the crown area by 15%–20%.
Whatever the reason, projected crown areas were generally larger than those measured in the field, and we have shown the effect of adjusting the profile for that difference.
5. Conclusions
TASS has been used successfully since 1976 to predict future growth and yield of managed stands in British Columbia. Since that time, functions and parameters have been developed for different species; however, despite new data, the original crown profile function developed by Mitchell [6] had not been changed. Initially, branch length and distance from the apex to the base of each sample branch was measured, but by the early 1980s, measurements of crown radius were also being collected. These data permit a model in which crown radius is estimated from the tip of the branch to a horizontal position on the bole. Mitchell observed some variation between trees in the width of the crown profiles and he chose to mimic that by adding some random variation to the coefficient b0 in equations (10) through (12). Our analysis uses contemporary mixed-effects modelling techniques that recognise this variation and the clustering of branch data on annual growth, whorl and interwhorl, within a tree.
We developed a model with two random effects and one in which the second coefficient was predicted as a linear function of b0, (Equation 12). This second model had a higher AIC than the first but complemented the existing structure of TASS. Visually, the individual tree crown profiles from the two models as well as the resulting predicted crown areas were very similar. The adjustment scalar (0.89), based on field measurements of aggregate crown size, was the same for both models.
Stand-level calibration of the TASS model is based on measurements in planted stands. These calibrations suggested that the previous simulated crown profiles were too wide. The addition of new data analysed by contemporary methods predicts western hemlock crown profiles that are narrower than those historically used in TASS. Recalibration upon implementation in the simulator is underway.
Author Contributions
Conceptualization, I.R.C. and J.W.G.; methodology, I.R.C.; validation, I.R.C. and R.P.; formal analysis, I.R.C. and R.P.; investigation, I.R.C., J.W.G. and R.P.; resources, all authors; data curation, J.W.G., R.P. and I.R.C.; writing—original draft preparation, R.P. and I.R.C.; writing—review and editing, C.A.B.S., R.P. and I.R.C.; visualization, I.R.C. and R.P.; supervision, I.R.C.; project administration, I.R.C., J.W.G. and C.A.B.S.; funding acquisition, C.A.B.S. and J.W.G. All authors have read and agreed to the published version of the manuscript.
Funding
This research was funded by the B.C. Forestry Innovation Investment – Forest Science Program and the B.C. Ministry of Forests, Lands, Natural Resource Operations and Rural Development Land Based Investment Strategy program. The APC was funded by the B.C. Ministry of Forests, Lands, Natural Resource Operations and Rural Development Forest Science Program.
Acknowledgments
We gratefully acknowledge the contributions of P. Ott, S. Baral and two anonymous reviewers whose input greatly improved this manuscript.
Conflicts of Interest
The authors declare no conflict of interest. The funders had no role in the design of the study; in the collection, analyses or interpretation of data; in the writing of the manuscript, or in the decision to publish the results.
References
- Stenberg, P.; Kuuluvainen, T.; Kellomäki, S.; Grace, J.C.; Jokela, E.J.; Gholz, H.L. Crown structure, light interception and productivity of pine trees and stands. Ecol. Bull. 1994, 43, 20–34. [Google Scholar]
- Brunner, A. A light model for spatially explicit forest stand models. For. Ecol. Manag. 1998, 7, 19–46. [Google Scholar] [CrossRef]
- Brunner, A.; Nigh, G. Light absorption and bole volume growth of individual Douglas-fir trees. Tree Physiol. 2000, 20, 323–332. [Google Scholar] [CrossRef] [PubMed][Green Version]
- Valentine, H.T.; Mäkelä, A. Bridging process-based and empirical approaches to modeling tree growth. Tree Physiol. 2005, 25, 769–779. [Google Scholar] [CrossRef] [PubMed]
- Rudnicki, M.; Silins, U.; Lieffers, V.J.; Josi, G. Measure of simultaneous tree sways and estimation of crown interactions among a group of trees. Trees 2001, 15, 83–90. [Google Scholar] [CrossRef]
- Mitchell, K.J. Dynamics and simulated yield of Douglas-fir. For. Sci. Monogr. 1975, 17, 39. [Google Scholar]
- Larson, P.R. Stem form development of forest trees. For. Sci. Monogr. 1963, 5, 42. [Google Scholar] [CrossRef]
- Houllier, F.; Leban, J.-M.; Cohn, F. Linking growth modelling to timber quality assessment for Norway spruce. For. Ecol. Manag. 1995, 74, 91–102. [Google Scholar] [CrossRef]
- Mansfield, S.D.; Parish, R.; Goudie, J.W.; Kang, K.-Y.; Ott, P. The effects of crown ratio on the transition from juvenile to mature wood production in lodgepole pine in western Canada. Can. J. For. Res. 2007, 37, 1450–1459. [Google Scholar] [CrossRef]
- Hann, D.W.; Hester, A.S.; Olsen, C.L. ORGANON user’s manual: Edition 5.1 Southwest Oregon version and western Willamette Valley version; Oregon State University: Corvallis, OR, USA, 1995; 113p. [Google Scholar]
- Wykoff, W.R.; Crookston, N.L.; Stage, A.R. User’s guide to the stand prognosis model. USDA For. Serv. Gen. Tech. Rep. 1982, INT-133, 112. [Google Scholar]
- Mäkelä, A. Modeling structural-functional relationships in whole-tree growth: Resource allocation. In Process Modeling of Forest Growth Responses to Environmental Stress; Dixon, R.K., Meldahl, R.S., Ruark, G.A., Warren, W.G., Eds.; Timber Press: Portland, OR, USA, 1990; pp. 81–95. [Google Scholar]
- Sievänen, R.; Mäkelä, A.; Nikinmaa, E.; Korpilahti, E. Preface to “Helsinki Workshop on Functional-Structural Tree Models”. Silva Fenn. 1997, 31, 237–238. [Google Scholar]
- Cluzeau, C.; Le Goff, N.; Ottorini, J.-M. Development of primary branches and crown profile of Fraxinus excelsior. Can. J. For. Res. 1994, 24, 2315–2323. [Google Scholar] [CrossRef]
- Crecente-Campo, F.; Marshall, P.; LeMay, V.; Dieguez-Aranda, U. A crown profile model for Pinus radiata D. Don in northwestern Spain. For. Ecol. Manag. 2009, 257, 2370–2379. [Google Scholar] [CrossRef]
- Baldwin, V.C., Jr.; Peterson, K.D. Predicting the crown shape of loblolly pine trees. Can. J. For. Res. 1997, 27, 102–107. [Google Scholar] [CrossRef]
- Gill, S.J.; Biging, G.S. Autoregressive moving average models of conifer crown profiles. J. Agric. Biol. Environ. Stat. 2002, 7, 558–573. [Google Scholar] [CrossRef]
- Sheng, Y.W.; Gong, P.; Biging, G.S. Model-based conifer canopy surface reconstruction from photographic imagery: overcoming the occlusion, foreshortening, and edge effects. Photogramm. Eng. Remote Sens. 2003, 69, 249–258. [Google Scholar] [CrossRef]
- Martin-Ducup, O.; Schneider, R.; Fournier, R.A. A method to quantify canopy changes using multi-temporal terrestrial lidar data: Tree response to surrounding gaps. Agric. For. Meteorol. 2017, 237–238, 184–195. [Google Scholar]
- Dalponte, M.; Coomes, D.A. Tree-centric mapping of forest carbon density from airborne laser scanning and hyperspectral data. Methods Ecol. Evol. 2016, 7, 1236–1245. [Google Scholar] [CrossRef]
- Roeh, R.L.; Maguire, D.A. Crown profile models based on branch attributes in coastal Douglas-fir. For. Ecol. Manag. 1997, 96, 77–100. [Google Scholar] [CrossRef]
- Nepal, S.; Somers, G.; Caudill, S. A stochastic frontier model for fitting tree crown shape in loblolly pine. J. Agric. Biol. Environ. Stat. 1996, 1, 336–353. [Google Scholar] [CrossRef]
- Cochrane, L.A.; Ford, E.D. Growth of a Sitka spruce plantation: Analysis and stochastic description of the development of the branching structure. J. Appl. Ecol. 1978, 15, 227–244. [Google Scholar] [CrossRef]
- Valentine, H.T.; Tritton, L.M.; Furnival, G.M. Subsampling trees for biomass, volume, or mineral content. For. Sci. 1984, 30, 673–681. [Google Scholar]
- Halle, F.; Oldeman, R.A.A.; Tomlinson, P.B. Tropical trees and forests: An Architectural Analysis; Springer: New York, NY, USA, 1978; 444p. [Google Scholar]
- Tomlinson, P.B. Architecture of tropical plants. Ann. Rev. Ecol. Syst. 1987, 18, 1–21. [Google Scholar] [CrossRef]
- Goudie, J.W.; Parish, R.; Antos, J.A. Foliage biomass and specific leaf area equations at the branch, annual shoot and whole-tree levels for lodgepole pine and white spruce in British Columbia. For. Ecol. Manag. 2016, 361, 286–297. [Google Scholar] [CrossRef]
- Gregoire, T.G. Design-based and model-based inference in survey sampling: Appreciating the difference. Can. J. For. Res. 1998, 28, 1429–1447. [Google Scholar] [CrossRef]
- Burkhart, H.E.; Tomé, M. Modeling Forest Trees and Stands; Springer: New York, NY, USA, 2012; 457p. [Google Scholar]
- Husch, B.; Miller, C.I.; Beers, T.W. Forest Mensuration, 2nd ed.; Ronald Press: New York, NY, USA, 1972; 410p. [Google Scholar]
- Walters, J. The branch arrangement of western hemlock (Tsuga heterophylla [Raf.] Sarg.). Univ. B. C. Fac. For. Res. Note 1960, 29. [Google Scholar]
- Mitchell, K.J.; Cameron, I.R. Managed stand yield tables for coastal Douglas-fir: initial density and precommercial thinning. B.C. Min. For. Res. Branch Land Manag. Rep. 1985, 31, 69. [Google Scholar]
- SAS. SAS/STAT Version 9; SAS Institute Inc.: Cary, NC, USA, 2008. [Google Scholar]
- Schabenberger, O.; Pierce, F.J. Contemporary Statistical Models for the Plant and Soil Sciences; CRC Press: Boca Raton, FL, USA, 2002; 738p. [Google Scholar]
- Leites, L.P.; Robinson, A.P. Improving taper equations of loblolly pine with crown dimensions in a mixed-effects modeling framework. For. Sci. 2002, 50, 204–212. [Google Scholar]
- Hann, D.W. An adjustable predictor of crown profile for stand-grown Douglas-fir trees. For. Sci. 1999, 45, 217–225. [Google Scholar]
- Wang, C.; Wu, B.; Chen, Y.; Qi, Y. Development of crown profile models for Chinese Fir using non-linear mixed-effects modelling. Nat. Environ. Pollut. Tech. 2019, 18, 349–1361. [Google Scholar]
- Marshall, D.D.; Johnson, G.P.; Hann, D.W. Crown profile equations for stand- grown western hemlock trees in northwestern Oregon. Can. J. For. Res. 2003, 33, 2059–2066. [Google Scholar] [CrossRef]
- Schoettle, A.E.; Smith, W.K. Interrelation between shoot characteristics and solar irradiance in the crown of Pinus contorta ssp. latifolia. Tree Physiol. 1991, 9, 245–254. [Google Scholar] [CrossRef] [PubMed]
- Rouvinen, S.; Kuuluvainen, T. Structure and asymmetry of tree crowns in relation to local competition in a natural mature Scots pine forest. Can. J. For. Res. 1997, 27, 890–902. [Google Scholar] [CrossRef]
- Grace, J.C.; Pont, D.; Goulding, C.J. Modelling branch development for forest management. N. Z. J. For. Sci. 1999, 29, 391–408. [Google Scholar]
- Cannell, M.G.R.; Bowler, K.C. Spatial arrangement of lateral buds at the time that they form on leaders of Picea and Larix. Can. J. For. Res. 1978, 8, 129–137. [Google Scholar] [CrossRef]
- Doruska, P.F.; Burkhart, H.E. Modeling the diameter and locational distribution of branches within crowns of loblolly pine in unthinned plantations. Can. J. For. Res. 1994, 24, 2362–2376. [Google Scholar] [CrossRef]
- Gao, H.; Dong, L.; Fengri, L. Modeling variation in crown profile with tree status and cardinal directions for planted Larix olgensis Henry trees in northeast China. Forests 2017, 8, 139–154. [Google Scholar]
- Skatter, S.; Kucera, B. The cause of the prevalent directions of the spiral grain patterns in conifers. Trees 1998, 12, 265–273. [Google Scholar] [CrossRef]
- Achim, A.; Gardiner, B.; Leban, J.-M.; Daquitane, R. Predicting the branching properties of Sitka spruce grown in Great Britain. N. Z. J. For. Sci. 2006, 36, 246–264. [Google Scholar]
- Raulier, F.; Ung, C.-H.; Ouellet, D. Influence of social status on crown geometry and volume increment in regular and irregular black spruce stands. Can. J. For. Res. 1996, 26, 1742–1753. [Google Scholar] [CrossRef]
- Kantola, A.; Mäkelä, A. Crown development in Norway spruce [Picea abies (L.) Karst]. Trees 2004, 18, 408–421. [Google Scholar] [CrossRef]
- Gregoire, T.G.; Valentine, H.T. A sampling strategy to estimate the area and perimeter of irregularly shaped planar regions. For. Sci. 1995, 41, 470–476. [Google Scholar]


© 2020 by the authors. Licensee MDPI, Basel, Switzerland. This article is an open access article distributed under the terms and conditions of the Creative Commons Attribution (CC BY) license (http://creativecommons.org/licenses/by/4.0/).