Article

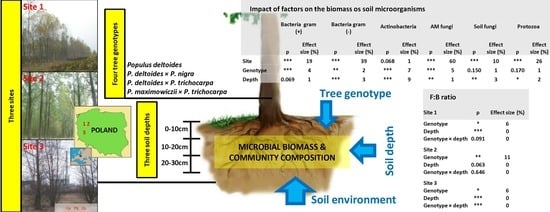
Soil Microbial Biomass and Community Composition Relates to Poplar Genotypes and Environmental Conditions

1
Institute of Dendorlogy, Polish Academy of Sciences, Parkowa 5, 62-035 Kórnik, Poland
2
Aarhus University, Department of Agroecology - Crop Health, Forsøgsvej 1, DK-4200 Slagelse, Denmark
*
Author to whom correspondence should be addressed.
Forests 2020, 11(3), 262; https://doi.org/10.3390/f11030262
Submission received: 31 January 2020 / Revised: 20 February 2020 / Accepted: 25 February 2020 / Published: 27 February 2020

Abstract

:
Poplars, known for their diversity, are trees that can develop symbiotic relationships with several groups of microorganisms. The genetic diversity of poplars and different abiotic factors influence the properties of the soil and may shape microbial communities. Our study aimed to analyse the impact of poplar genotype on the biomass and community composition of the microbiome of four poplar genotypes grown under different soil conditions and soil depths. Of the three study sites, established in the mid-1990s, one was near a copper smelter, whereas the two others were situated in unpolluted regions, but were differentiated according to the physicochemical traits of the soil. The whole-cell fatty acid analysis was used to determine the biomass and proportions of gram-positive, gram-negative and actinobacteria, arbuscular fungi (AMF), other soil fungi, and protozoa in the whole microbial community in the soil. The results showed that the biomass of microorganisms and their contributions to the community of organisms in the soil close to poplar roots were determined by both factors: the tree-host genotype and the soil environment. However, each group of microorganisms was influenced by these factors to a different degree. In general, the site effect played the main role in shaping the microbial biomass (excluding actinobacteria), whereas tree genotype determined the proportions of the fungal and bacterial groups in the microbial communities and the proportion of AMF in the fungal community. Bacterial biomass was influenced more by site factors, whereas fungal biomass more by tree genotype. With increasing soil depth, a decrease in the biomass of all microorganisms was observed; however, the proportions of the different microorganisms within the soil profile were the result of interactions between the host genotype and soil conditions. Despite the predominant impact of soil conditions, our results showed the important role of poplar genotype in shaping microorganism communities in the soil.

Graphical Abstract

1. Introduction

The soil microbiome plays a key role in water and nutrient uptake, pathogen protection, pollutant immobilization and other processes observed in terrestrial ecosystems [1,2,3,4,5]. The community composition and biomass of the soil microbiome have been shown as sensitive indicators of changes in the nutrient status of soil [6], plant species composition [7], soil pollutant deposition [8] and climate changes [9]. Plants, as primary suppliers of carbon exudates and other plant-derived materials, are also important players in shaping the microbiome of the soil environment (e.g., [10,11,12]). The role of plant genotypes in shaping soil microbial communities has less been studied, and most studies have focused on short-lived crop plants, e.g., barley, tomato, cucumber, sweet pepper and chickpea [10,13,14], or on trees at the early stage of growth [15]. Little is known about the extent to which different genotypes of trees affect different groups of soil microbiome after many years of tree growth under different soil conditions [16]. Schweizer et al. [12] showed the significant influence of the genotype of Populus angustifolia and its F1 generation and backcross hybrids on the total microbial biomass in bulk soil but did not observe such effects for Populus fremontii. The host genotype was also found to shape endophytic microbial communities present in different plant tissues (roots, stem, leaves) [1,17,18]. The microbiome composition in plant tissues can be genotype-dependent and significantly different from the microbiome composition in the rhizosphere [1,3,17,19]. The role of plant genotypes in shaping the biomass and community structure of the mycorrhizal part of the microbial community has also been reported by Corredor et al. [20], Gehring et al. [21], Gherghel et al. [22], Karliński et al. [23,24], and Tagu et al. [25]. Most of these findings indicate that tree genotype affects the process of recruitment of ectomycorrhizal fungi in the soil by influencing both the quantities of organic compounds released from the roots and the profiles of root exudates [26]. Unfortunately, there are still relatively few data about the effect of tree genotype on microbes other than ectomycorrhizal fungi in the soil microbial community, and on mutual relationships between different microbial groups.
The high rates of introgression among poplar species and the long history of their cultivation have resulted in many phenologically and physiologically differentiated cultivars and hybrids. As fast-growing trees, poplars have wide applications in various branches of industry, as well as in the afforestation of post-agricultural lands, in the re-cultivation of areas degraded by human activity, in the production of bioenergy [1,27,28], and in the restoration programmes in riparian zones along the rivers [29,30,31]. Long-term poplar plantations may play a significant role in enhancing organic carbon accumulation in soil and in mitigating climate changes [32]. These multipurpose characteristics of poplars have been mirrored in numerous studies and selective breeding programmes [33] and have resulted in poplars becoming a model plant in studies on plant—microbe interactions [17].
To date, several studies have analysed the importance of poplar genotypes on tree biomass production or on the ability of poplars to survive and grow under the influence of different natural and anthropogenic stress factors (e.g., [34,35,36]). In contrast, much less attention has been paid to the influence of poplar genotype on soil microbial communities in the context of soil chemical parameters and soil depth. Soil depth is a factor that is known to influence the biomass and composition of the microbiome by influencing the availability of oxygen, water, carbon and nutrients [37]. In polluted areas, a general tendency of shifting the microbial biomass with the dislocation of poplar roots into deeper, less contaminated soil layers was found [23,24]. In metal-contaminated soil, individual poplar genotypes significantly differed in their fine root distribution according to soil depth [23].
Despite the growing popularity of the new generation sequencing methods, which allow for detailed analysis of soil microorganism communities, the determination of the fatty acid patterns of soil organisms remains still one of the most commonly used methods for testing both the microbial biomass and community structures [38,39]. Analyses of fractions of whole-cell fatty acids (WCFA) are a relatively quick and reliable method to quantify the biomass of microorganisms in soil or in/on roots (e.g., [39,40,41]). Gaining knowledge of the variations in soil WCFA profiles may be an important step in understanding the factors that drive the community of plant—host—associated microorganisms.
The aim of this study was to estimate the impact of poplar genotype on the biomass and community composition of microorganisms in the rhizosphere of mature poplars in different soil conditions and at different soil depths. We hypothesized that both plant genotype and soil depth will contribute to the biomass and community composition of the soil microbiome, and soil conditions will modify this influence.

2. Materials and Methods

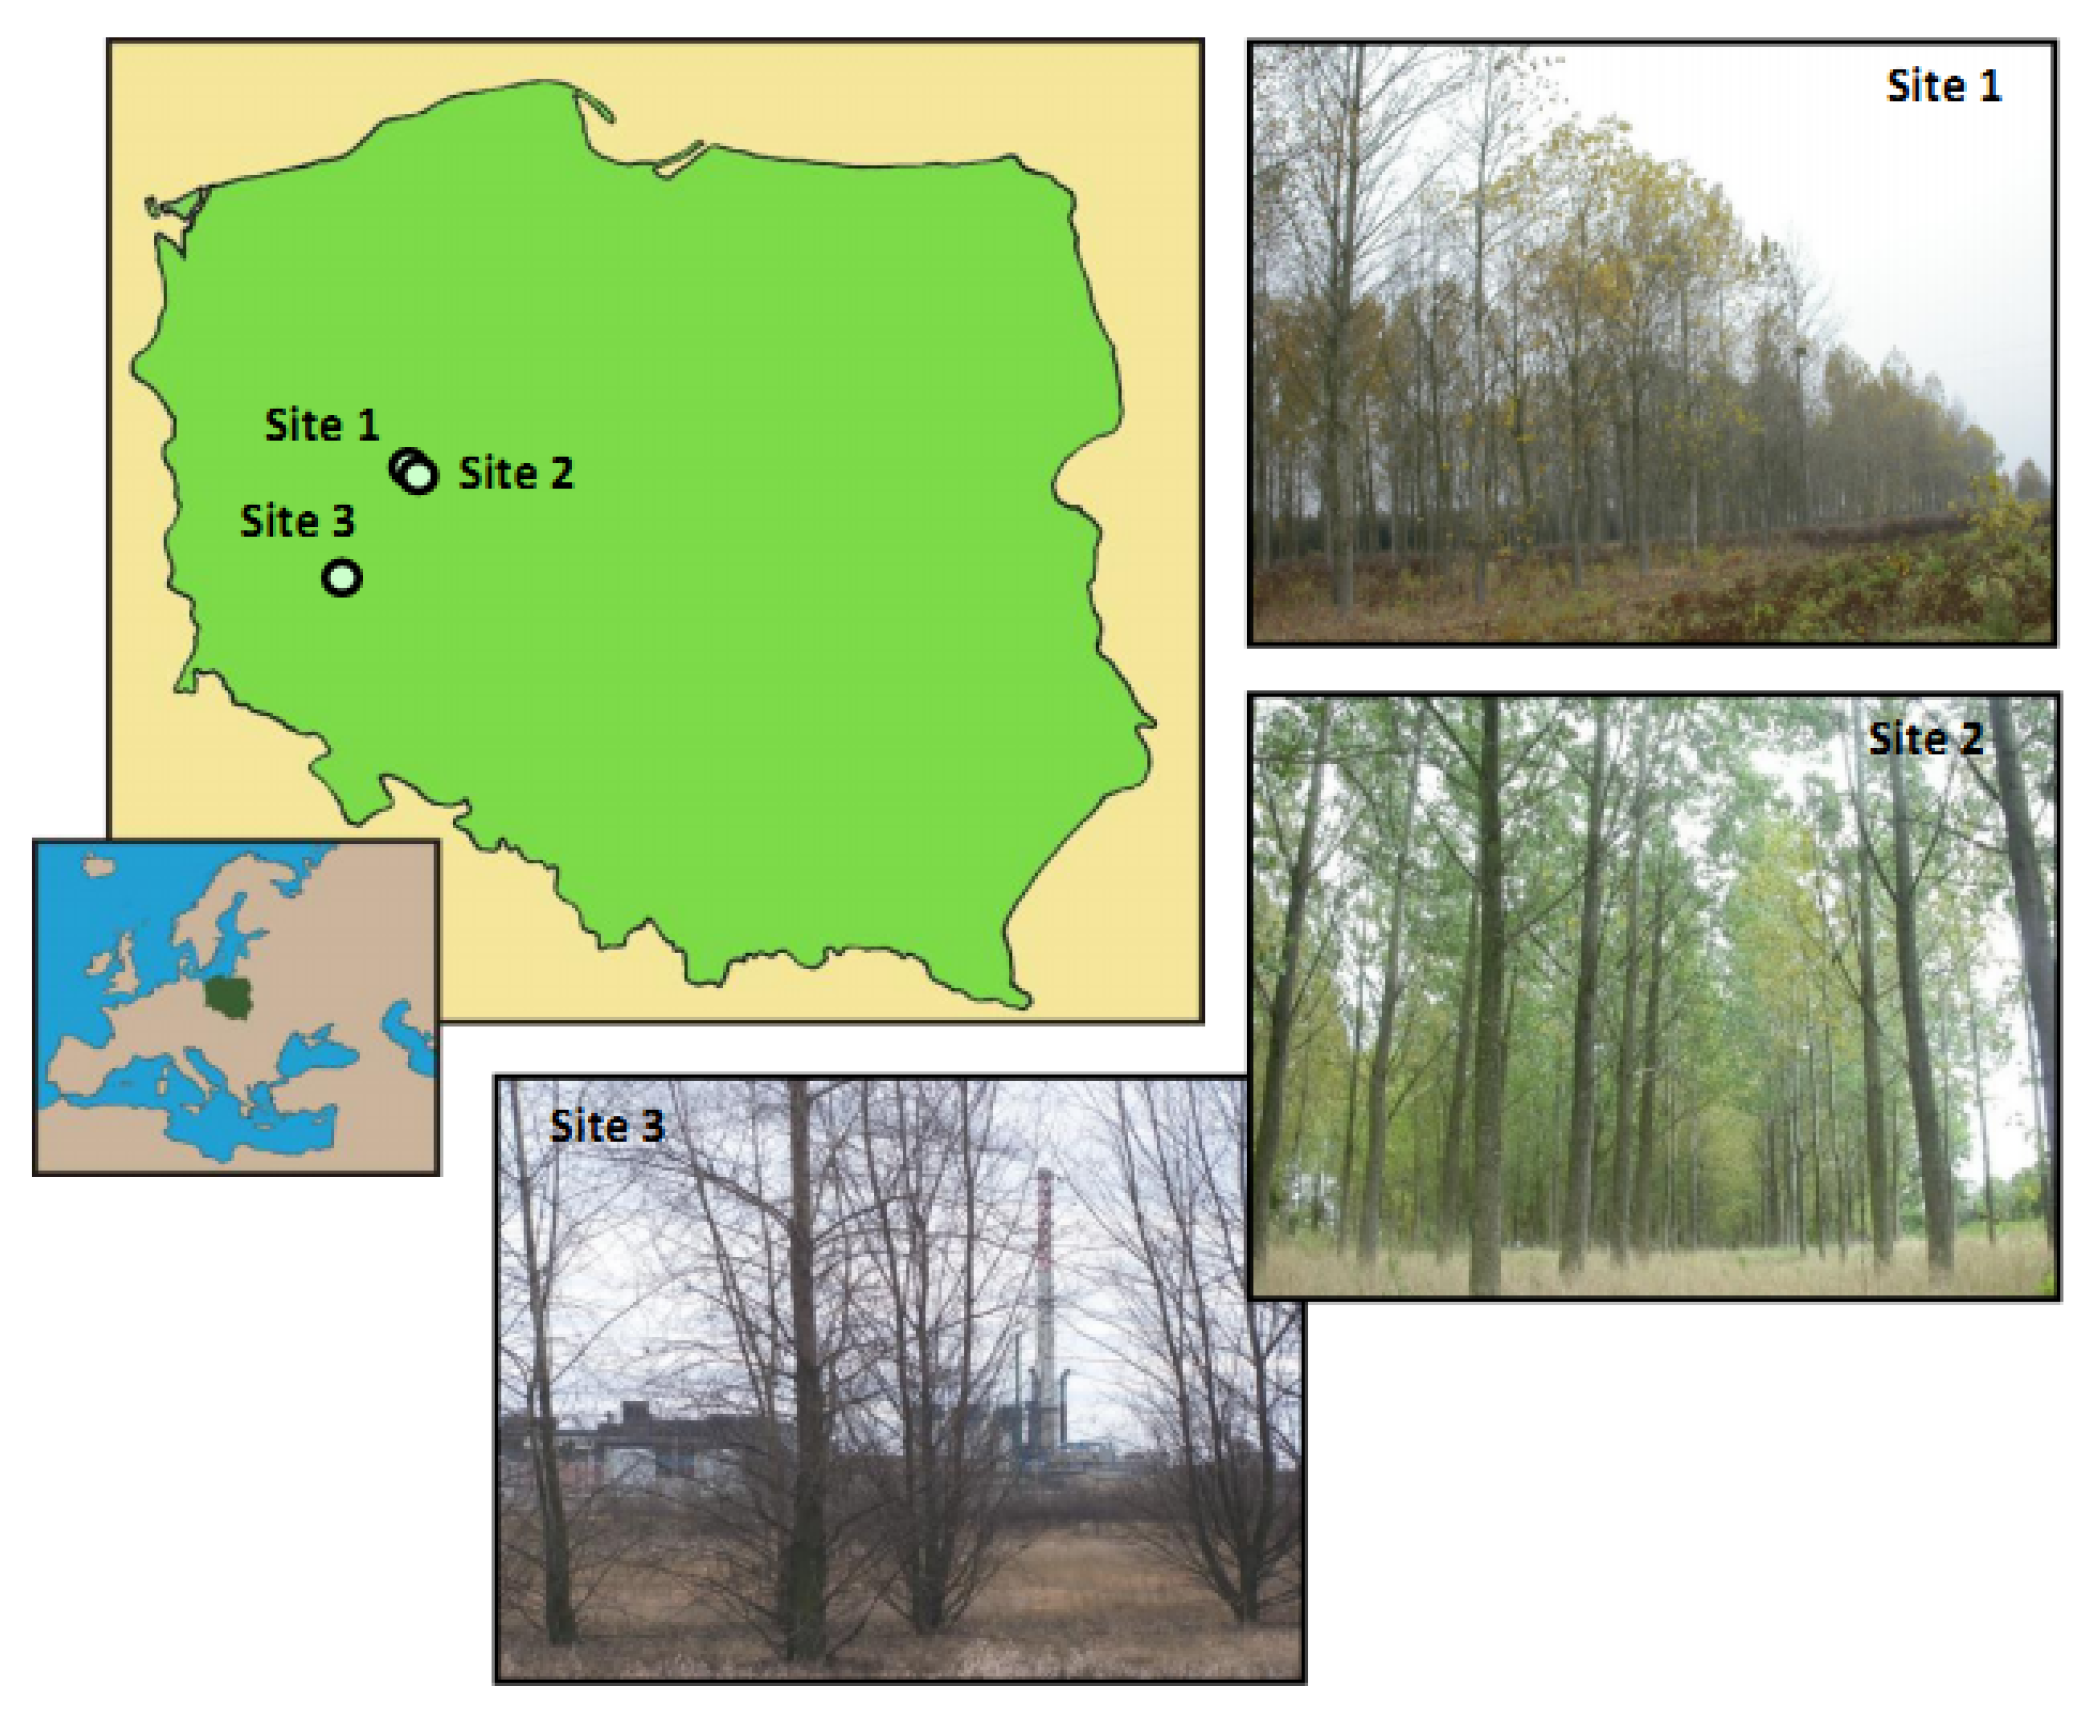
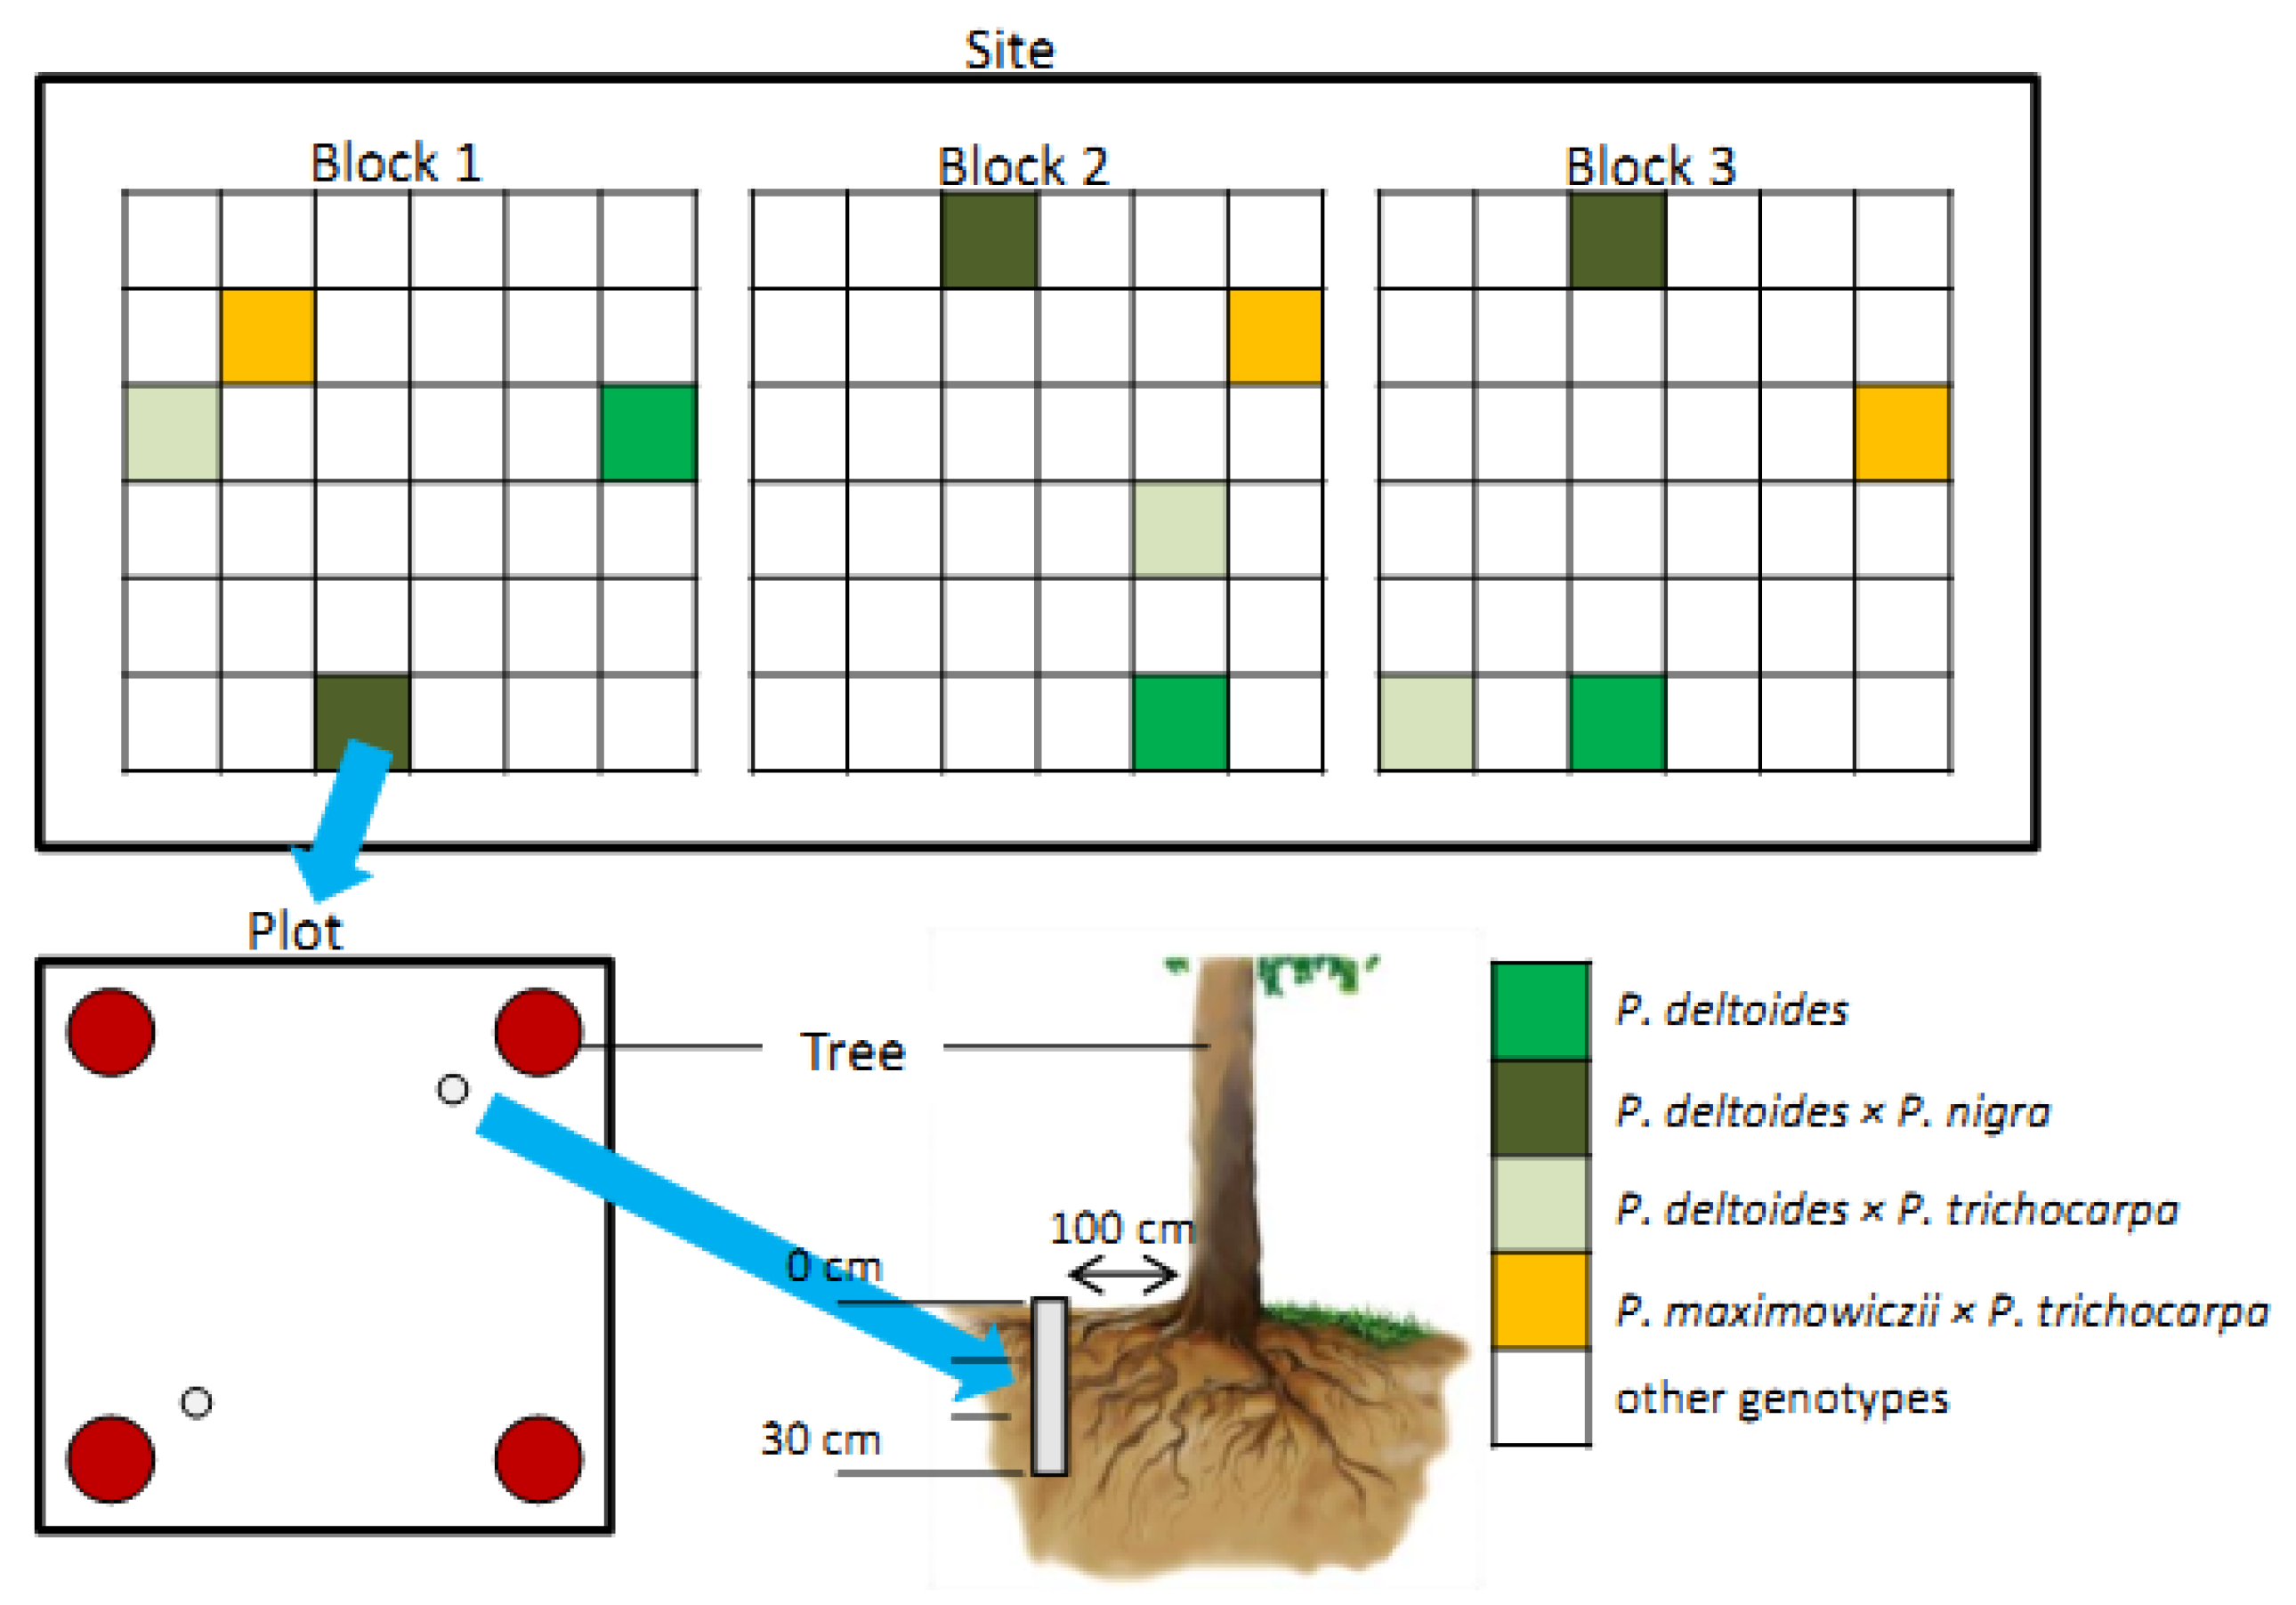
2.1. Plant Material and Study Sites

Four poplar genotypes were selected for the experiments: Populus deltoides (clone S-1-8 ‘DUNAV’), P. deltoides × P. nigra (clone 490-1), P. deltoides × P. trichocarpa (clone ‘DONK’) and P. maximowiczii × P. trichocarpa (clone NE-42). The poplar genotypes used in the present study originated from the long-term breeding programme conducted by the Institute of Dendrology Polish Academy of Sciences for the purpose of clone selection to develop protective zones around industrial plants, which are especially burdensome for the environment. The selected four poplar genotypes represented well-growing and widely cultivated clones in Europe and the USA. The poplar genotypes were grown in three field experiments established in 1993 (Sites 1 and 3) and 1996 (Site 2) (Figure 1). Each poplar genotype at each site was represented by three plots (Figure 2). Each plot was represented by four trees of one poplar genotype.
Study sites were localized at post-agricultural areas. The soils classified according to the (Food and Agriculture Organization (FAO), as Cambisol soils at Site 1 were represented by loamy sand and at Site 2 and Site 3 by sandy loam.
Site 1 (52°14′39.7″ N, 17°04′07.3″ E) was established in the vicinity of the dominated by Picea abies coniferous forest (compartment 1Ac) included in the complex of experimental forests—Zwierzyniec, belonging to the Institute of Dendrology. Site 2 (52°14′39.7″ N, 17°06′27.4″ E) was located between old poplar trees on the one side and a collection of larch trees on the other side at the area of experimental fields of the Institute of Dendrology in Kórnik. Both sites (Site 1 and 2) placed near Kórnik represented areas free from the direct influence of industrial pollution (Figure 1). Site 3 (51°41′19.1″ N, 16°00′06.2″ E) was located near the Odra River at the buffer zone A (compartment 12b) of the Głogów copper smelter (KGHM Polska Miedź) in Żukowice (active since 1971). Site 3 significantly differed in soil characteristics compared to unpolluted sites 1 and 2 (Table 1).
The soil at Site 3 revealed significantly the highest concentrations of copper, lead, zinc, cadmium, but also carbon, nitrogen, phosphorus and potassium. On the other hand, the concentration of N-NO3 and soil pH value was the lowest here. Study sites did not reveal significant differences in soil concentrations of N-NH3 and Ca, and in the carbon/nitrogen ratio.
At Site 3, there was a tendency for higher average soil moisture and daily soil temperature than those at Sites 1 and 2 [23,24].
The concentration of heavy metals at soil profile was differentiated. The highest concentrations of copper and lead were observed in the upper soil layer of Site 3. The concentration of zinc was the highest at the lowest soil layer when the Cd concentration remained relatively stable through the analysed soil profile.

2.2. Sample Collection

All soil samples from three sites (six per genotype at each site, two per plot) were collected for several days in November in stable weather conditions. Samples were taken at a distance of 1 m from the tree trunk, including roots area from a soil depth of 0–30 cm using a soil corer (diameter 5 cm) (Figure 2). The samples were divided into three subsamples (0–10 cm, 10–20 cm and 20–30 cm) and transported in the fridge to the lab. Roots were removed from samples. Next, soil samples were freeze-dried and ball-milled, and stored in plastic bags at −20 °C until analysis.

2.3. Whole Cell Fatty Acid (WCFA) Analysis

To analyse the biomass of soil microbial community, each soil sample was carefully mixed to obtain a homogeneous mixture before subsampling of 1 g (d.w.) soil. The subsample was analysed for signature fatty acids by WCFA. The extraction of WCFAs was performed with a four-step procedure according to Sasser [40]. To enable the extracted fatty acid methyl esters to be quantified, a known amount of an internal standard, nonadecanoate fatty acid methyl ester 19:0, was added to each sample. Gas chromatography analyses and the identification of the fatty acids were performed according to the software library TSBA41 [42].
The peaks used as markers for gram-positive bacteria were iso 11:0, anteiso 11:0, iso 12:0, anteiso 12:0, iso 11:0 3OH, iso 13:0, anteiso 13:0, iso 14:0, iso 15:0, anteiso 15:0, iso 16:0, anteiso 16:0, iso 17:0, anteiso 17:0, iso 18:0, iso 19:0, and anteiso 19:0 [43,44,45]. Cyclopropyl (17:0 cyclo, 19:0 cyclo ω8c), hydroxylic fatty acids (10:0 3OH, 12:0 2OH, 16:0 2OH, 16:0 3OH) and the monounsaturated fatty acids 16:1ω7c, anteiso 17:1ω9c, 18:1ω7c were used as biomarkers for gram-negative bacteria [37,44,45,46]. The methylated fatty acids 10 Me 16:0, 10 Me 17:0, TSBA 10 Me 18:0, and 10 Me 19:0 were used as biomarkers for actinobacteria [37,45]. The biomarker for arbuscular mycorrhizal fungi (AMF) was 16:1ω5c [47,48,49,50]. For ectomycorrhizal and nonmycorrhizal soil fungi, the markers were 18:3ω6c (6,9,12), 18:1ω9c and 18:2ω6,9c [43,45,47,51,52]. The fatty acid 20:4ω6,9,12,15c was used as a biomarker for protozoans [43,52].

2.4. Statistics

Statistica 9.0 (StatSoft Inc.) was used for statistical data processing. The concentrations of the individual WCFAs (percentages) were transformed according to the Bliss formula [53]: x = arc sin√(n%/100) × 180/π, (n%—individual WCFA percent value). The scores of the first two components from a principal component analysis (PCA) were used to compare the differences between the microbial communities of the poplar genotypes at the three study sites. Three- and two-way analyses of variance (ANOVA) were used to examine the levels of significance (p < 0.05) of the effects of site, genotype, soil depth and their interactions. The effects of genotype and soil depth on the community of microorganisms in the soil were analysed for all three sites together (overall data) as well as for each site separately. There was no plot effect for each clone in each site (data not shown). Tukey’s test was used to determine the significant differences among variables. The size effects (ω2) of the factors (site, plant genotype, soil depth and their interactions) impacting the soil microbial community were calculated for all three sites together (overall data) and for each site separately (the size effect of plant genotype, soil depth and their interactions).
Difference assessment in the contribution of individual groups of microorganisms in microbiome communities was carried out using analysis of similarity (ANOSIM) based on the Bray—Curtis similarity index. The similarity of percentages (SIMPER) was carried out to investigate which microbial groups were responsible for differences in community composition of microorganisms associated with different sites, poplar genotypes and soil depths. Data were square root-transformed prior to the analyses. ANOSIM and SIMPER analyses were carried out using PAST3 [54].
Redundancy analysis (RDA) was carried out using CANOCO (Version 4.5, Microcomputer Power, Ithaca, NY, USA). Scaling was focused on interspecies correlations. The fatty acid data were centered and standardized. The significance of the fatty acid–environment relationship was assessed using the Monte Carlo permutation test (499 permutations under the reduced model). Nonparametric Spearman correlations were used to find the associations between the biomass of soil microorganisms and the chemical composition of the soil.

3. Results

In total, 81 fatty acids (WCFAs) were identified in soil samples collected under four poplar clones at three study sites. Using specific fatty acids markers we estimated the biomass of gram-positive bacteria, gram-negative bacteria, actinobacteria, arbuscular fungi (AMF) and protozoa. Ectomycorrhizal (ECM), saprotrophic and pathogenic fungi due to the lack of specific fatty acids were treated as one separate soil fungal community (SF).

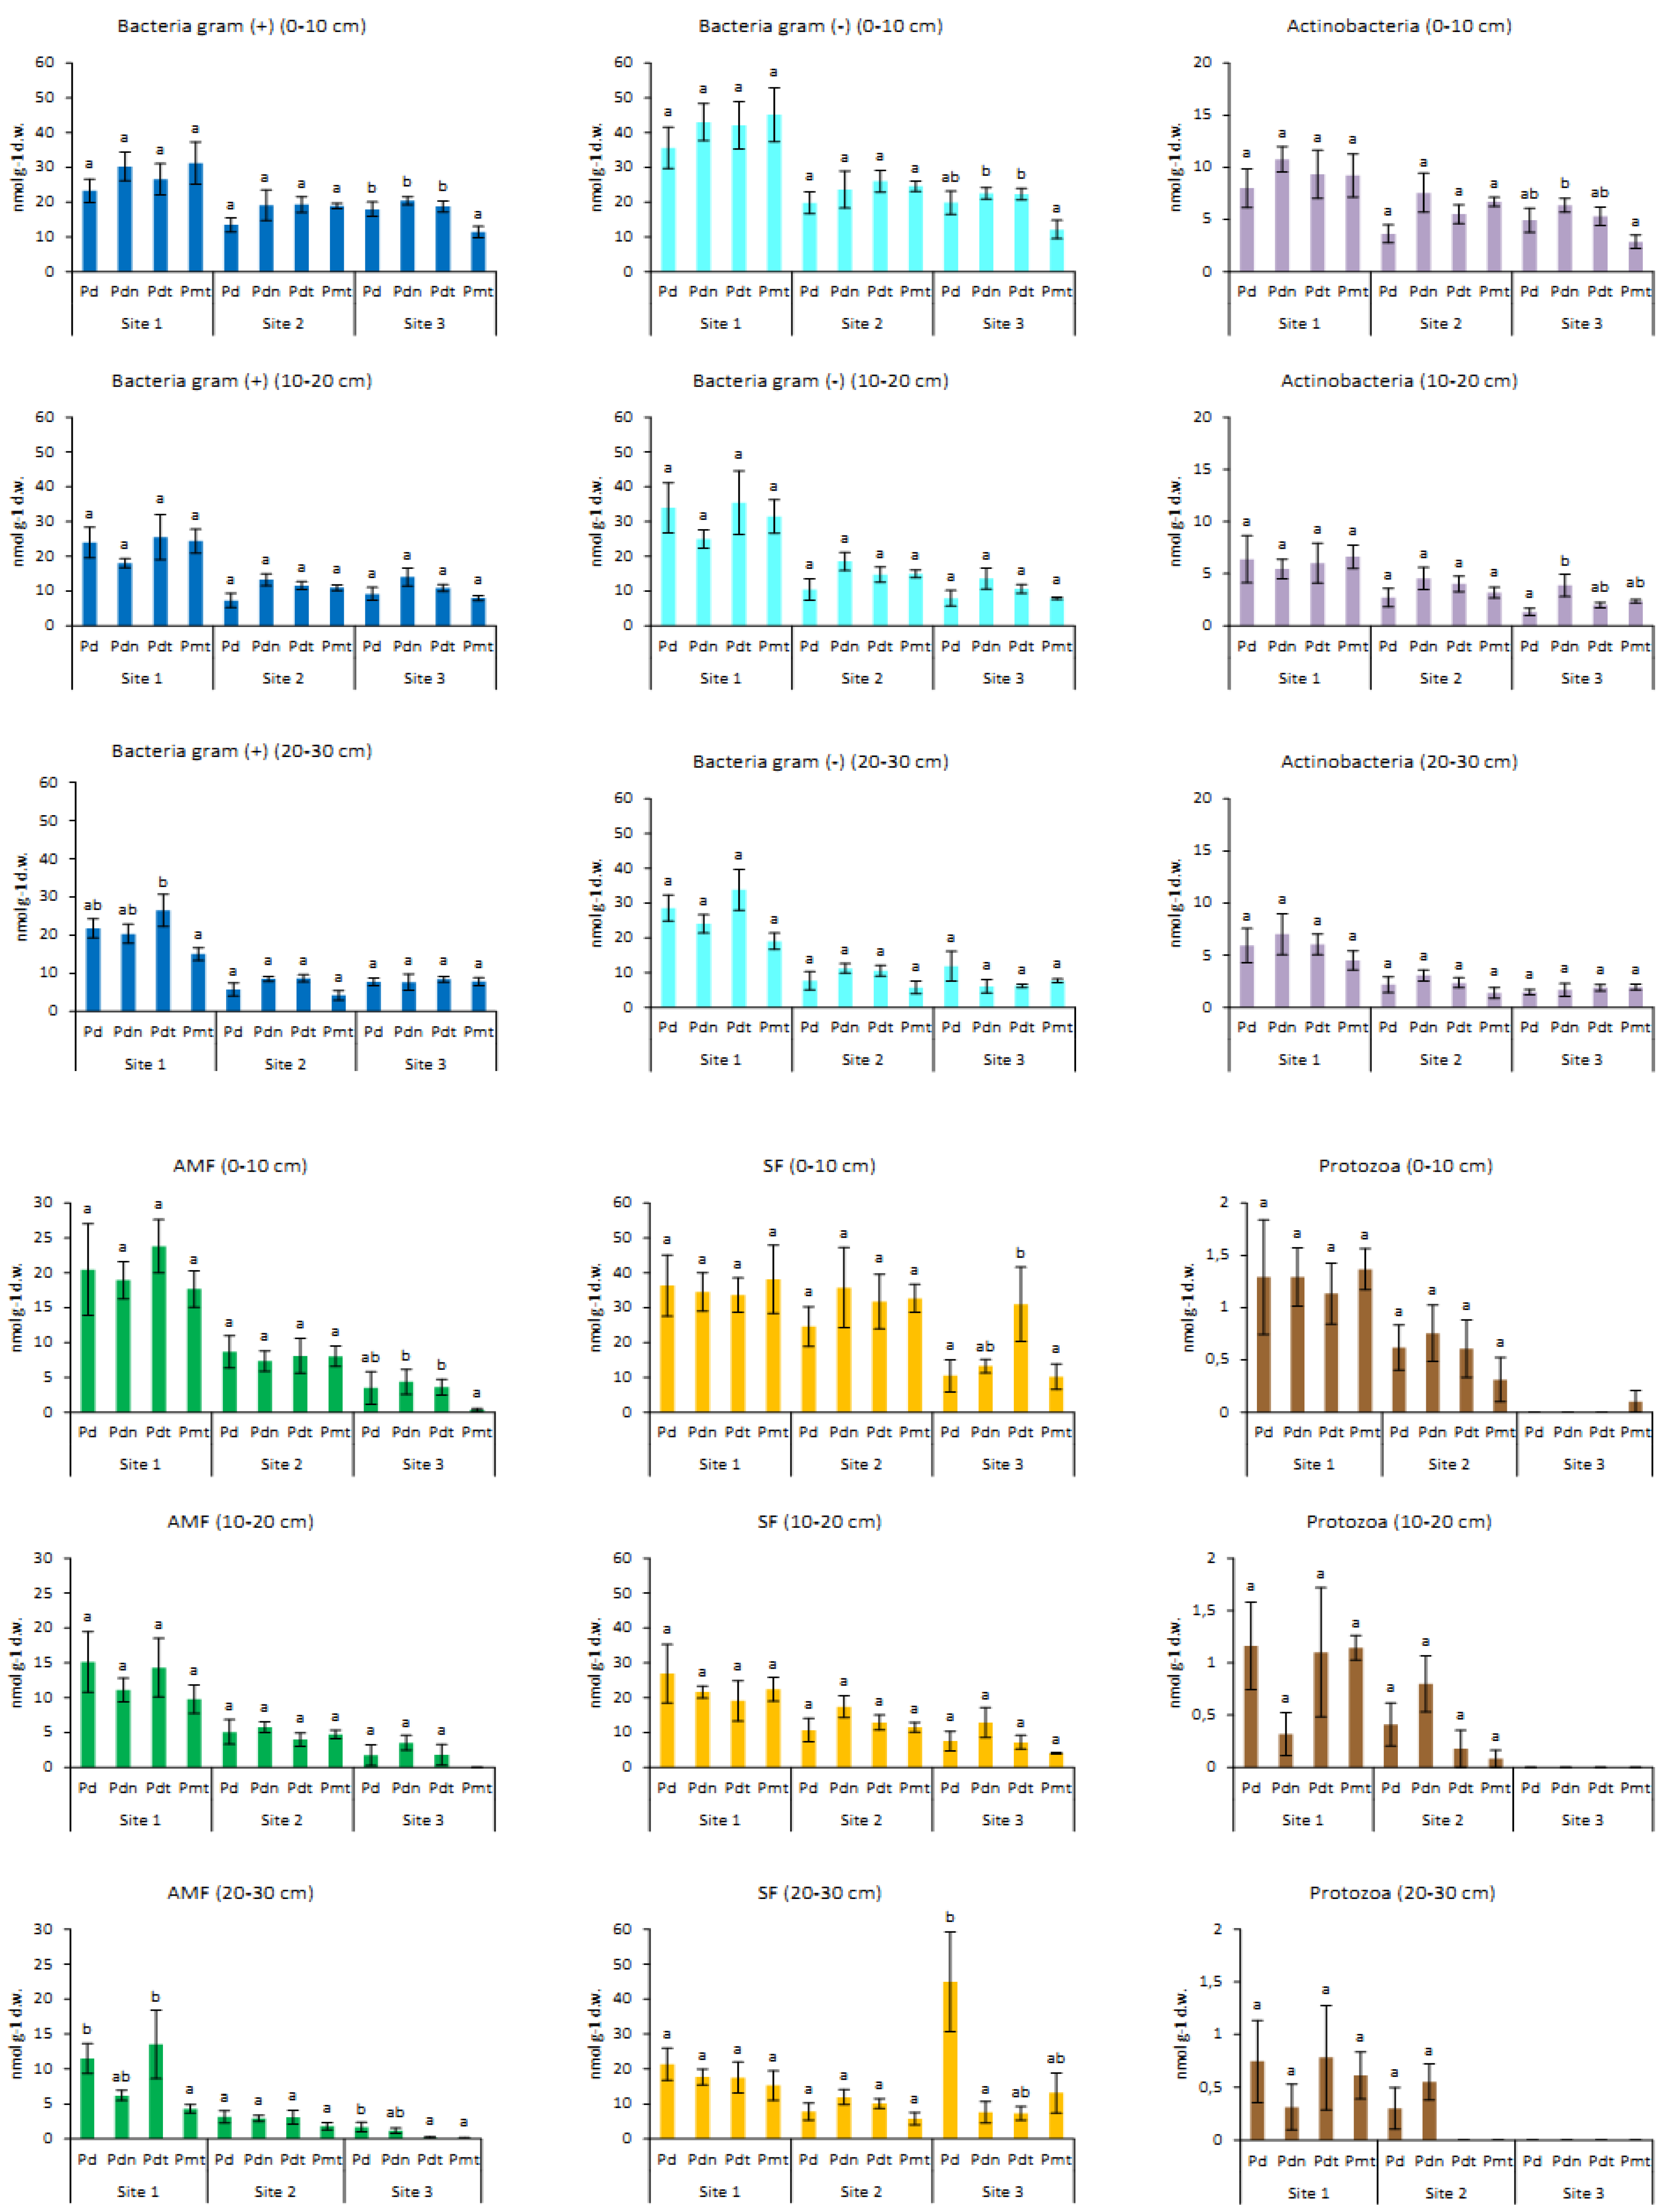
3.1. The Impact of Site, Poplar Genotype and Soil Depth on Biomass of Microorganisms

The overall ANOVA revealed significant differences between study site for the biomass of gram-positive and gram-negative bacteria, as well as for the AMF, protozoans and the group of SF (Table 2). Site was also the strongest factor determining the biomass of microorganisms (effect size—ω2). An exception was the biomass of actinobacteria, which showed significant differences by host genotype and soil depth. In comparison with Site 2 and Site 3, Site 1 was characterized by the highest biomass of all groups of microorganisms (Figure 3), whereas polluted Site 3 had the lowest values of the biomass of AMF and protozoa in the studied soil strata (0–30 cm). An ANOVA across data from all three sites also revealed significant differences between poplar genotypes for the biomass of most of the microbial groups, however SF and protozoa were exceptions (Table 2). Soil depth significantly affected the biomass of most groups of microorganisms. Only the biomass of the gram-positive bacteria did not differ between soil layers. However, there were significant interactions for soil depth with site and with poplar genotype (Table 2).
The assessment of individual sites revealed a more complex picture (Table 2). At Site 1, significant differences between poplar genotypes were noticed for AMF and SF. At Site 2, poplar genotype differentiated the biomass of gram-positive bacteria and protozoa. The highest number of significant differences in the biomass of microorganisms between poplar genotypes by the interactions of genotype and soil depth were found at polluted Site 3 for the gram-positive and gram-negative bacteria and the AMF and SF (Table 2, Figure 3). In most cases, their biomass was higher in soil collected from under P. deltoides × P. nigra and P. deltoides × P. trichocarpa than from under P. deltoides and P. maximowiczii × P. trichocarpa. At individual sites, an ANOVA revealed a significant impact of soil depth on the biomass of most microbial groups. Only protozoa did not significantly differ between soil layers at any of the three sites. A lack of significant differences was also noted for gram-positive bacteria at Site 2 and for AMF at Site 3. In contrast with the results from Site 1 and Site 2, an ANOVA revealed numerous significant interactions between genotype and soil depth (excluding AMF and protozoa) at Site 3 (Table 2). At all sites, the biomass of most microbial groups decreased with increasing soil depth. The highest biomass at the deepest soil layer (20–30 cm) was only found for SF associated with the genotypes P. deltoides and P. maximowiczii × P. trichocarpa at polluted Site 3.

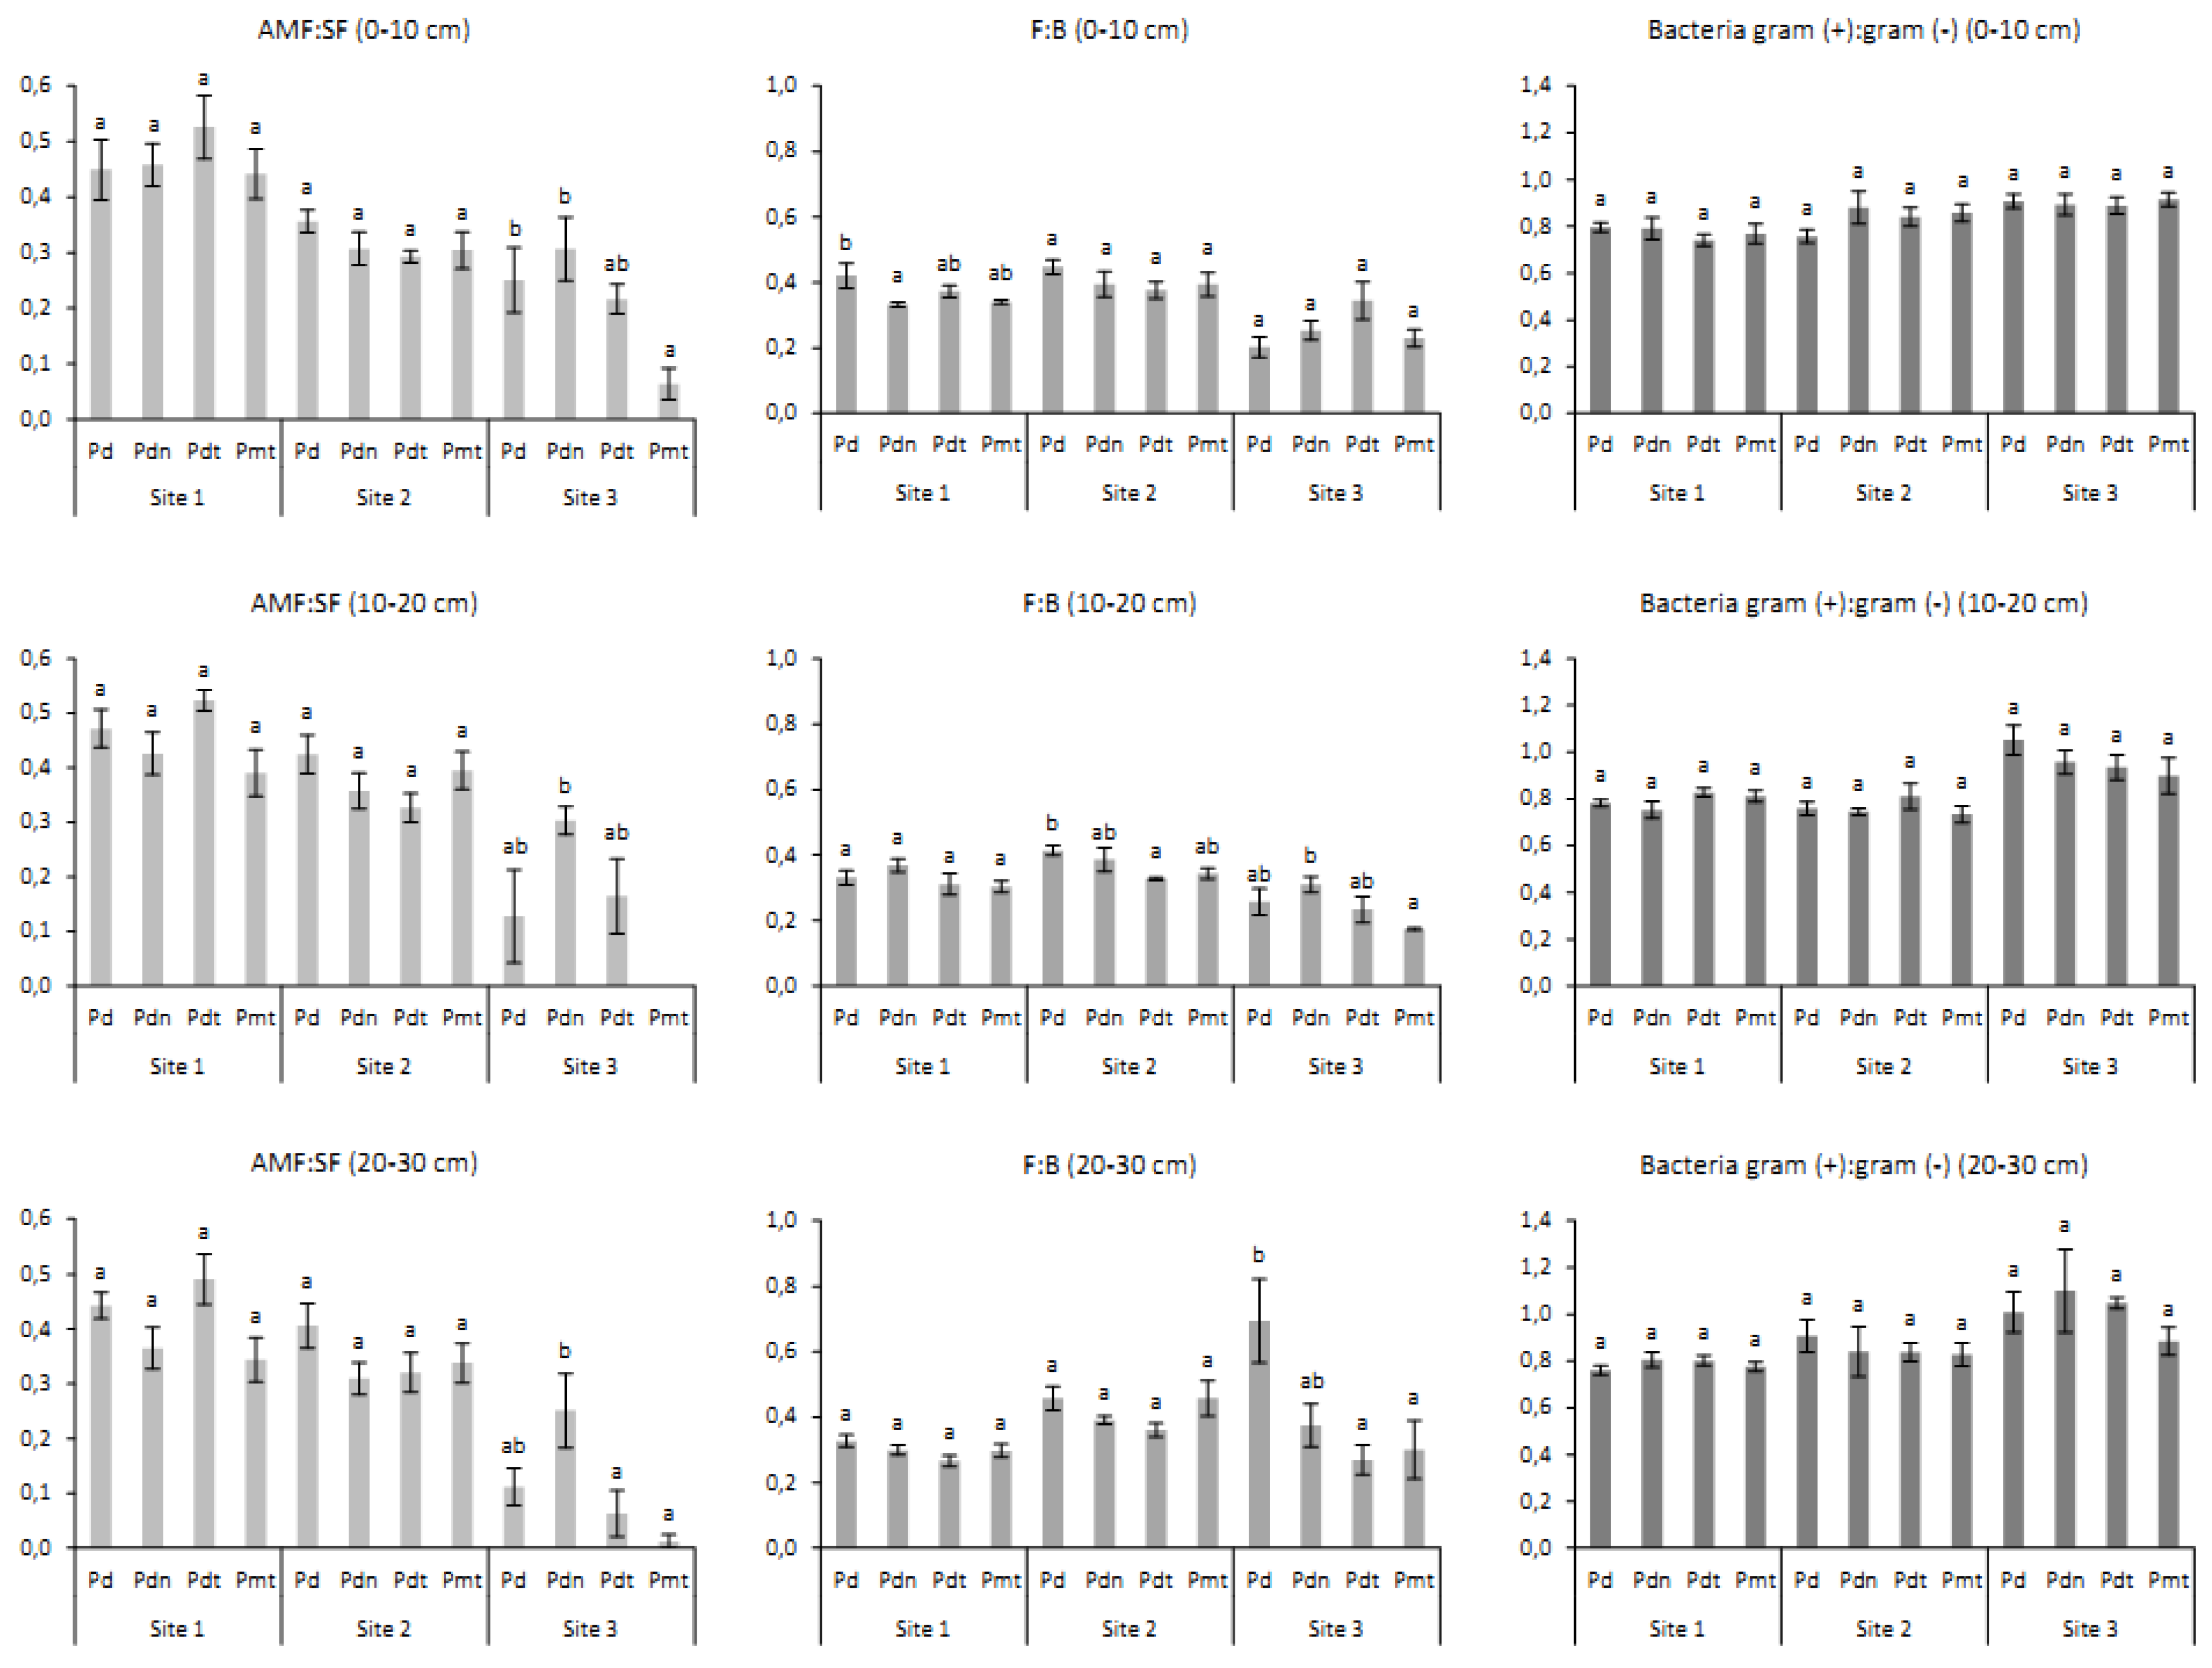
3.2. Biomass and Contribution of Microorganisms in Microbial Community

Gram-negative bacteria were the dominant group of microorganisms at all study sites. Their biomass in the soil strata from 0–30 cm ranged from 5.7 nmol g–1 d.w. (Site 2—P. maximowiczii × P. trichocarpa, 20–30 cm) to 45.2 nmol g–1 d.w. (Site 1—P. maximowiczii × P. trichocarpa, 0–10 cm). The biomass of gram-positive bacteria ranged from 4.2 nmol g–1 d.w. (Site 2— P. maximowiczii × P. trichocarpa, 20–30 cm) to 30.3 nmol g–1 d.w. (Site 1—P. deltoides × P. nigra, 0-10 cm). The ratio of the biomass of gram-positive bacteria to gram-negative bacteria was significantly higher at Site 3 (0.96) than at Site 1 and Site 2 (0.78 and 0.82, respectively). Plant genotype and soil depth did not have a significant impact on the ratio. At the individual sites, soil depth was the only factor influencing the ratio between both groups of bacteria (Table 3, Figure 4).
The biomass of actinobacteria in the rhizosphere of poplars did not exceed 10.79 nmol g–1 d.w. (Site 1—P. deltoides × P. nigra, 0–10 cm), and its minimum concentration was 1.37 nmol g–1 d.w. (Site 3—P. deltoides, 10–20 cm).
The average biomass of AM fungi in the soil ranged from 0 nmol g–1 d.w. (Site 3—P. maximowiczii × P. trichocarpa, 10–20 cm) to 23.8 nmol g–1 d.w. (Site 1—P. deltoides × P. trichocarpa, 0–10 cm). The biomass of SF ranged from 4.06 nmol g–1 d.w. (Site 3—P. maximowiczii × P. trichocarpa, 10–20 cm) to 45,0 nmol g–1 d.w. (Site 3—P. deltoides, 20–30 cm) and was close to the values found for gram-positive bacteria.
The biomass ratio values between both fungal groups (AMF and SF) were significantly different at all three sites. The highest mean AMF:SF biomass ratio was observed at Site 1 (0.4), intermediate values were observed at Site 2 (0.3), and the lowest values were observed at Site 3 (0.2). The site with the largest percentage impacted the AMF:SF biomass ratio. (Table 3, Figure 4). In an overall comparison, significant differences in the AMF:SF biomass ratio were also found between poplar genotypes and soil depths and from the interactions of site and genotype and site and depth. At the individual sites, tree genotype played the most important role in the differences in the AMF:SF biomass ratio; however, at each site, different poplar genotypes had the highest values. The strongest factor effect was observed at polluted Site 3. At Site 2 and Site 3, significant differences in the AMF:SF biomass ratio were also found in the soil profile; however, the impact of the soil profile on the ratio between both fungal groups was much lower in comparison to the impact of plant genotype (Table 3, Figure 4).
The ratio of fungal (both AMF and SF) to bacterial (gram-positive, gram-negative and actinobacteria) biomass (F:B) was significantly different in the soils at the three sites, in the soils of the four poplar genotypes and in the varying soil depths, and there were interactions between these factors (Table 3, Figure 4). Significant differences by genotype were also revealed at each of the individual sites and for soil depth at Site 1 and Site 3. At Site 3, a significant effect was also observed for the interaction between genotype and depth (Table 3). In the overall comparison of sites, the interactions between site and soil depth and all analysed factors together had the highest effect size for the F:B ratio and the lowest effect size for soil depth (Table 3). At the individual sites, genotype was the only factor impacting the F:B ratio of fungal to bacterial biomass (Table 3, Figure 4). Overall analysis showed significant differences in the F:B biomass ratio between soil layers (0–10 cm, 10–20 cm, 20–30 cm) (Table 3). At Site 1, the F:B biomass ratio decreased with soil depth, whereas the F:B biomass ratio at Site 3 was higher in the deepest soil layer (20–30 cm) than in the upper layers. The F:B biomass ratio at Site 2 did not show any significant differences between soil depths (Figure 4).
The highest protozoan biomass (1.37 nmol g–1 d.w.) was noted at Site 1 for P. maximowiczii × P. trichocarpa (0-10 cm), whereas, at polluted Site 3, the presence of the specific feature for this group of organisms, arachidic fatty acid 20:4ω6,9,12,15c, was detected only in the upper soil layer 0–10 cm in the vicinity of P. maximowiczii × P. trichocarpa roots (0.1 nmol g–1 d.w.) (Figure 3).

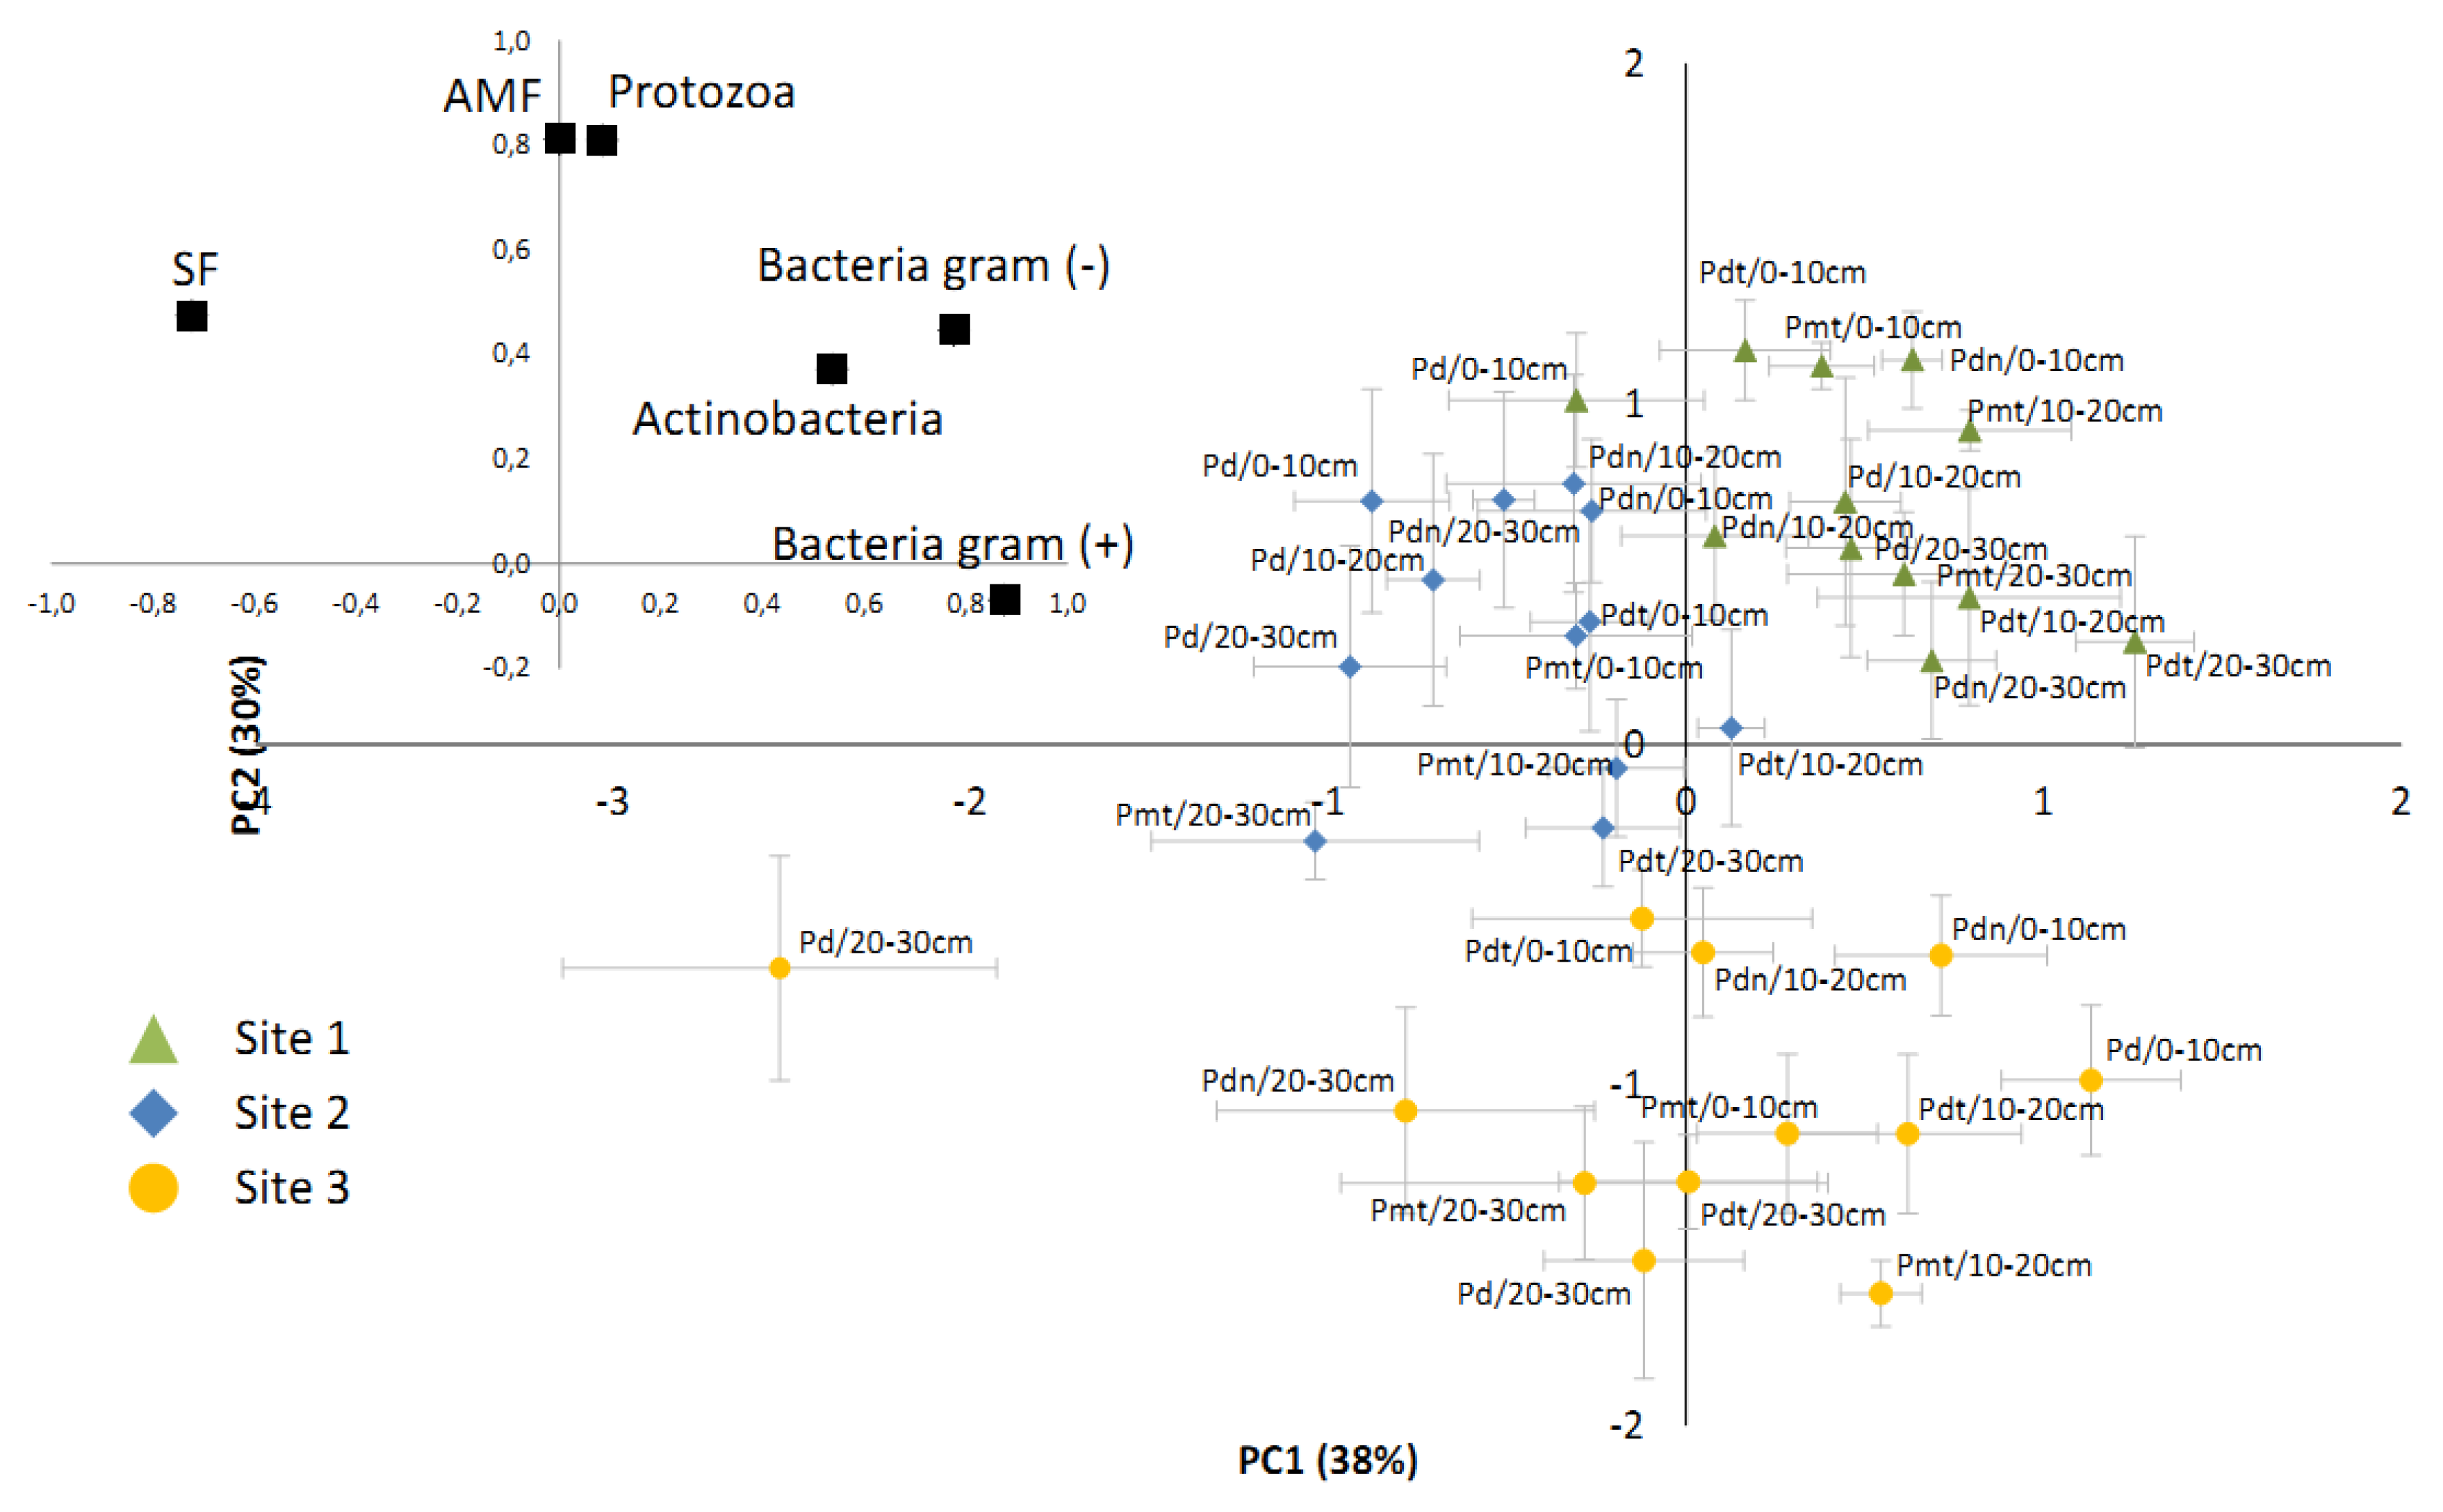
3.3. The Comparison of Microbial Communities

The PCA of the biomass of the microorganisms (gram-positive and gram-negative bacteria, actinobacteria, AMF, SF and protozoa) associated with four poplar genotypes indicated differences between the three study sites (Figure 5). The first principal component (PC1) (accounting for 38% of the total variation) separated Site 1 from Site 2. The main loadings of PC1 were the biomass of gram-positive and gram-negative bacteria and the group of SF (Figure 5). The axis of the second principal component (PC2) (accounting for 30% of the variation) differentiated polluted Site 3 from unpolluted Sites 1 and 2. The main loading of PC2, which separated the sites, was the biomass of AMF and protozoa (Figure 5).
ANOSIM analysis of the microbial community revealed significant differences between study sites (R = 0.3; p = 0.0001), poplar genotypes (R = 0.04; p = 0.0004) and soil depths (R = 0.03; p = 0.002). SIMPER analyses pointed AM fungi as the principal group associated with the dissimilarity of unpolluted sites 1 and 2, and polluted Site 3 (32.8% and 32.6%, respectively). Protozoa (30.7%) and SF (18.9%) contributed most to the dissimilarity of Site 1 and Site 2. At individual sites, ANOSIM analyses revealed significant differences between microbial communities associated to poplar genotypes. However the pattern of this differences between four poplar genotypes had individual character at each site. At Site 1 SIMPER analysis showed protozoa (30%–37.1%) and actinobacteria (15.8%–21.1%), as the groups with the most differentiating poplar genotypes. The contribution of gram-positive and gram-negative bacteria played here the smallest role. Similarly at Site 2 protozoa (23.2%–36.7%) and actinobacteria (13%–21.6%) contributed most to the dissimilarity between poplar genotypes microbial communities and the least to bacteria (gram-positive or gram-negative). In contrast, at Site 3, fungi (AM: 31%–34.8% and SF: 18.9%–26.3%) determined the diversity of tree genotypes. However, the contribution of protozoa and bacteria (gram-positive and gram-negative) in poplar differentiation was the lowest. At sites 1 and 3, ANOSIM analysis revealed significant differences between soil depths and at Site 2 such differences were not found. At sites 1 and 2 SIMPER analyses pointed to protozoa (Site 1: 30.2%–34.1%, Site 2: 28.4%–32.2%) and actinobacteria (Site 1: 15.6%–18.3%, Site 2: 16.7%–19.7%) as groups that have the greatest impact on the diversity of microbial communities in the soil profile. At Site 3, as it was observed in the case of poplar genotypes, AM (29%–41%) and SF (17.5%–27.3%) contributed most to the dissimilarity in soil depths.
The analysis of the contribution of individual groups of microorganisms to the soil microbiome showed that there was a relatively stable community at each site and soil depth and for most of the poplar genotypes. Regarding these three factors (site, soil depth and poplar genotype), the variations in the contributions of the microbial organisms did not exceed 10%. The only exception to this pattern was a higher contribution of soil fungi to the microbiome under P. deltoides at Site 3 (13%–34.8%).

3.4. The Impact of Soil Factors of Microbial Community

The outcome of the RDA is provided as a biplot that contains the data on soil conditions (soil pH, concentrations of metal ions and nutrients in the soil and soil humidity and temperature) and the biomasses of fatty acids identified in the three soil strata (0–10 cm, 10–20 cm, and 20–30 cm) (Figure 6). The first two axes of the RDA, with eigenvalues of 0.187 and 0.086, respectively, explained 27.3% of the fatty acid variance and 82.5% of the fatty acids–environment relationship (the first axis contributed 56.5%; the second, 26%).
The biomass of most of the identified fatty acids appeared to be negatively correlated with heavy metal concentrations and the C/N ratio in the soil (Figure 6; Table 4). Only a few fatty acids (such as 16:0 N alcohol) were positively correlated with the concentrations of pollutants in the soil and were related to the influence of higher temperatures and soil humidity at polluted Site 3 than at the other two sites, which possibly caused higher concentrations of some fatty acids (unknown 18.846; fungal 18:3ω6c). Soil humidity and the P concentration in the soil (the highest at Site 3) were linked with a higher biomass of some gram-negative bacteria (10:0 3OH; 11:0 3OH; 12:0 3OH), gram-positive bacteria (anteiso 13:0), some fatty acids specific to actinobacteria (10 methyl 19:0) and fatty acids not attributed to any group of organisms (unknown 11.788; 17:1ω7c; 18:1 2OH). Soil pH and the N-NO3 concentration were positively correlated with the biomass of fatty acid 16:1ω5c, which is specific to AMF, protozoan 20:4ω6,9,12, gram-negative bacterial 16:1ω7c, and cyclo 19:0ω8c and some fatty acid markers for actinobacteria (e.g., 10 methyl 17:0; 10 methyl 18:0) and gram-positive bacteria (e.g., iso 12:0; anteiso 16:0) (Figure 6).
The first (horizontal) axis clearly differentiated the polluted and unpolluted sites (Figure 6). The main soil factors that determined this differentiation were the concentrations of heavy metals, K and soil temperature and humidity, which showed the highest values at Site 3. The second (vertical) axis separated unpolluted Site 1 and Site 2 but also showed influence of the individual soil depths at all study sites, with Site 3 being the most heterogeneous. The main factors influencing the separation of unpolluted Site 1 and Site 2 as well as the separation of soil layers at each of the sites were the C/N ratio and the concentrations of N-NH3 and Ca in the soil. The forward selection procedure of the environmental variables showed that, in the poplar rhizosphere, the soil temperature (18%), K (8%), N-NO3 (3%), the C/N ratio (2%), pH (KCl) (1%) and the Zn concentration (<0.00%) significantly contributed to the variance in the fatty acid biomass and composition.
Spearman rank correlation analysis confirmed a positive correlation between soil pH and the biomass of all studied groups of microorganisms (Table 4). A positive relationship was also observed between the biomass of microorganisms and the content of N-NO3 in the soil. In the case of N-NH3, the correlations were positive for gram-positive and gram-negative bacteria, actinobacteria, soil fungi and protozoa. Inverse tendencies were observed for the Ca and N contents in the soil. Higher concentrations of Ca and N were linked with a higher biomass of bacteria and actinobacteria and a lower biomass of soil fungi and protozoa. The negative effect of heavy metals was found for near all groups of organisms (excluding effect of Cu and Pb concentrations in the soil on gram-positive bacteria). As polluted Site 3 had elevated levels of heavy metals in the soil and also had higher soil moisture and temperature, as well as higher K concentrations, in the soil, for the majority of the groups of microorganisms, there were negative correlations with these characteristics (Table 4).

4. Discussion

4.1. Host-Genotype Effect

The hypothesis that the biomass and composition of the soil microbial community will differ depending on poplar genotype was confirmed, as tree genotype significantly influenced the biomass of most of the studied groups of microbial organisms present in the rhizosphere of poplars. The effect size (ω2) of the tree genotype was different for the individual sites and soil microorganism groups. The most tree-genotype-dependent group of soil organisms were arbuscular mycorrhizal fungi (AMF). At the polluted site, the effect size of poplar genotype on the biomass of AMF was more pronounced than that at the other sites. This phenomenon may be the result of the impact of stress conditions (e.g., heavy metal pollution), which may differentially influence individual genotypes according to their physiological characteristics, enhancing the differences between poplar genotypes (e.g., [17,55]). The ratio of fungal to bacterial biomass (F:B ratio) appeared to be a good indicator of the poplar-genotype effect both in an overall comparison of genotypes and in the relationships among genotypes at individual sites. Previously, the F:B ratio was shown as a suitable indicator of changes in the microbial community depending on the soil moisture gradient, and changes in soil management or soil pollution [56,57]. We showed that F:B ratio may be also differentiated by poplar genotype which suggests that the biomass of soil microorganisms is mainly determined by site and soil depth, but fungi and bacteria that settle near poplar roots are significantly impacted by tree genotype. At each site and at most depths, P. deltoides showed higher values of the F:B ratio than did the other poplar genotypes. This may be related to the ability of plants to structure the biomass and microbial community in soil [12]. Generally, fungi are known as a group of organisms that more efficiently use organic substrates in biomass production than bacteria [58,59]. The higher values of F:B ratio found in P. deltoides, (especially in contaminated Site 3), may suggest that, in comparison to the other studied poplar genotypes, P. deltoides has greater ability to form the symbiotic interactions with fungi. This trait is confirmed by the greater number of ectomycorrhizal species found on roots of this poplar, especially at Site 3 [24]. The results of the mutual interaction of tree and fungi may be the significantly higher growth rate of the aboveground part of P. deltoides trees (in comparison to three other poplar genotypes) [24] and the observed higher contribution of fungi in the microbial community, as consumers of substrates delivered by a tree. The relationship between fungal colonization and aboveground tree biomass was suggested by Lamit et al. [60]. The ratio of arbuscular mycorrhizal fungi and soil fungi (consisting of ectomycorrhizal fungi, saprotrophs, pathogens) biomass (AMF:SF ratio) was found to be significantly impacted by tree genotype. However, both groups of fungi (AM and SF) were influenced by genotype and local site conditions to varying degrees. The role of both groups of fungi (AMF vs. SF) in soil nutrient cycling, including different soil depths and the character of their interactions with tree roots, are not equivalent [61]. The AMF:SF biomass ratio showed a more local variation between genotypes, and it was difficult to determine a consistent trend for all genotypes at all study sites. The relationship between AMF and SF biomass in soils correspond quite well to results of poplar root colonization by AMF and ectomycorrhizal fungi [23], which showed a positive correlation between both fungal groups (AMF and SF) at Site 3 and negative correlations at Site 1 and Site 2, mainly determined by the heavy metal pollution of Site 3.

4.2. Soil Depth Effect

A decrease in the biomass of microorganisms according to soil depth is a common feature observed in different soil types and for different plant communities (forests, grasslands, agricultural fields, etc.) [37,62]. However, we revealed that the contribution of individual groups of microorganisms to the soil profile had diverse trends, which were most likely related to other interacting factors, such as local site or plant-genotype origin. For example, the contribution of gram-positive bacteria in most cases (excluding P. deltoides at Site 3) increased with soil depth at the study sites. The high contribution of gram-positive bacteria in the deepest soil layers might be due to their lower sensitivity to the declining availability of carbon and oxygen in the soil profile [63,64]. In contrast, a higher content of carbon in the upper soil layers seems to be more favourable for the growth of fungi and gram-negative bacteria [37]. The increase in gram-positive bacteria in deeper soil layers was also found in Scandinavian Scots pine and Norway spruce forests by Fritze et al. [65], in agricultural areas [66] and alluvial soils in California [37]. In our studies, at polluted Site 3, P. deltoides showed an opposite trend, i.e., a decrease in gram-positive bacteria according to soil depth. Similarly, in the case of other poplar genotypes at the deepest soil layer at Site 3, the decrease in bacterial contributions and the increase in fungal contributions in the microbial community was observed. This trend may be related to significantly lower concentrations of heavy metals in the soil layer 20–30 cm at Site 3 and the varying sensitivity of fungi and bacteria to heavy metal pollution [67]. In the overall comparisons across sites, the biomass and contribution of fungi (AM and SF) in the microbial community decreased with soil depth or remained relatively stable throughout the studied soil layers. For all poplar genotypes at Site 2, and P. deltoides and P. deltoides × P. nigra at Site 3, the contribution of AMF tended to increase at deeper soil layers. This increase may be related to our previous observations that AMF and ectomycorrhizal fungi are involved in the colonization of poplar roots at different soil depths and that AMF prefer deeper soil layers [23]. The high contribution of the SF group to the deepest soil layer (20–30 cm) at Site 3 seems to be related to the lowest heavy metal concentrations noted in that layer (Table 1). The contributions of protozoa to the microbial community are higher in the upper soil layer and tended to decrease with increasing soil depth. The observed predominance of protozoa in the upper soil layers was also noted by other authors [37,68] and may be linked to the concentration of available organic C in soil [68] and with microbial biomass in general, that influences the abundance of higher trophic level protists [69]. In the case of actinobacteria, our results also showed a decrease with the soil depth, and differ from the findings of Fritze et al. [65] and Fierer et al. [37], who noted that there was a higher actinobacteria abundance in the deeper soil layers than in the upper soil layers. In our study, this was presumably the result of a decrease in available nitrogen compounds (N-NO3 and N-NH4) at deeper soil layers rather than soil pH, as suggested by Fritze et al. [65].

4.3. Site Effect

Study sites were the main factor influencing the biomass and composition of soil microorganisms (excluding actinobacteria). The most distinctive difference in soil microbial biomass was observed between Site 3, located near the copper smelter and unpolluted Site 1 (near a coniferous forest). In the case of bacterial biomass, Site 2 showed values more similar to Site 3 than to Site 1, while, for the fungal biomass (especially for the SF), the results from Site 2 were closer to those from Site 1 than Site 3. The lower number of detected fatty acids and reduction in the biomass of microorganisms in the soil of polluted Site 3 correspond with a decline in poplar fine root production and a lower mycorrhizal colonization, as well as with the species richness and diversity of the ectomycorrhizal community at Site 3 [23,24]. The presence of the forest in the vicinity of Site 1, as a source of fungal propaguls, could have a beneficial effect on the diversity of fatty acids and biomass of soil microorganisms found at this site [57]. AMF and protozoa were the main loadings of the PCA, separating the unpolluted and polluted study sites (Figure 3). The negative impact of heavy metal pollutants on the biomass of AMF and other groups of fungi has been previously reported by several authors, e.g., [47,67,70,71]. In our studies, the negative effect of heavy metal pollution was more pronounced for the biomass of the fungal part of soil microbiome (AM and SF) than for bacterial biomass. This result is in line with the observations obtained near copper or zinc smelters, which showed a decrease in phospholipid fatty acids (PLFAs) as indicators of the fungal biomass [67]. A lower tolerance of fungi to heavy metal pollution than bacteria (Cu, Zn) was also confirmed in laboratory experiments [72].
Gram-negative bacteria were a predominant part of the microbiome irrespective of the site, confirming their dominance among the microorganisms in the rhizosphere [67]. In our study, gram-negative bacteria were abundantly represented both at the polluted and unpolluted sites, which indicate their tolerance to environmental pollution. Gram-negative bacteria are often pointed to as a main group of soil microorganisms in heavy metal-contaminated soils [70,73], while gram-positive bacteria are thought to be more sensitive than gram-negative bacteria to heavy metal pollution [70,74]. However, examples of the opposite results, underlining the high tolerance of gram-positive bacteria to heavy metal pollution, can be also found [75]. This is also the case of our study, where the contribution of gram-positive bacteria at polluted Site 3 was higher than that at control Site 1 and Site 2. Similarly, an increased abundance of gram-positive bacteria and a lower abundance of gram-negative bacteria in metal-contaminated soils were suggested by Pennanen et al. [67]. However, one must also be cognizant when making such broad comparisons between gram-negative and gram-positive bacteria of the dangers of overgeneralization across such diverse phylogenetic and functional groups of organisms.
RDA revealed a significant impact of soil pH and soil temperature on the fatty acid composition in the investigated soils. The soil at unpolluted Site 1 and Site 2 was characterized by a significantly higher pH and higher microbial biomass than the soil at polluted Site 3 [23]. This result agrees with the previous findings that a higher soil pH is connected with an increase in the availability of organic matter and an increase in the microbial biomass of gram-negative bacteria [47,76] and bacterial diversity [4]. Additionally the average daily temperature of the soil was higher at polluted Site 3 than at reference Site 1 and Site 2 [24] and most probably positively impacted the contribution of gram-positive bacteria at Site 3, as was found by Buyer et al. [77].
The contribution of actinobacteria to the microbial community was higher at polluted Site 3 than at Site 1 and Site 2 and showed contrasting values for bacteria and fungi. This result might suggest that actinobacteria have some tolerance to heavy metal pollution but remains in contrast with the results from studies that show that actinobacteria are a group of organisms that are more sensitive to pollution than are fungi and bacteria [78]. A possible explanation for this discrepancy might be the existence of interspecific variations of actinobacteria due to elevated concentrations of heavy metals in the soil [70,79]. Moreover, Frostegård et al. [70] observed gradual changes in actinobacteria over time (characterized by PLFA) that were related to increasing heavy metal pollution, suggesting that actinobacteria have a cumulative tolerance to stressors. The site was the factor that significantly affected the protozoan biomass. Metal pollution drastically influenced this group of soil organisms and, in most cases, decreased biomass to zero. However, RDA and correlation analyses also revealed positive relationships between the protozoan biomass and soil pH, as well as the concentration of N-NO3 in the soil. Such results indicate that protozoa have a large potential to be used as a biomarker of an environmental variable. This observation is supported by the results of Gomiero et al. [80] and Li et al. [81], who suggested protozoa as an indicator of pollution in water sediments and quality of water.
The PCA analysis pointed to differences in the biomass of gram-positive bacteria between the two unpolluted sites. Differences between the unpolluted sites were also found for gram-negative bacteria regarding their distribution in the soil profile and the F:B ratio. Although the variation in the F:B ratio between study sites was rather low (0.4–0.3), the value observed at Site 2 was significantly higher than those at Site 1 and Site 3 (Figure 2). Bailey et al. [56] showed that the F:B ratio was 1.1 for pine forests, 13.5 for prairies and 0.5–0.6 for traditionally arable soils. The similarity of our results from Site 1 and Site 2 to the F:B values characteristic of arable soils agrees well with the history of these study sites, which were established in a post-agricultural area over 20 years ago. The F:B ratio has also been shown to increase along with an increase in the C:N ratio in the soil [82], which is in line with our results from Site 2, which had the highest C:N ratios [23].

5. Conclusions

Our study revealed a significant impact of soil conditions, soil depth and poplar genotype, and their interactions on the biomass of microorganisms and their contribution to the soil community, with the site being the dominant factor. A significant impact of plant genotype on soil microorganism communities was particularly evident at Site 3, perhaps due to the increased environmental pressure caused by soil contamination. The poplar genotype determined the contribution of microorganisms, especially fungi and bacteria (F:B ratio) at individual sites and their distribution in the soil profile. Fungi seem to be more related to poplar genotype, while bacteria depended on the site to a greater extent. The biomass ratio of AMF and SF was found to be significantly impacted by tree genotype, contributing to the structure of the microbiome, despite the different characteristics of interactions with host trees. The soil microbiomes of the poplars showed relatively stable proportions of different groups of microorganisms at three studied sites and confirm the high adaptability of poplars to different soil conditions. Our results also revealed that the diversity of microbial communities according to soil depth is significantly affected by both soil conditions and the genotype of the trees. The next stage of research worth undertaking would be to conduct proteomic analyses to identify the internal mechanisms of individual genotypes that determine their ability to impact soil microbial communities.

Author Contributions

Conceptualization, L.K., M.R.; Methodology, L.K., S.R.; Formal Analysis, L.K.; Investigation, L.K.; Data Curation, L.K.; Writing – Original Draft Preparation, L.K.; Writing – Review and Editing, L.K., M.R., S.R.; Visualization, L.K.; Project Administration, L.K.; Funding Acquisition, L.K., S.R., M.R. All authors have read and agreed to the published version of the manuscript.

Funding

This research was supported by the National Science Centre, Poland (Grant No. N N309 115 137) and the Institute of Dendrology of Polish Academy of Sciences.

Conflicts of Interest

The author declares no conflict of interest.

References

  1. Gottel, N.R.; Castro, H.F.; Kerley, M.; Yang, Z.; Pelletier, D.A.; Podar, M.; Karpinets, T.; Uberbacher, E.; Tuskan, G.A.; Vilgalys, R.; et al. Distinct microbial communities within the endosphere and rhizosphere of Populus deltoides roots across contrasting soil types. Appl. Environ. Microbiol. 2011, 77, 5934–5944. [Google Scholar] [CrossRef] [PubMed] [Green Version]
  2. Shakya, M.; Gottel, N.; Castro, H.; Yang, Z.K.; Gunter, L.; Labbe, J.; Muchero, W.; Bonito, G.; Vilgalys, R.; Tuskan, G.; et al. A multifactor analysis of fungal and bacterial community structure in the root microbiome of mature Populus deltoides trees. PLoS ONE 2013, 8, e76382. [Google Scholar] [CrossRef] [PubMed]
  3. Beckers, B.; Op De Beeck, M.; Weyens, N.; Boerjan, W.; Vangronsveld, J. Structural variability and niche differentiation in the rhizosphere and endosphere bacterial microbiome of field-grown poplar trees. Microbiome 2017, 5, 25. [Google Scholar] [CrossRef] [PubMed] [Green Version]
  4. Chodak, M.; Gołębiewski, M.; Morawska-Płoskonka, J.; Kuduk, K.; Niklińska, M. Diversity of microorganisms from forest soils differently polluted with heavy metals. Appl. Soil Ecol. 2013, 64, 7–14. [Google Scholar] [CrossRef]
  5. Frey, B.; Stemmer, M.; Widmer, F.; Luster, J.; Sperisen, C. Microbial activity and community structure of a soil after heavy metal contamination in a model forest ecosystem. Soil Biol. Biochem. 2006, 38, 1745–1756. [Google Scholar] [CrossRef]
  6. Peacock, A.D.; Macnaughton, S.J.; Cantu, J.M.; Dale, V.H.; White, D.C. Soil microbial biomass and community composition along an anthropogenic disturbance gradient within a long-leaf pine habitat. Ecol. Indic. 2001, 1, 113–121. [Google Scholar] [CrossRef]
  7. Van der Heijden, M.G.A.; Bardgett, R.D.; van Straalen, N.M. The unseen majority: Soil microbes as drivers of plant diversity and productivity in terrestrial ecosystems. Ecol. Lett. 2008, 11, 296–310. [Google Scholar] [CrossRef]
  8. Stephen, J.R.; Chang, Y.J.; Gan, Y.D.; Peacock, A.D.; Pfiffner, S.M.; Barcelona, M.J.; White, D.C.; Macnaughton, S.J. Microbial characterization of a JP-4 fuel-contaminated site using a combined lipid biomarker/polymerase chain reaction-denaturing gradient gel electrophoresis (PCR-DGGE)-based approach. Environ. Microbiol. 1999, 1, 231–241. [Google Scholar] [CrossRef]
  9. Zogg, G.P.; Zak, D.R.; Ringelberg, D.B.; Macdonald, N.W.; Pregitzer, K.S.; White, D.C. Compositional and functional shifts in microbial communities due to soil warming. Soil Sci. Soc. Am. J. 1997, 61, 475–481. [Google Scholar] [CrossRef] [Green Version]
  10. Bulgarelli, D.; Garrido-Oter, R.; Münch, P.C.; Weiman, A.; Droge, J.; Pan, Y.; McHardy, A.C.; Schulze-Lefert, P. Structure and function of the bacterial root microbiota in wild and domesticated Barley. Cell Host Microbe 2015, 17, 392–403. [Google Scholar] [CrossRef] [Green Version]
  11. Lottmann, J.; O’Callaghan, M.; Baird, D.; Walter, C. Bacterial and fungal communities in the rhizosphere of field-grown genetically modified pine trees (Pinus radiata D.). Environ. Biosaf. Res. 2010, 9, 25–40. [Google Scholar] [CrossRef] [PubMed] [Green Version]
  12. Schweitzer, J.A.; Bailey, J.K.; Fischer, D.G.; LeRoy, C.J.; Lonsdorf, E.V.; Whitham, T.G.; Hart, S.C. Plant-soil-microorganism interactions: Heritable relationship between plant genotype and associated soil microorganisms. Ecology 2008, 89, 773–781. [Google Scholar] [CrossRef] [PubMed] [Green Version]
  13. Ellouze, W.; Hamelb, C.; Vujanovic, V.; Ganb, Y.; Bouzid, S.; St-Arnaud, M. Chickpea genotypes shape the soil microbiome and affect the establishment of the subsequent durum wheat crop in the semiarid North American Great Plains. Soil Biol. Biochem. 2013, 63, 129–141. [Google Scholar] [CrossRef]
  14. Ravnskov, S.; Larsen, J. Functional compatibility in cucumber mycorrhizas in terms of plant growth performance and foliar nutrient composition. Plant Biol. 2016, 18, 816–823. [Google Scholar] [CrossRef]
  15. Gamalero, E.; Cesaro, P.; Cicatelli, A.; Todeschini, V.; Musso, C.; Castiglione, S.; Fabiani, A.; Lingua, G. Poplar clones of different sizes, grown on a heavy metal polluted site, are associated with microbial populations of varying composition. Sci. Tot. Environ. 2012, 425, 262–270. [Google Scholar] [CrossRef]
  16. Fernández-González, A.J.; Villadas, P.J.; Gómez-Lama Cabanás, C.; Valverde-Corredor, A.; Belaj, A.; Mercado-Blanco, J.; Fernández-López, M. Defning the root endosphere and rhizosphere microbiomes from the World Olive Germplasm Collection. Sci. Rep. 2019, 9, 20423. [Google Scholar] [CrossRef] [Green Version]
  17. Cregger, M.A.; Veach, A.M.; Yang, Z.K.; Crouch, M.J.; Vilgalys, G.A.; Tuskan, G.A.; Schadt, C.W. The Populus holobiont: Dissecting the effect of plant niches and genotype on the microbiome. Microbiome 2018, 6, 31. [Google Scholar] [CrossRef]
  18. Bonito, G.; Benucci, G.M.N.; Hameed, K.; Weighill, D.; Jones, P.; Chen, K.-H.; Jacobson, D.; Schadt, C.; Vilgalys, R. Fungal-bacterial networks in the Populus rhizobiome are impacted by soil properties and host genotype. Front. Microbiol. 2019, 10, 481. [Google Scholar] [CrossRef] [Green Version]
  19. Bálint, M.; Tiffin, P.; Hallström, B.; O’Hara, R.B.; Olson, M.S.; Fankhauser, J.D.; Piepenbring, M.; Schmitt, I. Host genotype shapes the foliar fungal microbiome of balsam poplar (Populus balsamifera). PLoS ONE 2013, 8, e53987. [Google Scholar] [CrossRef] [Green Version]
  20. Corredor, A.H.; Van Rees, K.; Vujanovic, V. Host genotype and health status influence on the composition of the arbuscular mycorrhizal fungi in Salix bioenergy plantations. For. Ecol. Manag. 2014, 314, 112–119. [Google Scholar] [CrossRef]
  21. Gehring, C.A.; Mueller, C.; Whitham, T.G. Environmental and genetic effects on the formation of ectomycorrhizal and arbuscular mycorrhizal associations in cottonwoods. Oecologia 2006, 149, 158–164. [Google Scholar] [CrossRef] [PubMed]
  22. Gherghel, F.; Behringer, D.; Haubrich, S.; Schlauß, M.; Fey-Wagner, C.; Rexer, K.-H.; Janßen, A.; Kost, G. Former land use and host genotype influence the mycorrhizal colonization of poplar roots. Forests 2014, 5, 2980–2995. [Google Scholar] [CrossRef]
  23. Karliński, L.; Rudawska, M.; Kieliszewska-Rokicka, B.; Leski, T. Relationship between genotype and soil environment during colonization of poplar roots by mycorrhizal and endophytic fungi. Mycorrhiza 2010, 20, 315–324. [Google Scholar] [CrossRef] [PubMed]
  24. Karliński, L.; Rudawska, M.; Leski, T. The influence of host genotype and soil conditions on ectomycorrhizal community of poplar clones. Eur. J. Soil Biol. 2013, 58, 51–58. [Google Scholar] [CrossRef]
  25. Tagu, D.; Rampant, P.F.; Lapeyrie, F.; Frey-Klett, P.; Vion, P. Variation in the ability to form ectomycorrhizas in the F1progeny of an interspecific poplar (Populus spp.) cross. Mycorrhiza 2001, 10, 237–240. [Google Scholar] [CrossRef]
  26. Bakker, M.G.; Manter, D.K.; Sheflin, A.M.; Weir, T.L.; Vivanco, J.M. Harnessing the rhizosphere microbiome through plant breeding and agricultural management. Plant Soil 2012, 360, 1–13. [Google Scholar] [CrossRef]
  27. Langer, I.; Santner, J.; Krpata, D.; Fitz, W.J.; Wenzel, W.W.; Schweiger, P.F. Ectomycorrhizal impact on Zn accumulation of Populus tremula L. grown in metalliferous soil with increasing levels of Zn concentration. Plant Soil 2012, 355, 283–297. [Google Scholar] [CrossRef]
  28. Sebastiani, L.; Scebba, F.; Tognetti, R. Heavy metal accumulation and growth responses in poplar clones Eridano (Populus deltoides × maximowiczii) and I-214 (P. euramericana) exposed to industrial waste. Environ. Exp. Bot. 2004, 52, 79–88. [Google Scholar] [CrossRef]
  29. Zsuffa, L.; Giordano, E.; Pryor, L.D.; Stettler, R. Trends in poplar culture: Some global and regional perspectives. In Biology of Populus; Stettler, R.F., Bradshaw, H.D., Jr., Heilman, P.E., Hinckley, T.M., Eds.; NRC Research Press: Ottawa, ON, Canada, 1996; Chapter 20; pp. 515–539. [Google Scholar]
  30. Smulders, M.J.M.; Cottrell, J.E.; Lefèvre, F.; van der Schoot, J.; Arens, P.; Vosman, B.; Tabbener, H.E.; Grassi, F.; Fossati, T.; Castiglione, S.; et al. Structure of the genetic diversity in black poplar (Populus nigra L.) populations across European river systems: Consequences for conservation and restoration. For. Ecol. Manag. 2008, 255, 1388–1399. [Google Scholar] [CrossRef]
  31. Szuba, A. Ectomycorrhiza of Populus. For. Ecol. Manag. 2015, 347, 156–169. [Google Scholar] [CrossRef]
  32. Zheng, J.; Chen, J.; Pan, G.; Wang, G.; Liu, X.; Zhang, X.; Li, L.; Bian, R.; Cheng, K.; Zheng, J. A long-term hybrid poplar plantation on cropland reduces soil organic carbon mineralization and shifts microbial community abundance and composition. Appl. Soil Ecol. 2017, 111, 94–104. [Google Scholar] [CrossRef]
  33. Bradshaw, H.D.; Reinhart, C.; Davis, J.; Stettler, R. Emerging model systems in plant biology: Poplar (Populus) as a model forest tree. J. Plant Growth Regul. 2000, 19, 306–313. [Google Scholar] [CrossRef]
  34. Dillen, S.Y.; Marron, N.; Bastien, C.; Ricciotti, L.; Salani, F.; Sabatti, M.; Pinel, M.P.C.; Rae, A.M.; Taylor, G.; Ceulemans, R. Effects of environment and progeny on biomass estimations of five hybrid poplar families grown at three contrasting sites across Europe. For. Ecol. Manag. 2007, 252, 12–23. [Google Scholar] [CrossRef]
  35. Larchevêque, M.; Maurel, M.; Desrochers, A.; Larocque, G.R. How does drought tolerance compare between two improved hybrids of balsam poplar and an unimproved native species? Tree Physiol. 2011, 31, 240–249. [Google Scholar] [CrossRef]
  36. Marmiroli, M.; Pietrini, F.; Maestri, E.; Zacchini, M.; Marmiroli, N.; Massacci, A. Growth, physiological and molecular traits in Salicaceae trees investigated for phytoremediation of heavy metals and organics. Tree Physiol. 2011, 31, 1319–1334. [Google Scholar] [CrossRef] [Green Version]
  37. Fierer, N.; Schimel, J.P.; Holden, P.A. Variations in microbial community composition through two soil depth profiles. Soil Biol. Biochem. 2003, 35, 167–176. [Google Scholar] [CrossRef]
  38. Frostegård, Å.; Tunlid, A.; Bååth, E. Use and misuse of PLFA measurement in soils. Soil Biol. Biochem. 2011, 43, 1621–1625. [Google Scholar] [CrossRef]
  39. Wallander, H.; Ekblad, A.; Godbold, D.L.; Johnson, D.; Bahr, A.; Baldrian, P.; Björk, R.G.; Kieliszewska-Rokicka, B.; Kjøller, R.; Kraigher, H.; et al. Evaluation of methods to estimate production, biomass and turnover of ectomycorrhizal mycelium in forests soils—A review. Soil Biol. Biochem. 2013, 57, 1034–1047. [Google Scholar] [CrossRef]
  40. Sasser, M. Identification of bacteria through fatty acid analysis. In Methods in Phyto-Bacteriology; Klement, Z., Rudolph, K., Sands, D.C., Eds.; Akademiai Kiado: Budapest, Hungary, 1990; pp. 199–203. [Google Scholar]
  41. Steger, K.; Jarvis, Å.; Smårs, S.; Sundh, I. Comparison of signature lipid methods to determine microbial community structure in compost. J. Microb. Methods 2003, 55, 371–382. [Google Scholar] [CrossRef]
  42. Parsley, R. Operation manual, version 6. In Microbial Identification System; MIDI Inc.: Newark, DE, USA, 1996. [Google Scholar]
  43. Ravnskov, S.; Jensen, B.; Knudsen, I.M.B.; Bødker, L.; Funck Jensen, D.; Karliński, L.; Larsen, J. Soil inoculation with the biocontrol agent Clonostachys rosea and the mycorrhizal fungus Glomus intraradices results in mutual inhibition, plant growth promotion and alteration of soil microbial communities. Soil Biol. Biochem. 2006, 38, 3453–3462. [Google Scholar] [CrossRef]
  44. Wilkinson, S.C.; Anderson, J.M.; Scardelis, S.P.; Tisiafouli, M.; Taylor, A.; Wolters, V. PLFA profiles of microbial communities in decomposing conifer litters subject to moisture stress. Soil Biol Biochem. 2002, 34, 189–200. [Google Scholar] [CrossRef]
  45. Zelles, L. Fatty acid patterns of phospholipids and lipopolysaccharides in the characterisation of microbial communities in soil: A review. Biol. Fertil. Soils 1999, 29, 111–129. [Google Scholar] [CrossRef]
  46. Frostegård, Å.; Bååth, E. The use of phospholipid fatty acid analysis to estimate bacterial and fungal biomass in soil. Biol. Fertil. Soils 1996, 22, 59–65. [Google Scholar] [CrossRef]
  47. Graham, J.; Hodge, N.C.; Morton, J.B. Fatty acid methyl ester profiles for characterisation of glomalean fungi and their endomycorrhizae. Appl. Environ. Microbiol. 1995, 1, 58–64. [Google Scholar] [CrossRef] [Green Version]
  48. Madan, R.; Pankhurst, C.; Hawke, B.; Smith, S. Use of fatty acids for identification of AM fungi and estimation of the biomass of AM spores in soil. Soil Biol. Biochem. 2002, 34, 125–128. [Google Scholar] [CrossRef]
  49. Olsson, P.A. Signature fatty acids provide tools for determination of the distribution and interaction of mycorrhizal fungi in soil. FEMS Microbiol. Ecol. 1999, 29, 303–310. [Google Scholar] [CrossRef]
  50. Bååth, E. The use of neutral lipid fatty acids to indicate the physiological conditions of soil fungi. Microb. Ecol. 2003, 45, 373–383. [Google Scholar] [CrossRef]
  51. Lechevalier, H.; Lechevalier, M.P. Chemotaxonomic use of lipids—An overview. In Microbial Lipids; Ratledge, C., Wilkinson, S.G., Eds.; Academic Press Ltd.: London, UK, 1988; Volume 1. [Google Scholar]
  52. White, D.C.; Stair, J.O.; Ringelberg, D.B. Quantitative comparisons of in situ microbial biodiversity by signature biomarker analysis. J. Industrial Microbiol. 1996, 17, 185–196. [Google Scholar] [CrossRef]
  53. Snedecor, W.; Cochran, W.G. Statistical Methods, 6th ed.; The Iowa State University Press: Ames, IA, USA, 1976; pp. 327–329. [Google Scholar]
  54. Hammer, O.; Harper, D.A.T.; Ryan, P.D. PAST: Paleontological statistics software package for education and data analysis. Paleont. Electron. 2001, 4, 1–9. [Google Scholar]
  55. Brunner, I.; Luster, J.; Günthardt-Goerg, M.S.; Frey, B. Heavy metal accumulation and phytostabilisation potential of tree fine roots in a contaminated soil. Environ. Pollut. 2008, 152, 559–568. [Google Scholar] [CrossRef]
  56. Bailey, V.L.; Smith, J.L.; Bolton, H., Jr. Fungal-to-bacterial biomass ratios in soils investigated for enhanced carbon sequestration. Soil Biol. Biochem. 2002, 34, 997–1007. [Google Scholar] [CrossRef]
  57. Zhang, Q.; Wu, J.; Yang, F.; Lei, Y.; Zhang, Q.; Cheng, X. Alternations in soil microbial community composition and biomass following agricultural land use change. Sci. Rep. 2016, 6, 36587. [Google Scholar] [CrossRef] [PubMed] [Green Version]
  58. Holland, E.A.; Coleman, D.C. Litter lacement effects on microbial and organic matter dynamics in an agroecosystem. Ecology 1987, 68, 425–433. [Google Scholar] [CrossRef]
  59. Joergensen, R.G.; Wichern, F. Quantitative assessment of the fungal contribution to microbial tissue in soil. Soil Biol. Biochem. 2008, 40, 2977–2991. [Google Scholar] [CrossRef]
  60. Lamit, J.L.; Holeski, L.M.; Flores-Rentería, L.; Whitham, T.G.; Gehring, C.A. Tree genotype influences ectomycorrhizal fungal community structure: Ecological and evolutionary implications. Fungal Ecol. 2016, 24, 124–134. [Google Scholar] [CrossRef]
  61. Holste, E.K.; Kobe, R.K.; Gehring, C.A. Plant species differ in early seedling growth and tissue nutrient responses to arbuscular and ectomycorrhizal fungi. Mycorrhiza 2017, 27, 211–223. [Google Scholar] [CrossRef]
  62. Ostonen, I.; Lõhmus, K.; Pajuste, K. Fine root biomass, production and its proportion of NPP in a fertile middle-aged Norway spruce forest: Comparison of soil core and ingrowth core methods. For. Ecol. Manag. 2005, 212, 264–277. [Google Scholar] [CrossRef]
  63. Hobley, E.U.; Wilson, B. The depth distribution of organic carbon in the soils of eastern Australia. Ecosphere 2016, 7, e01214. [Google Scholar] [CrossRef] [Green Version]
  64. Song, Y.; Deng, S.P.; Acosta-Martínez, V.; Katsalitou, E. Characterization of redox-related soil microbial communities along a river floodplain continuum by fatty acid methyl ester (FAME) and 16S rRNA genes. Appl. Soil Ecol. 2008, 40, 499–509. [Google Scholar] [CrossRef]
  65. Fritze, H.; Pietikäinen, T.; Pennanen, T. Distribution of microbial biomass and phospholipid fatty acids in Podzol profiles under coniferous forest. Eur. J. Soil Sci. 2000, 51, 565–573. [Google Scholar] [CrossRef]
  66. Blume, E.; Bischoff, M.; Reichert, J.M.; Moorman, T.; Konopka, A.; Turco, R.F. Surface and subsurface microbial biomass, community structure and metabolic activity as a function of soil depth and season. Appl. Soil Ecol. 2002, 20, 171–181. [Google Scholar] [CrossRef]
  67. Pennanen, T.; Frostegård, Å.; Fritze, H.; Bååth, E. Phospholipid fatty acid composition and heavy metal tolerance of soil microbial communities along two heavy metal-polluted gradients in coniferous forests. Appl. Environ. Microbiol. 1996, 62, 420–428. [Google Scholar] [CrossRef] [PubMed] [Green Version]
  68. Eklund, F.; Rønn, R.; Christensen, S. Distribution with depth of protozoa, bacteria and fungi in soil profiles from three Danish forest sites. Soil Biol. Biochem. 2001, 33, 475–481. [Google Scholar] [CrossRef]
  69. Henkes, G.J.; Kandeler, E.; Marhan, S.; Scheu, S.; Bonkowski, M. Interactions of mycorrhiza and protists in the rhizosphere systemically alter microbial community composition, plant shoot-to-root ratio and within-root system nitrogen allocation. Front. Environ. Sci. 2018, 6, 117. [Google Scholar] [CrossRef]
  70. Frostegård, Å.; Tunlid, A.; Bååth, E. Phospholipid fatty acid composition, biomass, and activity of microbial communities from two soil types experimentally exposed to different heavy metals. Appl. Environ. Microbiol. 1993, 59, 3606–3617. [Google Scholar] [CrossRef] [Green Version]
  71. Hagerberg, D.; Manique, N.; Brandt, K.K.; Larsen, J.; Nybroe, O.; Olsson, S. Low concentration of copper inhibits colonization of soil by the arbuscular mycorrhizal fungus Glomus intraradices and changes the microbial community structure. Microb. Ecol. 2011, 61, 844–852. [Google Scholar] [CrossRef]
  72. Rajapaksha, R.M.C.P.; Tobor-Kapłon, M.A.; Bååth, E. Metal toxicity affects fungal and bacterial activities in soil differently. Appl. Environ. Microbiol. 2004, 70, 2966–2973. [Google Scholar] [CrossRef] [Green Version]
  73. Duxbury, T.; Binknell, B. Metal-tolerant bacterial populations from natural and metal-polluted soils. Soil Biol. Biochem. 1983, 15, 243–250. [Google Scholar] [CrossRef]
  74. O’Leary, W.M.; Wilkinson, S.G. Gram-Positive Bacteria. In Microbial Lipids; Retledge, C., Wilkinson, S.G., Eds.; Academic Press Ltd.: London, UK, 1988; Volume 1, pp. 117–185. [Google Scholar]
  75. Gupta, K.; Chatterjee, C.; Gupta, B. Isolation and characterization of heavy metal tolerant Gram-positive bacteria with bioremedial properties from municipal waste rich soil of Kestopur canal (Kolkata), West Bengal, India. Biologia 2012, 67, 827–836. [Google Scholar] [CrossRef]
  76. Pennanen, T.; Strömmer, R.; Markkola, A.; Fritze, H. Microbial and plant community structure across a primary succession gradient. Scand. J. For. Res. 2001, 16, 37–43. [Google Scholar] [CrossRef]
  77. Buyer, J.S.; Teasdale, J.R.; Roberts, D.P.; Zasada, I.A.; Maul, J.E. Factors affecting soil microbial community structure in tomato cropping system. Soil Biol. Biochem. 2010, 42, 831–841. [Google Scholar] [CrossRef]
  78. Jordan, M.J.; Lechevalier, M.P. Effects zinc-smelter emissions on forest soil microflora. Can. J. Mirobiol. 1975, 21, 1855–1865. [Google Scholar] [CrossRef] [PubMed]
  79. Jayasinghe, B.A.T.D.; Parkinson, D. Actinomycetes as antagonists of litter decomposer fungi. Appl. Soil Ecol. 2008, 38, 109–118. [Google Scholar] [CrossRef]
  80. Gomiero, A.; Dagnino, A.; Nasci, C.; Viarengo, A. The use of protozoa in ecotoxicology: Application of multiple endpoint tests of the ciliate E. Crassus for the evaluation of sediment quality in coastal marine ecosystems. Sci. Tot. Environ. 2013, 442, 534–544. [Google Scholar] [CrossRef]
  81. Li, Y.-D.; Chen, Y.; Wang, L.; Yao, L.; Pan, X.-M.; Lee, D.-J. Pollution tolerant protozoa in polluted wetland. Biores. Technol. 2017, 240, 115–122. [Google Scholar] [CrossRef] [PubMed]
  82. Ananyeva, N.D.; Susyan, E.A.; Chernova, O.V.; Chernov, I.Y.; Makarova, O.L. The ratio of fungi and bacteria in the biomass of different types of soil determined by selective inhibition. Microbiology 2006, 75, 702–707. [Google Scholar] [CrossRef]
Figure 1. Localization of the study sites.
Forests 11 00262 g001
Figure 2. Study site and sampling scheme.
Forests 11 00262 g002
Figure 3. Biomass of microorganisms in the soil of four poplar genotypes in three sites at three rooting depths. Differences between poplar genotypes were analyzed separately for each site. Significant differences are indicated by different letters (means ± SE, p < 0.05, Tukey’s test). Pd—Populus deltoides; Pdn—P. deltoides × P. nigra; Pdt—P. deltoides × P. trichocarpa; Pmt—P. maximowiczii × P. trichocarpa.
Forests 11 00262 g003
Figure 4. AMF to SF biomass ratio (arbuscular fungi to soil fungi biomass ratio), fungal to bacterial biomass ratio (F:B) and gram-positive to gram-negative bacteria biomass ratio in soils planted with four poplar genotypes, in three sites and at three soil depths. Differences in microbial biomass ratios between poplar genotypes were analyzed separately for each site. Significant differences are indicated by different letters (means±SE, p < 0.05, Tukey’s test).
Forests 11 00262 g004
Figure 5. Principal Component Analysis (PCA) diagram of whole-cell fatty acids profiles of microbial communities in soil of three sites, four poplar genotypes (Pd—Populus deltoides; Pdn—P. deltoides × P. nigra; Pdt—P. deltoides × P. trichocarpa; Pmt—P. maximowiczii × P. trichocarpa) and three depths (0–10 cm; 10–20 cm; 20–30 cm).
Forests 11 00262 g005
Figure 6. Redundancy Analysis (RDA) diagram of soil factors, whole cell fatty acids and study sites. Underlined factors contributed significantly to variance in whole cell fatty composition in soil (soil temperature. K. N-NO3. C/N. pH[KCl]. Zn) (Monte Carlo permutation test. p < 0.05). Study sites are marked by points. Whole-cell fatty acids are indicated by numbers: {1} 9:0; {2} unk 9.531; {3} 10:0; {4} 10:0 3OH; {5} 11:0; {6} iso 11:0; {7} anteiso 11:0; {8} iso 11:0 3OH; {9} 11:0 3OH; {10} unk 11.543; {11} unk 11.799; {12} 12:0; {13} iso 12:0; {14} anteiso 12:0; {15} 12:0 2OH; {16} 12:0 3OH; {17} 12:0 ALDE; {18} 12:1 3OH; {19} 13:0; {20} iso 13:0; {21} anteiso 13:0; {22} iso 13:0 3OH; {23} 14:0; {24} iso 14:0; {25} anteiso 14:0; {26} 14:1ω5c; {27} iso 14:0 3OH; {28} unk 14.502; {29} 15:0; {30} iso 15:0; {31} anteiso 15:0; {32} anteiso 15:1 A; {33} iso 15:1 G; {34} iso 15:1 H; {35} 15:0 2OH; {36} iso 15:0 3OH; {37} 15:1ω8c; {38} 15:1ω6c; {39} 16:0; {40} iso 16:0; {41} anteiso 16:0; {42} 16:0 N alcohol; {43} 16:0 2OH; {44} iso 16:0 3OH; {45} 16:0 3OH; {46} 10 methyl 16:0; {47} 16:1 2OH; {48} 16:1ω5c; {49} 16:1ω7c; {50} 16:1ω7c alcohol; {51} 17:0; {52} iso 17:0; {53} anteiso 17:0; {54} cyclo 17:0; {55} iso 17:0 3OH; {56} 17:0 2OH; {57} 17:0 3OH; {58} 10 methyl 17:0; {59} iso 17:1 I; {60} 17:1ω7c; {61} 17:1ω8c; {62} anteiso 17:1ω9c; {63} 18:0; {64} iso 18:0; {65} 18:0 3OH; {66} 18:1 2OH; {67} 11methyl 18:1ω7c; {68} 18:1ω5c; {69} 18:1ω7c; {70} 18:1ω9c; {71} 18:3ω6c (6.9.12); {72} 10 methyl 18:0; {73} 18:2ω6.9c; {74} unk 18.846; {75} iso 19:0; {76} anteiso 19:0; {77} cyclo 19:0ω8c; {78} 10 methyl 19:0; {79} 20:0; {80} 20:1ω9c; {81} 20:4ω6.9.12.15c.
Forests 11 00262 g006
Table 1. Soil chemical characteristics of three sites (parts per million).
Site 1Site 2Site 3
0–10 cm10–20 cm20–30 cm*0–10 cm10–20 cm20–30 cm*0–10 cm10–20 cm20–30 cm*
pH[H2O]7.67.37.6c7.17.17.1b6.86.36.2a
pH[KCl]7.27.27.5c6.86.86.8b6.15.45.2a
Cu7.889.14.17a5.088.414.97a2137.41295.2748.8b
Pb8.4710.789.47a9.3310.026.69a2154.35518.8515.55b
Zn20.9018.4018.90a30.3032.8025.90b94.2071.80114.2c
Cd0.290.280.26a0.320.310.30b0.470.430.43c
N-NO324.698.758.51b20.598.665.76b10.290.951.34a
N-NH32.290.980.172.32.21.661.971.221.32
P492358397.5a446438324.5a870488.5512.5b
K1073820.5750a16171616.51631.5b33613641.54333c
Ca2521.524143955.5293217361597.542202526.52316
C %1.411.081.09b0.940.630.48a2.221.921.51c
N %0.130.10.11b0.070.040.03a0.190.10.12c
C/N10.9711.2310.18 14.0914.9517.02 11.4619.0912.48
* Significant differences between sites. a–c, significance decline.
Table 2. Results of ANOVA testing the influence of site, tree genotype, and soil depth on the biomass of soil microorganisms, and the effect size (ω2) value of these factors. The following symbols are used to indicate level of significance: * p ≤ 0.05; ** p ≤ 0.01 and *** p ≤ 0.001.
Bacteria Gram (+)Bacteria Gram (−)ActinobacteriaAMFSFProtozoa
Fpω2Fpω2Fpω2Fpω2Fpω2Fpω2
Overall
Site 33.7***1992.0***392.70.0681230.6***6017.6***1043.1***26
Genotype5.7***44.8**27.3***713.4***51.80.15011.70.1701
Depth 2.70.06918.2***313.0***96.7**15.9**33.6*2
Site × genotype 0.50.83500.50.82400.50.83107.1***51.40.20415.5***8
Site × depth 7.7***810.2***81.10.3620.12.4*16.8***70.60.6650
Genotype × depth 2.7*31.30.2770.30.80.53601.20.2920.23.1**40.40.9050
Site × genotype × depth 1.9*32.0*31.60.08630.50.91102.5**60.70.7700
At each of the sites
Site 1
Genotype1.30.28011.10.3730.22.30.08654.7**113.9*102.40.0736
Depth 5.4**104.4*83.5*710.5***195.1**92.40.1014
Genotype × depth 2.00.074371.50.18840.10.99400.50.81601.10.36910.40.8970
Site 2
Genotype5.1**152.30.08752.00.12542.00.125191.10.36106.3***18
Depth 1.00.38204.4*83.4*63.4*08.4***180.80.4330
Genotype × depth 0.70.64600.70.62401.00.45601.00.45600.40.89500.70.6230
Site 3
Genotype1.30.29812.10.10934.0*812.6***321.30.29911.00.3990
Depth 9.4***1617.7***288.4***142.10.134026.4**111.00.37390
Genotype × depth 3.0*122.9*93.0*111.10.36213.4**151.00.4340
Table 3. Results of ANOVA testing the influence of site, poplar genotype and soil depth on biomass ratio values between both fungal groups (arbuscular fungi (AMF) and soil fungi (SF)), fungal and bacterial biomass ratio (F:B), gram-positive and gram-negative bacteria biomass ratio, and the effect size (ω2) value of these factors. The following symbols are used to indicate level of significance: * p ≤ 0.05; ** p ≤ 0.01 and *** p ≤ 0.001.
AMF:SFF:BBacteria Gram (+):Gram (−)
Fpω2Fpω2Fpω2
Overall
Site 152.4***50.717.4***934.0***23.2
Genotype9.0***4.07.7***50.70.5580
Depth 3.9*1.07.4***32.80.0621.3
Site × genotype 9.3***8.41.50.18110.60.7440
Site × depth 3.2*1.59.6***92.20.0691.7
Genotype × depth 0.9950.99504.5***60.80.5440
Site × genotype × depth 0.8670.867033.5***80.80.6270
At each of the sites
Site 1
Genotype4.9**14.32.9*60.10.9710
Depth 2.10.1302.710.5***00.50.6290
Genotype × depth 0.30.92401.90.09101.30.2722.6
Site 2
Genotype4.0*11.14.1**110.10.9380
Depth 3.8*6.72.90.06303.2*6.1
Genotype × depth 0.30.95000.70.64600.90.5220
Site 3
Genotype14.4***34.73.5*61.00.4150
Depth 4.2**5.610.2***02.30.1113.5
Genotype × depth 0.50.77404.9***00.70.6270
Table 4. Spearman rank correlation matrix (rS and p-value) of biomass of soil microorganisms (bacteria gram-positive, bacteria gram-negative, actinobacteria, arbuscular fungi(AMF), soil fungi(SF), protozoa) and the chemical composition of soil. The following symbols are used to indicate level of significance: * p ≤ 0.05; ** p ≤ 0.01 and *** p ≤ 0.001.
Bacteria Gram (+)Bacteria Gram (−)ActinobacteriaAMFSFProtozoa
pH[H2O]0.290.780.320.850.270.77
0.081***0.056***0.110***
pH[KCl]0.340.810.270.810.230.73
****0.110***0.169***
Cu0.15−0.29−0.07−0.54−0.51−0.51
0.3790.0860.692*******
Pb0.34−0.14−0.11−0.62−0.65−0.57
*0.4020.520*********
Zn−0.34−0.73−0.14−0.80−0.24−0.70
****0.409***0.160***
Cd−0.25−0.69−0.04−0.77−0.23−0.67
0.145***0.800***0.180***
N-NO30.060.430.590.570.390.58
0.714************
N-NH3−0.52−0.250.380.150.510.21
**0.134*0.385**0.219
P0.03−0.300.23−0.47−0.27−0.37
0.8760.0750.170**0.115*
K−0.36−0.84−0.26−0.80−0.19−0.73
****0.121***0.271***
Ca0.540.300.42−0.17−0.29−0.07
***0.0810.0110.3280.0850.667
C0.44−0.070.12−0.49−0.59−0.44
**0.6830.485*******
N0.440.180.28−0.15−0.37−0.12
**0.2940.0930.399*0.494
C/N−0.48−0.67−0.32−0.460.01−0.43
*****0.054**0.933**
Soil temperature−0.26−0.75−0.22−0.87−0.31−0.78
0.128***0.199***0.068***
Soil humidity0.43−0.13−0.08−0.55−0.65−0.52
**0.4460.662********

