Article

Evaluating the Effects of Pressure Indicators on Riparian Zone Health Conditions in the Three Gorges Dam Reservoir, China

1
Key Laboratory of Eco-Environments in the Three Gorges Reservoir Region (Ministry of Education), State Cultivation Base of Eco-agriculture for Southwest Mountainous Land, College of Life Sciences, Southwest University, Chongqing 400715, China
2
Punjab Forest Department, Government of Punjab, Lahore-54000, Pakistan
*
Author to whom correspondence should be addressed.
These authors contributed equally to this work.
Forests 2020, 11(2), 214; https://doi.org/10.3390/f11020214
Submission received: 10 December 2019 / Revised: 6 February 2020 / Accepted: 11 February 2020 / Published: 13 February 2020

Abstract

:
The possible negative impacts of flow regulation on riparian zone conditions can be observed due to the disruption of the natural flow regime in reservoirs. In spite of considerable literature on the qualitative effects of external disturbances on riparian health indicators (RHIs), quantitative evaluations of such changes induced by pressure are rare in the literature. Our study evaluated the effects of pressure indicators on the RHIs, and the responses of RHIs relevant to the riparian zones of the Three Gorges Dam Reservoir (TGDR), China, by using the field-based approach. This paper is a component of a large project—rapid appraisal of riparian condition for the TGDR, China. The analysis has compared pressures (13 indicators) and RHIs (27 indicators) determined from the transects (259) identified throughout the TGDR (within 15 counties) by categorizing into upstream, midstream, and downstream. By using basic statistical techniques (Kruskal-Wallis tests and Pearson’s correlation), pressure indicators were found to significantly differently influence RHIs for the categorized three sections of the riparian zones of the TGDR. The correlation analysis confirmed that the pressure indicators correlated (range of r = −0.496–0.971) with the RHIs (enlisted as habitat, plant cover, regeneration, erosion, and exotic parameters). Moreover, pressure indicators were found to have a highly significant influence on erosion and habitat parameters, but moderate effects on plant cover, exotic and regeneration parameters. In addition, the highest relative effect of the pressure indicators was detected in the upstream transects, whereas the lowest was in the downstream transects. Agglomerative Hierarchical Cluster analysis also confirmed the substantial dissimilarity in the upstream transects, whereas significant similarities were identified between midstream and downstream transects. These results may be particularly important in the planning stages, to help administrators and planners form better priorities and treatments for reach-scale conservation and restoration of wide-ranging riparian zones.

1. Introduction

Conservation is a key approach for protecting the biodiversity and ecosystem functions of the riparian zones [1]. Riparian zones, also called buffer zones, margins, strips, or reserves, are a typical set-aside conservation strategy. In general, they include uninterrupted natural habitats, non-managed areas or actively restored natural habitats [2]. The riparian zone connects terrestrial and aquatic regions [3,4]. These are extremely fragile ecosystems influenced by hydrology, geomorphology and human factors [5,6]. In addition, riparian zones show a high degree of spatial and temporal variability [7]. Substantial adverse effects of flow regulation on riparian zone conditions occur due to the disruption of natural flow within the river systems [8]. Such negative impacts of a dam construction can be measured based on changes in riparian health indicators (RHIs). Previous work suggests that flow regulation can have widespread effects, such as increased scouring, altered hydrology, modified morphology [9,10,11,12] and even changed the riparian zone condition. Very often, the negative impacts of dam construction are completely ignored, once the dam is built. Thus, there is a need to measure dam effects after regular time intervals [13,14]. In this regard, it is critical to assess the effectiveness of such projects and the development of regulated rivers on the riparian zones.
In view of the significant environmental and economic importance of riparian areas, it is critical to monitor these riparian zones by time-efficient, accurate and cost-effective methods [15]. Globally, states, federal governments, and local agencies have been developing assessment protocols to monitor and manage river banks effectively [16,17]. Even though riparian zones occupy proportionately small patches around the globe, their contribution is significant in terms of economic, tourism and cultural values [17]. Riparian areas are important to maintain biodiversity and geomorphology and can improve the aesthetics of the landscape and water quality [18]. However, riparian areas are highly susceptible to perturbation such as human disturbance, overgrazing, weed invasion, and fires [19]. In the Three Gorges Dam Reservoir (TGDR), riparian zones are undergoing urbanization, industrialization, agriculture, fishing and other environmentally detrimental activities. There is a pressing need to assess and monitor conditions of riparian zones of the TGDR that are changing due to increasing human disturbance pressure occurring almost everywhere.
The Yangtze River plays a significant role in China, and its riparian zone supports an important part of the whole Yangtze River watershed biome [20,21]. However, due to the disruption of the natural flow regime caused by flow control of the Three Gorges Dam (TGD), various threats have been brought to the ecosystem throughout the Yangtze River [22]. Comparing the structural aspect, the TGD is the fourth largest gravity dam in the world and the greatest ever built in China [23]. It is constructed in the higher region of the Yangtze River, having multiple purposes, such as flood control, hydroelectricity, and navigation-stations [24]. Currently, the dam is holding a huge reservoir, possessing river banks stretching over 2000 km alongshore and sprawling over 400 km2 riparian zone. The newly formed riparian area of the TGDR has been experiencing 30-m water level fluctuation annually since its construction, whereas 145 m a.s.l. in summer and 175 m a.s.l. in winter were recorded as the lowest and the highest water levels, respectively [20,25]. Due to water regulations, the hydrological pattern of the Yangtze River has changed, and river banks started facing challenges every year. The current hydrological system of the river has become contrasted with its natural status, which is characterized by a prolonged flood period and reflection of the seasonal flood plan [26]. From the record, the annual submerging of the riparian region can last differently and mainly depend on the situation in the TGDR. For instance, riparian zone submergence was recorded about 364 and 182 days for 146 and 165 m a.s.l. respectively [27]. These drastic yearly fluctuations lead to the destruction of vegetation from TGDR riparian areas, imposing effects on habitat, leading straight to extreme soil erosion, dropping biodiversity and increasing environmental toxic waste [4,21]. Therefore, the competent authorities are working over vegetation restoration on the priority basis, and long-term different reforestation experiments and schemes are under progress in the newly formed riparian area of the TGDR [28,29].
Studies on reservoirs’ hydrology, water quantity, and quality are being conducted around the world [30]. There is an extensive debate about the dam impact on hydrology [31,32], terrestrial forms [7,33], sedimentary deposition rates [12,34], and vegetation characteristics [13,35]. In the interim, however, the actual impacts and aftereffects of dam construction on RHIs in the TGDR remain unknown, as their impact on vegetation characteristics and physical processes is not fully understood [9]. In the TGDR, there is a pressing need for the objective and comprehensive evaluation of RHIs [36], enlisted as habitat, plant cover, regeneration, erosion and exotics. Such changes in RHIs are, to some extent, caused by pressure indicators throughout the TGDR. Thus, it is necessary to examine the impact of pressure indicators on the deterioration of RHIs while understanding the distribution of pressure indicators in the context of large dams. In the TGDR riparian zones, there is also a need to control and mitigate pressure indicators that often force local administrations to look for solutions for riparian conservation strategies.
Multiple approaches, either using field-based or remote-sensing, are being opted to assess the state of the riparian zones [37,38,39]. As remote sensing monitors the characteristics of the riparian areas to a limited extent [40,41,42] and faces several limitations in the riparian zones, such as showing flaws for plant species distribution in the limited width riparian areas [42,43] and being restricted for accessing mid-story and under-story investigations [17], assessment of most of the riparian zones is entirely depended on the field-based approaches. Therefore, a field-based (rapid appraisal) approach is opted for a sufficient number of RHIs assessment in the riparian zones of the TGDR. The purpose of this study is to gather information and interaction of pressure indicators with RHIs. More precisely this paper: (a) examines the differentiation between the RHIs observed in upstream, midstream, and downstream riparian zones; (b) examines the difference between pressure indicators investigated in three regions; (c) looks for correlations between couples of pressure indicators and RHIs, as well as the ability to measure the interaction of indicators with another indicator; and (d) identifies statistical similarities between locations along the TGDR.

2. Materials and Methods

2.1. Study Area

The study sites are situated within the riparian zones of the TGDR region (31°2′34.0″ N 109°33′41.0″ E), comprising of 15 counties, having a gross area of 0.0451 million km2, and beginning from Jiang Jin county of Chongqing Municipality and ending at Zi Gui county of Hubei province, China (Figure 1).
These areas fall within the humid subtropical monsoon climate, and receive the mean annual rainfall of approximately 1160.9 ± 118.7 mm, with mean yearly air temperature range over 17.5 ± 1.2 °C [4,21,44]. The soil in the areas is purple soil (Table 1), formed from the calcareous purplish sand shale (Regosols in FAO Taxonomy). Due to shallow weathering of rocks, soil maturity is low. Erosion of water and soil is serious in less-developed areas along the banks of riversides [4]. At the moment, dominant available woody species in the riparian zone of the TGDR are Salix matsudana, Taxodium ascendens, and Taxodium distichum [21,27,45]. However, cypress and pine species are widely used by locals above the 175 m a.s.l., and determined to be the most suitable tree species because of their overall excellent performance [27]. Understory cover is relatively missing within sample transects. Most of the area is covered with grass, and several grass species such as Cynodon dactylon, Xanthium sibiricum, Hemarthria compressa, and Alternanthera philoxeroides, etc., are available in most of the sites.
The riparian zone health indicators along with pressure indicators show a unique vertical division across the TGDR reaches. The lower river banks are relatively steep and sandy, with mostly non-vegetated and exposed areas; however, some areas are covered by small patches of thin grasses strips. The majority of erosion observed from the downstream riverbank appears to be the result of navigational events and is exacerbated by water fluctuation waves. The middle bank areas of the riparian zone are mainly of well-established grasses with comparative stable banks, but a relatively missing organic litter on the ground, with vanish understory and upper-story vegetation as well. The upper bank areas are mostly highly stable with a spare canopy and understory vegetation. However, irregular patterns of RHIs and pressure indicators are observed in upstream, midstream and downstream, along with their subsets. Considering the dynamic hydrological changes of the TGDR riparian zone, various ecological restoration projects are under process for maintaining the ecological integrity of aquatic and terrestrial ecosystems. Within the study area, the majority of sites are identified with various kinds of pressure indicators, and the human role is a key factor, which had been disturbing the TGDR riparian zones. Some land-use activities inside the riparian zones in the study areas are urbanization, industrialization, agriculture, fishing, and other environmentally unfriendly activities, and so on (Table 2).

2.2. Selection of Survey Transects and Riparian Zone Condition and Pressure Indicators

Field surveys were conducted in the riparian zones of the TGDR, that were further categorized into upstream, midstream and downstream based on their management zones. All those 259 sites were selected under the field investigation guidance and through collaboration with the local staff that represented the area thoroughly. It was a huge and systematic study, tracking by the field-based approach [46]. This field-based approach is also a qualitative visual assessment method, developed by both Dixon et al. [47] and Johansen et al. [17,48], in order to provide a rapid assessment of riparian zone conditions. In our study, we used 40 indicators, including 27 RHIs and 13 pressure indicators. RHIs were enlisted into five categories that reflected the status of riparian zones: (1) habitat, (2) plant cover, (3) regeneration, (4) erosion, and (5) exotics. Moreover, pressure indicators were combined into a single group, followed by Dixon et al. [44]. Each RHI was set to a score of 0 to 4, reflecting the situation, with a high number indicating good condition, but the said score of the pressure indicators was otherwise. These broad result classes (0–4) were selected to reduce user differences in visual evaluation (Table 2). These 40 indicators (27 + 13 separately) were then used to arrive at a total score of 100 points, reflecting the overall condition and pressure situation of the riparian zones. Although all 40 indicators were estimated within transects throughout the TGDR, the main focus of all RHIs was on the vegetation cover, and all pressure indicators were incorporated equally (Table 2). Considering the accessibility of transects, a practical approach was followed (e.g., sometimes it’s impossible to penetrate in vertical and thorny locations). The extent of each RHI and pressure indicator was estimated by using 100-m-long and 20-m-wide transects, located parallel to the rivers. Owing to the diversity in widths of the riparian zone along the rivers, each of the 259 transects had three different sampling points to assess the effects entirely.

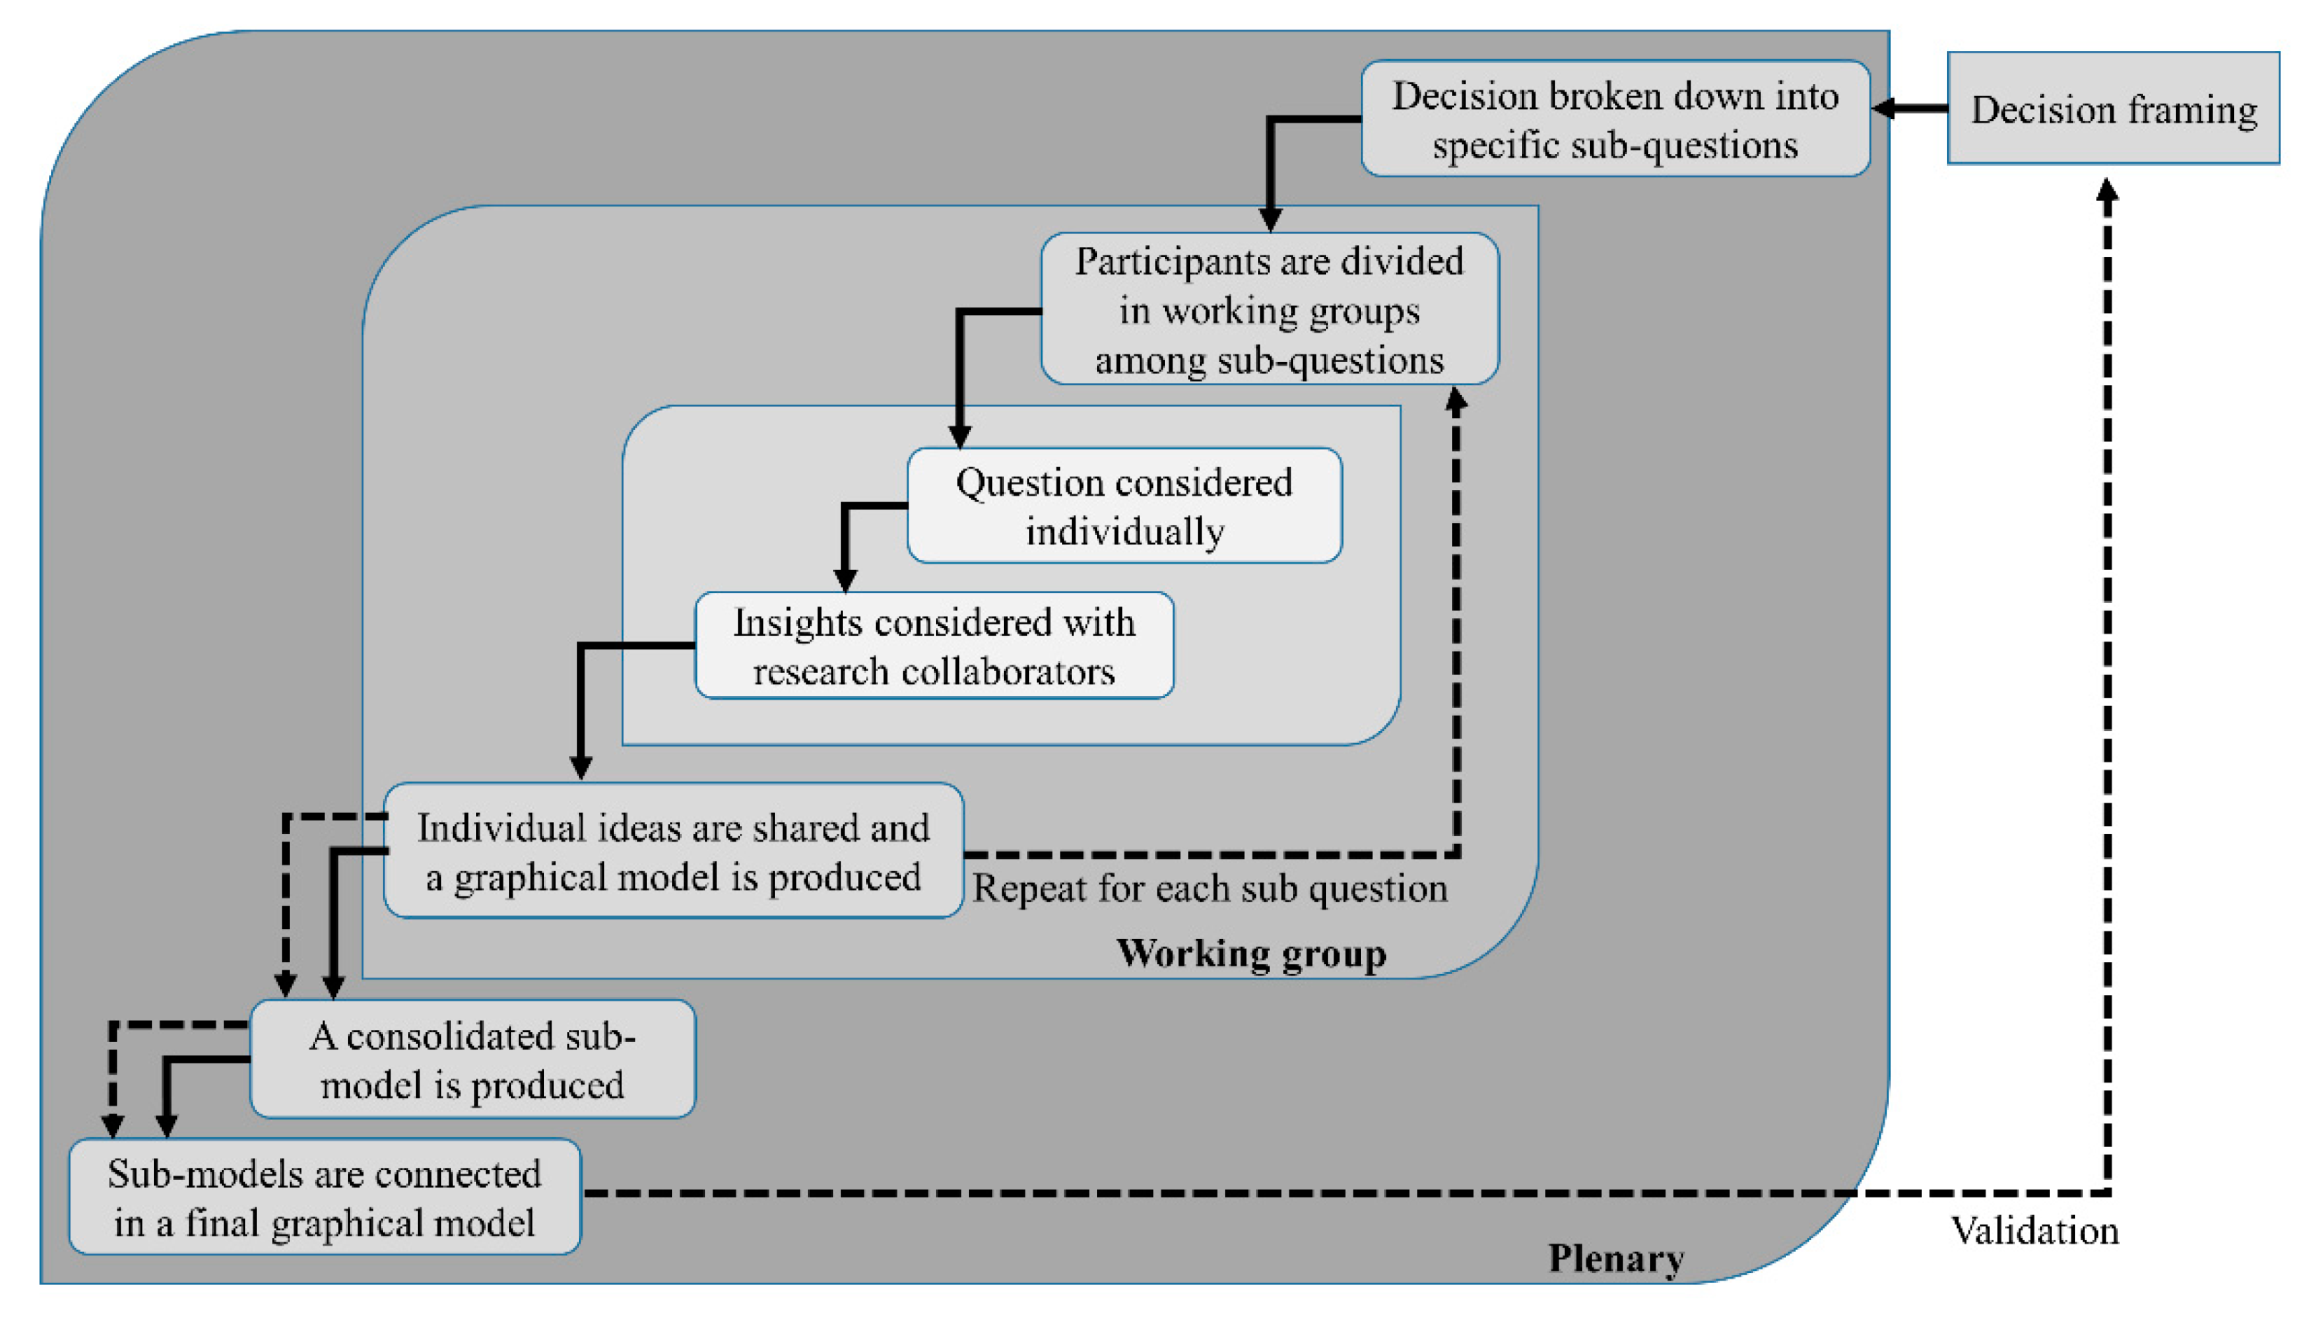
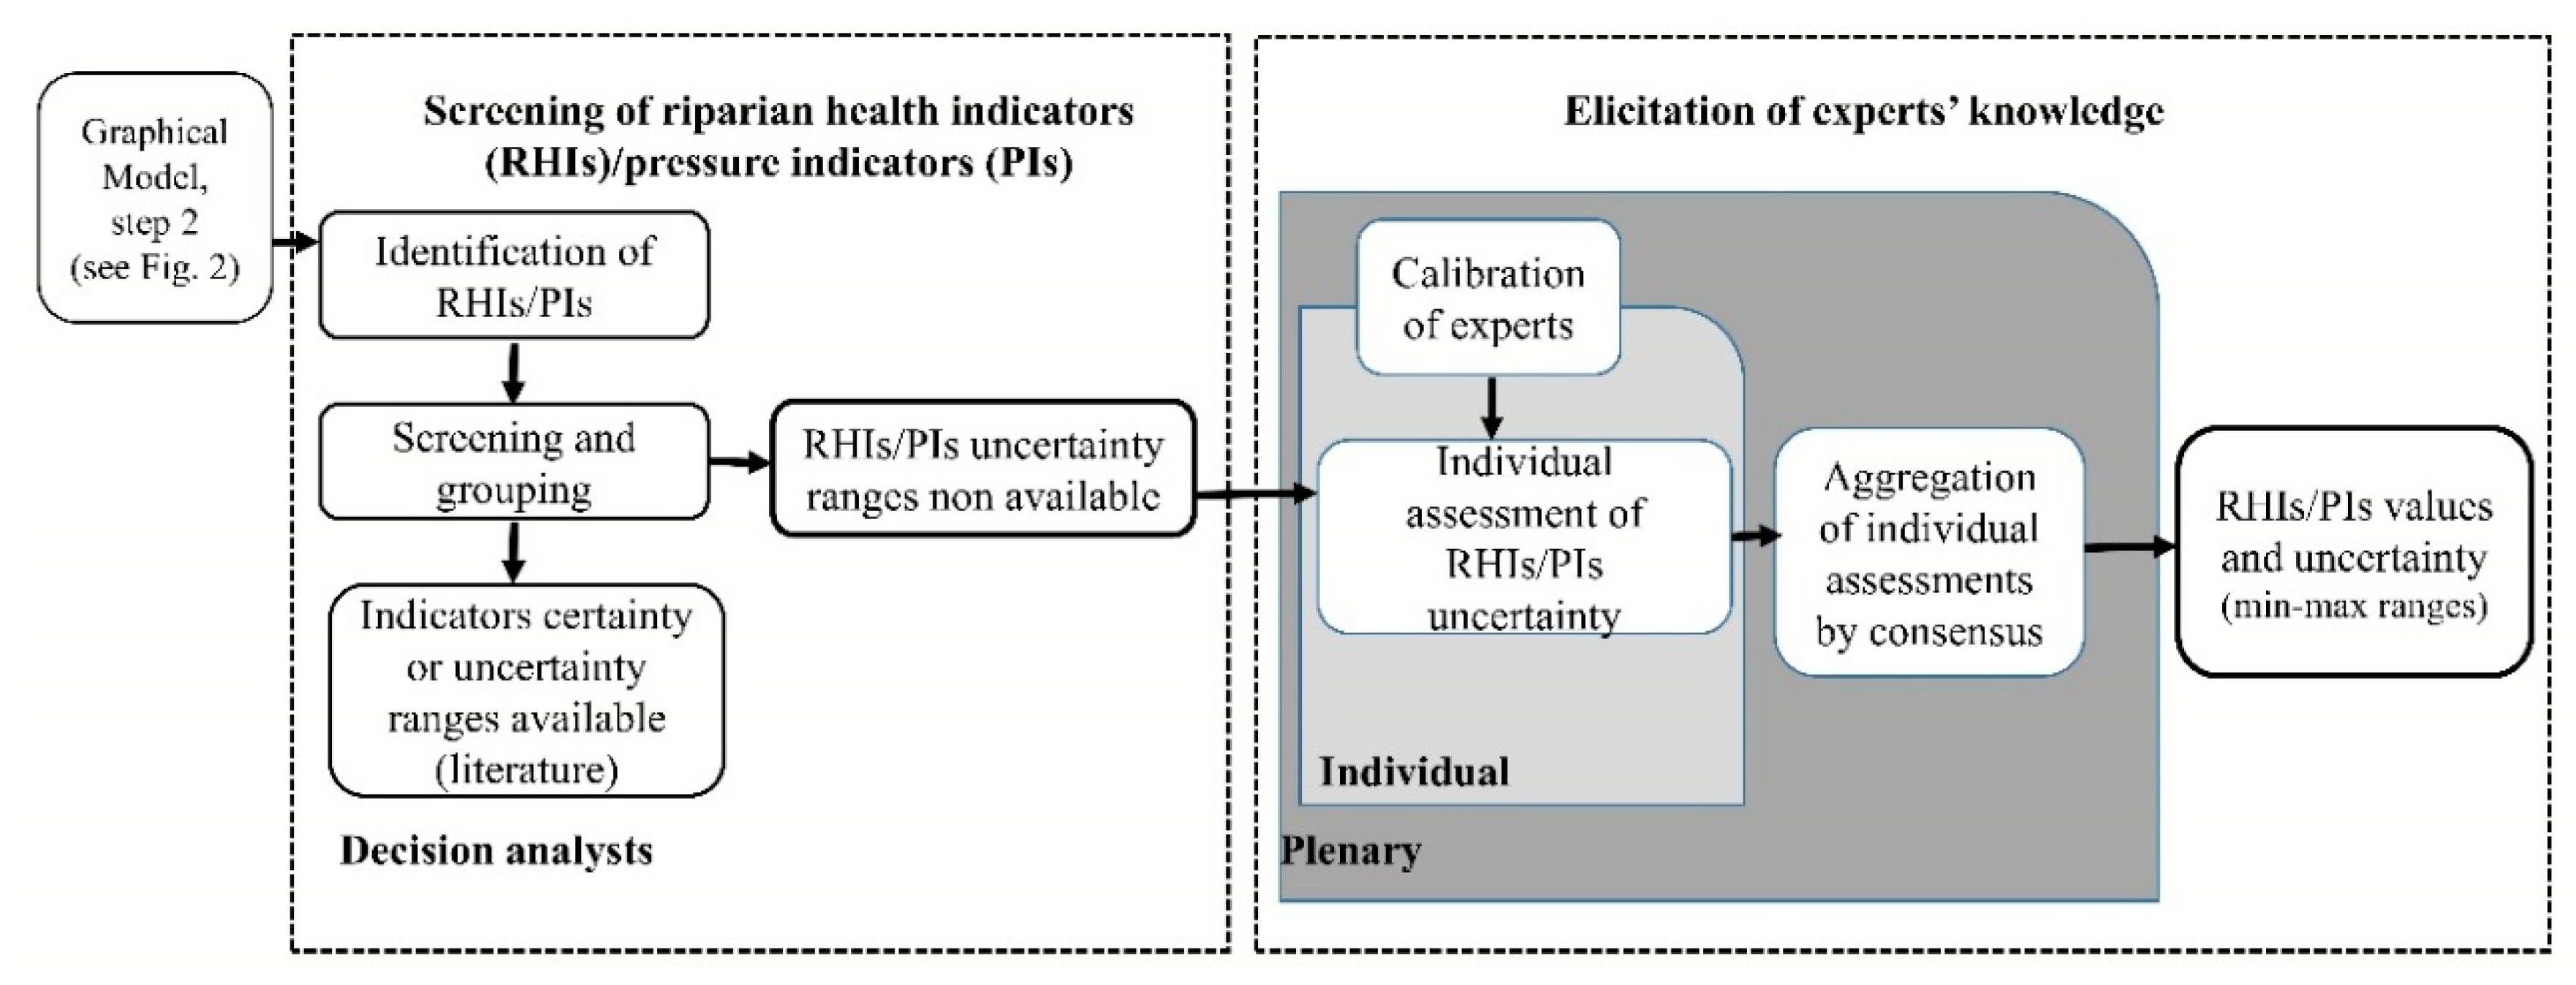
2.3. Model Structure and Expert Calibration

In order to design an effective evaluation model applicable to the riparian areas of the TGDR, we consulted with a number of experts to evaluate and identify parameters (such as condition and pressure indicators) while reviewing a large quantity of relevant literature. The most pertinent experts were selected, and multiple meetings were carried out with the representatives of the reservoir management unit, immigration management office, local township, and local communities. During this consultation process, various field visits to the riparian zones of the TGDR were made, which took almost six months before the decision session. The steps in the process of designing a model structure through experts were according to a four-stage program proposed by Lanzanova et al. [49] and Whitney et al. [50] (Figure 2). The final conceptual model represents a path of significant decisions that can be formally designed and implemented.
For this study, parameters were indexed and grouped into two categories (Figure 3). The first type of parameters could be witnessed from existing technical or academic sources, such as reports, databases, and literature. The second type consisted of all those parameters that did not have such a source and should be computed. We relied on expert knowledge to assess the values and uncertainties of these parameters. Our sessions with experts have proven to improve the ability to assess uncertainty and thus reduce errors of judgment (Figure 3). All experts had to receive standardization sessions, which taught them how to make a reliable estimate, and more information on these actions can be found in Lanzanova [49].

2.4. Analysis Methods

The statistical significance of indicators across upstream, midstream and downstream transects was investigated by Kruskal-Wallis tests (a non-parametric alternative to analysis of variance). Moreover, it was followed by multiple pairwise comparisons using Dunn’s procedure with Bonferroni’s correction for the significance level for the pairwise comparisons. To differentiate the levels of significance, both p < 0.01 and p < 0.05 were adopted. Then, in order to identify possible mathematical relationships between and among couples of pressure indicators and RHIs, Pearson’s correlation matrix was computed based on their current values of the transect groups. The correlation coefficients (r) measured the explanatory capacity of the linear regressions [51].
Lastly, the Agglomerative Hierarchical Cluster (AHC) analysis was used to find different transects with similar characteristics. In our study dendrogram expression was used for the AHC analysis. For the agglomerative hierarchical clustering, centroid clustering was opted in the cluster method, whereas squared euclidean distance was chosen as the interval measure. Moreover, a range of −1 to 1 was selected for the standardized process. The similarity pattern was displayed on the vertical axis, whereas different counties were presented along the horizontal axis. These techniques have been widely used around the globe for parallel functionality (in our case, the transects) into groups with similar characteristics (in our case, the indicators) [8,36]. All statistical analyses were performed using the IBM SPSS software version 22 (Armonk, NY, USA), while Origin release 2018 (Northampton, MA, USA) used for the graphing.

3. Results

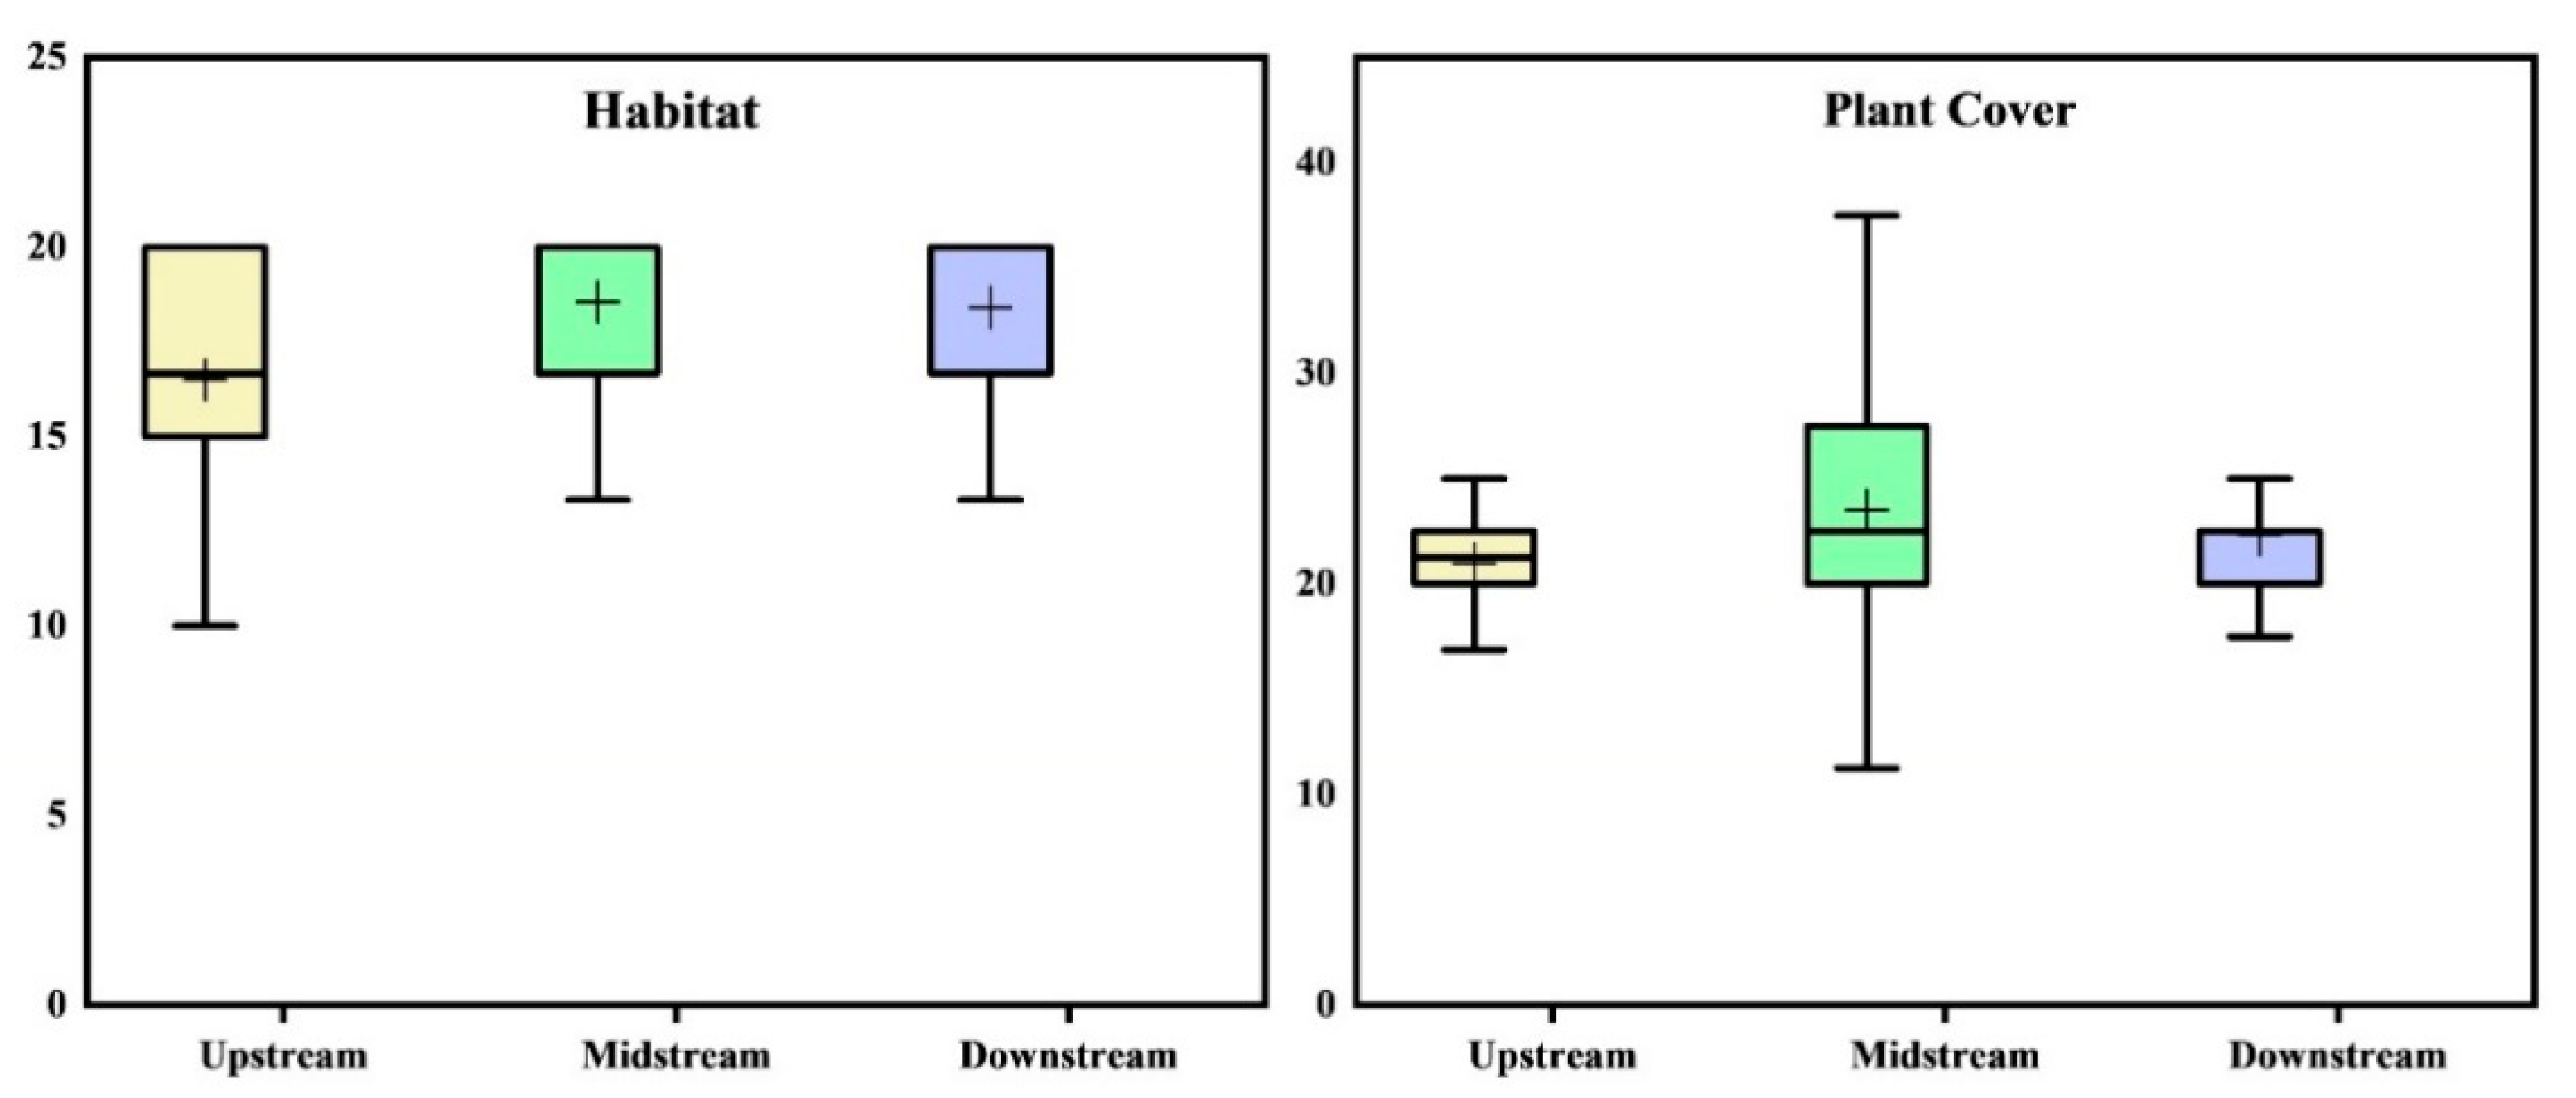
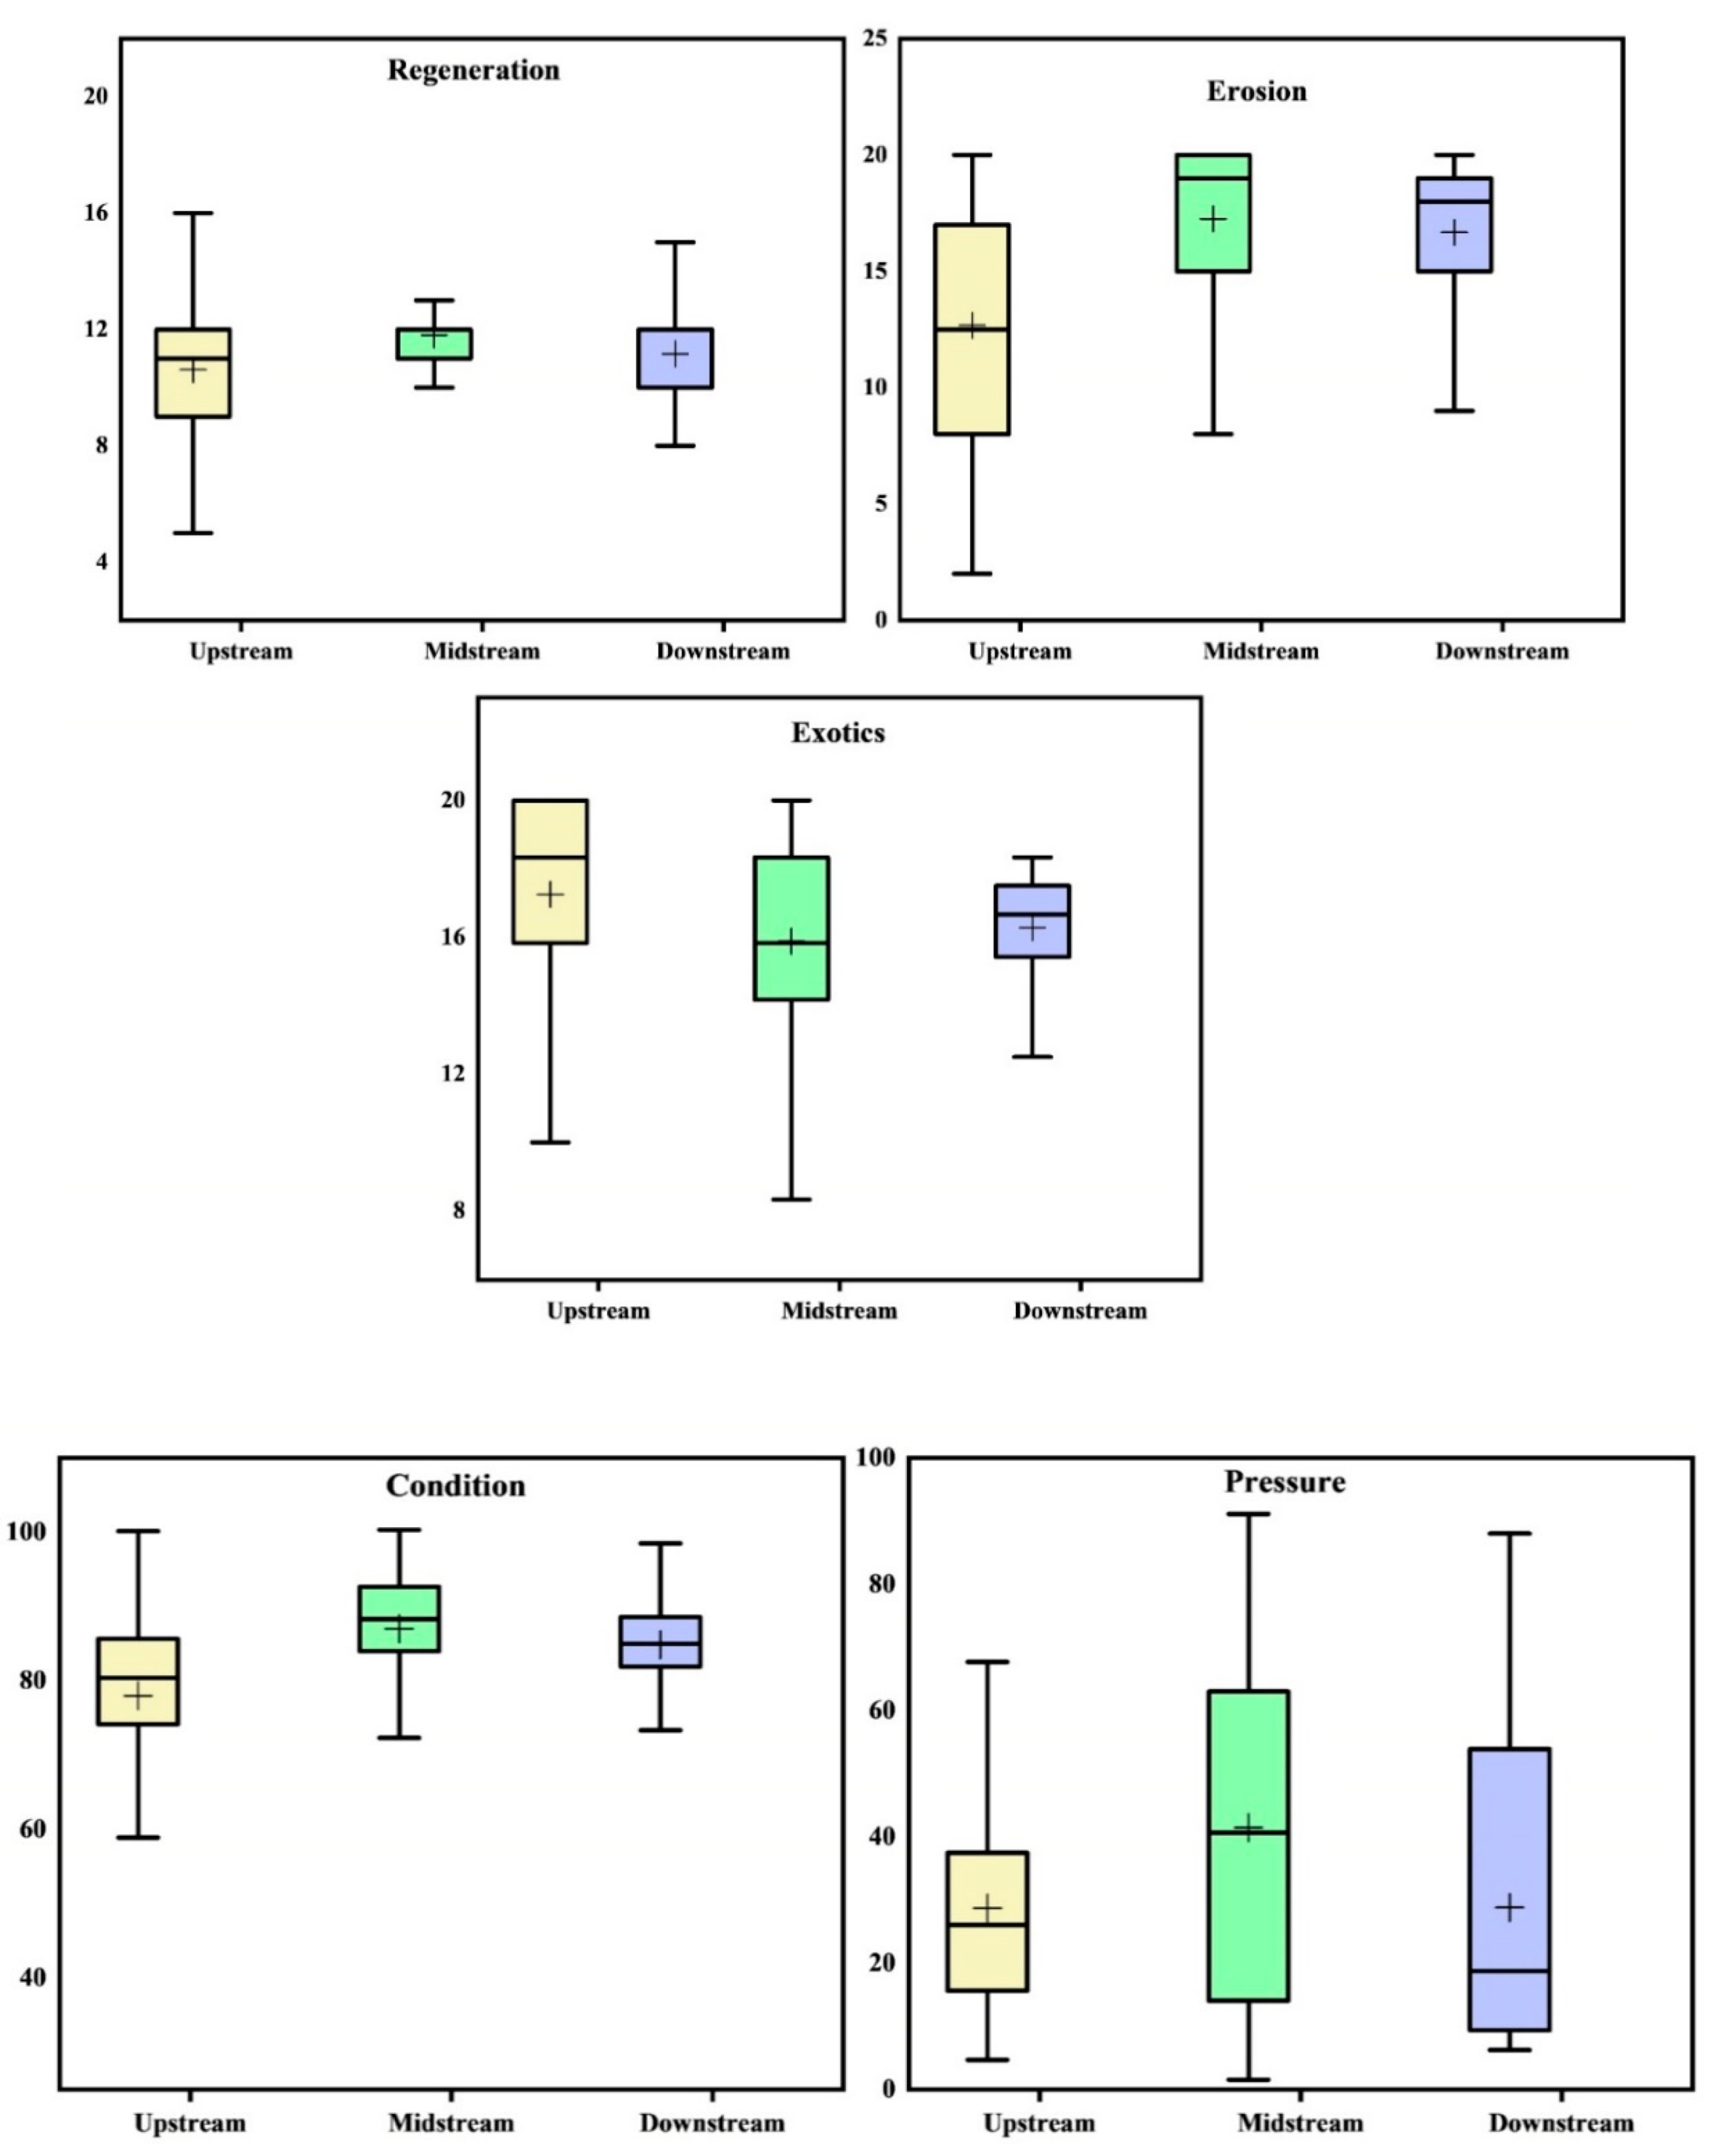
3.1. Total Riparian Condition Index

The total riparian scores (%), based on 27 RHIs, were calculated and compared separately for upstream, midstream, and downstream riparian zones of the TGDR. Differences in RHIs were examined and distinguished from their relative total score percentage. The total riparian scores were ranging (minimum%–maximum%) differently, with 67.64–89.84% (transect−1) for upstream, 81.87–90.14% (transect−1) for midstream and 80.44–88.19% (transect−1) for downstream, respectively. The total scores on average were highest in transects of the midstream, whereas the lowest scores were observed in transects of the upstream (more information available in supplementary S1, Figures S1–S6). More specifically, habitat scores derived from three RHIs (longitudinal continuity, the width of riparian vegetation, and proximity to the nearest patch) were 12.50–17.28% for upstream transects, 16.57–19.85% for midstream transects and 16.90–19.34% for downstream transects. The overall average highest scores in habitat were thus identified from the midstream transects. In contrast, the lowest scores in habitat were noted from the upstream transects. For plant cover, total scores attained from eight RHIs (vegetation cover, canopy cover, understory cover, grass cover, organic litter, large trees, logs, and vegetation continuity) were 15.94–31.75% for upstream transects, 20.00–29.00% for midstream transects, and 19.56–25.51% for downstream transects, respectively. Likewise, the overall average highest scores for plant cover were found from the midstream transects, which is in contrast to its lowest scores from the upstream transects. Regeneration scores derived from five RHIs (vegetation health, tree size classes, dominant tree regeneration, other tree regeneration, and dominant grass regeneration) were 8.75–12.67% for upstream transects, 10.17–14.23% for midstream transects, as well as 9.66–12.42% for downstream transects. The average highest and lowest score pattern of regeneration was similar to that of plant cover. Erosion scores derived from five RHIs (exposed soil, exposed tree roots, slumping, gullying, and undercutting) were 8.41–20.00% for upstream transects, 14.28–19.83% for midstream transects and 15.63–18.88% for downstream transects, respectively. The overall average scores of erosion also showed the same pattern as that of plant cover in terms of the relative highest and lowest scores. Exotic scores derived from six RHIs (understory exotic cover, grass exotic cover, exotic litter, high impact exotics, high-impact exotic distribution, and vegetation exotic) were 13.33–19.69% for upstream transects, 12.90–17.43% for midstream transects and 16.12–16.98% for downstream transects. Apparently, exotic scores were relatively highest from the upstream transects, while being lowest from the midstream transects. Exotic indicators were functional in most of the sites, and their effects can be noticed in every transect.

3.2. Total Riparian Pressure Index

A similar method has been exercised for pressure scores (13 indicators) for riparian zones in the TGDR. The total pressure scores were estimated separately for the upstream, midstream, and downstream zones. The total pressure scores were relatively highest in the transects of midstream, whereas the lowest scores were observed from the transects of downstream (more information in supplementary S1, Figure S7). Results showed that total pressure scores ranged differently, with 23.10–36.47% for upstream transects, 8.17–56.59% for midstream transects and 14.32–42.00% for downstream transects. Overall, midstream transects had the highest average pressure scores along with the highest riparian health condition scores. Very interestingly, upstream transects had relatively low pressure scores along with the low scores in riparian health conditions as well.
As shown in Table 3, there was a significant difference across the three zones regardless of the index (all p < 0.01 with an exception of PC at p < 0.05) in the TGDR. Thus, Box and whisker plots were used to compare the RHIs and pressure indicators (Figure 4). Results showed that upstream transects had the lowest mean relative habitat status as compared to midstream and downstream transects in riparian zones of the TGDR. For plant cover, both the lowest as well as the highest mean status were observed in the midstream riparian transects. These riparian zones were also inconsistent as compared to the upstream and downstream, which were relatively more suitable to predict riparian zone conditions. Furthermore, the lowest and also the highest mean relative regeneration status were observed in the upstream riparian zones, and these zones were inconsistent in status as well. However, relative consistency was observed in the status of midstream zones, which had a higher prediction ratio about riparian zone status. In parallel, all zones had similar highest mean relative erosion status, which is alarming from erosion perspective. The lowest mean relative status was estimated in the upstream riparian zones. Whereas, relative consistency was assessed in the downstream riparian zones. Similarly, higher inconsistency in status was noticed in the exotic mean relative status of riparian zones in the whole TGDR. Even so, these zones had almost similar highest mean relative condition status, but were having differences in lower mean relative condition status. Relative consistency was assessed in the downstream riparian zones, whereas relative inconsistency was displayed in the upstream. Box and whisker plot results were compelling for the mean relative pressure status of TGDR riparian zones. The significant differences in the relative mean and median were seen in all zones and their subsets. By comparing between three zones, relatively higher inconsistency was measured in the midstream, whereas relative consistency was recorded in the upstream riparian zones.
Before conducting Pearson’s correlation analysis, Kruskal-Wallis test was applied to reveal the statistically significant differences for each subset within these 3 areas (Table 3). As shown by the Kruskal-Wallis test, habitat (indicated by H) was significantly different across the downstream (0.000 ***), midstream (0.000 ***) (both at p < 0.001), and upstream (0.012 *) (p < 0.05) transects. Similarly, results of this analysis also showed significant difference (at p < 0.01) for the plant cover (indicated by PC), regeneration (indicated by R), erosion (indicated by Er) and exotics (indicated by Ex) in the three subsets of the riparian zones, except for PC in the upstream and Ex in the downstream, respectively. Moreover, it was also not statistically significant for total condition scores (indicated by C) and total pressure scores (indicated by P) from the upstream. Still, it presented significant differences (at p < 0.01 or at p < 0.05) for the remaining subsets.

3.3. Relationship between Riparian Health Indicators and Pressure Indicators

Our results confirmed statistically significant differences in most of the tested indicators, and provided the reason to conduct further analysis. The areas of non-significance showed the homogeneity, to some extent, in the situation of the riparian zones in the TGDR.
The quantitative result showed an interesting correlation between both indicator categories (condition and pressure) surveyed from upstream, midstream and downstream transects, and between individual indicators within each category and subset of the riparian zone. These relationships are summarized as below:
Considering the riparian condition, the associations between RHIs – mostly significant (at p < 0.01 or at p < 0.05) (|r| ≤ 0.936), except for the regeneration; we found positive correlation, in most of the situations, for H (r ≤ 0.689), PC (r ≤ 0.936), Er (r ≤ 0.882) and Ex (r ≤ 0.921) (Table 4). These relationships were chiefly highest in upstream transects of riparian zones. The lowest correlation strength was observed in midstream transects. The highest correlation strength was noticed from the indicators of PC, Ex and Er, whereas the lowest was recognized from the indicators of H. During the analysis, we found some indicators (such as PC3a, PC3c, PC4, PC5, R1, R3, R4, Ex1a, Ex1c) were not significant at all (supplementary S2, Tables S1–S5).
As regards the associations between pressure indicators—always significant at (at p < 0.01) (|r| ≤ 0.971), we found both positive (r ≤ 0.971) and inverse (r ≤ −0.496) correlation between pressure indicators (Table 4). The highest correlations were demonstrated in downstream transects, whereas, the comparative lowest correlation was determined in upstream transects. However, some indicators showed a higher correlation as compared to other indicators (such as P3a, P8a, P8b, P8C, P9 and P10). In the same way, three pressure indicators (P3b, P4 and P6) were also not significant from the transects of riparian zones in the TGDR (supplementary S2, Tables S1–S5).
At the final stage, quantitative relationships were conducted between the indicators of pressure and condition, existed within riparian zones of the TGDR. Significant correlations (at p < 0.01 or at p < 0.05) (r = −0.464–0.645) were detected between the indicators of P with indicators of H, PC, R, Er and Ex. The results illustrated that P was correlated with H and ranging over as (r = −0.464–0.513), with PC as (r = −0.348–0.459), with R as (r = −0.349–0.484), with Er as (r = −0.395–0.645) and with Ex as (r = −0.349–0.381) (Table 4). The highest relative correlation strength was determined mostly from the upstream transects, whereas the lowest was generally in the downstream transects. Pressure indicators were found to influence significantly higher on erosion and habitat parameters, and moderate on plant cover, exotics, and regeneration parameters. Some pressure indicators displayed a higher correlation with RHIs as compared to other indicators (such as P1, P2, P3a, P8a, P8b, P8C, P9 and P10). However, the correlation was not significant between a couple of pressure indicators (P3b, P4, P6) and condition indicators (PC3a, PC3c, PC4, PC5, R1, R3, R4, Ex1a, Ex1c).

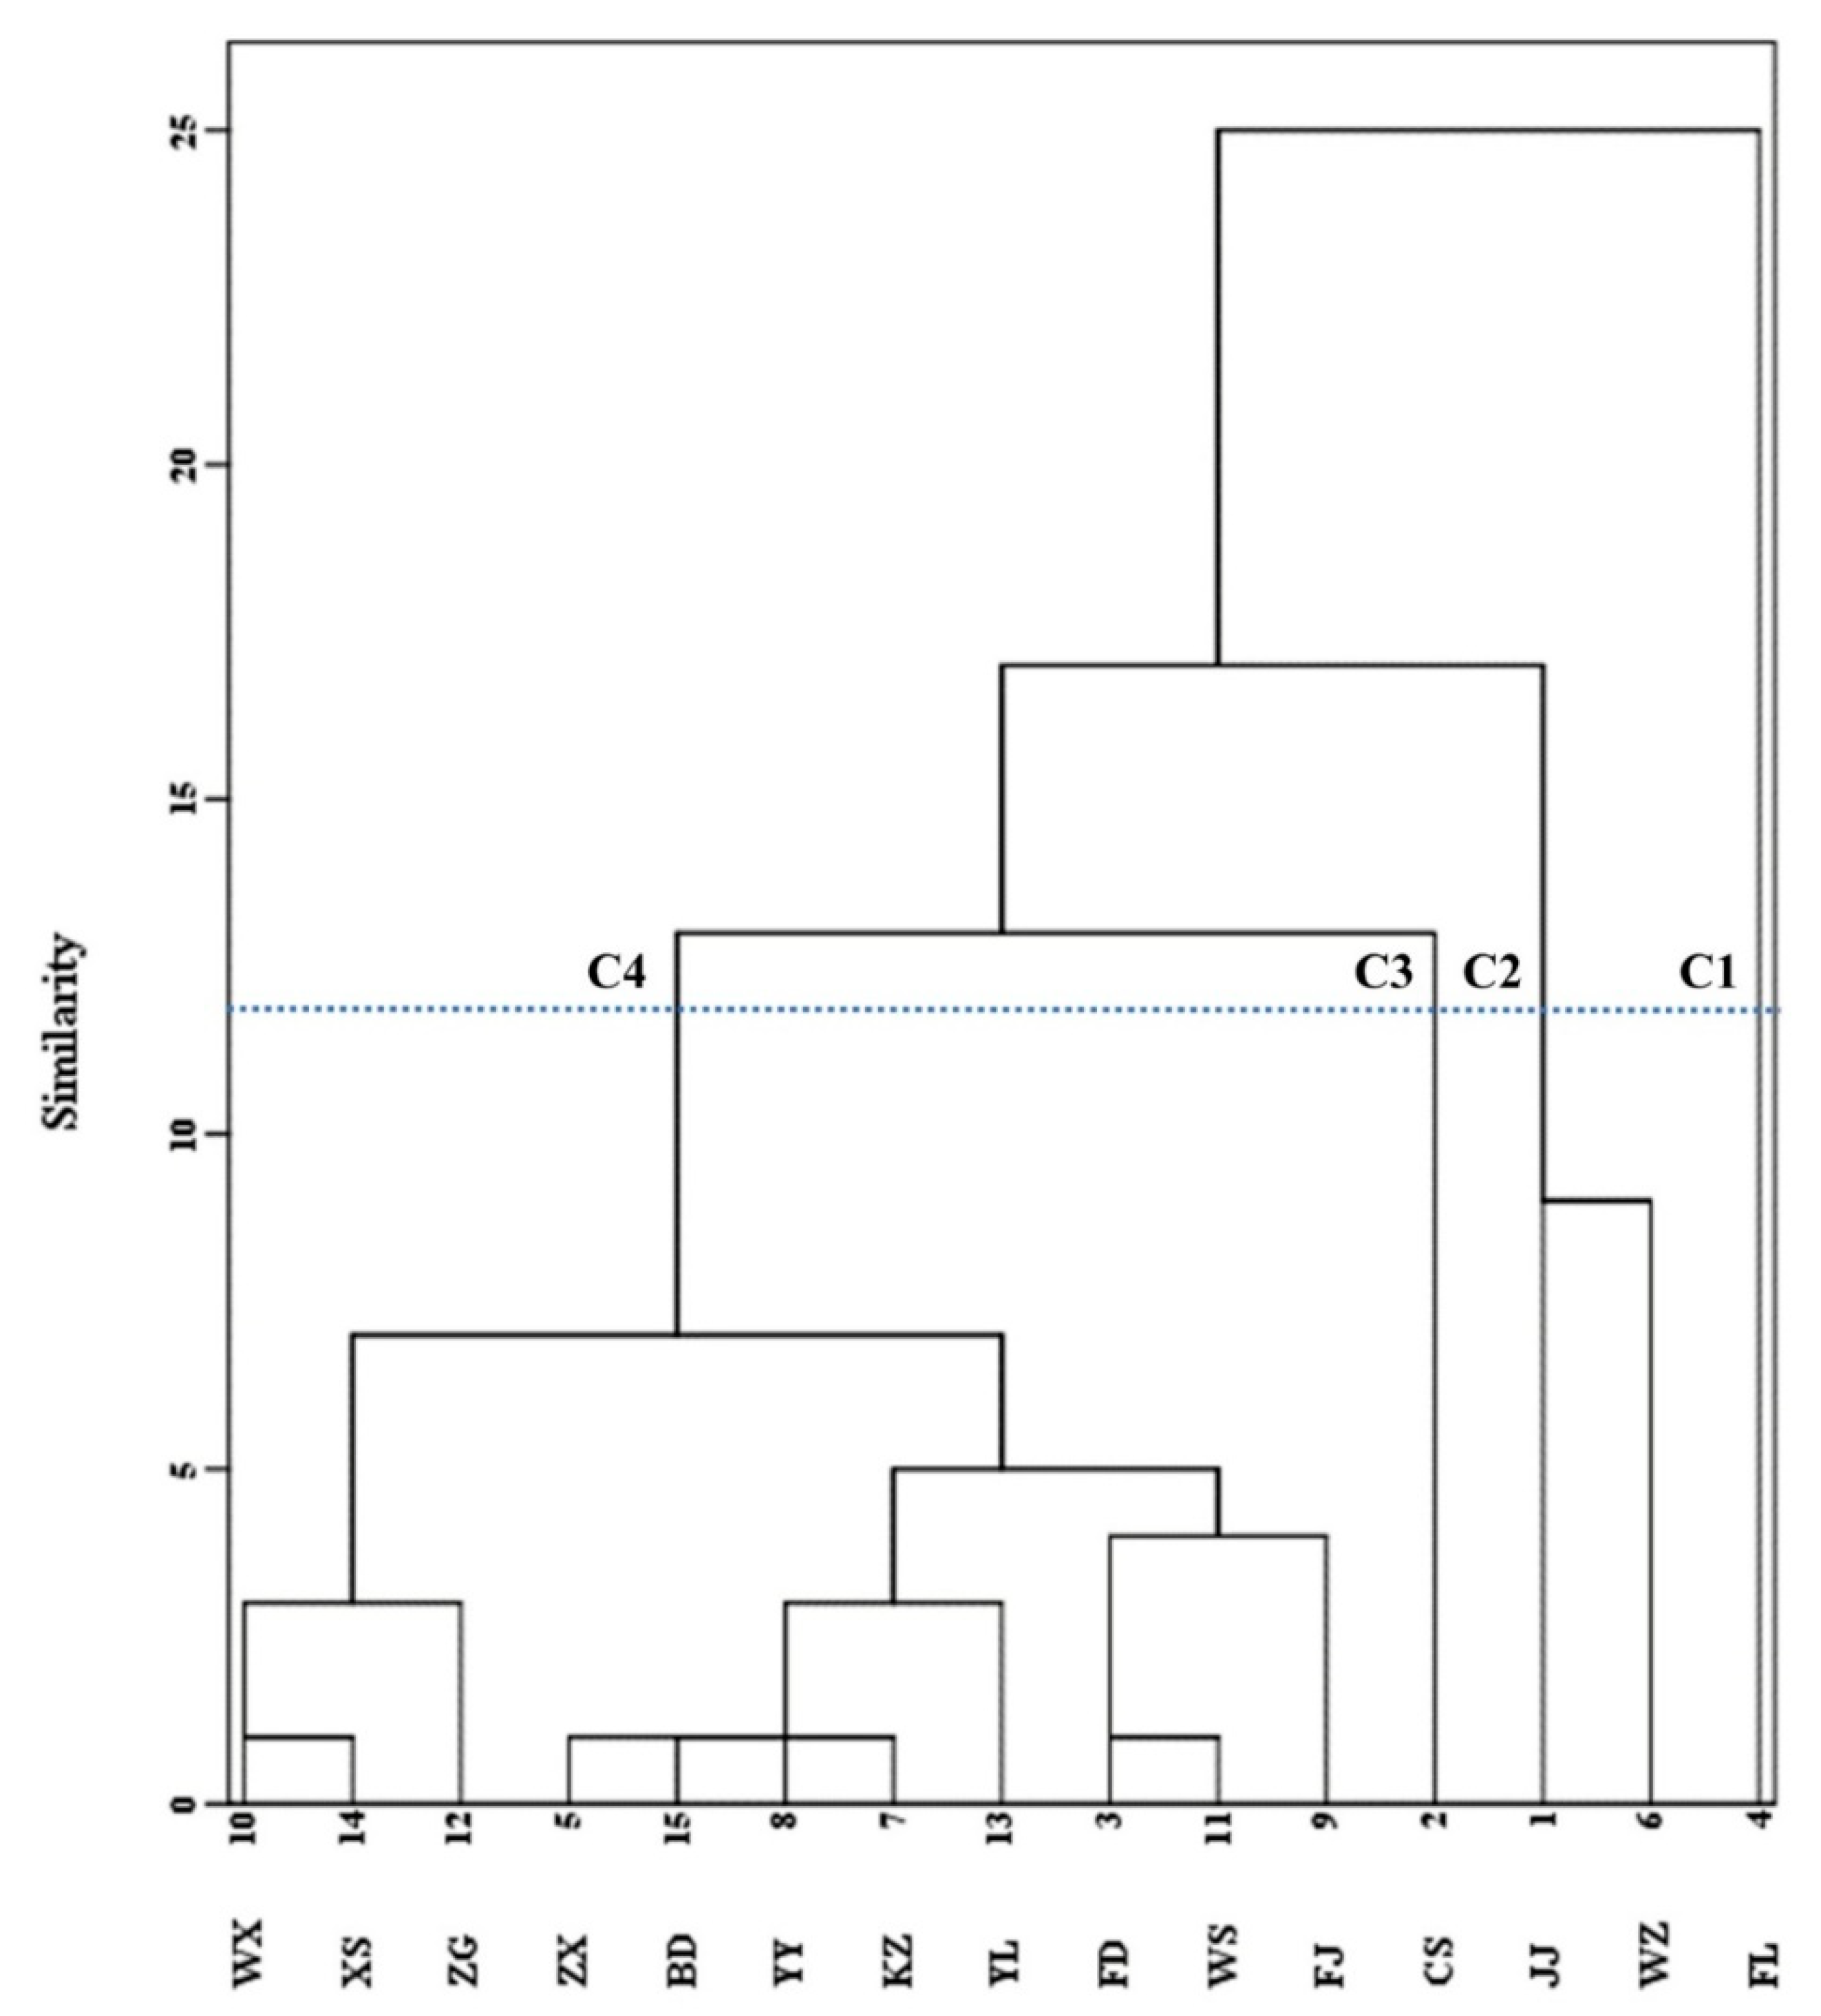
3.4. Analysis of Similarity among Groups of Counties

AHC analysis identified four groups of counties with a high level of similarity. The first group, indicated as C1 in Figure 5, included only upstream (20) transects. The second group, specified as C2, comprised of upstream and midstream transects, and the majority of transects belonged to midstream areas (20 out of 25). The third group contained transects (8) only from the upstream area again and designated as C3. Remaining all transects fell under group four, indicated as C4 (Figure 5).

4. Discussion

This study conducted a large-scale investigation of riparian zone conditions and pressure distribution patterns within TGDR territory. The condition and pressure scores were assessed from the entire reservoir basin by the rapid appraisal method. The results indicated that riparian zone conditions, including habitat, plant cover, regeneration, erosion, and exotic subsets, were the main factors affecting the pattern of conditional distribution within the TGDR. The situation of riparian health was superior in the midstream over downstream and upstream areas. It was better in the midstream as a result of the relatively higher performance of habitat, plant cover, regeneration, erosion and exotic parameters together. The condition of upstream transects was inconsistent as a result of deterioration of habitat and plant cover parameters, mainly due to the higher impact of erosion and exotic parameters. Considering the subsets of condition, the functioning of habitat, plant cover and regeneration parameters was higher in the midstream as well, but erosion showed a lower impact in midstream transects over upstream and downstream transects. However, the exotic impact was restively higher in the upstream transects. The reason behind these differences might be attributed to diverse geomorphology and human factors [5,6]. Our research results are consistent with earlier findings, indicating that the diversity of riparian zone condition is subject to the unique geographical location and different pressure indicators of a particular basin [17,46]. The research sites are located in the riparian zones of the TGDR region, falling in Southwest China [4,27,29,44,45,52]. The natural environment of the riparian zone has changed due to pressure indicators within the mountainous region, and this variation continues and has been highlighted in previous studies [4,21]. Due to its unique geographical circumstances and heterogeneous vegetation characteristics, the riparian zones of the TGDR has a diverse condition and pressure pattern [27,52].
In addition to the impact of geographical circumstances, pressure activities can also affect the pattern of distribution of riparian zone conditions in any area. This study found that the construction of the TGDR was the main driving factor that affects the pattern of vegetation distribution. Land changes are associated with dam construction, which can significantly alter river features and further vegetation distribution [53,54,55,56], and thus undermine ecosystem integrity while increasing habitat vulnerability [57]. The World Wildlife Fund (WWF) (2019) also highlights the fact that the Yangtze River, a key contributor of the TGDR, is one of the world’s most polluted waterways and one of the world’s high-pressure rivers because of its significant contribution to China’s GDP. The Yangtze River Basin provides about half of China’s fish, two-thirds of rice, and agriculture along with industries contribute up to 40% of China’s entire-economy [58]. The human can control pressure activities, and such steps will be helpful for sustainable land uses as well as the management of riparian areas.
Riparian zones are important natural corridors that help rivers for continuous flow of energy and materials and for the conservation of biodiversity [59]. The riparian areas are highly sensitive to changes in the pressure indicators [46] and the hydrological system [57], and are good indicators of environmental changes within the reservoir [60]. The interaction of pressure indicators with riparian zone condition is complex and unique between different watersheds [55]. The short-term response to the conditions associated with man-made pressure is always different from long-term effects [61]. The study found that stress exerted by different indicators on riparian conditions of the TGDR was mainly caused by high-pressure activities related to the operation of the dam. Old parts of the riparian zone have been replaced by the inundated area, and with this process, most of the native vegetation has disappeared [4,21,55,57].
In the long run, pressure indicators in reservoir region will continue to affect the conditions of riparian buffer areas and succession of the plants, leading to some riparian conditions being altered or even deteriorated along with the vegetation degradation from dam areas [55]. The pressure impact index developed in this study can correctly predict the RHIs changes, and their pattern of distribution existed within larger dam areas. The difference in condition results shows that the risk of habitat loss or change was caused by the post-operating pressure indicators after the construction of the reservoir that alters land use differently. In a deep reservoir that traverses the riparian areas, the flooding process after the dam construction primarily affects the vertical connection of buffer-zone biodiversity along elevation gradients [62]. Considering all possible circumstances, we anticipated changes in condition distribution patterns of the pressure-related riparian areas in different situations, that grouped as the upstream, midstream and downstream in the TGDR. In RHIs, the most endangered indicators were the shrubs and woody communities in riparian habitats along this reservoir. In spite of that, our assessment found that some shrubs and woody plants (i.e., Coriaria nepalensis, Glochidion puberum, Rhus chinensis, Koelreuteria bipinnata, Salix matsudana, Taxodium ascendens and Taxodium distichum) exist in the form of small seedlings, thanks to their stronger germination capacity, and their short growth cycle is consistent with flooding habitats in the TGDR [4,21,23,27,45]. The majority of sites were fully covered with grasses, and vegetation health of the grasses was impressive. Most of the riparian areas were dominated by herbaceous plants such as Cynodon dactylon, Bidens Pilosa, Xanthium sibiricum, Bidens frondosa, Elymus dahuricus, and Alternanthera philoxeroides [4,27,45]. In this regard, it was also verified that dam construction could promote the invasion of exotic species, such as Alternanthera philoxeroides, Bidens frondosa and Bidens Pilosa in TGDR riparian areas [23,45]. This is consistent with other researches that dam construction promotes the invasion of exotic/introduced plant species [57,63].
The effect of pressure indicators on the TGDR riparian zone condition is more complicated than that of average size or small dams. The pressure effect was relatively highest in the midstream transects as compared to downstream and upstream transects. This situation is interesting for the future research perspective. Although midstream transects had better conditions versus highest pressure, upstream transects showed different situations, further indicating that the effect of pressure indicators and the response of RHIs should be analyzed after some intervals so as to timely evaluate the effectiveness of policies and management tools. The effects of pressure and reaction mechanisms at the upstream riparian areas of the TGDR are different from those in the midstream and downstream riparian regions. These effects on the distribution of conditions in the riparian areas may be permanent changes related to the nature of pressure indicators. The effect of each group in the distribution of riparian zone conditions may be a dynamic interaction associated with changes in that particular group pressure indicators [57]. At the peak levels of activities, pressures vary significantly, leading to different zone conditions, depending on the nature of the riparian ecosystem function, rather than on the natural hydrological system [64]. The major affected areas, such as in the upstream, exhibited severe responses than lower effected ones, such as in the downstream. The nature of the relationship is complex, mostly depending on the pressure index, and its impacts are adverse. Erosion indicators were working in most of the sites within riparian zones of the TGDR, and exposed soil, along with active slumping, gullying and undercutting showed higher on the lower bank areas [17]. The impacts of flow regulation in terms of erosion can be noticed in riparian zones of the TGDR [9,10,11,34]. During the whole survey, the research team did not find prominent fire and wild animal damage. As these riparian zones fall in a humid-subtropical monsoon climate region, these results are thus reliable for fire perspectives.
In this study, Pearson’s correlation matrix was used to explore the effects of pressure on changing conditions between different riparian zones within the TGDR. We found that these pressure indicators in different riparian areas may react inversely, even having similar circumstances. There was a general tendency of pressure distribution and condition changes associated with reservoir structural patterns. The pressure results heightened the condition fragmentation and changed the distribution pattern (longitude and latitude) within the riparian zones of this reservoir. Taking into account the environmental safety of the entire basin, this study helps to decrease the complexity of pressure types that cause habitat loss in conditions of the riparian zones. This is consistent with the findings of other researches [53,55,65,66]. On the contrary, we found that the situations of pressure and condition distribution were different than those of other riparian zones, as highlighted by other studies [46].
We found dissimilar (statistically mostly significant) mean condition scores (including habitat, plant cover, regeneration, erosion and exotic parameters) and mean pressure scores in upstream, midstream and downstream transects along with their subsets. However, in some subsets, we were unable to detect statistically significant difference in mean condition scores and mean pressure scores (Table 3), mainly depending on their status [67]. These results also indicate that riparian zone conditions are not always affected by similar pressure indicators [68]. The riparian zones of upstream showed higher structural changes and even aggressive responses to pressure indicators, allowing for rapid changes in RHIs [67]. Similarly, the condition status of riparian areas can be persistent [68], which means that sometimes individual health indicators are not directly affected by pressure indicators. As long as pressure indicators in a particular area do not cause significant and long-term changes in the buffer zone, leading to establishment situations, riparian conditions should not change significantly [68]. This research established a strong dependence on the riparian zone condition versus pressure on indicator factors (Table 4). We evidenced that degree of comparisons (measured by Pearson’s correlation) is the basic mechanism for changing association between pressure and condition in the riparian areas, because the relationship between pressure and condition varies from groups and their subsets, and each group displays a relatively constant pattern (Table 4), possibly due to area circumstance restrictions [69]. Indicators commonly lead to buffer zone distortion [70], which bring structural variation and interrupt the efficiency that affects the riparian zone condition of the reservoir.
AHC revealed strong similarities between the groups of midstream and downstream transects, except one county, and all investigated transects exist in the same cluster group (4). However, upstream transects demonstrated a high degree of dissimilarities, which might have well explained the reason about why upstream transects fall in all four key cluster groups (C1, C2, C3 and C4). In fact, the upstream riparian zone comprised of four counties in this research, and each county falls in each cluster group. However, the analysis revealed that midstream and downstream transacts were showing similar riparian health and pressure situations. These results are in line with other comparable studies [35,36], that different transects can show a similar pattern, and the pattern depends on related circumstances. Furthermore, the upstream riparian zone was found to be different when considering diverse geomorphology and human factors [5,6].
Overall, this study investigated the effects of pressure indicators on RHIs and the response of RHIs to these activities over their geographical locations in the TGDR. Riparian land use of the TGDR is changing, and there is a need to document the land-use effect on the riparian zone condition. Future research may also examine the same indicators by considering their land-use types of riparian zones in the TGDR. Dissimilar land use possibly has different impacts on the riparian zone condition, and the effects of pressure indicators could be different as well. Thus, researchers ought to explore these mechanisms in newly formed riparian areas. New results can help the administrators of reservoirs to plan and manage such a massive reservoir with comprehensive information.

5. Conclusions

The present study evaluated the direct influence of pressure indicators on health indicators (habitat, plant cover, regeneration, erosion and exotics parameters) in riparian zones within the TGDR (by categorizing upstream, midstream and downstream transects). Compared to these zonations, pressure indicators were found to influence mostly significantly on RHIs. Considering the condition, associations between riparian health indicators were mostly significant, except for the regeneration parameters. We found a positive correlation between habitat, plant cover, erosion and exotics parameters. These relationships were primarily highest in the upstream transects, whereas the lowest correlation strength was observed in the midstream transects. The associations between pressure indicators were always significant, and we found both positive and inverse correlation. The comparative highest correlations were found in the downstream transects, whereas, the relative lowest correlation was determined from the upstream transects. The associations were correlated significantly between pressure versus condition indicators, and high coefficients were found for the majority of the correlations. The comparative highest correlation strength was determined, mostly, from the transects of the upstream, whereas the relative lowest was, generally, in the downstream transects. However, the correlation was not significant among a couple of pressure indicators and condition indicators. The results of Agglomerative Hierarchical Cluster analysis confirmed the substantial dissimilarity in the upstream transects, whereas significant similarities observed between midstream and downstream transects. Thus, this study highlighted the importance of sustainable utilization of big dams, needed to mitigate the pressure risks, that have strongly influenced the riparian zone functioning and ecology, and it can completely change the conditions as well. This means that direct, simple and quantitative linkages between pressure versus condition indicators exist in the riparian zones of the TGDR; these relationships between riparian zone condition adjustments are specific for the transect locations with respect to their groups and subsets. Overall, the quantitative approach of this analysis reveals a better comprehension of pressure indicators and condition response in very constrained riparian transect locations within the TGDR.

Supplementary Materials

The following materials are available online at https://www.mdpi.com/1999-4907/11/2/214/s1. Supplementary S1, Figures S1–S7: Field-Based Assessment Scores of Riparian Health Indicators and Pressure Indicators for the Three Gorges Dam Reservoir, China; Pearson’s Correlation Matrix S2, Tables S1–S5: Pearson’s Correlation Matrix among and between Couples of Pressure Indicators and Condition Indicators in the Three Gorges Dam Reservoir, China.

Author Contributions

Conceptualization: M.A. and C.L.; data curation: M.A., C.L., Z.J., W.C., and P.S.M.; formal analysis: M.A. and S.Z.; funding acquisition. C.L.; methodology: M.A. and C.L.; project administration: C.L.; resources: C.L.; software: M.A. and S.Z.; supervision: C.L.; validation: M.A., S.Z. and C.L.; visualization: M.A. and Z.J.; writing—original draft: M.A.; writing—review and editing: C.L., M.A., S.Z., W.C., and P.S.M. All authors have read and agreed to the published version of the manuscript.

Funding

This research was financially supported by the Chongqing Municipality Key Forestry Research Project (No. TD2019-2), Chongqing Municipality Housing and Urban Construction Committee (No. Chengkezi 2019-1-4-2), Forestry Extension Project of China Central Finance (No. Yulinketui 2017-12) and International Sci-Tech Cooperation Project of Ministry of Science and Technology (No. 2015DFA90900).

Acknowledgments

Special thanks are extended to the representatives of the TGDR management unit, Chongqing immigration management office, and local townships and communities for their assistance during the entire research process. We are grateful to three anonymous reviewers and the editor for their valuable comments and also to Rami Y. Khalil, Research Fellow of Biodiversity International for language improvement.

Conflicts of Interest

The authors declare no conflict of interest. The funding sponsors had no role in the design of the study, in the collection, analysis, or interpretation of data and the writing of the manuscript.

References

  1. Luke, S.H.; Slade, E.M.; Gray, C.L.; Annammala, K.V.; Drewer, J.; Williamson, J.; Agama, A.L.; Ationg, M.; Mitchell, S.L.; Vairappan, C.S.; et al. Riparian buffers in tropical agriculture: Scientific support, effectiveness and directions for policy. J. Appl. Ecol. 2019, 56, 85–92. [Google Scholar] [CrossRef]
  2. Allan, J.D. Landscapes and Riverscapes: The Influence of Land Use on Stream Ecosystems. Annu. Rev. Ecol. Evol. Syst. 2004, 35, 257–284. [Google Scholar] [CrossRef] [Green Version]
  3. Décamps, H.; Naiman, R.J. The Ecology and Management of Aquatic-Terrestrial Ecotones, 1st ed.; Taylor & Francis: London, UK, 1990. [Google Scholar]
  4. Ren, Q.; Li, C.; Yang, W.; Song, H.; Ma, P.; Wang, C.; Schneider, R.L.; Morreale, S.J. Revegetation of the riparian zone of the Three Gorges Dam Reservoir leads to increased soil bacterial diversity. Environ. Sci. Pollut. Res. 2018, 25, 23748–23763. [Google Scholar] [CrossRef] [PubMed]
  5. Wohl, E. The significance of small streams. Front. Earth Sci. 2017, 11. [Google Scholar] [CrossRef]
  6. Rodrigues, V.; Estrany, J.; Ranzini, M.; de Cicco, V.; Martín-Benito, J.M.T.; Hedo, J.; Lucas-Borja, M.E. Effects of land use and seasonality on stream water quality in a small tropical catchment: The headwater of Córrego Água Limpa, São Paulo (Brazil). Sci. Total Environ. 2018, 622–623, 1553–1561. [Google Scholar] [CrossRef] [PubMed] [Green Version]
  7. Ferreira Marmontel, C.V.; Lucas-Borja, M.E.; Rodrigues, V.A.; Zema, D.A. Effects of land use and sampling distance on water quality in tropical headwater springs (Pimenta creek, São Paulo State, Brazil). Sci. Total Environ. 2018, 622–623, 690–701. [Google Scholar] [CrossRef] [PubMed] [Green Version]
  8. Zema, D.A.; Bombino, G.; Denisi, P.; Lucas-Borja, M.E.; Zimbone, S.M. Evaluating the effects of check dams on channel geometry, bed sediment size and riparian vegetation in Mediterranean mountain torrents. Sci. Total Environ. 2018, 642, 327–340. [Google Scholar] [CrossRef]
  9. Castillo, V.; Mosch, W.; García, C.C.; Barberá, G.; Cano, J.N.; López-Bermúdez, F. Effectiveness and geomorphological impacts of check dams for soil erosion control in a semiarid Mediterranean catchment: El Cárcavo (Murcia, Spain). Catena 2007, 70, 416–427. [Google Scholar] [CrossRef]
  10. García, C.; Rafael, G.-L. Effectiveness of check dams in the control of general transitory bed scouring in semiarid catchment areas (South-East Spain). Water Environ. J. 2008, 23, 1–14. [Google Scholar] [CrossRef]
  11. Ramos-Diez, I.; Navarro-Hevia, J.; Fernández, R.S.M.; Díaz-Gutiérrez, V.; Mongil-Manso, J. Geometric models for measuring sediment wedge volume in retention check dams. Water Environ. J. 2016, 30, 119–127. [Google Scholar] [CrossRef]
  12. Ramos-Diez, I.; Navarro-Hevia, J.; San Martín Fernández, R.; Díaz-Gutiérrez, V.; Mongil-Manso, J. Evaluating methods to quantify sediment volumes trapped behind check dams, Saldaña badlands (Spain). Int. J. Sediment Res. 2017, 32, 1–11. [Google Scholar] [CrossRef]
  13. Bombino, G.; Gurnell, A.; Tamburino, V.; Zema, D.; Zimbone, S. Sediment size variation in torrents with check dams: Effects on riparian vegetation. Ecol. Eng. Ecol. Eng. 2008, 32, 166–177. [Google Scholar] [CrossRef]
  14. Ramos-Diez, I.; Navarro Hevia, J.; San Martín, R.; Díaz, V.; Mongil, J. Analysis of methods to determine the sediment retained by check dams and to estimate erosion rates in badlands. Environ. Monit. Assess. 2016, 188. [Google Scholar] [CrossRef]
  15. Ferreira, M.; Aguiar, F.; Nogueira, C. Changes in Riparian woods over space and time: Influence of environment and land use. For. Ecol. Manag. 2005, 212, 145–159. [Google Scholar] [CrossRef]
  16. Jansen, A. Rapid appraisal of riparian condition: Scaling up from on-ground measurement to remote sensing. In Proceedings of the Australian Stream Management Conference, Launceston, Tasmania, Australia, 19–22 October 2004; pp. 313–319. [Google Scholar]
  17. Johansen, K.; Phinn, S.; Dixon, I.; Douglas, M.; Lowry, J. Comparison of image and rapid field assessments of riparian zone condition in Australian tropical savannas. For. Ecol. Manag. 2007, 240, 42–60. [Google Scholar] [CrossRef]
  18. Naiman, R.J.; Décamps, H. The Ecology of Interfaces: Riparian Zones. Annu. Rev. Ecol. Syst. 1997, 28, 621–658. [Google Scholar] [CrossRef] [Green Version]
  19. Begg, G.; Van Dam, R.; Lowry, J.; Finlayson, C.; Walden, D. Inventory and risk assessment of water dependent ecosystems in the Daly basin, Northern Territory, Australia. Superv. Sci. Rep. 2001, 162, 1–107. [Google Scholar]
  20. Wang, C.; Xie, Y.; He, Y.; Li, X.; Yang, W.; Li, C. Growth and Physiological Adaptation of Salix matsudana Koidz. to Periodic Submergence in the Hydro-Fluctuation Zone of the Three Gorges Dam Reservoir of China. Forests 2017, 8, 283. [Google Scholar] [CrossRef] [Green Version]
  21. Ren, Q.; Song, H.; Yuan, Z.; Ni, X.; Li, C. Changes in Soil Enzyme Activities and Microbial Biomass after Revegetation in the Three Gorges Reservoir, China. Forests 2018, 9, 249. [Google Scholar] [CrossRef] [Green Version]
  22. Lytle, D.A.; Poff, N.L. Adaptation to natural flow regimes. Trends Ecol. Evol. 2004, 19, 94–100. [Google Scholar] [CrossRef]
  23. Jian, Z.; Ma, F.; Guo, Q.; Qin, A.; Xiao, W. Long-term responses of riparian plants’ composition to water level fluctuation in China’s Three Gorges Reservoir. PLoS ONE 2018, 13, e0207689. [Google Scholar] [CrossRef] [PubMed]
  24. Wu, J.; Huang, J.; Han, X.-G.; Gao, X.; He, F.; Jiang, M.; Jiang, Z.; Primack, R.; Shen, Z. The Three Gorges Dam: An Ecological Perspective. Front. Ecol. Environ. 2004, 2, 241–248. [Google Scholar] [CrossRef]
  25. Liu, Z.; Cheng, R.; Xiao, W.; Guo, Q.; Wang, N. Effect of Off-Season Flooding on Growth, Photosynthesis, Carbohydrate Partitioning, and Nutrient Uptake in Distylium chinense. PLoS ONE 2014, 9, e107636. [Google Scholar] [CrossRef] [PubMed]
  26. Fan, D.; Gao-Ming, X.; Zhang, A.; Xi, L.I.U.; Zong-Qiang, X.I.E.; Zhao-Jia, L.I. Effect of water-lever regulation on species selection for ecological restoration practice in the water-level fluctuation zone of Three Gorges Reservoir. Chin. J. Plant Ecol. 2015, 39, 416–432. [Google Scholar] [CrossRef]
  27. Wang, C.; Li, C.; Wei, H.; Xie, Y.; Han, W. Effects of Long-Term Periodic Submergence on Photosynthesis and Growth of Taxodium distichum and Taxodium ascendens Saplings in the Hydro-Fluctuation Zone of the Three Gorges Reservoir of China. PLoS ONE 2016, 11, e0162867. [Google Scholar] [CrossRef]
  28. Lu, Z.-J.; Li, L.-F.; Jiang, M.-X.; Huang, H.-D.; Bao, D.-C. Can the soil seed bank contribute to revegetation of the drawdown zone in the Three Gorges Reservoir Region? Plant Ecol. 2010, 209, 153–165. [Google Scholar] [CrossRef]
  29. Yang, Y.; Li, C. Photosynthesis and growth adaptation of Pterocarya stenoptera and Pinus elliottii seedlings to submergence and drought. Photosynthetica 2016, 54, 120–129. [Google Scholar] [CrossRef]
  30. Mayer, P.M.; Reynolds, S.K., Jr.; McCutchen, M.D.; Canfield, T.J. Meta-analysis of nitrogen removal in riparian buffers. J. Environ. Qual. 2007, 36, 1172–1180. [Google Scholar] [CrossRef]
  31. Norman, L.M.; Brinkerhoff, F.; Gwilliam, E.; Guertin, D.P.; Callegary, J.; Goodrich, D.C.; Nagler, P.L.; Gray, F. Hydrologic Response of Streams Restored with Check Dams in the Chiricahua Mountains, Arizona. River Res. Appl. 2016, 32, 519–527. [Google Scholar] [CrossRef] [Green Version]
  32. Guyassa, E.; Frankl, A.; Zenebe, A.; Poesen, J.; Nyssen, J. Effects of check dams on runoff characteristics along gully reaches, the case of Northern Ethiopia. J. Hydrol. 2017, 545, 299–309. [Google Scholar] [CrossRef] [Green Version]
  33. Gao, G.; Ma, Y.; Fu, B. Multi-temporal scale changes of streamflow and sediment load in a loess hilly watershed of China. Hydrol. Process. 2016, 30, 365–382. [Google Scholar] [CrossRef] [Green Version]
  34. Ramos-Diez, I.; Navarro-Hevia, J.; San Martín Fernández, R.; Mongil-Manso, J. Final Analysis of the Accuracy and Precision of Methods to Calculate the Sediment Retained by Check Dams. Land Degrad. Dev. 2017, 28, 2446–2456. [Google Scholar] [CrossRef]
  35. Bombino, G.; Boix-Fayos, C.; Gurnell, A.; Tamburino, V.; Zema, D.; Zimbone, S. Check dam influence on vegetation species diversity in mountain torrents of the Mediterranean environment. Ecohydrology 2014, 7, 678–691. [Google Scholar] [CrossRef]
  36. Bombino, G.; Zema, D.A.; Denisi, P.; Lucas-Borja, M.E.; Labate, A.; Zimbone, S.M. Assessment of riparian vegetation characteristics in Mediterranean headwaters regulated by check dams using multivariate statistical techniques. Sci. Total Environ. 2019, 657, 597–607. [Google Scholar] [CrossRef]
  37. Werren, G.; Arthington, A. The assessment of riparian vegetation as an indicator of stream condition, with particular emphasis on the rapid assessment of flow-related impacts. Landsc. Health Qld. 2002, 14653, 194–222. [Google Scholar]
  38. Chessman, B. Assessing the Conservation Value and Health of New South Wales Rivers: The PBH (Pressure-Biota-Habitat) Project; NSW Department of Land and Water Conservation: Parramatta, Australia, 2002.
  39. Ward, T.; Tate, K.; Atwill, E. Visual Assessment of Riparian Health. Rangeland Monitoring Series, Publication 8089; University of California, Division of Agriculture and Natural Resources: Oakland, CA, USA, 2003. [Google Scholar]
  40. Davis, P.A.; Staid, M.I.; Plescia, J.B.; Johnson, J.R. Evaluation of Airborne Image data for Mapping Riparian Vegetation within the Grand Canyon. Report 02-470; U.S. Geological Survey: Flagstaff, AZ, USA, 2002; 65p.
  41. Dowling, R.; Accad, A. Vegetation classification of the riparian zone along the Brisbane River, Queensland, Australia, using light detection and ranging (lidar) data and forward looking digital video. Can. J. Remote Sens. 2003, 29, 556–563. [Google Scholar] [CrossRef]
  42. Johansen, K. Mapping Structural Parameters and Species Composition of Riparian Vegetation Using IKONOS and Landsat ETM+ Data in Australian Tropical Savannahs. Photogramm. Eng. Remote Sens. 2006, 72, 71–80. [Google Scholar] [CrossRef]
  43. Johansen, K.; Phinn, S. Linking riparian vegetation spatial structure in Australian tropical savannas to ecosystem health indicators: Semi-variogram analysis of high spatial resolution satellite imagery. Can. J. Remote Sens. 2006, 32, 228–243. [Google Scholar] [CrossRef]
  44. Sang, C.; Zheng, Y.; Zhou, Q.; Li, D.; Liang, G.; Gao, Y. Effects of water impoundment and water-level manipulation on the bioaccumulation pattern, trophic transfer and health risk of heavy metals in the food web of Three Gorges Reservoir (China). Chemosphere 2019, 232, 403–414. [Google Scholar] [CrossRef]
  45. Yang, F.; Wang, Y.; Chan, Z. Perspectives on Screening Winter-Flood-Tolerant Woody Species in the Riparian Protection Forests of the Three Gorges Reservoir. PLoS ONE 2014, 9, e108725. [Google Scholar] [CrossRef]
  46. Dixon, I.; Douglas, M.; Dowe, J.; Burrows, D. Tropical Rapid Appraisal of Riparian Condition Version 1 (for use in tropical savannas). River Management Technical Guidelines No. 7; Land and Water Australia: Canberra, Australia, 2006. [Google Scholar]
  47. Dixon, I.H.; Douglas, M.M.; Dowe, J.L.; Burrows, D.W.; Townsend, S.A. A rapid method for assessing the condition of riparian zones in the wet/dry tropics of northern Australia. In Proceedings of the Fourth Australian Stream Management Conference, Launceston, Australia, 20–22 October 2006. [Google Scholar]
  48. Johansen, K.; Phinn, S.; Lowry, J.; Douglas, M. Quantifying indicators of riparian condition in Australian tropical savannas: Integrating high spatial resolution imagery and field survey data. Int. J. Remote Sens. 2008, 29, 7003–7028. [Google Scholar] [CrossRef]
  49. Lanzanova, D.; Whitney, C.; Shepherd, K.; Luedeling, E. Improving development efficiency through decision analysis: Reservoir protection in Burkina Faso. Environ. Model. Softw. 2019, 115, 164–175. [Google Scholar] [CrossRef]
  50. Whitney, C.W.; Lanzanova, D.; Muchiri, C.; Shepherd, K.D.; Rosenstock, T.S.; Krawinkel, M.; Tabuti, J.R.S.; Luedeling, E. Probabilistic Decision Tools for Determining Impacts of Agricultural Development Policy on Household Nutrition. Earth’s Future 2018, 6, 359–372. [Google Scholar] [CrossRef]
  51. Bewick, V.; Cheek, L.; Ball, J. Statistics review 7: Correlation and regression. Crit. Care 2003, 7, 451–459. [Google Scholar] [CrossRef] [Green Version]
  52. Yang, S.L.; Milliman, J.D.; Xu, K.H.; Deng, B.; Zhang, X.Y.; Luo, X.X. Downstream sedimentary and geomorphic impacts of the Three Gorges Dam on the Yangtze River. Earth-Sci. Rev. 2014, 138, 469–486. [Google Scholar] [CrossRef]
  53. Nilsson, C.; Svedmark, M. Basic Principles and Ecological Consequences of Changing Water Regimes: Riparian Plant Communities. Environ. Manag. 2002, 30, 468–480. [Google Scholar] [CrossRef]
  54. Stave, J.; Oba, G.; Stenseth, N.C.; Nordal, I. Environmental gradients in the Turkwel riverine forest, Kenya: Hypotheses on dam-induced vegetation change. For. Ecol. Manag. 2005, 212, 184–198. [Google Scholar] [CrossRef]
  55. New, T.; Xie, Z. Impacts of large dams on riparian vegetation: Applying global experience to the case of China’s Three Gorges Dam. Biodivers. Conserv. 2008, 17, 3149–3163. [Google Scholar] [CrossRef]
  56. Tealdi, S. Modeling the impact of river damming on riparian vegetation. J. Hydrol. 2011, 396, 302–312. [Google Scholar] [CrossRef]
  57. Li, J.; Dong, S.; Yang, Z.; Peng, M.; Liu, S.; Li, X. Effects of cascade hydropower dams on the structure and distribution of riparian and upland vegetation along the middle-lower Lancang-Mekong River. For. Ecol. Manag. 2012, 284, 251–259. [Google Scholar] [CrossRef]
  58. WWF. The Yangtze. Available online: https://www.wwf.org.uk/where-we-work/places/yangtze (accessed on 11 October 2019).
  59. Nilsson, C.; Jansson, R. Floristic differences between riparian corridors of regulated and free-flowing boreal rivers. Regul. Rivers Res. Manag. 1995, 11, 55–66. [Google Scholar] [CrossRef]
  60. Nilsson, C.; Berggren, K. Alterations of Riparian Ecosystems Caused by River Regulation: Dam operations have caused global-scale ecological changes in riparian ecosystems. How to protect river environments and human needs of rivers remains one of the most important questions of our time. BioScience 2000, 50, 783–792. [Google Scholar] [CrossRef]
  61. Nilsson, C.; Jansson, R.; Zinko, U. Long-Term Responses of River-Margin Vegetation to Water-Level Regulation. Science 1997, 276, 798. [Google Scholar] [CrossRef] [PubMed]
  62. Van looy, K.; Honnay, O.; Bossuyt, B.; Hermy, M. The effects of river embankment and forest fragmentation on the plant species richness and composition of floodplain forests in the Meuse Valley, Belgium. Belg. J. Bot. 2004, 136, 97–108. [Google Scholar] [CrossRef]
  63. Merritt, D.; Cooper, D. Riparian vegetation and channel change in response to river regulation: A comparative study of regulated and unregulated streams in the Green River Basin, USA. Regul. Rivers Res. Manag. 2000, 16, 543–564. [Google Scholar] [CrossRef]
  64. Richter, B.; Thomas, G. Restoring Environmental Flows by Modifying Dam Operations. Ecol. Soc. 2007, 12. [Google Scholar] [CrossRef]
  65. Petts, G.E.; Gurnell, A.M. Dams and geomorphology: Research progress and future directions. Geomorphology 2005, 71, 27–47. [Google Scholar] [CrossRef]
  66. Rood, S. Riparia: Ecology, Conservation, and Management of Streamside Communities. Bioscience 2006, 56. [Google Scholar] [CrossRef] [Green Version]
  67. Biswas, S.R.; Mallik, A.U.; Braithwaite, N.T.; Biswas, P.L. Effects of disturbance type and microhabitat on species and functional diversity relationship in stream-bank plant communities. For. Ecol. Manag. 2019, 432, 812–822. [Google Scholar] [CrossRef]
  68. Lamb, E.G.; Mallik, A.U.; Mackereth, R.W. The early impact of adjacent clearcutting and forest fire on riparian zone vegetation in northwestern Ontario. For. Ecol. Manag. 2003, 177, 529–538. [Google Scholar] [CrossRef]
  69. Biswas, S.R.; Mallik, A.U. Disturbance effects on species diversity and functional diversity in riparian and upland plant communities. Ecology 2010, 91, 28–35. [Google Scholar] [CrossRef] [PubMed]
  70. Mallik, A.U.; Newaz, S.; Mackereth, R.W.; Shahi, C. Geomorphic changes of headwater systems 3–23 years after forest harvesting by clearcutting. Ecosphere 2011, 2, 1–14. [Google Scholar] [CrossRef]
Figure 1. Location of sample sites in the Three Gorges Dam Reservoir, China.
Forests 11 00214 g001
Figure 2. Diagram of a four-stage protocol for eliciting expert knowledge when designing the decision for different conditions and pressure indicators of riparian zones in the Three Gorges Dam Reservoir, China. In the first phase, the decisions of the whole group on different conditions and pressures of riparian zones of the TGDR were divided into specific sub-questions. In the second phase, participants were divided into working groups to deal with different issues. In the third stage, the model produced by the working group was assimilated into a standardized model, one per preliminary sub-question. In the fourth phase, the integrated sub-model was assimilated into a conceptual model.
Forests 11 00214 g002
Figure 3. Diagram of the process of expert calibration training for indicators estimation when parameterizing a decision for different condition and pressure of riparian zones in the Three Gorges Dam Reservoir, China.
Forests 11 00214 g003
Figure 4. Box and whisker plots for riparian health indicators and pressure indicators measured at upstream, midstream and downstream transects in the Three Gorges Dam Reservoir, China. The y-axis denotes the total score (%). The black horizontal line represents the median, whereas the plus sign symbolizes the mean. The boxes represent the 25th–75th percentiles, and the whiskers outside the boxes represent the 10th–90th percentiles. The circles beyond the whiskers represent an outlier, whereas the asterisks beyond the whiskers mean extreme cases from the upper or lower edge of the box. Note: significant at p <0.05 of the Kruskal-Wallis test.
Forests 11 00214 g004aForests 11 00214 g004b
Figure 5. Dendrogram provided by agglomerative hierarchical cluster (AHC) analysis applied to the riparian health indicators and pressure indicators measured in upstream, midstream and downstream transects in 15 counties in the Three Gorges Dam Reservoir, China.
Forests 11 00214 g005
Table 1. Details of sampling sites located in counties along with the number of transects and main characteristics in the Three Gorges Dam Reservoir, China.
County NameJiang Jin (JJ)Chang Shou (CS)Feng Du (FD)Fu Ling (FL)Zhong Xian (ZX)Wan Zhou (WZ)Kai Zhou (KZ)Yun Yang (YY)Feng Jie (FJ)Wu Xi (WX)Wu Shan (WS)Zi Gui (ZG)Yi Ling (YL)Xing Shan (XS)Ba Dong (BD)
County number123456789101112131415
Total transects581720272021222462120181119
Streams transectsUpstream Transects50Midstream Transects141 Downstream Transects68
Characteristics
Climate (average ± one standard deviation)
Average annual air temperature (°C)17.5 ± 1.2
Average annual rainfall depth (mm)1160.9 ± 118.7
Morphology
Area (km2)3008.1 ± 713.9
Maximum altitude (m˖ a.s.l)1926.7 ± 683.8
Minimum altitude (m˖ a.s.l)115.2 ± 45.0
Length of main stream (km)68.1 ± 29.3
Land use
Main riparian land useBroad-leaved forest, mixed forest, cropland, gardening
The main aspect of vegetationWoodland, cropland
Main vegetation associationCynodon dactylon, Xanthium sibiricum, Cyperus rotundus
Soil
Main textureYellow soil, yellow-brown soil, grey-brown soil, dark-brown soil, purple soil, moisture soil, paddy soil, lime soil
Main typeHigh soil exchange and salt saturation
Main lithologyLimestone
Source: Chongqing Municipal People’s Government, China (2019).
Table 2. Riparian health indicators (RHIs) and pressure indicators adopted (measuring 40 indicators in 259 transects distributed within 15 counties) in the Three Gorges Dam Reservoir, China.
Effect IndexEffect Sub-IndexIndicator NameIndicator CodeScore
Condition (C)Habitat (H)Longitudinal continuityH10–4
Width of riparian vegetationH20–4
Proximity to the nearest patchH30–4
Plant cover (PC)Vegetation coverPC10–4
Canopy coverPC20–4
Understory coverPC3a0–4
Grass cover PC3b0–4
Organic litterPC3c0–4
Large treesPC40–4
Logs PC50–4
Vegetation continuityPC60–4
Regeneration (R)Vegetation healthR10–4
Tree size classesR20–4
Dominant tree regenerationR30–4
Other tree regenerationR40–4
Dominant grass regenerationR50–4
Erosion (Er)Exposed soilEr10–4
Exposed tree rootsEr20–4
Slumping Er3a0–4
Gullying Er3b0–4
UndercuttingEr3c0–4
Exotics (Ex)Understory exotic coverEx1a0–4
Grass exotic coverEx1b0–4
Exotic litterEx1c0–4
High impact exoticsEx20–4
High impact exotic distributionEx30–4
Vegetation exoticsEx40–4
Pressure (P)Pressure (P)Bank stability: bank sediment particle sizeP10–4
Bank stability: bank slopeP20–4
Animals: managedP3a0–4
Animals: unmanagedP3b0–4
Fire P40–4
Tree clearingP50–4
Flow regime: large damsP60–4
Bank stability: instream structuresP70–4
Land use pattern: other than conditionsP8a0–4
Farming systemP8b0–4
Agricultural crop residualP8c0–4
Pollutants activitiesP90–4
Other environmental unfriendly activitiesP100–4
Source: RHIs by Dixon et al. [46,47], Johansen et al. [17]; RHIs functions by Naiman and Decamps [18].
Table 3. Statistical significance of differences (performed by Kruskal-Wallis test) in RHIs and pressure indices/sub-indices in the Three Gorges Dam Reservoir, China.
Indicator IndexStream Transects Across Three ZonesTransect Group
UpstreamMidstreamDownstream
ConditionH0.000 **0.012 *0.000 **0.000 **
PC0.021 **0.2330.000 **0.003 **
R0.008 **0.030 *0.000 **0.000 **
Er0.000 **0.001 **0.000 **0.010 **
Ex0.000 **0.000 **0.000 **0.078
C (total condition)0.000 **0.2160.006 **0.025 *
PressureP (total pressure)0.002 **0.3710.000 **0.035 *
** significant at p < 0.01; * significant at p < 0.05.
Table 4. Pearson’s correlation matrix ranges (minimum–maximum) among and between couples of RHIs and pressure indicators (measured in 259 transects distributed within 15 counties) of riparian zones in the Three Gorges Dam Reservoir, China.
IndicatorsPressure (P) vs. Condition (C)
UpstreamMidstreamDownstream
Habitat (H)H vs. H −0.004–0.689 **0.207 *–0.270 **0.274 *–0.293 *
P vs. H−0.464 **–0.513 **−0.290 **–0.267 **−0.376 **–0.249 *
P vs. P−0.407 **–0.878 **−0.273 **–0.882 **−0.496 **–0.971 **
Plant cover (PC)PC vs. PC 0.858 **–0.936 **0.693 **–0.809 **0.682 **–0.827 **
P vs. PC−0.348 *–0.459 **−0.350 **–0.334 **−0.398 **–0.278 *
P vs. P−0.407 **–0.878 **−0.273 **–0.882 **−0.496 **–0.971 **
Regeneration (R)R vs. R0.132–0.1570.025–0.0450.005–0.132
P vs. R−0.349*–0.484 **−0.292 **–0.298 **0.241 *–0.260 *
P vs. P−0.407 **–0.878 **−0.273 **–0.882 **−0.496 **–0.971 **
Erosion (Er)Er vs. Er 0.295 *–0.882 **0.186 *–0.783 **0.326 **–0.622 **
P vs. Er−0.395 **–0.645 **−0.348 **–0.282 **−0.277 *–0.468 **
P vs. P−0.407 **–0.878 **−0.273 **–0.882 **−0.496 **–0.971 **
Exotics (Ex)Ex vs. Ex 0.579 **–0.921 **0.560 **–0.843 **0.266*–0.869 **
P vs. Ex−0.376 **–0.310 *0.195 *–0.356 **−0.349 **–0.381 **
P vs. P−0.407 **–0.878 **−0.273 **–0.882 **−0.496 **–0.971 **
Note: acronyms of indicators are reported in Table 2; Supporting information is available in Supplementary S2, Tables S1–S5; Pearson’s coefficient is reported: in green when they are higher (within a particular group) and significant; in blue when they are medium (within a particular group) and significant; in yellow when they are lower (within a particular group) and significant; without color when they are not significant. ** Correlation is significant at the 0.01 level (two-tailed); * Correlation is significant at the 0.05 level (two-tailed).

