Article

Comparative Transcriptomic Response of Two Pinus Species to Infection with the Pine Wood Nematode Bursaphelenchus xylophilus

by
Daniel Gaspar
1,
Cândida Trindade
2,
Ana Usié
1,3,
Brigida Meireles
1,
Ana Margarida Fortes
4,
Joana Bagoin Guimarães
2,
Fernanda Simões
2,
Rita Lourenço Costa
2,5,* and
António Marcos Ramos
1,3
1
Centro de Biotecnologia Agrícola e Agro-alimentar do Alentejo (CEBAL)/Instituto Politécnico de Beja (IPBeja), 7801-908 Beja, Portugal
2
INIAV—Instituto Nacional de Investigação Agrária e Veterinária, 2780-157 Oeiras, Portugal
3
MED—Mediterranean Institute for Agriculture, Environment and Development, CEBAL—Centro de Biotecnologia Agrícola e Agro-Alimentar do Alentejo, 7801-908 Beja, Portugal
4
Faculdade de Ciências de Lisboa, BioISI, Universidade de Lisboa, Campo Grande, 1749-016 Lisboa, Portugal
5
Centro de Estudos Florestais, Instituto Superior de Agronomia, Universidade de Lisboa—Tapada da Ajuda, 1349-017 Lisboa, Portugal
*
Author to whom correspondence should be addressed.
Forests 2020, 11(2), 204; https://doi.org/10.3390/f11020204
Submission received: 10 January 2020 / Revised: 3 February 2020 / Accepted: 5 February 2020 / Published: 12 February 2020
(This article belongs to the Section Forest Ecology and Management)

Abstract

:
Pine wilt disease (PWD) caused by pine wood nematode (PWN), Bursaphelenchus xylophilus, is a serious threat to global forest populations of conifers, in particular Pinus spp. Recently, the presence of PWN was reported in dead Yunnan pine (Pinus yunnanensis) trees under natural conditions. To further understand the potential impact caused by PWN in Yunnan pine populations, a transcriptional profiling analysis was performed over different time points (0 hours (h), 6 h, 24 h, 48 h, and 7 days) after PWN inoculation. A total of 9961 differentially expressed genes were identified after inoculation, which suggested a dynamic response against the pathogen, with a more intense pattern at 48 h after inoculation. The results also highlighted a set of biological mechanisms triggered after inoculation that provide valuable information regarding the response of Yunnan pine to PWN infection. When compared with maritime pine (Pinus pinaster), the Yunnan pine response was less complex and involved a smaller number of differentially expressed genes, which may be associated with the increased degree of resistance to PWN displayed by Yunnan pine. These results revealed different strategies to cope with PWN infection by these two pine species, which display contrasting degrees of susceptibility, especially in the timely perception of the infection and response magnitude.

1. Introduction

Pine wilt disease (PWD) is one of the main threats to conifer forests worldwide, being responsible for millions of losses every year. The proliferation of PWD has provoked an alarming decline in the populations of some pine species, which negatively impacts the equilibrium of ecosystems and the maintenance of global biodiversity [1]. Moreover, the decrease in wood and resin production also had a tremendous economic impact.
Pine wood nematode (PWN), Bursaphelenchus xylophilus (Steiner and Buhrer) Nickle, is the causal agent of PWD. This parasite, native to North America, is considered a quarantine organism by the European and Mediterranean Plant Protection Organization. The PWN transmission between pine trees is carried out by an insect vector, belonging to the Monochamus genus [2]. Nematodes can be transmitted in two ways: (i) through insect-feeding wounds in the bark of healthy trees, also known as primary transmission; (ii) by oviposition sites in dead or weakened trees, representing a secondary inoculation way [3]. Once inside the trees, they feed and migrate through resin canals, causing serious damages in the xylem tissues [4]. In advanced stages, the pine needles turn brown, the resin flow is suppressed and, consequently, the host tree wilts and dies within a few weeks.
Even though PWN is endemic in North America, the most severe impacts have been observed in non-native pine trees. PWN has spread to Asian pine forests in the early twentieth century, affecting mainly Pinus thunbergii, Pinus densiflora [5], and Pinus massoniana [6]. In 1999, PWN was reported in Portugal, having the maritime pine (Pinus pinaster Ait.) as the main host [7]. This parasite is known to infest a large range of pine species, but different species show distinct levels of susceptibility, which is the reason why they are referenced as tolerant to PWN infection. Within a species, it is possible to identify trees with a contrasting behavior to PWN infection. This is the key factor for the breeding programs carried out in several affected zones. More recently, several studies focused on characterizing the transcriptomic profiles in order to understand the differences in defense mechanisms against PWN infection in species of Pinus with different susceptibilities to PWD [8,9]. In an attempt to control the quick spread of PWN between trees, the major phytosanitary strategy adopted is to monitor the pine sawyer beetle by the use of insecticides in biological traps [10].
Pinus yunnanensis (Franch., 1899), commonly known as Yunnan pine, is a medium-sized pine tree, native to the mountains of southwestern China, covering between 5.5 and 6 million hectares [11]. Yunnan pine is considered a highly important species, not only for the large range of wood and resin applications, but also due to its role in soil conservation and erosion control [12]. A recent study has reported the presence of PWN in dead Yunnan pine trees in natural conditions for the first time [13]. This may represent an increasingly serious threat for the Yunnan pine forest area. However, further studies are required to understand the defensive mechanisms of Yunnan pine in response to PWN infection. In addition, it is also highly relevant to understand the differences, at the transcriptome level, of the response to PWN infection of species with different susceptibilities, such as Yunnan (intermediate) and maritime pine (susceptible) [14].
The aim of the present study was to advance our understanding of the molecular response of Yunnan pine against PWN infection and compare it with the Mediterranean maritime pine response. For this purpose, a set of trees was inoculated with PWN and three different sampling time points after inoculation were defined. Differential expression analyses identified thousands of differentially expressed genes (DEG), revealing potential candidate genes, regulatory networks, and pathways involved in the response to PWN infection. The Yunnan pine response was then compared with the one previously observed in maritime pine.

2. Material and Methods

2.1. Biological Material, Pine Wood Nematode Inoculation, and Sampling

For the present study, a set of 17 potted 3-year-old Yunnan pine trees, obtained from seeds and maintained under natural environmental conditions in a greenhouse, was used. Bursaphelenchus xylophilus culture was reared on Botrytis cinerea grown on PDA (potato dextrose medium). After a significant growth, a suspension of nematodes was transferred to test tubes with 5 mL water and barley grains previously autoclaved. Later, they were incubated for one week at 25 °C and relative humidity of 70% (optimal conditions for nematode growth). Before inoculation, nematodes were extracted from test tubes following the Baermann funnel technique [15]. Prior to inoculation, the culture was placed at 4 °C to stop multiplication and passing from juvenile stage to adult stage.
Yunnan pine tree inoculation procedures were carried out as previously described [16]. In brief, a suspension with 2000 nematodes was pipetted into a small vertical wound (1 cm) made on the upper part of the main pine stem with a sterile scalpel. A sterilized piece of gauze was placed around the wound site and fixed with parafilm to protect the inoculum from drying. This procedure was done in fifteen Yunnan pine plants, while the two remaining plants were used as control (inoculation with sterile water).
Four sampling time points after inoculation were established (6 h, 24 h, 48 h, and 7 days). For each time point, three Yunnan pine plants were collected. Briefly, a small piece of stem tree above the inoculation point was cut and flash frozen at −80 °C for further RNA extraction.

2.2. RNA Extraction, cDNA Synthesis, Library Preparation, and Sequencing

The total RNA extraction from 2 g of ground tissues per plant was performed in accordance with Provost et al. [17]. Then, a DNase treatment was applied following the instructions of the manufacturer (Kit TURBO DNA-free by Thermo Fisher Scientific, Waltham, EUA). A total of four cDNA pools were obtained for the sampling time points (Py1—control; Py2—6 h + 24 h; Py3—48 h; Py4—7 days) using ImProm-IITM Reverse Transcription System protocol kit (Promega, Madison, WI, USA). From each pool, a cDNA library was constructed with the Ion Total RNA-Seq Kit v2 (Thermo Fisher Scientific, Waltham, MA, USA). The constructed libraries were loaded into an Ion PI chip v2, and the transcriptomes were sequenced as single-end reads by the Ion Proton System (Thermo Fisher Scientific, Waltham, MA, USA).

2.3. Pre-Processing RNA-Sequencing Data and Assembly

The quality of the single-end raw reads from the four sequenced libraries was evaluated with FastQC [18] and pre-processed using Sickle [19] to trim/remove poor quality, setting a minimum quality value of 12 and a minimum read length of 80 base pairs (bp). All the pre-processed reads were then used to perform a de novo transcriptome assembly using Trinity [20] with default values. An additional clustering of the assembled contigs was carried out with CAP3 [21], and the resultant assembly was used as the reference transcriptome assembly for the next procedures.

2.4. Prediction of Candidate Coding Regions

The prediction of the candidate coding regions within the reference transcriptome assembly contigs was performed with TransDecoder [22]. The open reading frames (ORF) within the transcripts identified were further scanned for homology to known proteins against the SWISS-PROT [23] and Pfam [24] databases by running BlastP [25] and HmmScan [26], respectively. A final set of candidate coding regions was obtained, representing the basis for the annotation.

2.5. Mapping and Differential Expression Analysis

The pre-processed reads from each library were aligned to the transcriptome assembly contigs after clustering, using RapMap [27]. From the mapping results, the unique mapped reads (UMR) were identified from the BAM files filtering by the tag “NH:i:1”, which is used by RapMap to indicate solely the reads that mapped only once in the reference transcriptome.
The EdgeR package [28] of Bioconductor was used to perform the differential expression analysis. Before the integration of datasets into the statistical model, transcripts with very low expression were filtered out. Then, a trimmed mean of M-values normalization method [29] was applied to normalize library sizes and expression of the remaining transcripts. Given the lack of biological replicates and in accordance with the EdgeR guidelines, a biological coefficient variation (BCV) of 0.1 was assigned [30]. This procedure has been successfully used previously in other studies, for which biological replicates were not available [31]. From the total list of differentially expressed (DE) genes, the most significant were filtered as up- or down-regulated using a false discovery rate (FDR) value ≤0.05 and a Log fold change range ≤−2 to ≥2.

2.6. Quantitative Real-Time PCR Analysis

To evaluate the accuracy and reproducibility of the RNA-sequencing (RNA-Seq) expression profiles, quantitative real-time polymerase chain reaction (qRT-PCR) analysis was performed to analyze the expression levels of six up-regulated genes (thaumatin-like protein, antimicrobial peptide 3, stilbene synthase, MYB-like protein, class IV chitinase, and chlorophyll a-b binding protein) at two different time points (Py3 and Py4).
A first-strand cDNA fragment was synthetized from 1 µg of total RNA, by using ImProm-II TM Reverse Transcription System Kit (Promega), according to manufacturer’s instructions. Relative expression quantification was performed on a QuantStudio 3 Real-Time PCR System (Thermo Fisher Scientific, Waltham, MA, USA), with iTaq Universal SYBR Green Supermix (Bio-Rad). Gene-specific primers, listed in Table S1 (Supplementary Materials), were designed using Primer3 [32] and their specificity confirmed by melting curve analysis. Three technical replicates were run for each experiment, and the mean of cycle threshold (Ct) values for each gene were normalized to the housekeeping gene β-tubulin. Quantitative variation describing the change in expression of the target genes was calculated using the 2−ΔΔCt relative quantitative method [33]. To compare the RNA-Seq and qPCR results, a linear correlation was calculated using the Log2 of the normalized expression values.

2.7. Transcriptome Annotation

InterProScan [34,35] was used to identify the protein domains, gene ontology (GO) terms [36] and KEGG pathways [37] associated with the predicted genes, while the GO analysis was performed with CateGOrizer [38]. In brief, the GOs identified were classified by their corresponding subcategories, Biological Process (BP), Cellular Component (CC), and Molecular Function (MF), against the GO Slim plant database. The predicted genes were also annotated against the non-redundant NCBI plants database using BlastP with an e-value of 1e-5.

2.8. Biological Networks Analysis

Cytoscape [39] was used for visualization of molecular interaction networks. These procedures began by establishing interactions between DEG associated with KEGG pathways and GO terms. We used BiNGO [40] to identify which GOs were statistically overrepresented in our sets of DEG. The results from BiNGO were used as input for the enrichment map to visualize enrichment of specific functions. The statistical analysis was carried out with customized default values, as recommended by the user’s guidelines.

3. Results

3.1. Pre-Processing of RNA-Sequencing Data and Assembly

A total of 169,333,947 raw reads were produced, with an average length of 111 bp, for all sequenced libraries. After trimming low-quality bases with Sickle, 133,270,569 high quality reads were retained (Table 1). The de novo transcriptome assembly performed with Trinity produced a total of 436,525 contigs. To improve accuracy and robustness, an additional clustering step with CAP3 was applied, which reduced the original number of contigs to 306,164, with a total length of 133,362,131 bp (Table S2 shows a summary of the assembly statistics). Using this set of contigs, TransDecoder predicted a total of 82,419 genes.

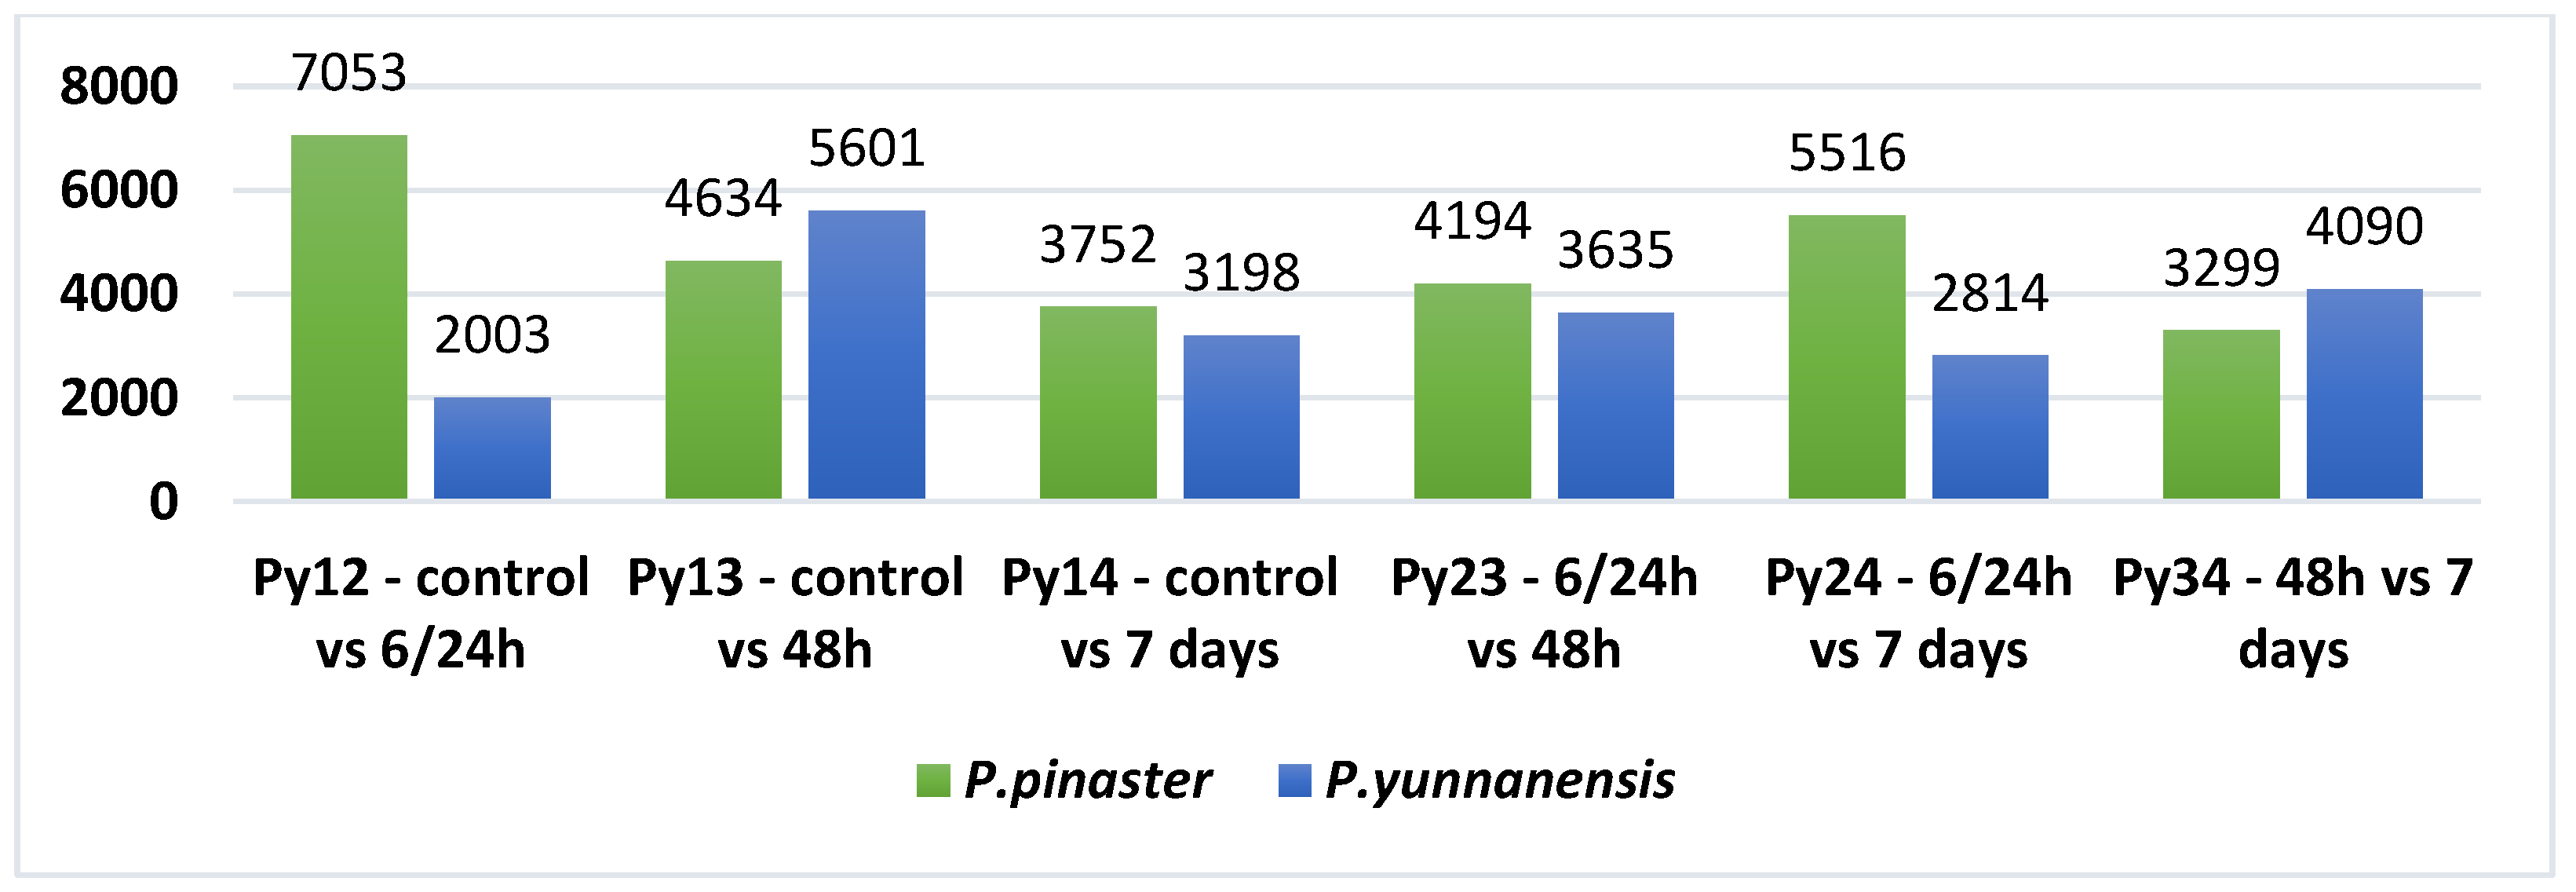
3.2. Mapping and Differential Expression Analysis

High quality reads from the four libraries were aligned to the improved transcriptome assembly contigs using RapMap, which yielded a total of 102,973,624 mapped reads (MR). Only the uniquely mapped reads (UMR) were kept for the downstream analyses (a total of 65,373,230 reads). A summary of the mapping results for each library is presented in Table 2.
To investigate the patterns of the molecular response to PWN infection, differential expression analysis procedures were carried out using EdgeR with a BCV value of 0.1. The final set of DEG was filtered using a log fold change range of ≤−2 to ≥2 and an FDR-adjusted p-value ≤ 0.05, an approach similar to the one previously adopted in Pinus pinaster [8], where the FDR was 0.01. Since one of the goals of this study was to compare the transcriptomic response of Yunnan and maritime pine to PWN infection, results for the maritime pine study were again generated, using the same FDR value as the one used for Yunnan pine (0.05). The numbers of DEG (up- and down-regulated) at different time points and for the two pine species are summarized in Figure 1.
The results showed that the number of DEG was substantially higher in Pinus pinaster (12,504), when compared to Pinus yunnanensis (9961). The largest difference was observed for the comparison control vs. 6/24 h, where 7053 genes were found differentially expressed in Pinus pinaster, of which 3068 were up-regulated and 3985 down-regulated, in contrast to 2003 DEG found in Pinus yunnanensis (1201 and 802 up- and down-regulated genes, respectively). The number of DEG for the control vs. 48 h comparison revealed substantial differences between the first two stages after infection, showing an opposite trend for both species. At this stage, while in maritime pine the number of DEG fell to 4634 (2251 up-regulated and 2383 down-regulated), in Yunnan pine the DEG increased considerably, reaching a total of 5601 genes (2449 up-regulated and 3152 down-regulated). After one week post-infection, the results showed a similar expression pattern between species, with the identification of 3752 (2336 up-regulated and 1416 down-regulated) and 3198 (1903 up-regulated and 1295 down-regulated) DEG in Pinus pinaster and Pinus yunnanensis, respectively.

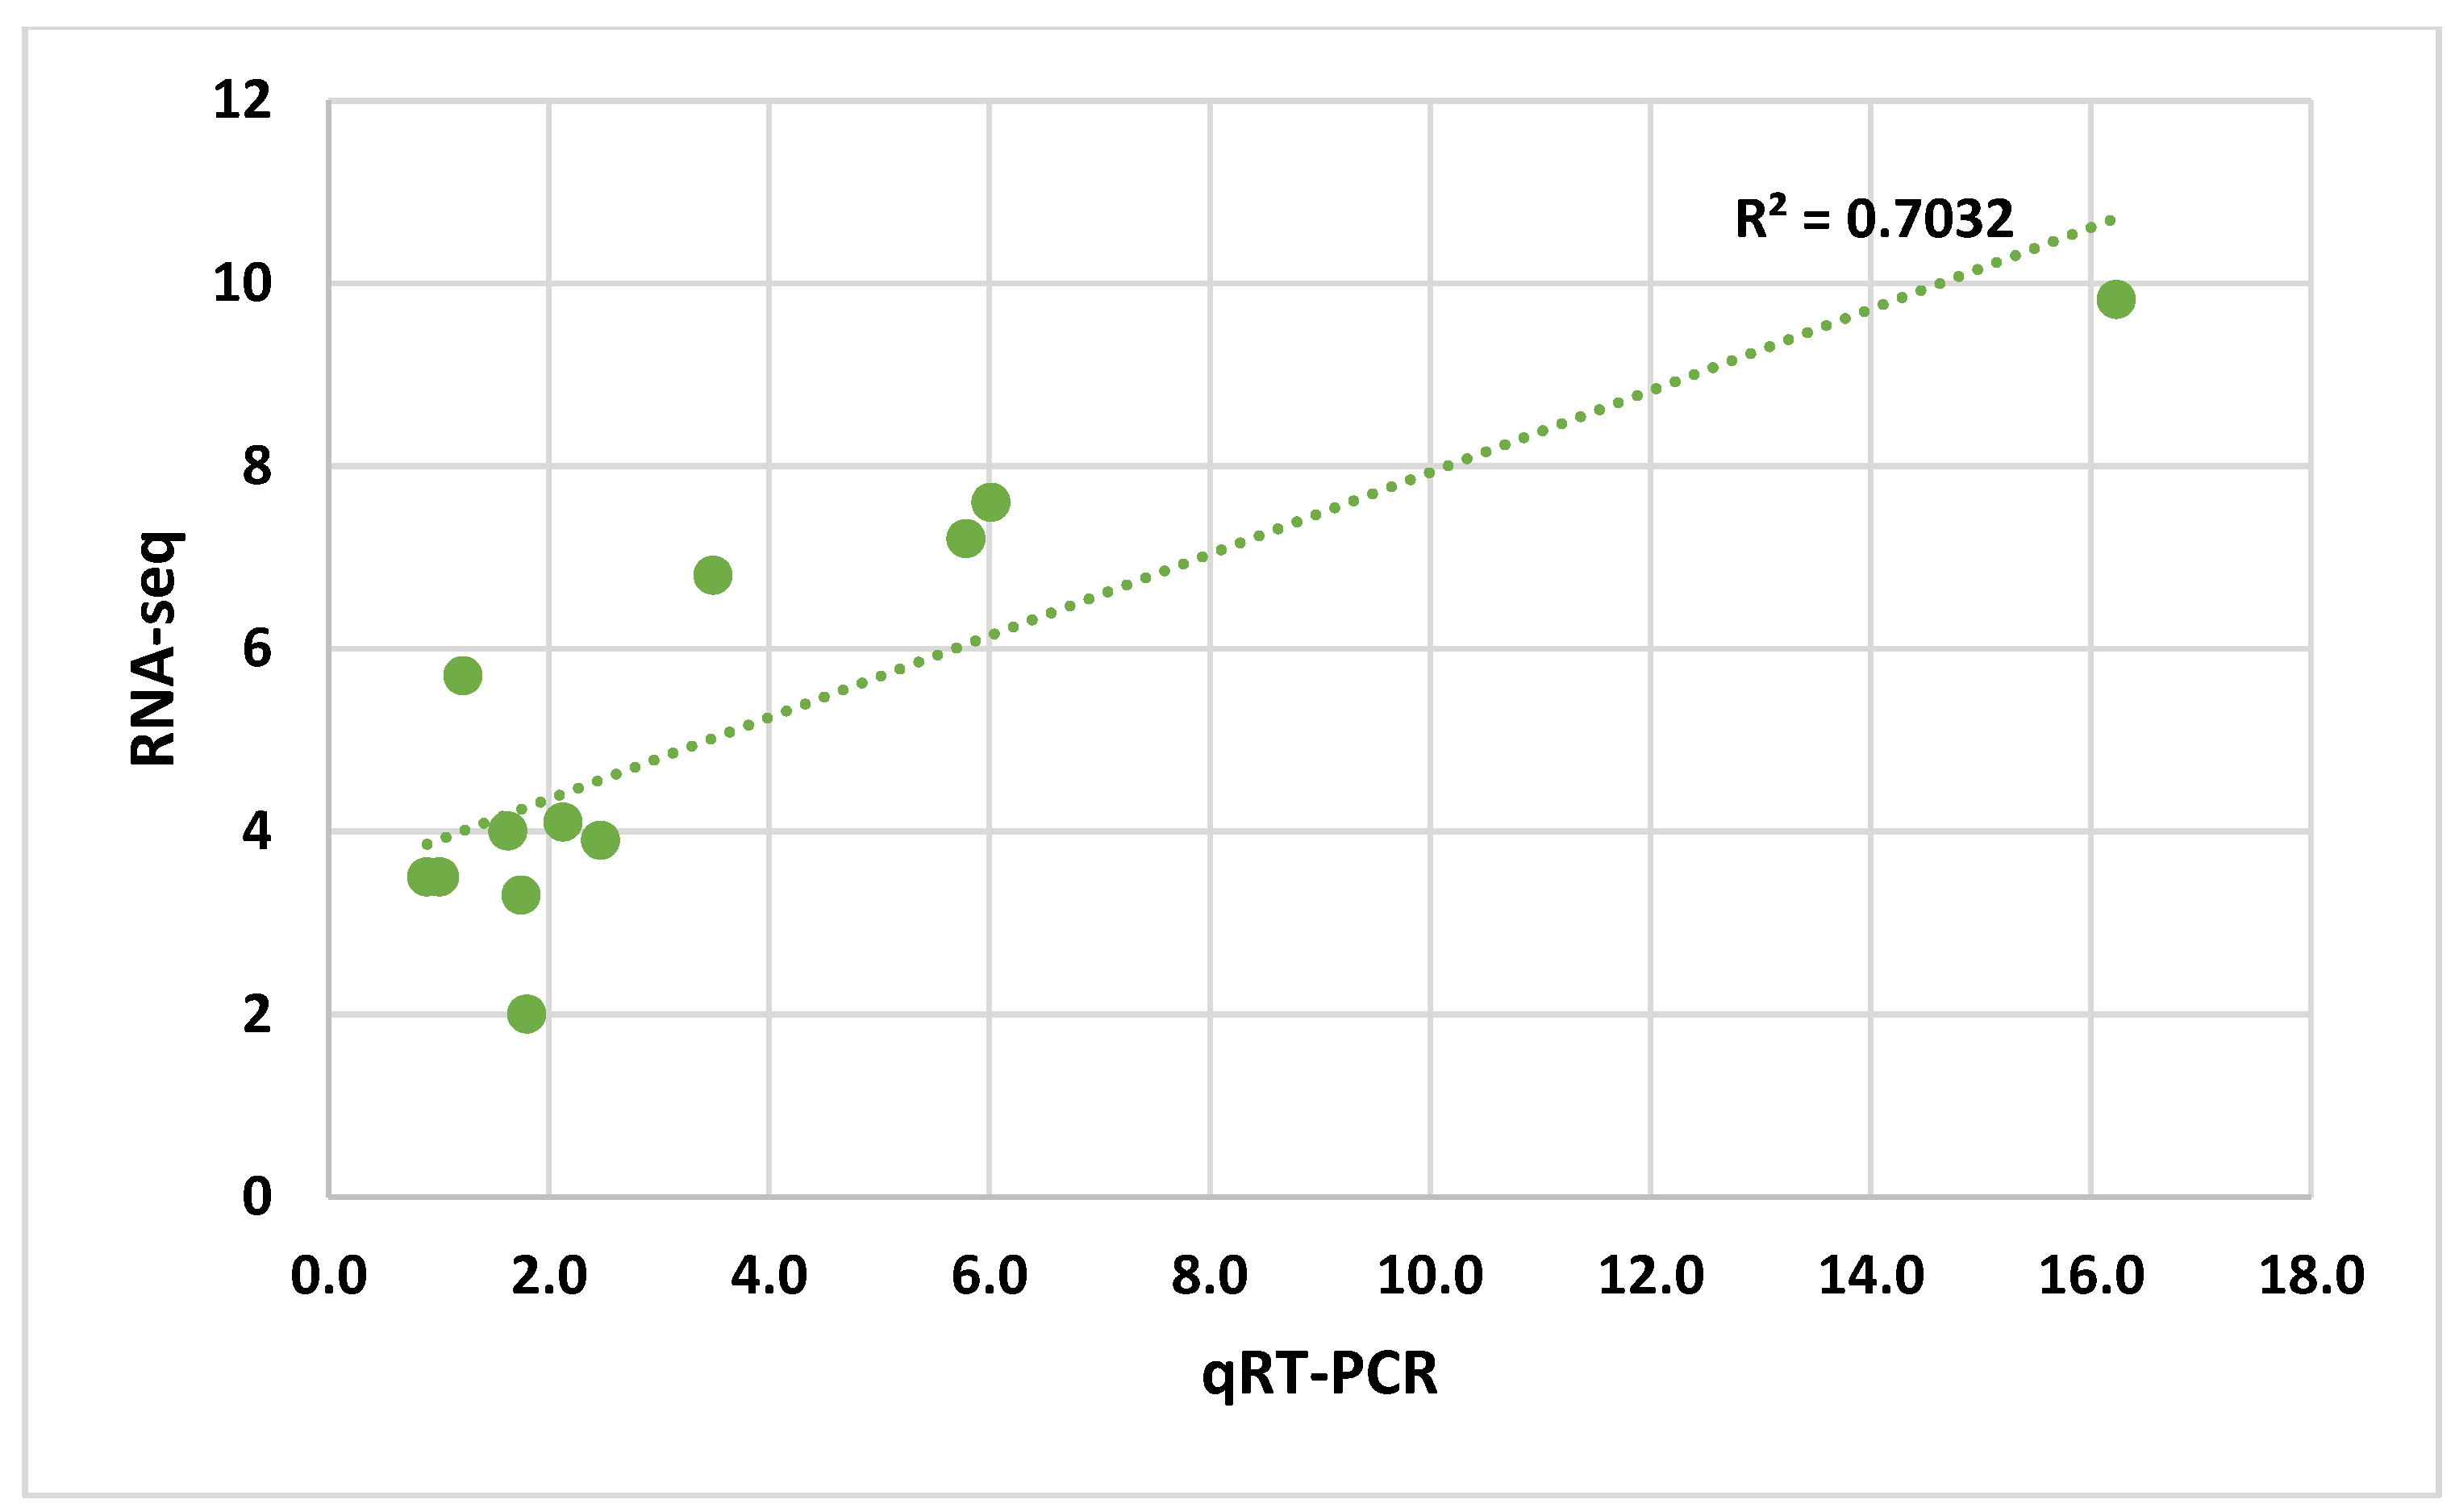
3.3. Quantitative Real-Time PCR Analysis

To confirm gene expression levels measured with RNA-Seq, six DEG were selected for qRT-PCR analysis. For each gene, qRT-PCR was carried out in two different time points (Py3 and Py4). All the selected DEG were successfully amplified, and the patterns of gene expression detected by qRT-PCR were consistent with those from RNA-Seq data (Figure 2).
Linear regression analysis showed significantly positive correlation (R2 = 0.7032) between RNA-Seq and qRT-PCR in the fold change of the gene expression ratios (Figure 3), indicating that the results obtained by qRT-PCR agreed well with the ones obtained with DGE analysis.

3.4. Transcriptome Annotation

Protein coding regions predicted by TransDecoder (82,419 predicted genes) were annotated with BlastP against the NCBI NR-plants database, where 67,138 (81.5%) found at least one hit. From a total of 614 different species with at least one blast hit, the 10 most representatives are shown in Figure 4.
Despite the number of matches against the NCBI NR-plants database, we identified 24,677 (29.9%) annotated genes with “Unknown” description or no description available, mainly associated to Picea sitchensis. Regarding the DEG subset, 7945 (52.2%) genes also had “Unknown” or no description available.
InterPro was used to identify protein domains, providing information about the functional classes of KEGG pathways and GO terms. A total of 52,739 (64.0%) sequences had at least one protein domain identified; 3152 (3.8%) were associated with at least one KEGG pathway, finding a total of 113 different KEGG pathways with 393 different enzymes; and 30,192 (36.6%) were associated with at least one GO term (BP: 30.0%; MF: 41.9%; CC: 11.5%) in a total of 1664 different GO terms. Additionally, over the set of DEG, 399 genes were associated with at least one KEGG pathways in a total of 94 different KEGG pathways, and 2893 genes were associated with at least one GO in a total of 757 different GO terms. A summary of the ten KEGG pathways with more DEG associated is shown in Figure 5. A significant number of DEG associated to the synthesis of plant secondary metabolites attests their relevance in response to pathogens. In total, 26 and 19 DEG were associated to phenylpropanoid biosynthesis and terpenoid backbone biosynthesis pathways, respectively.
GO terms analysis over the whole set of predicted genes was performed using CateGOrizer against the GOSlim database, leading to the identification of 39 subcategories of GO terms belonging to BP, 24 to CC, and 24 to MF. The most representative BP subcategories were Cellular Process (GO: 0009987) (27.0%), Metabolic Process (GO: 0008152) (22.1%), and Biosynthetic Process (GO: 0009058) (9.0%) (Figure S1). The main CC subcategories were Cell (GO: 0005623) (29.3%), Intracellular (GO: 0005622) (27.3%), and Cytoplasm (GO: 0005737) (10.2%) (Figure S2). Lastly, the principal MF subcategories were Catalytic Activity (GO: 0003824) (44.4%), Transferase Activity (GO: 0016740) (13.5%), and Hydrolase Activity (GO: 0016787) (12.3%) (Figure S3).
A similar analysis was done over the DEG, which identified 36 BP, 23 CC, and 24 MF subcategories. Cellular Process (GO: 0009987) (27.3%), Metabolic Process (GO: 0008152) (22.8%), and Biosynthetic Process (GO: 0009058) (9.2%) were the most representative BP subcategories. For the CC term, the subcategories with more hits were Cell (GO: 0005623) (28.4%), Intracellular (GO: 0005622) (27.4%), and Cytoplasm (GO: 0005737) (11.2%). Lastly, Catalytic Activity (GO: 0003824) (41.6%), Transferase Activity (GO: 0016740) (12.7%), and Hydrolase Activity (GO: 0016787) (11.5%) were the major MF subcategories (Figures S1–S3).

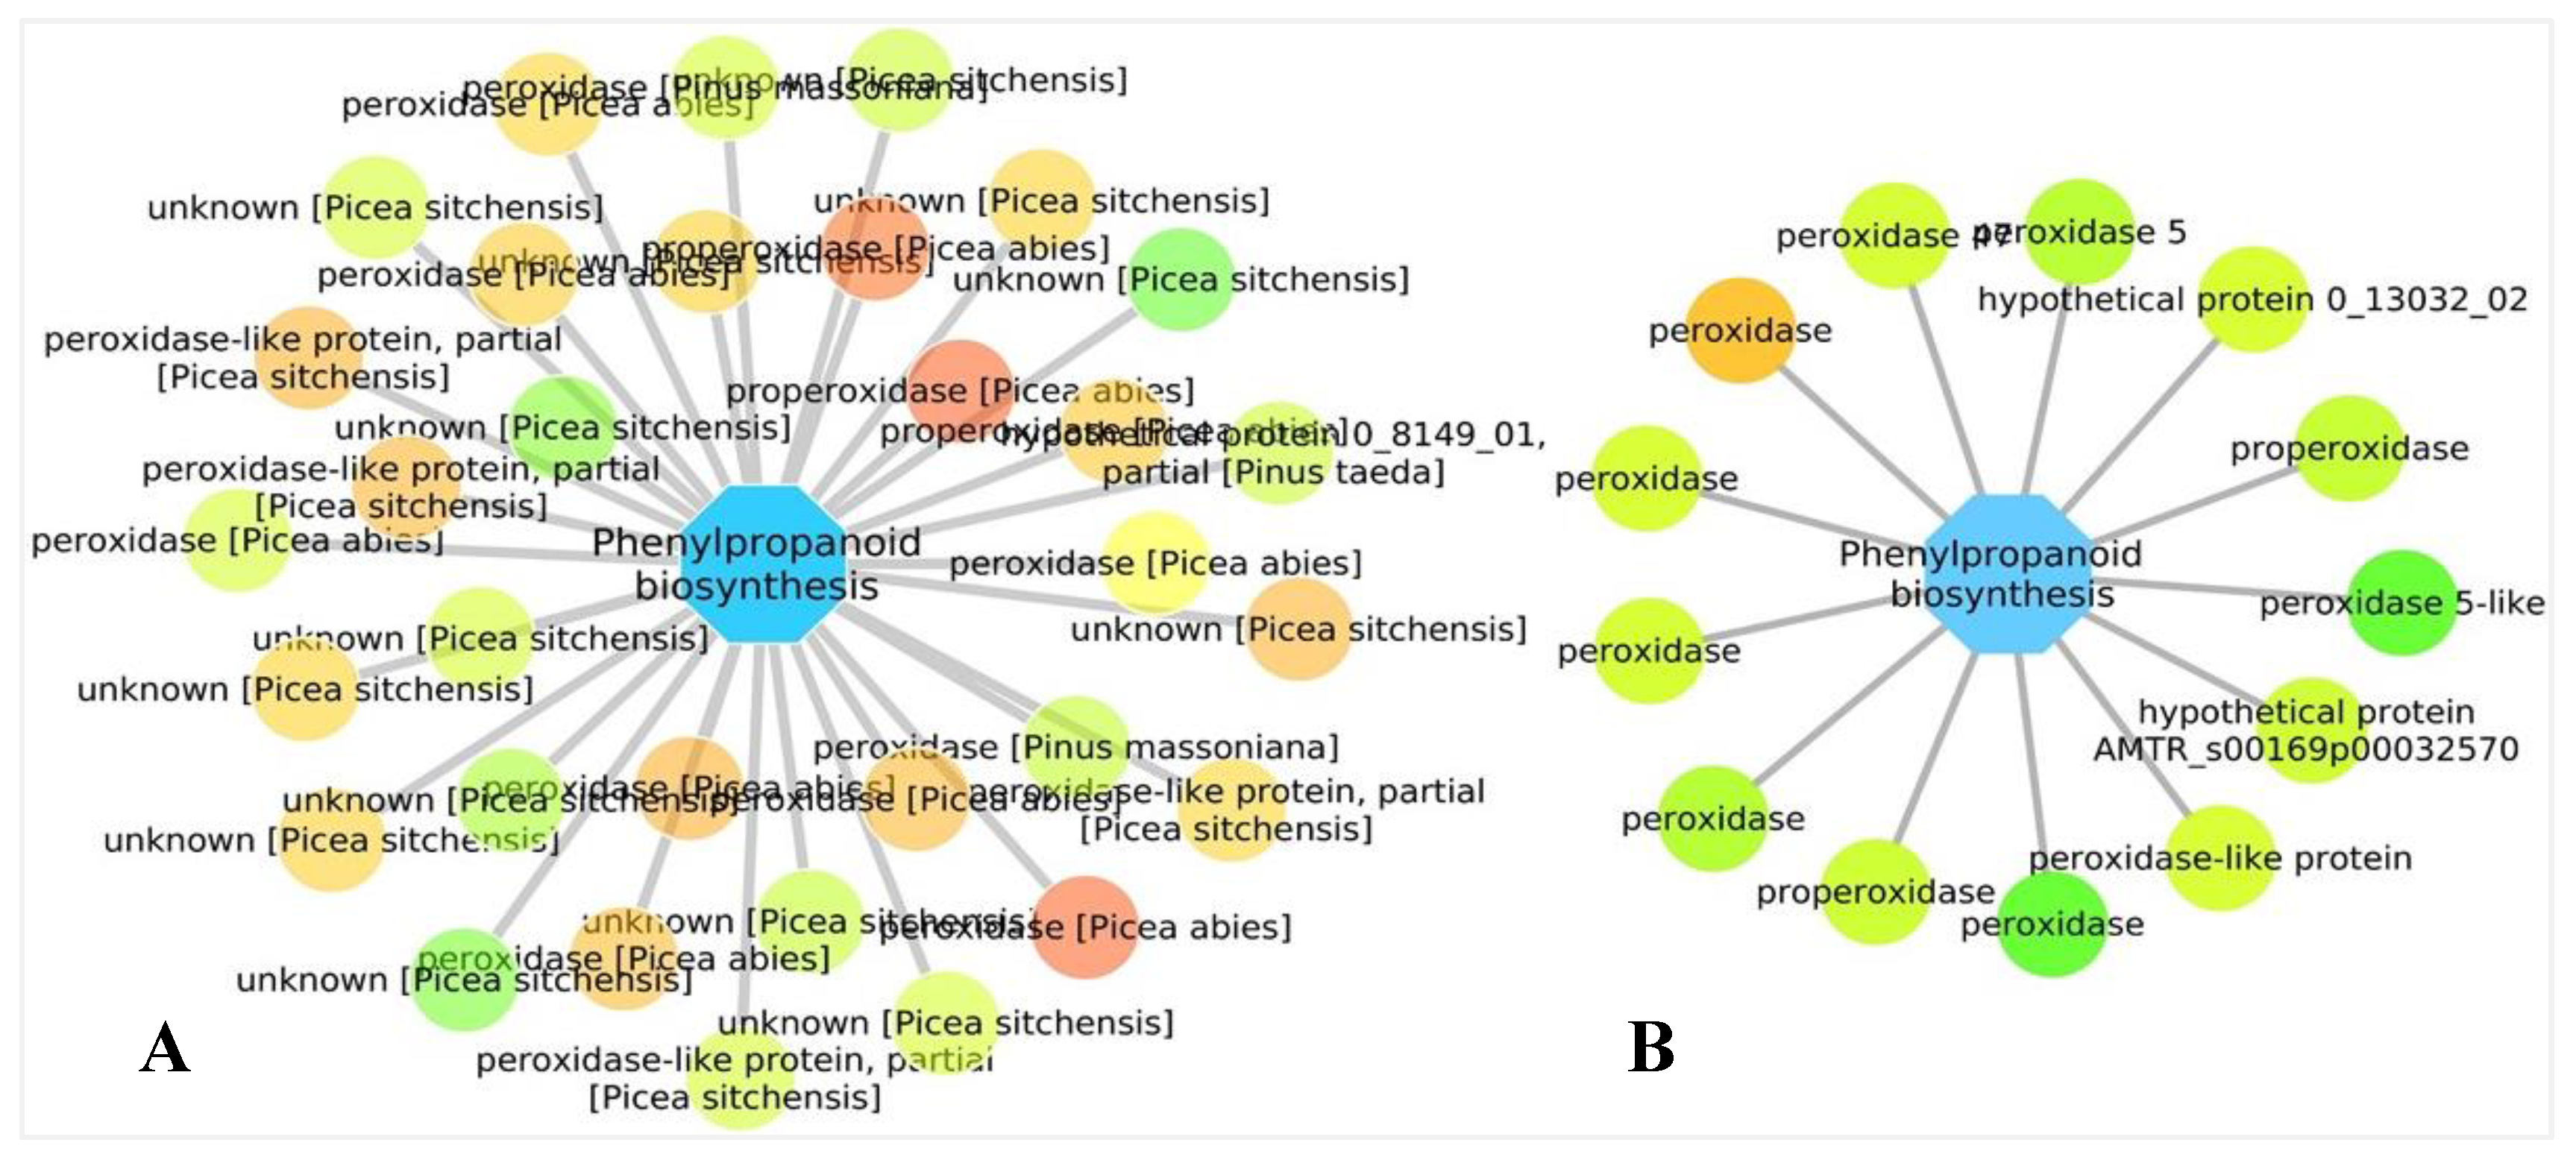
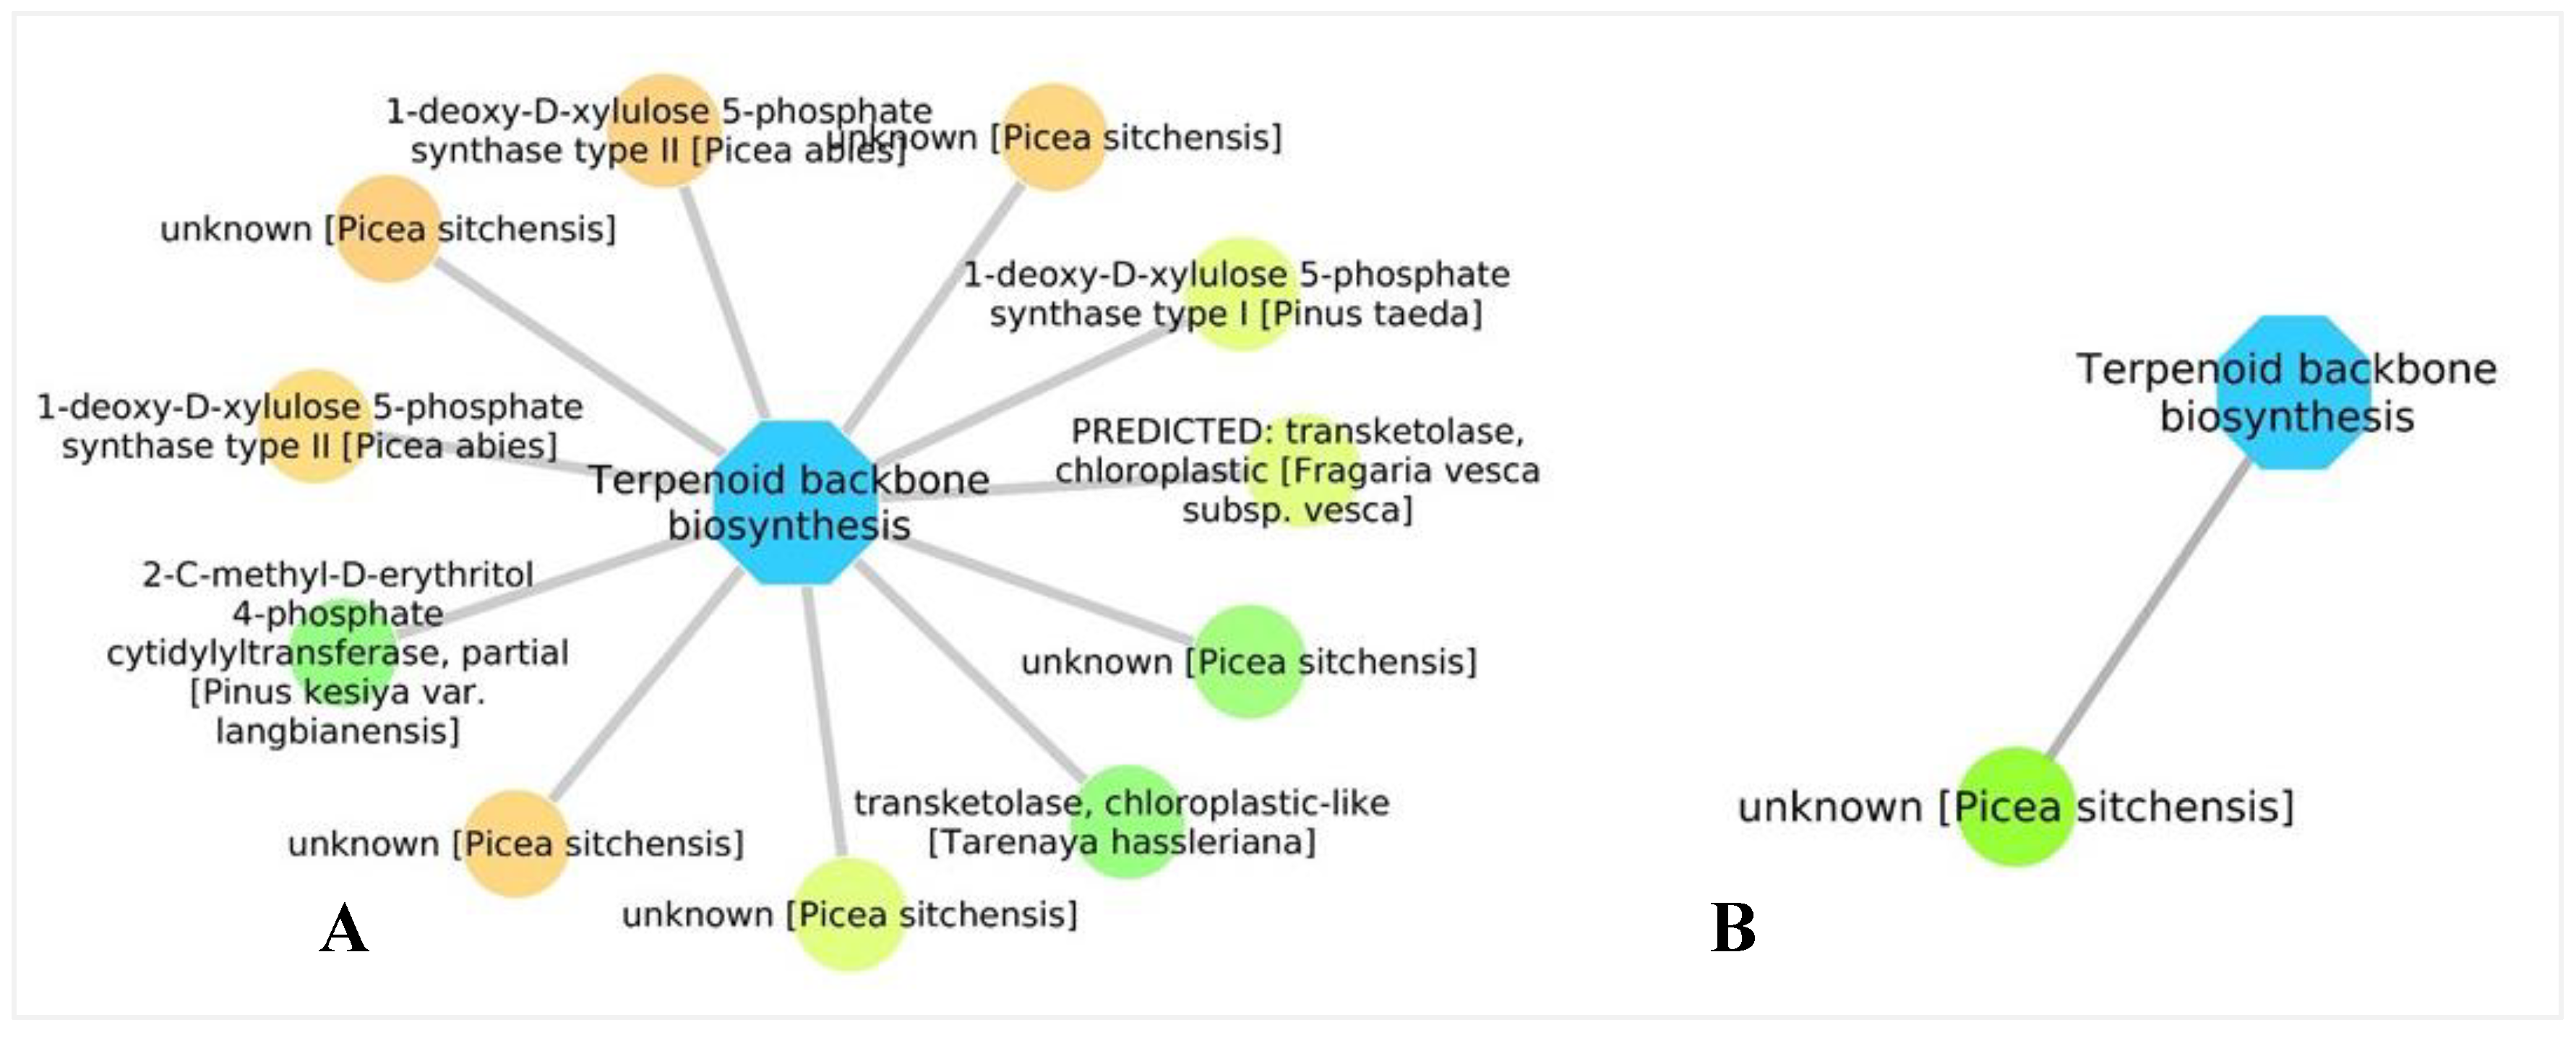
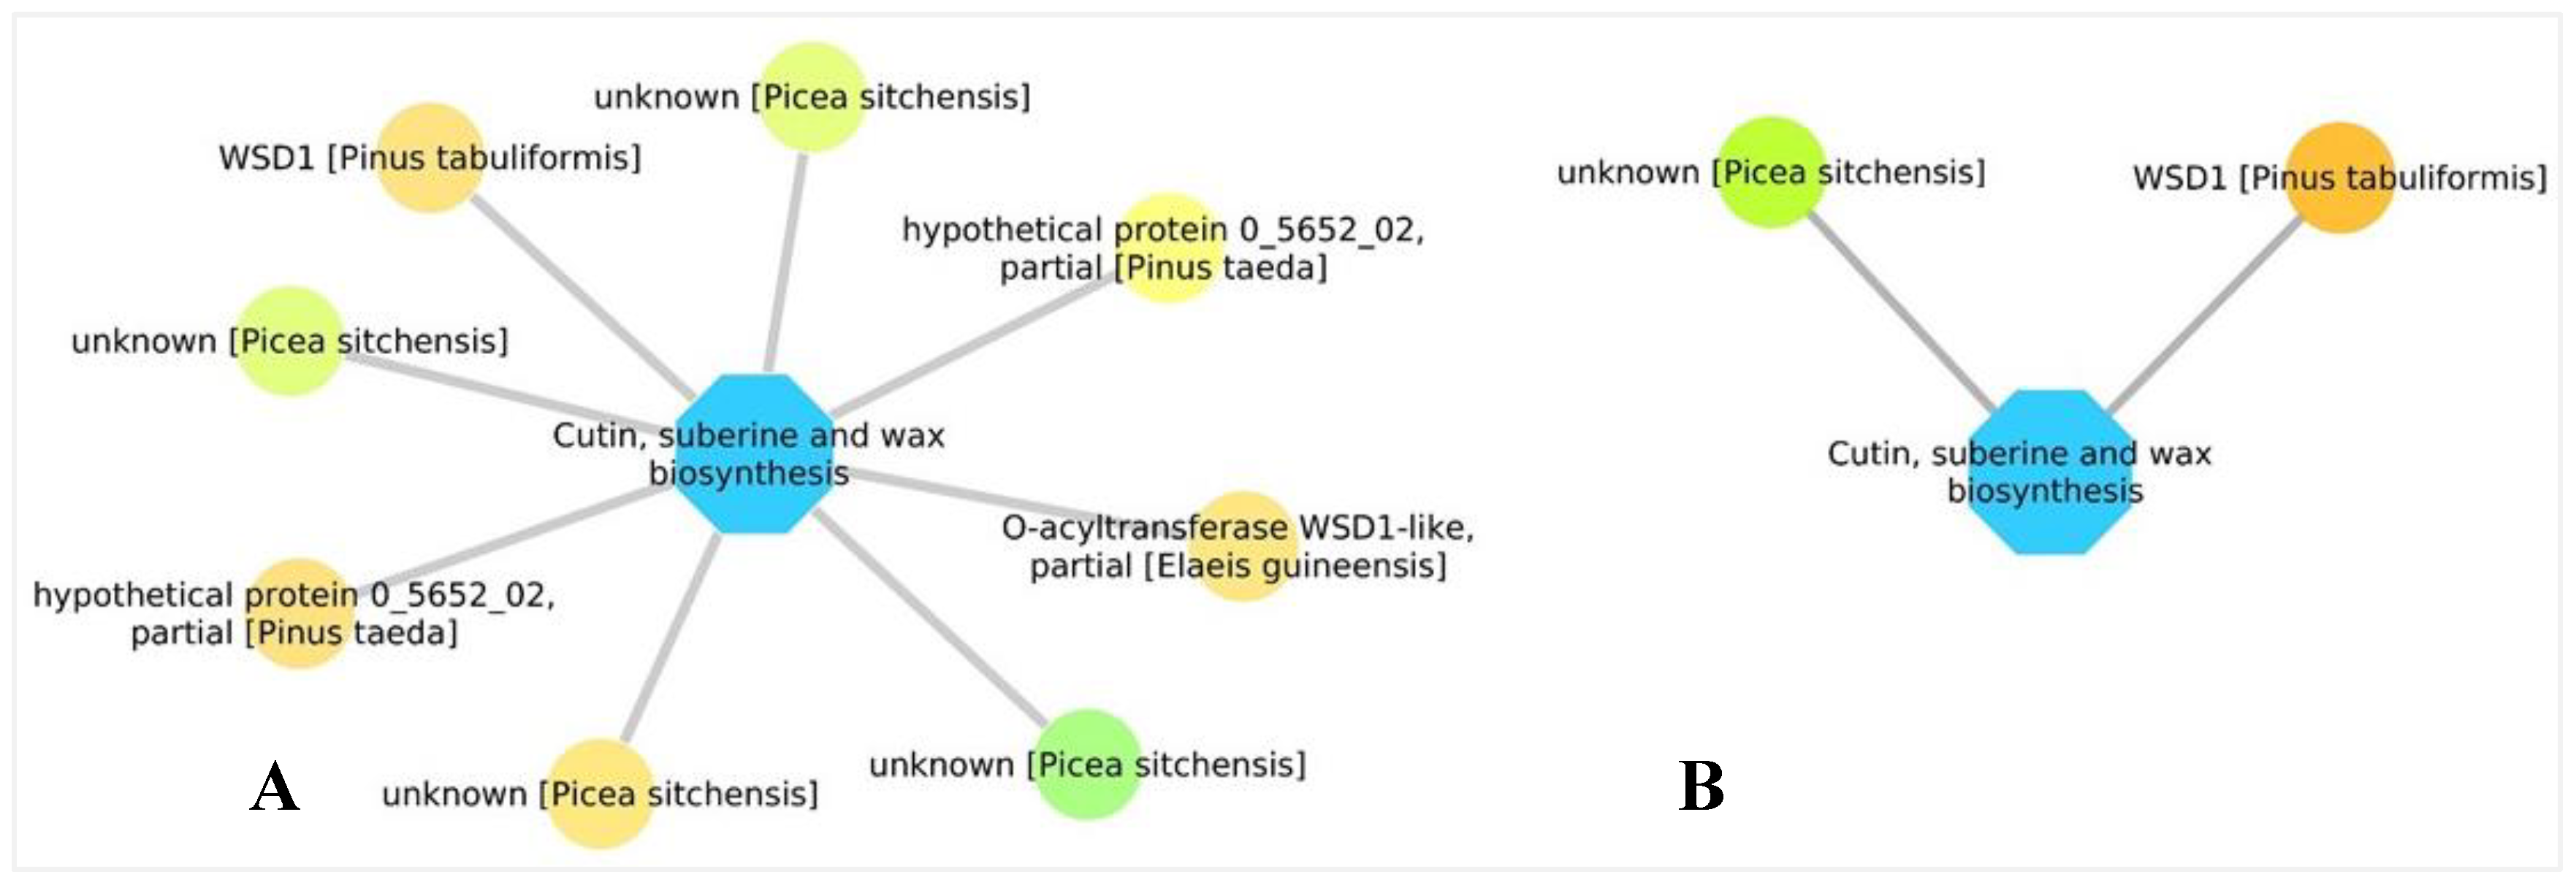
3.5. Biological Networks Analysis

In order to unravel the protective mechanisms involved in pine response to PWN infection, a complete analysis of KEGG pathways associated with DEG was performed. The number of gene interactions (up- and down-regulated) over KEGG pathways is presented in Figure 6. Note that the Py1 vs. Py3 (Py13) comparison contained the highest number of gene interactions, suggesting that the response to PWN infection could be more intense 48 h after inoculation.
Since the results suggested that the response to PWN infection was more intense 24 h and 48 h after infection in Pinus pinaster and Pinus yunnanensis, respectively, the biological network analyses focused on the first two time points. Due to their biological importance in plants’ defense against pathogens, phenylpropanoids metabolism, terpenoid backbone biosynthesis, cutin, suberin and wax biosynthesis, and starch and sucrose metabolism were selected as biological pathways of interest.
Comparative analysis of selected biological networks reflected significant changes in the transcriptomic response, which may help us to identify points of convergence or divergence and clarify the specificity of the molecular response in both species. When focusing on the phenylpropanoid biosynthesis pathway, the number of DEG within this pathway in both species differed (maritime pine, 37 in 6/24 h and 32 in 48 h; Yunnan pine, 7 in 6/24 h and 13 in 48 h). Figure 7 and Figure 8 show this difference between both species.
Phenylpropanoids are a family of organic compounds synthetized by plants, recognized as the main precursors of the phenolic defense compounds under stress conditions. Typically known by their role in oxidation process, lignification, and suberization, peroxidases (POD) (EC: 1.11.1.7) have been associated with inhibition of pathogen growth [41]. These enzymes within the phenylpropanoid biosynthesis produce the guaiacyl lignin which is one of the units responsible for lignin biosynthesis. Our results showed an induction of several POD immediately after pathogen infection in both species, suggesting an active contribute against PWN infection. However, the number of genes was higher in maritime pine at both time points. Moreover, many genes with unknown function were observed, which hindered the ability to further understand the specificities of the molecular response.
Similarly, the number of DEG assigned to the terpenoid backbone biosynthesis pathway in Pinus pinaster (11 and 15 genes were found 6/24 h and 48 h after infection, respectively) were also significantly higher than in Yunnan pine, where only 1 and 8 genes were found for the same time points (Figure 9 and Figure 10). These results enforce the existence of a different complexity in the response to PWN infection in both species.
The terpenoid backbone biosynthesis pathway includes two biosynthetic pathways, the mevalonate and the non-mevalonate pathway (MEP/DOXP), and has been associated with plants’ defense against pathogens [42]. These two sub-pathways are responsible for the catalysis of fundamental building blocks to terpenoid biosynthesis, such as isopentenyl diphosphate (IPP), a universal precursor of isoprenoids. Within the MEP/DOXP pathway, the first step, in which glyceraldehyde 3-phosphate is condensed with pyruvate, is catalyzed by 1-deoxy-D-xylulose-5-phosphate (DXP) synthase (EC: 2.2.1.7). In the second step, DXP is converted to 2C-methyl-d-erythritol-4-phosphate, a reaction mediated by the enzyme 1-deoxy-d-xylulose-5-phosphate reductoisomerase (DXR) (EC: 1.1.1.267) [43]. The importance of DXP and DXR under pathogen attack is evident in our results, considering the number of up-regulated genes codifying these two enzymes in both species.
In plants, the structural defenses constitute the first defensive line of protection against infection, limiting the access of phytopathogens to plant cells. These structural defenses include preformed physical barriers such as cell walls, which are actively reinforced under pathogen attack, evidencing a dynamic composition during host–pathogen interactions.
Several waxy polymers and complex cell wall macromolecules are produced through the cutin, suberin, and wax biosynthesis pathway. These products are the major structural components of cell walls and cover all aerial surfaces of higher plants, forming a protective barrier. Their role in plants’ defense under biotic stress and their contribution to the response mechanism during PWN infection is significant, which is evidenced in our results, where a significant number of gene interactions over this pathway at the two first time points after inoculation were identified (Figure 11 and Figure 12). The number of DEG detected for this pathway was higher in maritime pine (8 and 7 genes found 6/24 h and 48 h after infection, respectively), even though the differences with Yunnan pine were less evident for this pathway (2 and 5 genes detected for 6/24 h and 48 h after infection, respectively). Nevertheless, the higher complexity of molecular mechanisms in Pinus pinaster, relative to Pinus yunnanensis, was once again demonstrated.
Starch metabolism plays an important role in many biological functions of plants, including participation in the response to abiotic and biotic stress factors [44]. Plant resistance to pathogens may be increased by higher levels of sugars, considering their involvement in many key biological functions, which include providing energy and structural materials, interaction with hormonal networks controlling the plant immune system, and increasing oxidative burst at early stages of infection [45]. Sucrose is a molecule that plays an essential role in plant growth and development, also involved in the activation of the immune system as a response to pathogen attacks as well as other signaling pathways, such as circadian clock, phytohormones, and cell wall strength [46].
In this study, the expression pattern detected for this pathway in maritime and Yunnan pine indicated substantial differences between the two species. In maritime pine, a high number of DEG associated with starch and sucrose metabolism was found for all comparisons (57, 44, and 40 genes for the 6/24 h, 48 h, and 7 days time points, respectively). Yunnan pine showed a different expression pattern of regulation for DEG associated with this pathway. At the time point 48 h after infection, a total of 48 DEG were found, a number similar to the one observed for maritime pine. However, for the other two time points the number of DEG was substantially lower (10 and 18 genes for the 6/24 h and 7 days time points, respectively). These results suggest a more pronounced activation of this pathway in maritime pine, when compared with Yunnan pine. The former species consistently displays a high number of DEG associated with this pathway, over all time points, while the latter shows only a peak of DEG at 48 h post infection. The DEG for each species at the 7 days post infection time point are indicated in Figure 13.
A gene ontology-based overrepresentation analysis within the set of DEG was carried out with BiNGO for three time point comparisons: I) Py1 vs. Py2 (Py12); II) Py1 vs. Py3 (Py13); III) Py1 vs. Py4 (Py14). In the context of GO hierarchy, no evidence of statistical significance was observed in the sets of down-regulated genes. However, over the up-regulated genes, the results showed overrepresentation in the three categories. Within the BP domain, genes involved in “Translation” (GO: 0006412) were found significantly overrepresented over the three time points, although, in the first one, lower levels of significance were verified. Regarding the CC ontology, the “Ribosome” (GO: 0005840) subcategory was found overrepresented in all comparisons, with emphasis on Py13 and Py14. Together, these results authenticate the complexity of molecular machinery in response to PWN infection, evidencing high changes in the transcriptome profile by the significative representation of ontologies associated to protein biosynthesis. Lastly, the MF category revealed no evidence of statistical significance in Py12; however, in Py13 and Py14, the “catalytic activity” (GO: 0003824) and “RNA binding” (GO: 0003723) subcategories were found overrepresented.

4. Discussion

PWD has been studied extensively during the last decades, and a large set of scientific publications are available in public repositories [47]. However, to the best of our knowledge, no published studies have assessed the Yunnan pine molecular mechanisms involved in the response against PWN infection, leading to a lack of biological information in this field. To fill that gap, we characterized the Yunnan pine transcriptome profile in three different stages after PWN inoculation, using RNA-Seq technology. Moreover, in order to deeply understand pine defense under PWN attack, a comparative analysis with maritime pine transcriptome was also performed.
The susceptibility of both species to infection with PWN differs, since Yunnan pine displays intermediate susceptibility, while maritime pine is susceptible [14]. The experimental design followed in this study confirmed Yunnan pine to be less susceptible to infection with PWN. After infection with the PWN, the trees from both species were kept under the same conditions, and the infection was allowed to progress. Two months after inoculation with PWN, there were clear and visible signs of PWD in maritime pine, unlike what was observed in Yunnan pine, whose individuals showed no signs of PWD (Figure 14) [48].
The results obtained with the transcriptome analyses performed in this study reveal interesting differences between the species, which may be related with the contrasting PWD phenotype displayed by the species after infection with PWN. In plants, the molecular machinery underlying defensive response against pathogens is extremely extensive, entailing a major shift in metabolic activity [49]. The complexity of the response to PWN infection is patent in our study, not only due to the number of DEG, but also by the different mechanisms and pathways activated simultaneously over the different stages analyzed. However, several differences were found between the pine species’ responses under infection, since in Pinus pinaster a total of 12,504 DEG were identified, while in Pinus yunnanensis only 9961 were found. Besides the higher number of DEG in Pinus pinaster, it is also relevant to further analyze the distribution, over the different time points after inoculation, of these DEG. Maritime pine showed an immediate and extensive response in the first 24 h after inoculation followed by a substantial decrease over time in terms of DEG. On the other hand, the initial response of Yunnan pine is less pronounced, and the number of DEG found 24 h after inoculation is considerably smaller. In this species, the expression pattern reached the maximum amplitude only 48 h after inoculation, which suggests different ways and strategies between the species to respond to infection.
In line with these results, we found a higher number of gene interactions over KEGG pathways in Pinus pinaster (1436 DEG mapped to 86 KEGG pathways), when comparing to Pinus yunnanensis (775 DEG mapped to 94 KEGG pathways). KEGG analysis showed that DEG were most associated to starch and sucrose metabolism and to glycolysis and gluconeogenesis in both species. Previously, using histology techniques, an increase in starch inclusions in the resin ducts (after inoculation) was observed in maritime pine, when compared with Yunnan pine, which did not show any changes in the number of starch inclusions. These results are in agreement with the different regulation pattern detected for the starch and sucrose metabolism pathway, which revealed this pathway to be used more extensively in maritime pine. Furthermore, a significant number of DEG also mapped against other important pathways in which defense mechanisms are involved, such as phenylpropanoid biosynthesis; terpenoid backbone biosynthesis; and cutin, suberin, and wax biosynthesis. As a result, it can be deduced that the expression of these genes may have a direct effect on the plant protection under PWN infection.
To further understand the underlying molecular processes, an enrichment functional analysis against the Gene Ontology classification system was performed. DEG were classified into functional groups in the three main categories (Cellular Component, Biological Process, and Molecular Function). GO results showed significant differences between species in terms of DEG associated to each category. Moreover, the cellular component of GO analysis revealed a significant number of DEG associated to cell wall term (GO:0009505) (31 in Pinus pinaster and 14 in Pinus yunnanensis). As mentioned before, physical barriers belong to the first defensive line, playing an important role in the protection of cells from phytopathogens’ initial invasions. Thus, these results demonstrated that an active reinforcement of cell wall components had occurred during PWN infection. Many DEG were also involved in response to stress (GO:0006950) (51 in Pinus pinaster and 22 in Pinus yunnanensis), which illustrates the complexity, as well as the different intensity, of the response in both species.

4.1. Response to PWN Infection Modulated by Time and Degree of Defense Mechanisms Following Pathogen Recognition

Upon pathogen attack, timely perception of the infection linked to an efficient response are the two key features of a successful plant defense [50]. In the first 24 h after PWN inoculation in Yunnan pine, our results showed significant changes at molecular level, which indicates the activation of a defensive strategy in response to the pathogen [51]. This included mainly regulatory mechanisms, which act in pathogen recognition and signaling events, triggering downstream defense mechanisms. The overexpression of MYB transcription factor genes observed in the early 24 h, may indicate the activation of the signaling systemic defense since they are recognized as key players in the control of diverse cellular processes such as response to biotic and abiotic stress. The MYB family is extensively represented in plants, being involved in the regulation of the Abscisic acid (ABA)-response [52]. ABA is a phytohormone induced under various stress conditions, playing a crucial role in signaling transduction and controlling downstream responses. The simultaneous overexpression of MYB and GRAM-containing/ABA-responsive genes in the first 24 h reveals their importance in the regulation and development of the Yunnan pine’s response. Moreover, two 1-aminocyclopropane-1-carboxylic acid (ACC) synthase encoding genes were also found highly expressed after inoculation. ACC is known as a signaling molecule under different external stimuli, that can act by itself or being a biochemical precursor of ethylene, a phytohormone extensively studied in plant response to external stress conditions [53].
The occurrence of these early signaling events was observed in both species. However, in maritime pine a multifaceted network of interactions involving several phytohormones resulted in a complex chain of biochemical reactions along signal transduction pathways. Despite equally crucial, the signaling complexity in Yunnan pine seems to be slightly lower, which may be related to a more efficient response.
The production of reactive oxygen species (ROS) is also associated to the first line of defensive mechanisms, regulating various physiological responses in interaction with others signaling components [54]. However, despite the importance of ROS in the regulation of systemic response, their high concentration in tissues is damaging to plants, leading to an oxidative stress stage [55]. To cope with oxidative damage, plants have developed antioxidant mechanisms involving the action of enzymes, such as Superoxide dismutases (SODs) and Glutathione S-transferases (GSTs), in the conversion of ROS to more stable and less reactive molecules. SODs are the major antioxidant defense system against oxidative stress and are classified into three groups based on the metal co-factor used by the enzyme [56]. The role of GSTs, which is also highly important, has been widely described in other species [57,58,59]. In Yunnan pine, a Cu-Zn-superoxide dismutase precursor and Tau class glutathione S-transferases were overexpressed in the first stage after inoculation, the latter being even highly expressed 48 h after inoculation. A similar profile was observed in maritime pine, where several genes that were associated with response to oxidative stress ontology were also differentially expressed in the first sampling point after infection. The early identification of antioxidant enzymes may indicate a way to avoid the undesirable effects of high ROS levels in tissues following pathogen attack, ensuring cell viability and proliferation. Our results indicate that the susceptibility differences observed between the two pine species are very likely not explained by transcriptomic changes in ROS-related genes.

4.2. Production of Chemical Compounds and Physical Barriers as a Tool to Reduce Pathogen Growth and Proliferation

As mentioned before, the Yunnan pine’s molecular response against PWN seems to be more intense 48 h after inoculation. At this stage, significant levels of the vascular plant one Zinc-finger protein 1 (VOZ1) transcription factor were detected. A recent study, conducted in Arabidopsis thaliana, showed that VOZ proteins act as both negative and positive regulators of abiotic and biotic stress-responsive pathways, controlling the adaptation to different stress outbreaks [60].
Antimicrobial peptides (AMPs) are known as antibacterial and antiparasitic, playing important roles in system-acquired resistance and being often involved in the flank defense as a response against pathogens [61,62]. AMP activity was identified in both pine species, after inoculation with PWN. In Yunnan pine, two AMPs were overrepresented 48 h after inoculation, but in maritime pine, AMPs were induced only in the first 24 h after inoculation. A study conducted in Pinus thunbergii [5] revealed the presence of significant AMPs levels in resistant and in susceptible pine trees after PWN inoculation. However, susceptible trees showed more quickly and slightly higher levels of induction. Our results seem to confirm this rapid AMP response in susceptible species, such as maritime pine.
The importance of stilbenes in response to abiotic stress has been demonstrated [63]. They belong to the phenylpropanoid family and seem to have evolved from Chalcone synthase, a key enzyme in flavonoid biosynthesis. Pinosylvin synthase is a typical stilbene phytoalexin, which was found overexpressed in Yunnan (48 h) and in maritime pine (7 days) after inoculation. This stilbenoid is a key metabolite that can kill nematodes [64]. In addition, in Yunnan pine, stilbene synthases were also found over-expressed at all the studied time points after infection. This combination of enhanced expression of stilbenoid and stilbene synthase genes can potentially be associated with the decrease in susceptibility degree to PWN infection observed in Yunnan pine.
Chitinases and endochitinases are part of an effective plant chemical defense, and several genes encoding these molecules were found overexpressed in both species. These glycosyl hydrolases have the ability to cleave chitin chain, one of the main structural components of insect skeleton and nematode microfilarial sheath [65].
Several studies revealed the crucial role of physical barriers in protection and defense, limiting access of pathogens to plant cells [66,67]. Cell walls represent one of the plant structural defenses, through which pathogens must penetrate. Our results indicate a high expression of several genes related to cell wall components at different stages after inoculation. A Cinnamoyl-CoA reductase (CCR) encoding gene was found highly induced during all time points after infection in Yunnan pine. CCR is a key enzyme in the lignin biosynthesis pathway in plants, an important constituent of plant secondary cell walls, which provides rigidity and mechanical support to plant cells [68]. In contrast, in maritime pine, this gene was down-regulated at the first time point and did not show any differential expression in the other two time points after infection. This suggests a more efficient reinforcing of cell wall strength in Yunnan pine, which may make pathogen migration through the plant difficult, establishing a first line of defense against PWN. The higher susceptibility to PWN displayed by maritime pine can also be related to lower expression levels of CCR genes.

4.3. Overexpression of Defense-Related Genes Suggests a Continuum Reinforcement of the Immune System

The analysis of the Yunnan pine transcriptomic profile following pathogen inoculation identified several defense genes induced continuously over time, of which many genes were highly overexpressed in all stages after inoculation. Some of these DEG encoded heat-shock proteins (HSPs) and small heat-shock proteins (smHSPs), thaumatin-like proteins (TPLs), a translationally controlled tumor protein (TCTP), and a leucine-rich repeat receptor kinases 1 (LRK1), genes that have been commonly associated to stress responses. In maritime pine, the similar pattern of overexpression in all stages after inoculation found for HSPs, TPLs, and TCTP genes highlighted similarities in the expression profile of these genes in both species, when they are under PWN attack.
Heat-shock proteins (HSPs) family can be widely found in higher plants, where they play an important role in the protection of cells under different stress conditions. HSPs are classified according to their molecular weight, with small heat-shock proteins ranging from 17 to 30 KDa. Despite the molecular weight differences, smHSPs seem to have similar functions to HSPs in defense mechanisms [69]. They are highly induced in response to a wide range of abiotic stresses, being important in the reestablishment of cellular homeostasis [70]. Recent studies carried out in Pinus thunbergii and Pinus massoniana reported the relevance of these proteins in response to PWN infection [5,6]. Hence, our results confirm those findings, since in two different Pinus species (pinaster and yunnanensis) the involvement of HSPs in the plant’s response to PWN attack was observed.
Due to their importance in a plant’s defensive system against pathogen attack, thaumatin-like proteins are classified as one of the pathogenesis-related protein families. TPLs are universal in plants, where they appear to have not only abiotic stress tolerance but also antibiotic activity [71]. High expression of TLPs was also reported in an experiment with Pinus densiflora after PWN inoculation [72], suggesting a similar key role in different pine species under PWN infection.
The results obtained also showed a large induction of a TCTP gene in both species. TCTPs are known by their roles in different cellular processes, such as protection against stress and apoptosis, being regulated in response to a wide range of extracellular stimuli [73]. TCTPs also seems to be involved in water loss prevention by the induction of a rapid stomatal closure [74]. Considering that regulation of stomatal activity enhances plants’ ability to deal with disturbances in water flow, this could be important to survival under PWN attack, since one of the typical physiological changes caused by PWD is the reduction of water potential and the subsequent decrease in transpiration rate.
Lastly, several LRK1-encoding genes were overexpressed in all stages after inoculation. LRKs play major roles in diverse plant mechanisms, including defense against a large range of pathogens [75]. However, despite the importance of LRKs in different stress responses, further studies are needed to clarify their role in PWN infection response.

5. Conclusions

This study provides new insights for the understanding of the molecular response of Yunnan pine to PWN infection, pointing out the defense mechanisms triggered after inoculation. The total number of differentially expressed genes revealed the complexity of the response, suggesting high temporal changes in transcriptome profile. However, it is clear that the key stage of response occurs 48 h after PWN inoculation, where several defense-related genes were found highly expressed. A comparison of these results with the maritime pine’s response to PWN, showed significant differences in the transcriptomic response regarding the time perception of the infection and response magnitude. As it would be expected, several activated mechanisms were shared by both species, and likely represent strategies shared by Pinus species to respond to PWN infection. However, clear differences were also observed in the transcriptomic response of both species, with maritime pine showing a more complex pattern of gene expression, which can possibly be related to this species’ higher susceptibility to PWN. These results contain novel and valuable information that represent an important advancement in the knowledge of Yunnan pine mechanisms under PWN infection, along with the comparison with maritime pine, which certainly can be useful in future studies focusing on elucidating the role played by the transcriptomic response of Pinus species in the susceptibility to PWN.

Supplementary Materials

The following are available online at https://www.mdpi.com/1999-4907/11/2/204/s1, Table S1: qRT-PCR oligonucleotide sequences, Table S2: Summary of the De novo assembly statistics, Figure S1: Gene Ontology analysis of RNA-Seq data. Distribution of the most representative biological process subcategories. The results for predicted genes are shown in green and for DEG in orange, Figure S2: Gene Ontology analysis of RNA-Seq data. Distribution of the most representative cellular component subcategories. The results for predicted genes are shown in green and for DEG in orange, Figure S3: Gene Ontology analysis of RNA-Seq data. Distribution of the most representative biological process subcategories. The results for predicted genes are shown in green and for DEG in orange.

Author Contributions

R.L.C. conceived and designed the study and supervised the laboratorial experiments; C.T., J.B.G. and F.S. performed the laboratorial experiments; D.G. performed bioinformatics analyses of the data; A.U. and B.M. contributed in the bioinformatics analyses; A.M.R. coordinated the bioinformatics analyses; R.L.C., D.G., A.U., B.M., A.M.F., J.B.G., F.S. and A.M.R. interpreted the results; D.G. and A.M.R. wrote the manuscript; A.U., A.M.F., C.T. and R.L.C. revised the manuscript; All authors have read and approved this version of the manuscript.

Funding

This research was funded by FCT—Foundation for Science and Technology, Portugal, under the projects CEF (UIDB/00239/2020) and MED (UIDB/05183/2020). Funding was also provided by Project REPHRAME of 7th Framework programme: “Development of improved methods for detection, control, and eradication of pine wood nematode in support of EU Plant Health policy”.

Conflicts of Interest

The authors declare no conflict of interest.

References

  1. Mota, M.M.; Vieira, P. Pine Wilt Disease: A Worldwide Threat to Forest Ecosystems; Springer: Dordrecht, The Netherlands, 2008; ISBN 978-1-4020-8454-6. [Google Scholar]
  2. Akbulut, S.; Stamps, W.T. Insect vectors of the pinewood nematode: A review of the biology and ecology of Monochamus species. For. Pathol. 2012, 42, 89–99. [Google Scholar] [CrossRef]
  3. Linit, M.J. Transmission of Pinewood Nematode Through Feeding Wounds of Monochamus carolinensis (Coleoptera: Cerambycidae). J. Nematol. 1990, 22, 231–236. [Google Scholar] [PubMed]
  4. Umebayashi, T.; Fukuda, K.; Haishi, T.; Sotooka, R.; Zuhair, S.; Otsuki, K. The developmental process of xylem embolisms in pine wilt disease monitored by multipoint imaging using compact magnetic resonance imaging. Plant Physiol. 2011, 156, 943–951. [Google Scholar] [CrossRef] [PubMed] [Green Version]
  5. Hirao, T.; Fukatsu, E.; Watanabe, A.; Tokushige, Y.; Kiyohara, T.; Wang, Z.; Wang, C.; Fang, Z.; Zhang, D.; Liu, L.; et al. Characterization of resistance to pine wood nematode infection in Pinus thunbergii using suppression subtractive hybridization. BMC Plant Biol. 2012, 12, 13. [Google Scholar] [CrossRef] [Green Version]
  6. Xu, L.; Liu, Z.-Y.; Zhang, K.; Lu, Q.; Liang, J.; Zhang, X.-Y. Characterization of the Pinus massoniana transcriptional response to Bursaphelenchus xylophilus infection using suppression subtractive hybridization. Int. J. Mol. Sci. 2013, 14, 11356–11375. [Google Scholar] [CrossRef] [PubMed]
  7. Mota, M.; Braasch, H.; Bravo, M.A.; Penas, A.C.; Burgermeister, W.; Metge, K.; Sousa, E. First report of Bursaphelenchus xylophilus in Portugal and in Europe. Nematology 1999, 1, 727–734. [Google Scholar] [CrossRef]
  8. Gaspar, D.; Trindade, C.; Usié, A.; Meireles, B.; Barbosa, P.; Fortes, A.; Pesquita, C.; Costa, R.; Ramos, A. Expression Profiling in Pinus pinaster in Response to Infection with the Pine Wood Nematode Bursaphelenchus xylophilus. Forests 2017, 8, 279. [Google Scholar] [CrossRef] [Green Version]
  9. Santos, C.S.; Pinheiro, M.; Silva, A.I.; Egas, C.; Vasconcelos, M.W. Searching for resistance genes to Bursaphelenchus xylophilus using high throughput screening. BMC Genomics 2012, 13, 599. [Google Scholar] [CrossRef] [Green Version]
  10. Rassati, D.; Toffolo, E.P.; Battisti, A.; Faccoli, M. Monitoring of the pine sawyer beetle Monochamus galloprovincialis by pheromone traps in Italy. Phytoparasitica 2012, 40, 329–336. [Google Scholar] [CrossRef]
  11. Farjon, A.; Rushforth, K.; Christian, T. Pinus yunnanensis var. yunnanensis. The IUCN Red List of Threatened Species 2013: E.T191652A1991491. Available online: https://dx.doi.org/10.2305/IUCN.UK.2013-1.RLTS.T191652A1991491.en (accessed on 7 February 2018).
  12. C.A.B International. Pines of Silvicultural Importance, 1st ed.; CABI Pub: Oxon, UK, 2002. [Google Scholar]
  13. Wang, X.Z.; Wang, L.F.; Wang, Y.; Huang, Y.Q.; Ding, Z.G.; Zhou, J.; Gou, D.P. Identification and genetic analysis of the pinewood nematode Bursaphelenchus xylophilus from Pinus yunnanensis. For. Pathol. 2015, 45, 388–399. [Google Scholar] [CrossRef]
  14. Fielding, N.J.; Evans, H.F. The pine wood nematode Bursaphelenchus xylophilus (Steiner and Buhrer) Nickle (= B. lignicolus Mamiya and Kiyohara): An assessment of the current position. Forestry 1996, 69, 35–46. [Google Scholar] [CrossRef] [Green Version]
  15. Baermann, G. Ein einfache Methode zur Auffindung von Anklyostomum (Nematoden) Larven in Erdproben. Ned Tijdschr Geneeskd 1917, 57, 131–137. [Google Scholar]
  16. Futai, K.; Furuno, T. The variety of resistances among pine species to pine wood nematode, Bursaphelenchus lignicolus. Bull. Kyoto Univ. For. 1979, 51, 23–36. [Google Scholar]
  17. Le Provost, G.; Herrera, R.; Paiva, J.A.; Chaumeil, P.; Salin, F.; Plomion, C. A micromethod for high throughput RNA extraction in forest trees. Biol. Res. 2007, 40, 291–297. [Google Scholar] [CrossRef] [Green Version]
  18. Andrews, S. FastQC—A Quality Control Tool for High Throughput Sequence Data; Babraham Bioinformatics, Babraham Institute: Cambridge, UK, 2010. [Google Scholar]
  19. Joshi, N.; Fass, J. Sickle: A Sliding-Window, Adaptive, Quality-Based Trimming Tool for FastQ files, Version 1.33. 2011.
  20. Grabherr, M.G.; Haas, B.J.; Yassour, M.; Levin, J.Z.; Thompson, D.A.; Amit, I.; Adiconis, X.; Fan, L.; Raychowdhury, R.; Zeng, Q.; et al. Full-length transcriptome assembly from RNA-Seq data without a reference genome. Nat. Biotechnol. 2011, 29, 644–652. [Google Scholar] [CrossRef] [Green Version]
  21. Huang, X.; Madan, A. CAP3: A DNA sequence assembly program. Genome Res. 1999, 9, 868–877. [Google Scholar] [CrossRef] [Green Version]
  22. Haas, B. TransDecoder (Find Coding Regions within Transcripts). Available online: http://transdecoder.github.io (accessed on 16 May 2016).
  23. Boeckmann, B.; Bairoch, A.; Apweiler, R.; Blatter, M.-C.; Estreicher, A.; Gasteiger, E.; Martin, M.J.; Michoud, K.; O’Donovan, C.; Phan, I.; et al. The SWISS-PROT protein knowledgebase and its supplement TrEMBL in 2003. Nucleic Acids Res. 2003, 31, 365–370. [Google Scholar] [CrossRef]
  24. Finn, R.D.; Coggill, P.; Eberhardt, R.Y.; Eddy, S.R.; Mistry, J.; Mitchell, A.L.; Potter, S.C.; Punta, M.; Qureshi, M.; Sangrador-Vegas, A.; et al. The Pfam protein families database: Towards a more sustainable future. Nucleic Acids Res. 2015, 44, D279–D285. [Google Scholar] [CrossRef]
  25. Altschul, S.F.; Gish, W.; Miller, W.; Myers, E.W.; Lipman, D.J. Basic local alignment search tool. J. Mol. Biol. 1990, 215, 403–410. [Google Scholar] [CrossRef]
  26. Eddy, S.R. Multiple alignment using hidden Markov models. Proc. Int. Conf. Intell. Syst. Mol. Biol. 1995, 3, 114–120. [Google Scholar]
  27. Srivastava, A.; Sarkar, H.; Patro, R. RapMap: A Rapid, Sensitive and Accurate Tool for Mapping RNA-seq Reads to Transcriptomes. bioRxiv 2015, 32, 192–200. [Google Scholar] [CrossRef] [PubMed] [Green Version]
  28. Robinson, M.D.; McCarthy, D.J.; Smyth, G.K. edgeR: A Bioconductor package for differential expression analysis of digital gene expression data. Bioinformatics 2009, 26, 139–140. [Google Scholar] [CrossRef] [PubMed] [Green Version]
  29. Robinson, M.D.; Oshlack, A. A scaling normalization method for differential expression analysis of RNA-seq data. Genome Biol. 2010, 11, R25. [Google Scholar] [CrossRef] [Green Version]
  30. McCarthy, D.J.; Chen, Y.; Smyth, G.K. Differential expression analysis of multifactor RNA-Seq experiments with respect to biological variation. Nucleic Acids Res. 2012, 40, 4288–4297. [Google Scholar] [CrossRef] [PubMed] [Green Version]
  31. Sebastiana, M.; Vieira, B.; Lino-Neto, T.; Monteiro, F.; Figueiredo, A.; Sousa, L.; Pais, M.S.; Tavares, R.; Paulo, O.S. Oak Root Response to Ectomycorrhizal Symbiosis Establishment: RNA-Seq Derived Transcript Identification and Expression Profiling. PLoS ONE 2014, 9, e98376. [Google Scholar] [CrossRef] [PubMed] [Green Version]
  32. Untergasser, A.; Nijveen, H.; Rao, X.; Bisseling, T.; Geurts, R.; Leunissen, J.A.M. Primer3Plus, an enhanced web interface to Primer3. Nucleic Acids Res. 2007, 35, W71–W74. [Google Scholar] [CrossRef] [Green Version]
  33. Livak, K.J.; Schmittgen, T.D. Analysis of Relative Gene Expression Data Using Real-Time Quantitative PCR and the 2−ΔΔCT Method. Methods 2001, 25, 402–408. [Google Scholar] [CrossRef]
  34. Quevillon, E.; Silventoinen, V.; Pillai, S.; Harte, N.; Mulder, N.; Apweiler, R.; Lopez, R. InterProScan: Protein domains identifier. Nucleic Acids Res. 2005, 33, W116–W120. [Google Scholar] [CrossRef] [Green Version]
  35. Jones, P.; Binns, D.; Chang, H.-Y.; Fraser, M.; Li, W.; McAnulla, C.; McWilliam, H.; Maslen, J.; Mitchell, A.; Nuka, G.; et al. InterProScan 5: Genome-scale protein function classification. Bioinformatics 2014, 30, 1236–1240. [Google Scholar] [CrossRef] [Green Version]
  36. Ashburner, M.; Ball, C.A.; Blake, J.A.; Botstein, D.; Butler, H.; Cherry, J.M.; Davis, A.P.; Dolinski, K.; Dwight, S.S.; Eppig, J.T.; et al. Gene ontology: Tool for the unification of biology. The Gene Ontology Consortium. Nat. Genet. 2000, 25, 25–29. [Google Scholar] [CrossRef] [Green Version]
  37. Kanehisa, M.; Goto, S. KEGG: Kyoto encyclopedia of genes and genomes. Nucleic Acids Res. 2000, 28, 27–30. [Google Scholar] [CrossRef] [PubMed]
  38. Zhi-Liang, H.; Jie, B.; James, M.R. CateGOrizer: A Web-Based Program to Batch Analyze Gene Ontology Classification Categories. Online J. Bioinform. 2008, 9, 108–112. [Google Scholar]
  39. Shannon, P.; Markiel, A.; Ozier, O.; Baliga, N.S.; Wang, J.T.; Ramage, D.; Amin, N.; Schwikowski, B.; Ideker, T. Cytoscape: A software environment for integrated models of biomolecular interaction networks. Genome Res. 2003, 13, 2498–2504. [Google Scholar] [CrossRef] [PubMed]
  40. Maere, S.; Heymans, K.; Kuiper, M. BiNGO: A Cytoscape plugin to assess overrepresentation of gene ontology categories in biological networks. Bioinformatics 2005, 21, 3448–3449. [Google Scholar] [CrossRef] [Green Version]
  41. Chittoor, J.M.; Leach, J.E.; White, F.F. Differential Induction of a Peroxidase Gene Family During Infection of Rice by Xanthomonas oryzae pv. oryzae. Mol. Plant Microbe Interact. 1997, 10, 861–871. [Google Scholar] [CrossRef] [Green Version]
  42. Singh, B.; Sharma, R.A. Plant terpenes: Defense responses, phylogenetic analysis, regulation and clinical applications. 3 Biotech 2015, 5, 129–151. [Google Scholar] [CrossRef] [Green Version]
  43. Hunter, W.N. The non-mevalonate pathway of isoprenoid precursor biosynthesis. J. Biol. Chem. 2007, 282, 21573–21577. [Google Scholar] [CrossRef] [Green Version]
  44. Skryhan, K.; Gurrieri, L.; Sparla, F.; Trost, P.; Blennow, A. Redox regulation of starch metabolism. Front. Plant Sci. 2018, 9, 1–8. [Google Scholar] [CrossRef] [Green Version]
  45. Morkunas, I.; Ratajczak, L. The role of sugar signaling in plant defense responses against fungal pathogens. Acta Physiol. Plant. 2014, 36, 1607–1619. [Google Scholar] [CrossRef] [Green Version]
  46. Tauzin, A.S.; Giardina, T. Sucrose and invertases, a part of the plant defense response to the biotic stresses. Front. Plant Sci. 2014, 5, 293. [Google Scholar] [CrossRef]
  47. Ryss, A.Y.; Kulinich, O.A.; Sutherland, J.R. Pine wilt disease: A short review of worldwide research. For. Stud. China 2011, 13, 132–138. [Google Scholar] [CrossRef]
  48. Trindade, C. Avaliação da Expressão de Genes Relacionados com a Susceptibilidade a Bursaphelenchus xylophilus, Agente Causal da Doença da Murchidão dos Pinheiros (Pine Wilt Disease) em Pinus pinaster Ait e Pinus yunannensis Franch; Universidade de Lisboa: Lisboa, Portugal, 2012. [Google Scholar]
  49. War, A.R.; Paulraj, M.G.; Ahmad, T.; Buhroo, A.A.; Hussain, B.; Ignacimuthu, S.; Sharma, H.C. Mechanisms of plant defense against insect herbivores. Plant Signal. Behav. 2012, 7, 1306–1320. [Google Scholar] [CrossRef] [PubMed] [Green Version]
  50. Rejeb, I.B.; Pastor, V.; Mauch-Mani, B. Plant Responses to Simultaneous Biotic and Abiotic Stress: Molecular Mechanisms. Plants (Basel, Switz.) 2014, 3, 458–475. [Google Scholar] [CrossRef] [PubMed]
  51. Koornneef, A.; Pieterse, C.M.J. Cross talk in defense signaling. Plant Physiol. 2008, 146, 839–844. [Google Scholar] [CrossRef] [PubMed] [Green Version]
  52. Ambawat, S.; Sharma, P.; Yadav, N.R.; Yadav, R.C. MYB transcription factor genes as regulators for plant responses: An overview. Physiol. Mol. Biol. Plants 2013, 19, 307–321. [Google Scholar] [CrossRef] [PubMed] [Green Version]
  53. Van de Poel, B.; Van Der Straeten, D. 1-aminocyclopropane-1-carboxylic acid (ACC) in plants: More than just the precursor of ethylene! Front. Plant Sci. 2014, 5, 640. [Google Scholar] [CrossRef] [PubMed] [Green Version]
  54. Lamb, C.; Dixon, R.A. THE OXIDATIVE BURST IN PLANT DISEASE RESISTANCE. Annu. Rev. Plant Physiol. Plant Mol. Biol. 1997, 48, 251–275. [Google Scholar] [CrossRef]
  55. Schieber, M.; Chandel, N.S. ROS function in redox signaling and oxidative stress. Curr. Biol. 2014, 24, R453–R462. [Google Scholar] [CrossRef] [Green Version]
  56. Alscher, R.G.; Erturk, N.; Heath, L.S. Role of superoxide dismutases (SODs) in controlling oxidative stress in plants. J. Exp. Bot. 2002, 53, 1331–1341. [Google Scholar] [CrossRef]
  57. Kilili, K.G.; Atanassova, N.; Vardanyan, A.; Clatot, N.; Al-Sabarna, K.; Kanellopoulos, P.N.; Makris, A.M.; Kampranis, S.C. Differential roles of tau class glutathione S-transferases in oxidative stress. J. Biol. Chem. 2004, 279, 24540–24551. [Google Scholar] [CrossRef] [Green Version]
  58. Shahrtash, M. Plant glutathione s-transferases function during environmental stresses: A review article. Rom. J. Biol. Plant Biol. 2013, 58, 19–25. [Google Scholar]
  59. Sharma, R.; Sahoo, A.; Devendran, R.; Jain, M. Over-expression of a rice tau class glutathione s-transferase gene improves tolerance to salinity and oxidative stresses in Arabidopsis. PLoS ONE 2014, 9, e92900. [Google Scholar] [CrossRef] [PubMed] [Green Version]
  60. Nakai, Y.; Nakahira, Y.; Sumida, H.; Takebayashi, K.; Nagasawa, Y.; Yamasaki, K.; Akiyama, M.; Ohme-Takagi, M.; Fujiwara, S.; Shiina, T.; et al. Vascular plant one-zinc-finger protein 1/2 transcription factors regulate abiotic and biotic stress responses in Arabidopsis. Plant J. 2013, 73, 761–775. [Google Scholar] [CrossRef] [PubMed]
  61. Nawrot, R.; Barylski, J.; Nowicki, G.; Broniarczyk, J.; Buchwald, W.; Goździcka-Józefiak, A. Plant antimicrobial peptides. Folia Microbiol. (Praha) 2014, 59, 181–196. [Google Scholar] [CrossRef] [Green Version]
  62. Salas, C.E.; Badillo-Corona, J.A.; Ramírez-Sotelo, G.; Oliver-Salvador, C. Biologically active and antimicrobial peptides from plants. Biomed Res. Int. 2015, 2015, 102129. [Google Scholar] [CrossRef] [Green Version]
  63. Parage, C.; Tavares, R.; Réty, S.; Baltenweck-Guyot, R.; Poutaraud, A.; Renault, L.; Heintz, D.; Lugan, R.; Marais, G.A.B.; Aubourg, S.; et al. Structural, functional, and evolutionary analysis of the unusually large stilbene synthase gene family in grapevine. Plant Physiol. 2012, 160, 1407–1419. [Google Scholar] [CrossRef] [Green Version]
  64. Kodan, A.; Kuroda, H.; Sakai, F. A stilbene synthase from Japanese red pine (Pinus densiflora): Implications for phytoalexin accumulation and down-regulation of flavonoid biosynthesis. Proc. Natl. Acad. Sci. USA 2002, 99, 3335–3339. [Google Scholar] [CrossRef] [Green Version]
  65. Sharma, N.; Sharma, K.; Gaur, R.; Gupta, V. Role of Chitinase in Plant Defense. Asian J. Biochem. 2011, 29–37. [Google Scholar] [CrossRef] [Green Version]
  66. Miedes, E.; Vanholme, R.; Boerjan, W.; Molina, A. The role of the secondary cell wall in plant resistance to pathogens. Front. Plant Sci. 2014, 5, 358. [Google Scholar] [CrossRef] [Green Version]
  67. Malinovsky, F.G.; Fangel, J.U.; Willats, W.G.T. The role of the cell wall in plant immunity. Front. Plant Sci. 2014, 5, 178. [Google Scholar] [CrossRef] [Green Version]
  68. Lauvergeat, V.; Lacomme, C.; Lacombe, E.; Lasserre, E.; Roby, D.; Grima-Pettenati, J. Two cinnamoyl-CoA reductase (CCR) genes from Arabidopsis thaliana are differentially expressed during development and in response to infection with pathogenic bacteria. Phytochemistry 2001, 57, 1187–1195. [Google Scholar] [CrossRef]
  69. Waters, E.R.; Lee, G.J.; Vierling, E. Evolution, structure and function of the small heat shock proteins in plants. J. Exp. Bot. 1996, 47, 325–338. [Google Scholar] [CrossRef]
  70. Al-Whaibi, M.H. Plant heat-shock proteins: A mini review. J. King Saud. Univ. Sci. 2011, 23, 139–150. [Google Scholar] [CrossRef] [Green Version]
  71. Cao, J.; Lv, Y.; Hou, Z.; Li, X.; Ding, L. Expansion and evolution of thaumatin-like protein (TLP) gene family in six plants. Plant Growth Regul. 2016, 79, 299–307. [Google Scholar] [CrossRef]
  72. Shin, H.; Lee, H.; Woo, K.S.; Noh, E.W.; Koo, Y.B.; Lee, K.J. Identification of genes upregulated by pinewood nematode inoculation in Japanese red pine. Tree Physiol. 2009, 29, 411–421. [Google Scholar] [CrossRef] [PubMed] [Green Version]
  73. Bommer, U.A.; Thiele, B.J. The translationally controlled tumour protein (TCTP). Int. J. Biochem. Cell Biol. 2004, 36, 379–385. [Google Scholar] [CrossRef]
  74. Kim, Y.-M.; Han, Y.-J.; Hwang, O.-J.; Lee, S.-S.; Shin, A.-Y.; Kim, S.Y.; Kim, J.-I. Overexpression of Arabidopsis Translationally Controlled Tumor Protein Gene AtTCTP Enhances Drought Tolerance with Rapid ABA-Induced Stomatal Closure. Mol. Cells 2012, 33, 617–626. [Google Scholar] [CrossRef] [Green Version]
  75. Torii, K.U. Leucine-Rich Repeat Receptor Kinases in Plants: Structure, Function, and Signal Transduction Pathways. Int. Rev. Cytol. 2004, 234, 1–46. [Google Scholar] [CrossRef]
Figure 1. Number of differentially expressed genes (DEG) up- and down-regulated uniquely for each comparison. Pinus pinaster DEG are shown in green bars; Pinus yunnanensis DEG are shown in blue bars.
Forests 11 00204 g001
Figure 2. Fold Change for each of the transcripts selected for validation. The values are represented as the Log2 of the normalized expression value of both RNA-sequencing (RNA-Seq) and quantitative real-time polymerase chain reaction (qRT-PCR) data at time points Py3—48 h and py4—7 days.
Forests 11 00204 g002
Figure 3. Gene expression correlation between RNA-sequencing (RNA-Seq) and quantitative real-time polymerase chain reaction (qRT-PCR) data. Each green dot indicates the selected genes at the Py3—48 h and Py4—7 days time points (n = 12).
Forests 11 00204 g003
Figure 4. Distribution of the top ten species with more BLAST hits retrieved from the NCBI NR-plants database. The bar plot shows the number of Pinus yunnanensis genes whose best-matching protein hits were from the indicated species.
Forests 11 00204 g004
Figure 5. Representation of the KEGG pathways with more DEG interactions. Left pie chart displays the total differential expressed gene (DEG) interactions over the 94 different KEGG pathways, while, the secondary pie chart ranks the 10 pathways with more DEG interactions.
Forests 11 00204 g005
Figure 6. Representation of differential expressed genes (DEG) interactions over KEGG pathways between neighboring data sets. The number of DEG interactions shared by neighbor data sets were shown in the overlapping regions.
Forests 11 00204 g006
Figure 7. Phenylpropanoid biosynthesis pathway with interactions assigned to DEG in Pinus pinaster (A) and in Pinus yunnanensis (B) at the first time point after inoculation (6 + 24 h). The blue node represents the pathway. The circular nodes represent DEG assigned to the pathway. Note that due to the complexity of representing the expression values of those genes in all the stages, the expression was colored on an RGB scale that goes from the most down-regulated in red to the most up-regulated in green.
Forests 11 00204 g007
Figure 8. Phenylpropanoid biosynthesis pathway with interactions assigned to DEG in Pinus pinaster (A) and in Pinus yunnanensis (B) at the second time point after inoculation (48 h). The blue node represents the pathway. The circular nodes represent DEG assigned to the pathway. Note that due to the complexity of representing the expression values of those genes in all the stages, the expression was colored on an RGB scale that goes from the most down-regulated in red to the most up-regulated in green.
Forests 11 00204 g008
Figure 9. Terpenoid backbone biosynthesis pathway with interactions assigned to DEG in Pinus pinaster (A) and in Pinus yunnanensis (B) at the first time point after inoculation (6 + 24 h). The blue node represents the pathway. The circular nodes represent DEG related to the pathway. Note that due to the complexity of representing the expression values of those genes in all the stages, the expression was colored on an RGB (red, green, blue) scale that goes from the most down-regulated in red to the most up-regulated in green.
Forests 11 00204 g009
Figure 10. Terpenoid backbone biosynthesis pathway with interactions assigned to DEG in Pinus pinaster (A) and in Pinus yunnanensis (B) at the second time point after inoculation (48 h). The blue node represents the pathway. The circular nodes represent DEG related to the pathway. Note that due to the complexity of representing the expression values of those genes in all the stages, the expression was colored on an RGB scale that goes from the most down-regulated in red to the most up-regulated in green.
Forests 11 00204 g010
Figure 11. Cutin, suberin, and wax biosynthesis pathway with interactions assigned to DEG in Pinus pinaster (A) and in Pinus yunnanensis (B) at the first time point after inoculation (6 + 24 h). The blue node represents the pathway. The circular nodes represent DEG related to the pathway. Note that due to the complexity of representing the expression values of those genes in all the stages, the expression was colored on an RGB scale that goes from the most down-regulated in red to the most up-regulated in green.
Forests 11 00204 g011
Figure 12. Cutin, suberin, and wax biosynthesis pathway with interactions assigned to DEG in Pinus pinaster (A) and in Pinus yunnanensis (B) at the second time point after inoculation (48 h). The blue node represents the pathway. The circular nodes represent DEG related to the pathway. Note that due to the complexity of representing the expression values of those genes in all the stages, the expression was colored on an RGB scale that goes from the most down-regulated in red to the most up-regulated in green.
Forests 11 00204 g012
Figure 13. Starch and sucrose metabolism pathway with interactions assigned to DEG in Pinus pinaster (A) and in Pinus yunnanensis (B) at the third time point after inoculation (7 days). The blue node represents the pathway. The circular nodes represent DEG related to the pathway. Note that due to the complexity of representing the expression values of those genes in all the stages, the expression was colored on an RGB scale that goes from the most down-regulated in red to the most up-regulated in green.
Forests 11 00204 g013
Figure 14. Pinus yunnanensis (A) and Pinus pinaster (B) individuals two months after infection with PWN (Trindade 2012). While Yunnan pine shows no signs of PWD, these are quite evident in maritime pine.
Forests 11 00204 g014
Table 1. Quality control metrics. Number of sequenced reads and the average read length for each library. Number and percentage of processed reads after control quality.
SampleNumber of Sequenced ReadsAverage Read Length (bp)Number of Reads after QC% Reads after QC
Py1—control43,708,07411335,593,60781.4
Py2—6 h + 24 h40,281,44211432,313,52480.2
Py3—48 h39,601,16211029,720,84875.1
Py4—7 days45,743,26910935,642,59077.9
Total169,333,947111133,270,56978.7
Table 2. Mapping statistics for each sequenced library. Number and percentage of mapped and unique mapped reads.
SampleNumber of Mapped ReadsNumber of Uniquely Mapped Reads% of Mapped Reads% of Uniquely Mapped Reads
Py1—Control26,850,45816,937,90675.4%47.6%
Py2—6 h + 24 h24,124,05515,319,55474.7%47.4%
Py3—48 h23,420,58314,894,12178.8%50.1%
Py4—7 days28,578,52818,221,64980.2%51.1%
Total102,973,62465,373,23077.3%49.1%

