Comparison of Tree Biomass Modeling Approaches for Larch (Larix olgensis Henry) Trees in Northeast China


Abstract
1. Introduction
2. Materials and Methods
2.1. Data
2.2. Model Specification and Estimation
2.2.1. Base Model
2.2.2. Mixed Effects Model
2.2.3. Aggregated Model Systems
- Aggregated model systems with one constraint
- Aggregated model systems with no constraint
2.2.4. Disaggregated Model Systems
- Disaggregated model systems without an aboveground biomass model
- Disaggregated model systems with an aboveground biomass model
2.2.5. Parameter Estimation Methods
2.2.6. Weighting Function for Heteroscedasticity
2.3. Model Evaluation and Validation
2.4. Comparison of Different Biomass Modeling Approaches
3. Results
3.1. BM and MEM Based on and
3.2. AMS1 and AMS2 Based on and
3.3. DMS1 and DMS2 Based on and
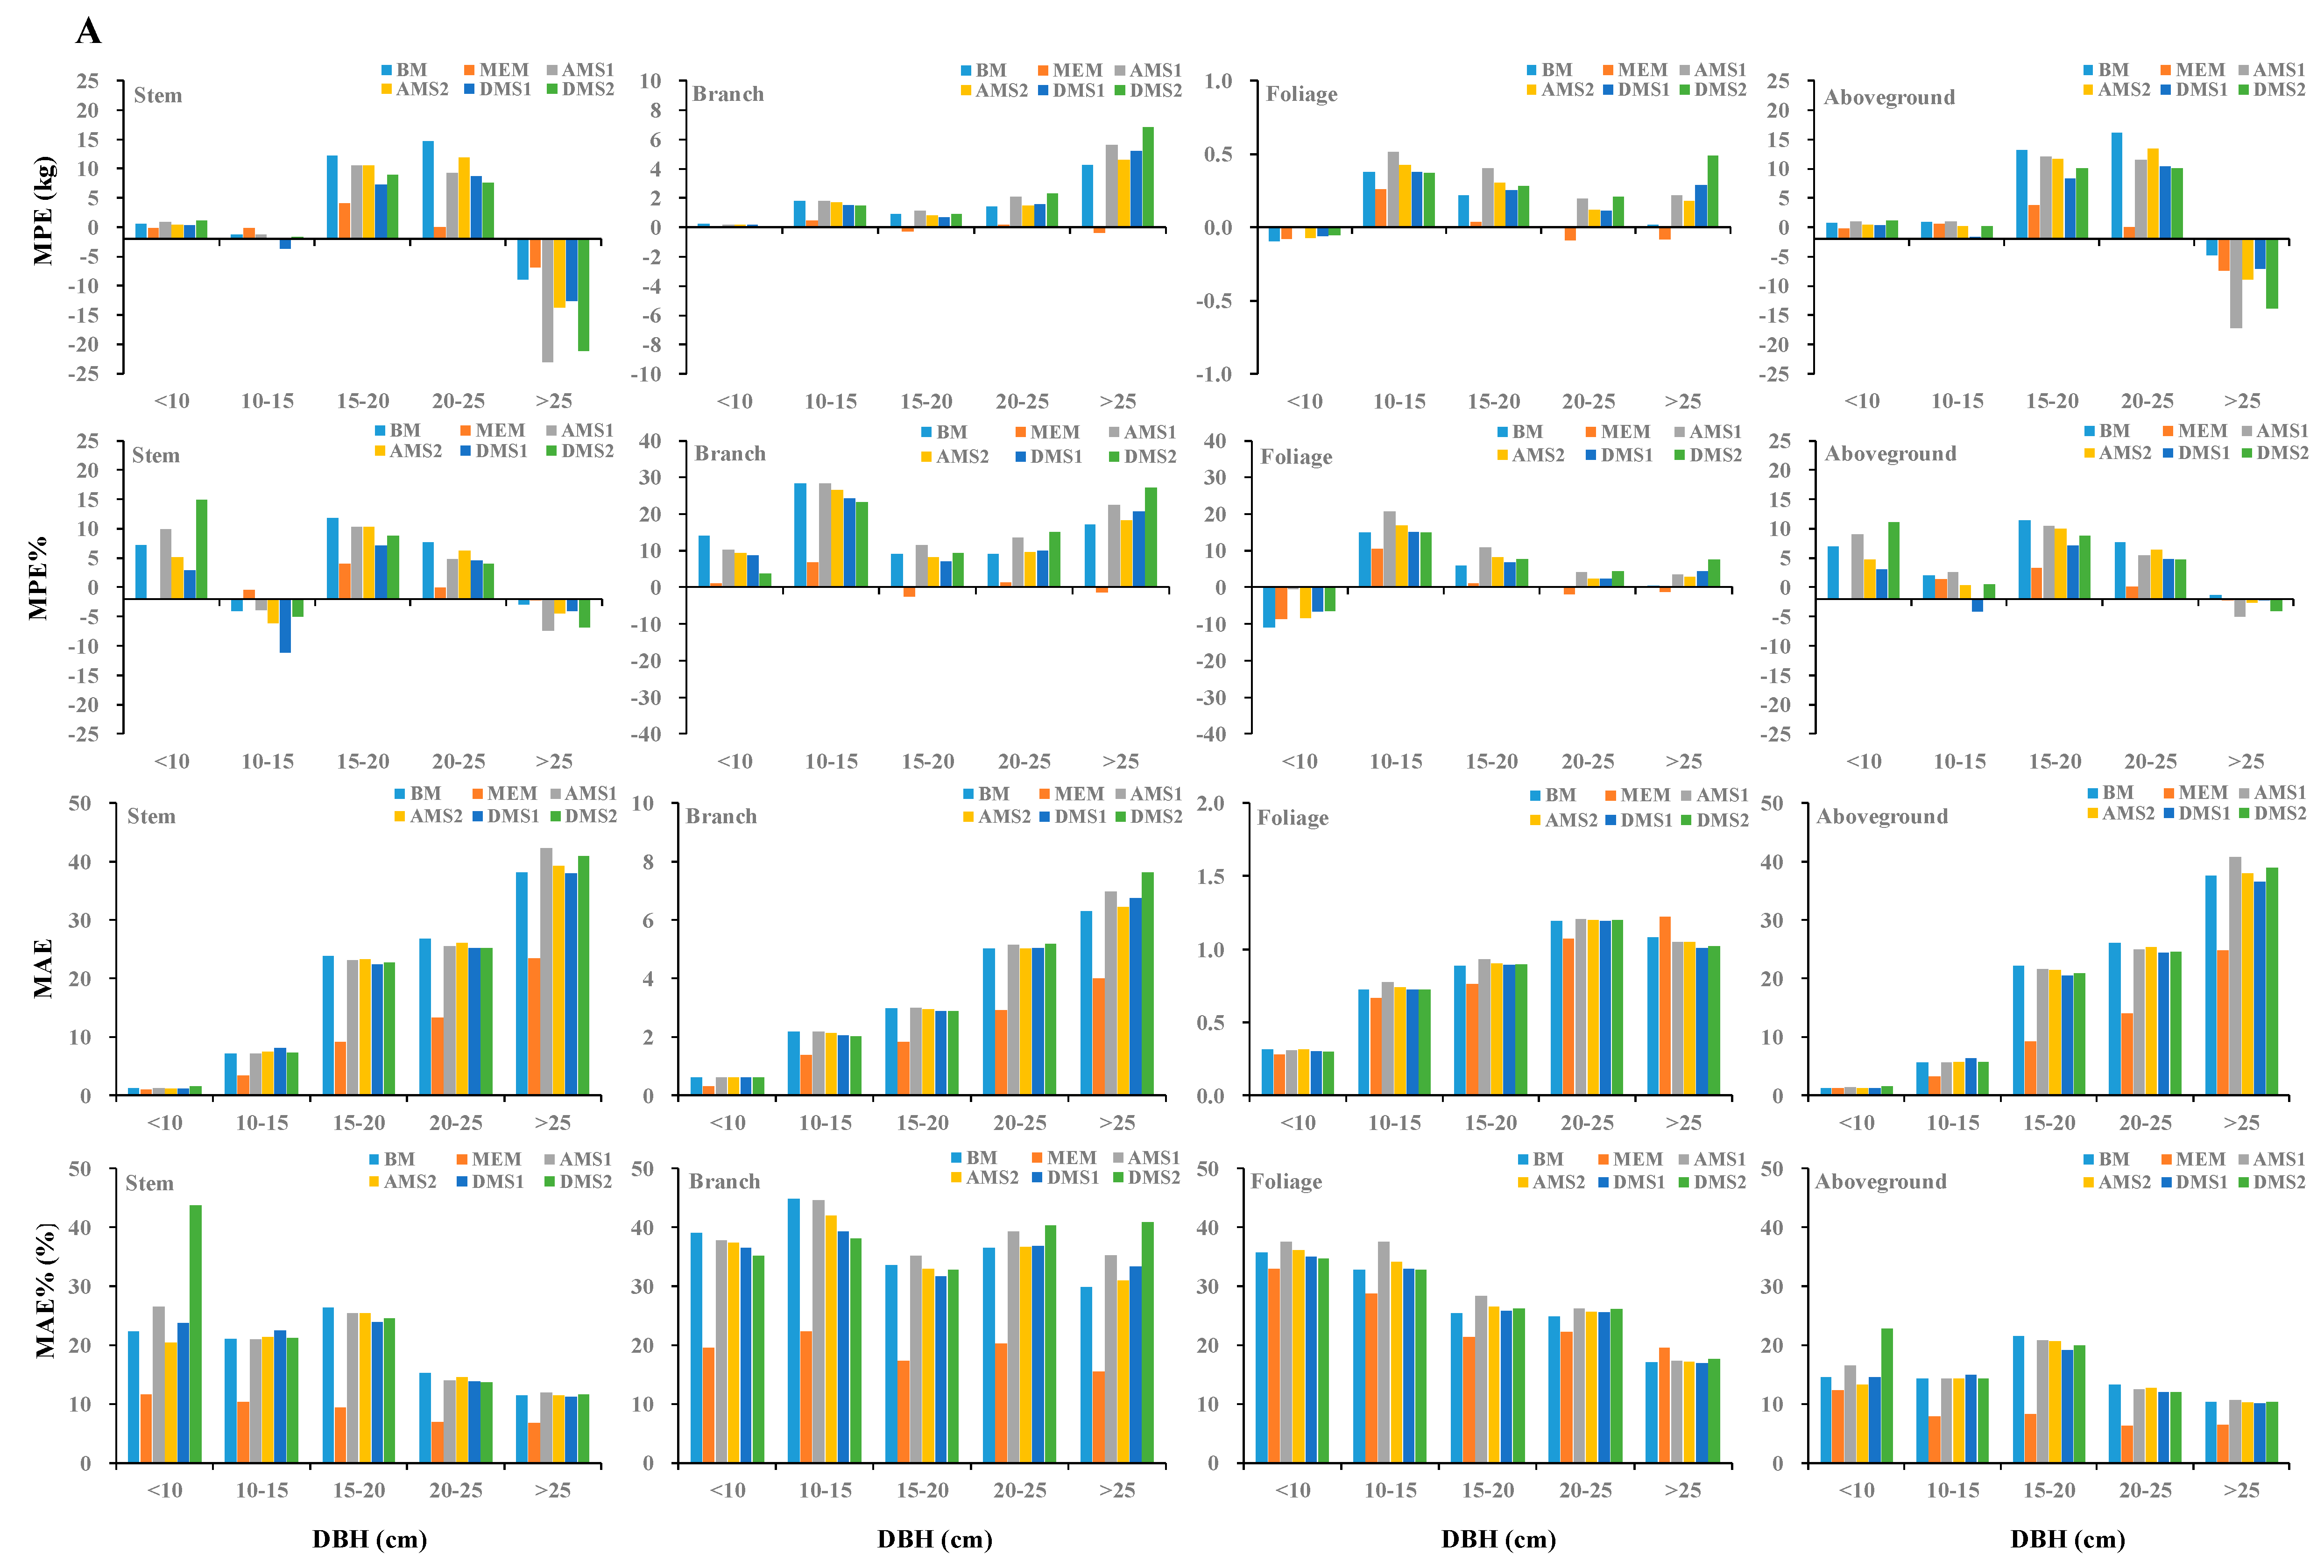
3.4. Comparison between Different Biomass Modeling Approaches
4. Discussions
5. Conclusions
Author Contributions
Funding
Acknowledgments
Conflicts of Interest
References
- State Forestry and Grassland Administration. The Ninth Forest Resource Survey Report (2014–2018); China forestry press: Beijing, China, 2019; p. 451. (In Chinese) [Google Scholar]
- Konôpka, B.; Pajtík, J.; Noguchi, K.; Lukac, M. Replacing Norway spruce with European beech: A comparison of biomass and net primary production patterns in young stands. For. Ecol. Manag. 2013, 302, 185–192. [Google Scholar] [CrossRef]
- Houghton, R.A. Aboveground Forest Biomass and the Global Carbon Balance. Glob. Chang. Biol. 2005, 11, 945–958. [Google Scholar] [CrossRef]
- Zeng, W.S.; Duo, H.; Lei, X.; Chen, X.; Wang, X.; Pu, Y.; Zou, W. Individual tree biomass equations and growth models sensitive to climate variables forLarixspp in China. Eur. J. For. Res. 2017, 136, 233–249. [Google Scholar] [CrossRef]
- Dong, L.H.; Zhang, L.J.; Li, F.R. Developing Two additive biomass equations for three coniferous plantation species in Northeast China. Forests 2016, 7, 136. [Google Scholar] [CrossRef]
- Bi, H.; Turner, J.; Lambert, M.J. Additive biomass equations for native eucalypt forest trees of temperate Australia. Trees 2004, 18, 467–479. [Google Scholar] [CrossRef]
- Dong, L.; Zhang, L.; Li, F. A Three-Step Proportional Weighting System of Nonlinear Biomass Equations. For. Sci. 2015, 61, 35–45. [Google Scholar] [CrossRef]
- Weiskittel, A.R.; MacFarlane, D.W.; Radtke, P.J.; Affleck, D.L.R.; Temesgen, H.; Woodall, C.W.; Westfall, J.A.; Coulston, J.W. A Call to Improve Methods for Estimating Tree Biomass for Regional and National Assessments. J. For. 2015, 113, 414–424. [Google Scholar] [CrossRef]
- Zhao, D.; Kane, M.; Markewitz, D.; Teskey, R.; Clutter, M. Additive Tree Biomass Equations for Midrotation Loblolly Pine Plantations. For. Sci. 2015, 61, 613–623. [Google Scholar] [CrossRef]
- Wang, C. Biomass allometric equations for 10 co-occurring tree species in Chinese temperate forests. For. Ecol. Manag. 2006, 222, 9–16. [Google Scholar] [CrossRef]
- Henry, M.; Picard, N.; Trotta, C.; Manlay, R.J.; Valentini, R.; Bernoux, M.; Saint-Andre, L. Estimating Tree Biomass of Sub-Saharan African Forests: A Review of Available Allometric Equations. Silva Fenn. 2011, 45, 477–569. [Google Scholar] [CrossRef]
- Chave, J.; Rejou-Mechain, M.; Burquez, A.; Chidumayo, E.; Colgan, M.S.; Delitti, W.B.C.; Duque, A.; Eid, T.; Fearnside, P.M.; Goodman, R.C.; et al. Improved allometric models to estimate the aboveground biomass of tropical trees. Glob. Chang. Biol. 2014, 20, 3177–3190. [Google Scholar] [CrossRef]
- Sileshi, W.G. A critical review of forest biomass estimation models, common mistakes and corrective measures. For. Ecol. Manag. 2014, 329, 237–254. [Google Scholar] [CrossRef]
- Temesgen, H.; Affleck, D.; Poudel, K.; Gray, A.; Sessions, J. A review of the challenges and opportunities in estimating above ground forest biomass using tree-level models. Scand. J. For. Res. 2015, 30, 326–335. [Google Scholar] [CrossRef]
- Yuen, J.Q.; Fung, T.; Ziegler, A.D. Review of allometric equations for major land covers in SE Asia: Uncertainty and implications for above- and below-ground carbon estimates. For. Ecol. Manag. 2016, 360, 323–340. [Google Scholar] [CrossRef]
- Wang, X.; Zhao, D.; Liu, G.; Yang, C.; Teskey, R.O. Additive tree biomass equations for Betula platyphylla Suk plantations in Northeast China. Ann. For. Sci. 2018, 75, 60. [Google Scholar] [CrossRef]
- Kralicek, K.; Huy, B.; Poudel, K.P.; Temesgen, H.; Salas, C. Simultaneous estimation of above- and below-ground biomass in tropical forests of Viet Nam. For. Ecol. Manag. 2017, 390, 147–156. [Google Scholar] [CrossRef]
- Bi, H.; Murphy, S.; Volkova, L.; Weston, C.; Fairman, T.; Li, Y.; Law, R.; Norris, J.; Lei, X.; Caccamo, G. Additive biomass equations based on complete weighing of sample trees for open eucalypt forest species in south-eastern Australia. For. Ecol. Manag. 2015, 349, 106–121. [Google Scholar] [CrossRef]
- Meng, S.; Liu, Q.; Zhou, G.; Jia, Q.; Zhuang, H.; Zhou, H. Aboveground tree additive biomass equations for two dominant deciduous tree species in Daxing’anling, northernmost China. J. For. Res. 2017, 22, 233–240. [Google Scholar] [CrossRef]
- Dong, L.; Zhang, L.; Li, F. Additive Biomass Equations Based on Different Dendrometric Variables for Two Dominant Species (Larix gmelini Rupr. and Betula platyphylla Suk.) in Natural Forests in the Eastern Daxing’an Mountains, Northeast China. Forests 2018, 9, 261. [Google Scholar] [CrossRef]
- Fu, L.; Lei, Y.; Wang, G.; Bi, H.; Tang, S.; Song, X. Comparison of seemingly unrelated regressions with error-in-variable models for developing a system of nonlinear additive biomass equations. Trees 2016, 30, 839–857. [Google Scholar] [CrossRef]
- Lei, Y.; Fu, L.; Affleck, D.L.R.; Nelson, A.S.; Shen, C.; Wang, M.; Zheng, J.; Ye, Q.; Yang, G. Additivity of nonlinear tree crown width models: Aggregated and disaggregated model structures using nonlinear simultaneous equations. For. Ecol. Manage. 2018, 427, 372–382. [Google Scholar] [CrossRef]
- Zhao, D.; Westfall, J.; Coulston, J.W.; Lynch, T.B.; Bullock, B.P.; Montes, C.R. Additive biomass equations for slash pine trees: Comparing three modeling approaches. Can. J. For. Res. 2019, 49, 27–40. [Google Scholar] [CrossRef]
- Zhou, X.; Brandle, J.R.; Schoeneberger, M.M.; Awada, T. Developing above-ground woody biomass equations for open-grown, multiple-stemmed tree species: Shelterbelt-grown Russian-olive. Ecol. Model. 2007, 202, 311–323. [Google Scholar] [CrossRef]
- Koala, J.; Sawadogo, L.; Savadogo, P.; Aynekulu, E.; Heiskanen, J.; Said, M. Allometric equations for below-ground biomass of four key woody species in West African savanna-woodlands. Silva Fenn. 2017, 51, 1631. [Google Scholar] [CrossRef]
- Kenzo, T.; Himmapan, W.; Yoneda, R.; Tedsorn, N.; Vacharangkura, T.; Hitsuma, G.; Noda, I. General estimation models for above- and below-ground biomass of teak (Tectona grandis) plantations in Thailand. For. Ecol. Manag. 2020, 457, 117701. [Google Scholar] [CrossRef]
- Zheng, C.; Mason, E.G.; Jia, L.; Wei, S.; Sun, C.; Duan, J. A single-tree additive biomass model of Quercus variabilis Blume forests in North China. Trees 2015, 29, 705–716. [Google Scholar] [CrossRef]
- Njana, M.A.; Bollandsas, O.M.; Eid, T.; Zahabu, E.; Malimbwi, R.E. Above- and belowground tree biomass models for three mangrove species in Tanzania: A nonlinear mixed effects modelling approach. Ann. For. Sci. 2016, 73, 353–369. [Google Scholar] [CrossRef]
- Chen, D.; Huang, X.; Zhang, S.; Sun, X. Biomass Modeling of Larch (Larix spp.) Plantations in China Based on the Mixed Model, Dummy Variable Model, and Bayesian Hierarchical Model. Forests 2017, 8, 268. [Google Scholar] [CrossRef]
- Parresol, B. Additivity of nonlinear biomass equations. Can. J. For. Res. 2001, 31, 865–878. [Google Scholar] [CrossRef]
- Affleck, D.L.R.; Dieguez-Aranda, U. Additive Nonlinear Biomass Equations: A Likelihood-Based Approach. For. Sci. 2016, 62, 129–140. [Google Scholar] [CrossRef]
- Tang, S.; Zhang, H.; Xu, H. Study on establish and estimate method of compatible biomass model. Sci. Silvae Sin. 2000, 36, 19–27. [Google Scholar]
- SAS Institute Inc. SAS/ETS® 9.3. User’s Guide; SAS Institute Inc.: Cary, NC, USA, 2011; p. 3302. [Google Scholar]
- R Core Team. R: A Language and Environment for Statistical Computing; R Foundation for Statistical Computing: Vienna, Austria, 2019. [Google Scholar]
- Fu, L.; Sun, H.; Sharma, R.P.; Lei, Y.; Zhang, H.; Tang, S. Nonlinear mixed-effects crown width models for individual trees of Chinese fir (Cunninghamia lanceolata) in south-central China. For. Ecol. Manag. 2013, 302, 210–220. [Google Scholar] [CrossRef]
- Pinheiro, J.C.; Bates, D.M. Mixed-Effects Models in S and S-Plus, 1st ed.; Springer: New York, NY, USA, 2000; p. 528. [Google Scholar]
- Ni, C.; Nigh, G.D. An analysis and comparison of predictors of random parameters demonstrated on planted loblolly pine diameter growth prediction. Forestry 2012, 85, 271–280. [Google Scholar] [CrossRef]
- Jenkins, J.C.; Chojnacky, D.C.; Heath, L.S.; Birdsey, R.A. National-scale biomass estimators for United States tree species. For. Sci. 2003, 49, 12–35. [Google Scholar]
- Kapinga, K.; Syampungani, S.; Kasubika, R.; Yambayamba, A.M.; Shamaoma, H. Species-specific allometric models for estimation of the above-ground carbon stock in miombo woodlands of Copperbelt Province of Zambia. For. Ecol. Manag. 2018, 417, 184–196. [Google Scholar] [CrossRef]
- Ali, A.; Xu, M.S.; Zhao, Y.T.; Zhang, Q.Q.; Zhou, L.L.; Yang, X.D.; Yan, E.R. Allometric biomass equations for shrub and small tree species in subtropical China. Silva Fenn. 2015, 49, 1–10. [Google Scholar] [CrossRef]
- Parresol, B.R. Assessing Tree and Stand Biomass: A Review with Examples and Critical Comparisons. For. Sci. 1999, 45, 573–593. [Google Scholar]


| Tree Variables | N | Min | Max | Mean | Std |
|---|---|---|---|---|---|
| (cm) | 229 | 2.0 | 35.7 | 17.9 | 6.9 |
| (m) | 229 | 3.8 | 27.0 | 16.8 | 5.4 |
| Stem biomass (kg) | 229 | 0.27 | 510.19 | 133.37 | 110.83 |
| Branch biomass (kg) | 229 | 0.10 | 42.30 | 11.92 | 8.89 |
| Foliage biomass (kg) | 229 | 0.07 | 9.79 | 3.80 | 2.11 |
| Aboveground biomass (kg) | 229 | 0.40 | 561.10 | 149.08 | 119.60 |
| Approaches | Model Variables | Components | βk0 | βk1 | βk2 | ||||||||
|---|---|---|---|---|---|---|---|---|---|---|---|---|---|
| Estimate | SE | Estimate | SE | Estimate | SE | Estimate | Estimate | Estimate | Estimate | Estimate | |||
| BM | DBH | Stem | −3.6254 | 0.1094 | 2.8280 | 0.0372 | |||||||
| Branch | −3.2894 | 0.1730 | 1.9052 | 0.0601 | |||||||||
| Foliage | −2.7397 | 0.1597 | 1.3881 | 0.0536 | |||||||||
| DBH and H | Stem | −4.4630 | 0.0628 | 1.6982 | 0.0461 | 1.4599 | 0.0580 | ||||||
| Branch | −2.1076 | 0.2085 | 2.8131 | 0.1558 | −1.3228 | 0.1956 | |||||||
| Foliage | −2.2125 | 0.1843 | 1.9205 | 0.1310 | −0.7261 | 0.1594 | |||||||
| MEM | DBH | Stem | −2.3110 | 0.1022 | 2.3800 | 0.0325 | 1.6379 | 0.2029 | |||||
| Branch | −4.7310 | 0.2215 | 2.4410 | 0.0696 | 4.5084 | 0.1005 | −0.6730 | 0.3069 | |||||
| Foliage | −3.1880 | 0.1764 | 1.5570 | 0.0615 | 0.0228 | 0.4049 | |||||||
| DBH and H | Stem | −4.3494 | 0.0846 | 1.7002 | 0.0454 | 1.4186 | 0.0642 | 0.2189 | 0.1254 | ||||
| Branch | −2.7585 | 0.2648 | 2.8486 | 0.1375 | −1.1033 | 0.2003 | 0.0542 | 0.3554 | |||||
| Foliage | −2.3976 | 0.2155 | 1.9932 | 0.1322 | −0.7285 | 0.1714 | 0.0107 | 0.4103 | |||||
| Approaches | Model Variables | Components | βi0 | βi1 | βi2 | |||
|---|---|---|---|---|---|---|---|---|
| Estimate | SE | Estimate | SE | Estimate | SE | |||
| AMS1 | DBH | Stem | −3.7676 | 0.0946 | 2.8834 | 0.0319 | ||
| Branch | −3.0780 | 0.1250 | 1.8217 | 0.0443 | ||||
| Foliage | −2.9308 | 0.1249 | 1.4360 | 0.0421 | ||||
| DBH and H | Stem | −4.4736 | 0.058 | 1.667 | 0.0431 | 1.4957 | 0.0543 | |
| Branch | −2.1082 | 0.1454 | 3.0106 | 0.1194 | −1.5347 | 0.1461 | ||
| Foliage | −2.4338 | 0.1598 | 2.0931 | 0.1169 | −0.8408 | 0.1473 | ||
| AMS2 | DBH | Stem | −3.5897 | 0.1057 | 2.8216 | 0.0359 | ||
| Branch | −3.1333 | 0.1587 | 1.8538 | 0.0555 | ||||
| Foliage | −2.757 | 0.1589 | 1.3856 | 0.0533 | ||||
| DBH and H | Stem | −4.4649 | 0.0628 | 1.6980 | 0.0461 | 1.4611 | 0.0579 | |
| Branch | −2.0674 | 0.2072 | 2.7545 | 0.1547 | −1.2799 | 0.1954 | ||
| Foliage | −2.1882 | 0.1858 | 1.9121 | 0.1323 | −0.7330 | 0.1613 | ||
| Approaches | Model Variables | Parameters | Estimate | SE |
|---|---|---|---|---|
| DMS1 | DBH | α0 | 1.6051 | 0.3328 |
| α1 | −0.9811 | 0.0711 | ||
| γ0 | 2.1940 | 0.4222 | ||
| γ1 | −1.4266 | 0.0641 | ||
| βa0 | −2.8937 | 0.0826 | ||
| βa1 | 2.6351 | 0.0282 | ||
| DBH and H | α0 | 9.5379 | 2.0289 | |
| α1 | 1.0793 | 0.1604 | ||
| α2 | −2.7155 | 0.2012 | ||
| γ0 | 8.4438 | 1.6068 | ||
| γ1 | 0.2201 | 0.1359 | ||
| γ2 | −2.1524 | 0.1678 | ||
| βa0 | −3.5555 | 0.0628 | ||
| βa1 | 1.8492 | 0.0448 | ||
| βa2 | 1.0405 | 0.0560 | ||
| DMS2 | DBH | α0 | 3.0795 | 0.5535 |
| α1 | −1.2101 | 0.0626 | ||
| γ0 | 3.3838 | 0.5707 | ||
| γ1 | −1.5740 | 0.0569 | ||
| βa0 | −3.1429 | 0.0793 | ||
| βa1 | 2.7154 | 0.0270 | ||
| DBH and H | α0 | 10.7671 | 1.5583 | |
| α1 | 1.3375 | 0.1212 | ||
| α2 | −3.0285 | 0.1482 | ||
| γ0 | 7.5777 | 1.1985 | ||
| γ1 | 0.4091 | 0.1164 | ||
| γ2 | −2.3142 | 0.1482 | ||
| βa0 | −3.5705 | 0.0623 | ||
| βa1 | 1.8234 | 0.0442 | ||
| βa2 | 1.0683 | 0.0556 |
| Approaches | Model Variables | Variables | Stem | Branch | Foliage | Aboveground |
|---|---|---|---|---|---|---|
| BM | DBH | R2 | 0.9291 | 0.6675 | 0.7045 | 0.9420 |
| RMSE% | 22.86 | 52.63 | 88.07 | 16.84 | ||
| 1.7666 | 1.8852 | 1.3586 | - | |||
| DBH and H | R2 | 0.9738 | 0.7239 | 0.7213 | 0.9764 | |
| RMSE% | 11.20 | 49.53 | 78.51 | 10.69 | ||
| 1.876 | 1.7848 | 1.3512 | - | |||
| MEM | DBH | R2 | 0.9757 | 0.8631 | 0.8056 | 0.9773 |
| RMSE% | 12.07 | 33.14 | 77.6 | 11.09 | ||
| 1.7666 | 1.8852 | 1.3586 | - | |||
| DBH and H | R2 | 0.9839 | 0.8597 | 0.7938 | 0.9844 | |
| RMSE% | 9.19 | 38.11 | 74.91 | 8.94 | ||
| 1.876 | 1.7848 | 1.3512 | - | |||
| AMS1 | DBH | R2 | 0.9237 | 0.6307 | 0.6893 | 0.9393 |
| RMSE% | 23.33 | 52.34 | 78.82 | 17.01 | ||
| 1.7666 | 1.8852 | 1.3586 | 1.7772 | |||
| DBH and H | R2 | 0.9737 | 0.7151 | 0.7062 | 0.9763 | |
| RMSE% | 11.22 | 46.88 | 66.93 | 10.52 | ||
| 1.876 | 1.7848 | 1.3512 | 1.7866 | |||
| AMS2 | DBH | R2 | 0.9296 | 0.6627 | 0.6996 | 0.9432 |
| RMSE% | 23.24 | 53.8 | 85.75 | 16.83 | ||
| 1.7666 | 1.8852 | 1.3586 | - | |||
| DBH and H | R2 | 0.9738 | 0.7172 | 0.7202 | 0.9764 | |
| RMSE% | 11.22 | 49.61 | 77.59 | 10.73 | ||
| 1.876 | 1.7848 | 1.3512 | - | |||
| DMS1 | DBH | R2 | 0.9349 | 0.6507 | 0.7037 | 0.9478 |
| RMSE% | 24.88 | 53.74 | 82.73 | 27.33 | ||
| 1.7666 | 1.8852 | 1.3586 | 1.7772 | |||
| DBH and H | R2 | 0.9744 | 0.7235 | 0.7215 | 0.9769 | |
| RMSE% | 12.04 | 49.48 | 75.22 | 18.19 | ||
| 1.876 | 1.7848 | 1.3512 | 1.7866 | |||
| DMS2 | DBH | R2 | 0.9285 | 0.5986 | 0.6976 | 0.9442 |
| RMSE% | 24.78 | 53.75 | 81.94 | 17.73 | ||
| 1.7666 | 1.8852 | 1.3586 | 1.7772 | |||
| DBH and H | R2 | 0.9745 | 0.7121 | 0.7099 | 0.9767 | |
| RMSE% | 11.76 | 47.20 | 68.17 | 10.81 | ||
| 1.876 | 1.7848 | 1.3512 | 1.7866 |
| Approaches | Model Variables | Variables | Stem | Branch | Foliage | Aboveground |
|---|---|---|---|---|---|---|
| BM | DBH | MPE | 5.14 | 1.65 | 0.11 | 6.89 |
| MPE% | 3.85 | 13.85 | 2.89 | 4.62 | ||
| MAE | 20.21 | 3.58 | 0.89 | 19.27 | ||
| MAE% | 19.15 | 36.9 | 26.97 | 14.92 | ||
| DBH and H | MPE | 0.93 | 1.05 | 0.06 | 2.04 | |
| MPE% | 0.70 | 8.81 | 1.58 | 1.37 | ||
| MAE | 11.32 | 3.27 | 0.88 | 11.96 | ||
| MAE% | 8.95 | 30.42 | 26.22 | 8.95 | ||
| MEM | DBH | MPE | −0.32 | 0.02 | 0.01 | −0.29 |
| MPE% | −0.24 | 0.17 | 0.26 | −0.19 | ||
| MAE | 10.23 | 2.16 | 0.83 | 10.68 | ||
| MAE% | 8.80 | 19.21 | 24.53 | 8.02 | ||
| DBH and H | MPE | 0.35 | 0.04 | 0.00 | 0.39 | |
| MPE% | 0.26 | 0.34 | 0.09 | 0.26 | ||
| MAE | 8.91 | 2.24 | 0.75 | 9.36 | ||
| MAE% | 7.17 | 20.34 | 22.42 | 6.92 | ||
| AMS1 | DBH | MPE | 1.06 | 2.09 | 0.27 | 3.42 |
| MPE% | 0.79 | 17.54 | 7.11 | 2.29 | ||
| MAE | 20.40 | 3.72 | 0.9 | 19.34 | ||
| MAE% | 19.31 | 38.61 | 29.17 | 14.84 | ||
| DBH and H | MPE | 0.90 | 1.25 | 0.19 | 2.35 | |
| MPE% | 0.67 | 10.49 | 5.00 | 1.58 | ||
| MAE | 11.36 | 3.35 | 0.90 | 12.02 | ||
| MAE% | 8.96 | 31.24 | 27.62 | 8.84 | ||
| AMS2 | DBH | MPE | 3.09 | 1.66 | 0.20 | 4.95 |
| MPE% | 2.32 | 13.93 | 5.26 | 3.32 | ||
| MAE | 20.09 | 3.58 | 0.89 | 19.01 | ||
| MAE% | 18.52 | 36.13 | 27.76 | 14.38 | ||
| DBH and H | MPE | 0.75 | 1.19 | 0.14 | 2.08 | |
| MPE% | 0.56 | 9.99 | 3.68 | 1.40 | ||
| MAE | 11.32 | 3.3 | 0.88 | 11.98 | ||
| MAE% | 8.94 | 30.74 | 26.78 | 8.97 | ||
| DMS1 | DBH | MPE | 1.32 | 1.73 | 0.19 | 3.25 |
| MPE% | 0.99 | 14.52 | 5.00 | 2.18 | ||
| MAE | 19.66 | 3.6 | 0.88 | 18.43 | ||
| MAE% | 18.69 | 35.68 | 27.11 | 14.15 | ||
| DBH and H | MPE | −0.39 | 1.03 | 0.11 | 0.75 | |
| MPE% | −0.29 | 8.64 | 2.89 | 0.50 | ||
| MAE | 11.35 | 3.27 | 0.88 | 11.83 | ||
| MAE% | 9.48 | 30.38 | 26.53 | 9.06 | ||
| DMS2 | DBH | MPE | 0.53 | 2.22 | 0.26 | 3.01 |
| MPE% | 0.40 | 18.63 | 6.84 | 2.02 | ||
| MAE | 20.05 | 3.78 | 0.88 | 18.84 | ||
| MAE% | 21.66 | 37.58 | 27.4 | 15.47 | ||
| DBH and H | MPE | 1.02 | 1.26 | 0.19 | 2.47 | |
| MPE% | 0.76 | 10.57 | 5.00 | 1.66 | ||
| MAE | 11.3 | 3.36 | 0.90 | 12.02 | ||
| MAE% | 9.41 | 32.27 | 27.81 | 9.23 |
© 2020 by the authors. Licensee MDPI, Basel, Switzerland. This article is an open access article distributed under the terms and conditions of the Creative Commons Attribution (CC BY) license (http://creativecommons.org/licenses/by/4.0/).
Share and Cite
Dong, L.; Zhang, Y.; Zhang, Z.; Xie, L.; Li, F. Comparison of Tree Biomass Modeling Approaches for Larch (Larix olgensis Henry) Trees in Northeast China. Forests 2020, 11, 202. https://doi.org/10.3390/f11020202
Dong L, Zhang Y, Zhang Z, Xie L, Li F. Comparison of Tree Biomass Modeling Approaches for Larch (Larix olgensis Henry) Trees in Northeast China. Forests. 2020; 11(2):202. https://doi.org/10.3390/f11020202
Chicago/Turabian StyleDong, Lihu, Yue Zhang, Zhuo Zhang, Longfei Xie, and Fengri Li. 2020. "Comparison of Tree Biomass Modeling Approaches for Larch (Larix olgensis Henry) Trees in Northeast China" Forests 11, no. 2: 202. https://doi.org/10.3390/f11020202
APA StyleDong, L., Zhang, Y., Zhang, Z., Xie, L., & Li, F. (2020). Comparison of Tree Biomass Modeling Approaches for Larch (Larix olgensis Henry) Trees in Northeast China. Forests, 11(2), 202. https://doi.org/10.3390/f11020202