Abstract
Boreal forests provide important ecosystem services, most notably being the mitigation of increasing atmospheric CO2 emissions. Microbial biodiversity, particularly the local diversity of fungi, has been shown to promote multiple functions of the boreal forests of Northeastern China. However, this microbial biodiversity-multifunctionality relationship has yet to be explored in Northeastern Canada, where historical environment have shaped a different regional pool of microbial diversity. This study focuses on the relationship between the soil microbiome and ecosystem multifunctionality, as well as the influence of pH and redox potential (Eh) on the regulation of such relationship. Structural equation modelling (SEM) was used to explore the different causal relationships existing in the studied ecosystems. In a managed part of the Canadian boreal forest, 156 forest polygons were sampled to (1) estimate the α- and β-diversity of fungal and bacterial communities and (2) measure 12 ecosystem functions mainly related to soil nutrient storage and cycling. Both bacteria and fungi influenced ecosystem multifunctionality, but on their own respective functions. Bacterial β-diversity was the most important factor increasing primary productivity and soil microbial biomass, while reducing soil emitted atmospheric CO2. Environmental characteristics, particularly low levels of organic matter in soil, were shown to have the strongest positive impact on boreal ecosystem multifunctionality. Overall, our results were consistent with those obtained in Northeastern China; however, some differences need to be further explored especially considering the history of forest management in Northeastern Canada.
1. Introduction
The boreal forest covers over 11% of the globe’s surface and provides crucial ecosystem functions and services to human society, such as wood production, nutrient cycling, and climate regulation. The boreal forest can respectively store between 87 to 105 PgC y−1 and 198 to 271 PgC y−1 into standing biomass and soils, i.e., more than one third of the atmospheric pool [1,2]. In temperate and dryland ecosystems, soil microbial diversity has been suggested to be key in maintaining ecosystem multifunctionality [3,4]. The role of boreal microbial diversity is particularly low in importance when compared to other biomes, which might be expected considering the lower level of microbial diversity inhabiting the boreal biome [5,6]. In addition, only the role of fungal biodiversity was found to be significant in boreal systems, while bacterial and fungal diversity were found to be equally comparable in other biomes [4,5,7,8,9]. However, the role of microbial biodiversity in boreal forests was only explored in Northeastern China, which impedes a definitive conclusion on the large-scale importance and the relative roles of bacterial vs fungal biodiversity on ecosystem multifunctionality.
Fungi provide crucial roles to ecosystems through the use of an extensive mycelial network translocating water and nutrients, breaking down organic compounds and improving soil aggregation [10,11]. In boreal forests, fungi seem adapted to low pH values and recalcitrant carbon sources, which results in a higher biodiversity than bacteria [12]. However, bacteria, which have been shown to be essential to the dynamics of ecosystem functioning, possess a very high adaptive potential and a wide metabolic diversity. As such, they can colonize all environments and their diversity and abundance can rapidly be shaped by the abiotic habitat [13,14]. Their diversity and role in ecosystems should therefore depend on the historical regional context and the conditions in which the region’s microorganisms evolved in during the last millennia [15]. According to the regional species pool hypothesis, microbial diversity should be higher in an acidic environment at local scale if the historical regional context of that environment has been acidic [15]. As such, the soil microbial biodiversity-multifunctionality relationship has never been tested in an acidic historical regional context as provided by the Eastern Canadian Shield, and where bacterial biodiversity might be expected to be as important as fungal biodiversity in the modulation of the boreal forest multifunctionality [4,9,16,17].
As described by Hector and Bagchi (2007), the concept of multifunctionality represents the ability of ecosystems to simultaneously maintain multiple functions [4,18,19]. The multiple functions provided by the ecosystem are considered to be spread along independent dimensions representing ecosystem services. Boreal forests are mainly managed to promote one particular dimension, which is wood production. Fungal biodiversity might be important for the wood production dimension, whereas bacterial biodiversity may be more related to another multifunctionality dimension, such as the N biogeochemical cycle (e.g., nitrification). We then propose to disentangle the specific roles of bacteria and fungi on the dimension of productivity, as well as their respective role on each additional dimension of the ecosystem multifunctionality.
One important way to characterize microbial diversity is with the α-diversity index, which represents the number of operational taxonomic units (OTUs) observed at local scale (vegetation patch) [20,21]. In relation with the multifunctionality index, α-diversity indicates both the complementary roles that multiple species can play on ecosystem multifunctionality and the chance to select a species with a predominant role [22]. Recent studies in plant ecology have also demonstrated that the spatial variation in community composition (i.e., β-diversity) can also modulate ecosystem multifunctionality, such that a heterogeneous landscape provides higher multifunctionality [21,23]. It is particularly important to study this relationship in boreal forest where significant forest management (54% in Canada) may have led to a spatial heterogenization of the landscape [24,25]. Decoupling α- and β-diversity both for microorganisms and for boreal forest to determine its impact on multifunctionality has yet to be tested.
Environmental conditions regulate microbial community structure [14]. Among abiotic variables that modulate microbial diversity, soil pH is a strong driver at a landscape level, potentially reflecting variations in parent material [6,14,26]. In boreal forests, soil pH is expected to be strongly associated with the accumulation of soil organic matter releasing H+ and therefore may have less of an influence on the structure of microbial biodiversity. Redox potential (Eh), which should be less covaried with soil organic matter content, is another key variable for understanding the diversity of microorganisms [17]. Like pH, microbial communities have been selected to live within a range of narrow and specific Eh conditions [17]. For example, fungi are more likely to grow under oxidative conditions (Eh > + 250 mV), while bacteria will be more abundant under reducing conditions (Eh < 0 mV) [27]. Although Eh variations are expected to have a large selective effect on the physiological and phenotypic composition of soil communities, its effect on microbial diversity and modulation of the biodiversity-multifunctionality relationship has yet to be explored.
The following study evaluates the microbial diversity-multifunctionality relationship based on 156 forest stands, which were chosen from ecoforestry maps in order to maximize the variation in environmental conditions within the regions of Abitibi-Témiscamingue and Haute-Mauricie. The sites were located on the Canadian Shield and a managed part of the boreal forest. The aims of this study were (i) to test the existence of a relationship between soil microbial biodiversity and the multiple functions of the Eastern-Canadian boreal forest ecosystems; (ii) to determine the respective role of local and regional heterogeneity of fungal and bacterial biodiversity beyond this relationship; and (iii) to determine if pH and Eh are key drivers in regulating this relationship through their influence on microbial diversity. To achieve these aims, total bacterial and fungal diversity was measured using next-generation sequencing. Ecosystemic functioning and abiotic parameters were measured in the laboratory, while climate data were extracted from online data bases, and primary productivity was estimated by satellite remote sensing. Relationships were established using structural equation modelling (SEM).
2. Materials and Methods
2.1. Study Sites
Our study was conducted in boreal forest ecosystems located on the Canadian Shield in Abitibi-Témiscamingue (AT, N48°14′3.25″, W79°1′7.62″) and Haute-Mauricie (HM, N47°26′18.026″ W72°47′2.151″) in the province of Quebec, Canada. The Canadian Shield is a large area of North America that exposes Precambrian igneous and metamorphic rocks and is characterized by a thin acidic layer of soil [16]. Using a forest inventory database including 75 parameters and 33,000 stands released in 2009 through the Ministère des Forêts, de la Faune et des Parcs (MFFP), 156 polygonal forest stands were selected to maximize the environmental contrast of five habitat variables: surface deposits (sand, till, clay, fluvial, peatland), drainage (low, medium, high), as well as the stand age (young 0–80 years, old > 80 years) and the dominant tree species (Betula papirifera Marsh., Picea glauca (Moench) Voss, Picea mariana (P. Mill.) B.S.P., Populus tremuloides Michx., Pinus banksiana Lamb., Abies balsamea (L.) P. Mill.). The 156 polygons represent the boreal forest subset of the polygons used by Laperriere et al. (2019) [28].
2.2. Forest Polygons Sampling
The sampling was done during summer of 2017 in late June for AT and in September for HM. The sampling of each forest polygon consisted of establishing a quadrat of 400 m2 in which we collected six soil samples that were transferred and mixed into a common Ziplocs bag to get a homogeneous and representative soil of the quadrat. A subsample of this mixture was collected and immediately placed in a cooler for DNA measurements. The remaining soil was split evenly in two Ziplocs bag; one was refrigerated (4 °C) while the other was left open to allow the soil to air dry. Two additional soil cores (10 cm-length by 6 cm-diameter) were sampled to get soil bulk density. During the sampling, we maintained sterile conditions using new sterile equipment at each quadrat in order to avoid cross-contamination between forest polygons.
2.3. Abiotic Measurements
We used air-dried soil to measure the following soil characteristics: water holding capacity (WHC) (adapted from [29]), organic matter concentration (Mo) by loss on ignition (adapted from [30]), soil texture (Fritsch Analyzer 22 microtech plus), and pH and Eh using a platinum probe (5 × 5 mm) and an Ag/AgCl electrode coupled to a voltmeter (based on [31], refer to [28]). Soil porosity and water-filled pore space (WFP) were calculated using WHC and bulk density [29,32]. Fresh soil was used to measure the water content (Teau). For climatic data, we used a public dataset from the government of Canada [33]. With the geographic coordinates of the polygons, we extracted the following historical data: mean annual temperature (°C, TEMP_MOY), average cumulative precipitation during the growing season (mm, PPT), average length of the frost-free season (day, SGEL4), average length of the growing season (SC), and average base days of 0 °C (DJ_0). A brief summary description of these variables is available in Table 1.

Table 1.
Description of abiotic variables.
2.4. Ecosystem Functions
Ecosystem functioning was estimated by a series of functions representing the capacity of the ecosystem to capture, transform, and recycle energy, matter, and nutrients. The primary productivity was estimated using satellite imagery and photos taken at 45 degrees under the tree cover and was used to measure two proxies: the top of canopy normalized difference vegetation index (NDVI) and a bottom of canopy green index (Green). NDVI was derived from 30 m resolution Landsat 8 surface reflectance products, as obtained from the United States Geological Survey (USGS) [34]. Images with a cloud cover of less than 10% were selected to minimize gaps in data and average NDVI was calculated from a total of 8 images (from June to August 2014-2018) in every forest polygon according to the following equation:
where NIR is the near infrared and R is the red in the image’s composition. Bottom of canopy green index (Green) was measured at the four corners of each quadrat as well as canopy opening (Canopy) with R software and imaging analysis.
NDVI = (NIR − R)/(NIR + R)
We used DNA concentration as a proxy to measure soil microbial biomass in each quadrat [3,4,35]. DNA concentration was realized by fluorescence using Synergy H1 microplate reader and Quant-it Picogreen dsDNA kit (Thermo fisher). The read was made by using the fluorometric method, using a wavelength excitation of 480 nm and an emission of 520 nm. DNA concentration was calculated with a standard calibration curve, as described in the Quant-it Picogreen dsDNA kit protocol.
The soil ability to cycle nutrients was assessed using soil mineral nitrogen content (Ni), rate of nitrogen mineralization (Nmin), respiration rate (Resp0 and Resp), and bioavailability of soil orthophosphates (P). Respiration rate and mineralization of soil nitrogen were measured on dried soil by quantifying CO2 emission and mineral nitrogen dynamic after adding 0.2 g of cellulose to at least 15.0 g of rewetted soil (60% of its field capacity), then incubated in 200 mL glass jars sealed with lids fitted with a silicone septum for 14 days at 25 °C. Mineralization was quantified by measuring the initial and final concentrations of nitrate, nitrite, and ammonium. These concentrations, as well as those in orthophosphates (Mehlich-III (IV-07)), were measured at the Laboratory of Organic and Inorganic Chemistry (Directorate of Forestry Research) of the MFFP. CO2 emission measurements were taken after the pre-incubation time (0) and then after 2, 4, 8, and 14 days of incubation using a gas analyzer (LI-COR LI-7810).
The rate of nutrient cycling was quantified, according to the Steinweg and McMahon (2012) protocol, by measuring extracellular enzyme activities commonly used in the literature, such as: β-1-4-glucosidase (BGL), β-1-4-N-acetylglucosaminidase (NAG), and phosphatases (PHO) [36,37,38], using 4-methylumbelliferone-attached substrates (MUB). Measurements were made by spectrofluorometry, with an excitation wavelength of 365 nm and an emission wavelength of 450 nm. As for the abiotic variables, a short description of each variable is available in Table 2.
Table 2.
Description of ecosystem functioning variables.
2.5. Extraction and PCR Amplification
The extraction of total DNA was carried out using a commercial kit (PowerSoil kit QIAGEN) on frozen samples. For fungal diversity, extractions were amplified by PCR using the primer pair fITS7-ITS4. Each PCR was done at three different temperatures (48, 51, and 58 °C) to allow the primers to combine with as many species as possible (see [28]). For bacterial diversity, the same DNA extractions were amplified by PCR at a single temperature of 48 °C with the 16S specific 515F-805R primer pair with a CS1 (ACACTGACGACATGGTTCTACAGTGCCA GCMGCCGCGG) and CS2 (TACGGTAGCAGAGACTTGGTCTGACTACHVGGGTATCTAATCC) tag added at the final 5’ extremities [39]. PCR were performed using the same master mix preparation as Laperriere et al. (2019) [28]. PCR reaction was made with the following thermocycling conditions: 34 cycles of 30 s at 94 °C, 30 s at 48 °C, and 40 s at 72 °C. Reactions were preceded by a 3 min denaturation step at 94 °C and terminated with a 5 min elongation step at 72 °C. In all cases, all amplicons were verified on agarose gel before analysis and sent to for sequencing with the Illumina MiSeq method to GenomeQuébec Innovation Center of McGill University.
2.6. Multifunctionality and Microbial Diversity Indexes
In order to calculate the microbial diversity index, taxonomy was obtained by comparing our DNA sequences to those of public databases. For fungi, bioinformatics was performed with Vsearch (see [28]), while for bacteria, it was done using the DADA2 package on R software (version 3.5.1). Specifically, DADA2 was used as a pipeline to cut and filter DNA sequences. The merging of forward and reverse sequences took place in Galaxy [40]. The combined DNA sequences were then downloaded and manipulated again in R to perform dereplication, remove chimeras, and assign taxonomy (see [28] for details). The public databases used were utax_reference (UNITE datasets v.7.2) and SILVA (SILVA_132_SSURef_tax_silva) for fungi and bacteria, respectively.
The transformation of genomic information to an alpha (α) and beta (β) diversity index was done by calculating the species richness (α-fungi and α-bacteria) and the Sørensen’s dissimilarity (SOR, β-bacteria and β-fungi) by using the “diversity” and “betadiver” functions from package Vegan in R. The SOR index equation was calculated as follows:
where a is the number of species shared between two polygons and b and c are the number of unique species not shared between each polygon [41]. The SOR index ranges from 0 to 1, where 0 indicates that a polygon shared all its species with other polygons, while 1 defined a polygon where all inhabiting species were different from other polygons [21]. With the final matrices (one for fungi and one for bacteria), we then calculated the mean to obtain one value per polygon.
2.7. Statistical Analysis
All statistical analyses were performed using the R software. All variables were normalized in order to perform two principal component analyses (PCA) to extract the main dimensions describing abiotic environment and ecosystem multifunctionality. Sites with missing data were excluded from the analysis, and only the principal components of eigenvalue > 1 were selected. Polygons’ scores on these PCA axes were used in the following analyses. Generalized linear models (GLM) were then constructed between ecosystem functioning dimensions and α and β fungal and bacterial diversity. Fungal and bacterial α-diversity and β-diversity were transformed when necessary using a Box Cox transformation (boxcox function in MASS package version 7.3-50) to get a normal distribution. Gaussian GLM family was used to account for a range of values comprised between [−∞, +∞]. GLM between abiotic environment variable and diversity were also used to understand their drivers (see complementary materials). We also tested the addition of categorical variables, which were used to select our sites as random factors in all GLM models. They were excluded because they did not improve model performance (Supplementary Material Table S2.3). The Byrnes et al. (2014) R pipeline was used to calculate the multifunctionality index using the averaging method [42]. The method uses the average of multiple functions, previously normalized, and the standard deviation in order to get an index that is easy to interpret (see [42] for details). To perform SEM, all variables were also scaled to reduce the variance. SEM was performed with the “OpenMx”, “lavaan”, and “semPlot” packages in R to determine the causal effects of microbial diversity and environmental conditions on ecosystem multifunctionality [43]. It is important to note that the first and the fourth dimensions of ecosystem functioning were inverted (multiplication by −1) in the multifunctionality index and the SEM. In the latter, the first and second dimensions of environmental variables were also inverted in order to make the results easier to interpret in terms of benefits from ecosystem functions.
3. Results
3.1. Dimensions of the Ecosystem Functioning
The first four components of the PCA explained 66.1% of the variation in ecosystem functions (Figure 1, Supplementary Material Table S1.1 and Figure S1.1). The first PCA component was related to soil C emission opposing soils with high enzymatic activities and high respiration rate to soils where carbon was less emitted to the atmosphere. The second PCA component was related to primary productivity and soil microbial biomass opposing forests with high canopy cover (NDVI) and high soil DNA biomass to forests with the opposing syndrome. The third component was related to soil N mineralization opposing soils with high nitrification rate to soils with high content in mineral nitrogen. Finally, the fourth selected PCA component was related to canopy opening and phosphorus limitation opposing forest with low soil available phosphate to sites with high canopy aperture, probably resulting from low phosphorus fertility.
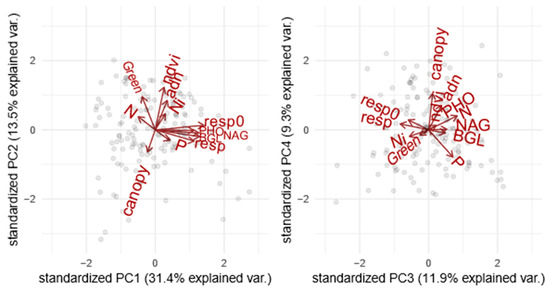
Figure 1.
PCA of ecosystem functions measured in the boreal forest to perform a grouping. The graphs represent a) the dimensions 1 and 2 and b) the dimensions 3 and 4. The grouping goes as follows: F1 = Soil C emission, F2 = Primary productivity and soil microbial biomass, F3 = N mineralization, and F4 = Canopy opening and phosphorus limitation. n = 156. (For more information, please refer to Supplementary Material Table S1.1).
A PCA performed with abiotic environmental variables (Figure S1.3 in supplementary material) explained almost 80% of the variance in three principal components (Figure S1.2 and Table S1.2a in Supplementary Material). Dimensions were defined as follows: the first environmental dimension opposed soils with high organic matter content, silt content, porosity, and WHC to soils with high pH; the second dimension was negatively related to atmospheric temperature; finally, the third dimension was a climate-soil axis opposing forests with high mean annual precipitation to the ones with high soil oxidative capacity and clay content (Table S1.2b in Supplementary Material).
3.2. Response of Ecosystem Functioning Dimensions to Microbial Biodiversity
A total of 9794 OTUs of fungi (26 to 760 per site) and 24,936 OTUs (45 to 1196 per site) of bacteria were retrieved from the 156 forest polygons. Alpha-diversity ranged between 74 and 1196 for bacteria and between 26 and 700 for fungi. Beta-diversity of bacteria varied from 0.019 to 0.301, while fungal varied from 0.013 to 0.120.
Figure 2 shows the relationship between fungal diversity and the multiple functions of boreal forests. There was a statistically significant negative correlation between the soil C emission and both α- and β-diversity, thus suggesting that local and regional fungal diversity decreased both the extracellular breakdown of organic matter and the emission of CO2. Fungal α-diversity was found to be significantly related to the N mineralization dimension, so that the low diversity was associated with low rates of mineralization but with high concentration of mineral N in soil solution. Fungal diversity tended to be related with higher canopy openness and low soil phosphorus concentration, but the relationship was not significant.
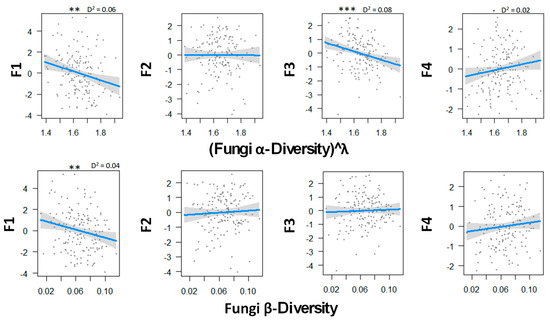
Figure 2.
Relations between fungal α- and β-biodiversity and the ecosystem functions analyzed by GLM and a Gaussian law grouped with PCA axes. Transformation parameter λ was equaled to 0.10 for fungal α-diversity. Thresholds of significance are as follows: 0 ′***′ 0.001 ′**′ 0.01 ′*′ 0.05 ′.′ 0.1 ″ 1. D2 represents the adjusted amount of deviance for GLM (Dsquared function in modEvA package v1.3.2,). Even though it explains only 8.0% of the variance, fungal α-diversity explains best the N cycle. n = 156.
Figure 3 indicates that bacterial diversity strongly influence ecosystem multifunctionality. As for fungal diversity, bacteria tended to limit soil CO2 emission when they were more diverse locally and regionally. In addition, both diversity metrics were correlated with primary productivity and soil microbial biomass. Finally, in contrast with fungi, there was a strong positive correlation between the N mineralization and β-diversity. This may suggest that the more communities differed from one another, the more the ecosystem tended to have a bigger mineralization rate, and in return, a lower soil mineral N content that was susceptible to lixiviation. No tendency appeared between P-cycle and bacterial diversity.
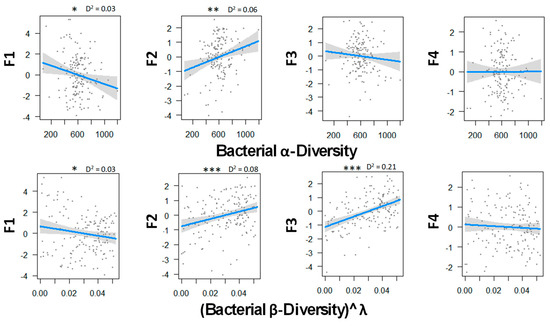
Figure 3.
Relations between bacterial α and β biodiversity and the ecosystem functions analyzed by GLM and a Gaussian law grouped with PCA axes. Transformation parameter λ was equaled to 2.45 for fungal β-diversity. Thresholds of significance are as follows: 0 ′***′ 0.001 ′**′ 0.01 ′*′ 0.05 ′.′ 0.1 ″ 1. D2 represents the adjusted amount of deviance for GLM (Dsquared function in modEvA package v1.3.2). Bacterial diversity explains best the primary productivity and soil microbial biomass (F2) and the N cycle (F3) with 8.0% and 21.0% of the variance, respectively. n = 156.
3.3. Causal Effects of Biodiversity and Environment on Ecosystem Functioning
Regarding both bacteria and fungi (Figure 4 and Figure 5), SEM revealed that biodiversity has a direct effect on ecosystem functioning. In addition, this effect was organism-, function-, and biodiversity metric-dependent. We also observed that the direct effects of biodiversity on ecosystem functioning was relatively low compared with the direct effects of environmental drivers.
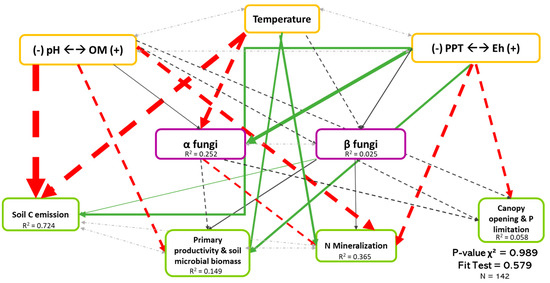
Figure 4.
Causal relationships between abiotic variables, fungal diversity, and ecosystem functioning. Structural equation model of boreal forest ecosystems in Quebec. The direction of the arrows indicates the direction of the regression existing between the variables. The solid (green) arrows represent a positive correlation, while the dotted (red) arrows represent negative correlations (Supplementary Material Table S3.1). The small pale gray arrows show the covariation. The black arrows are the nonsignificant correlations at a threshold of 0.1. The thickness of these arrows represents the strength of the correlation. The R2 shows the proportion of the variance explained for each variable and the model′s P-value and fit test indicate the acceptability of the model. The strongest relationships are between organic matter (and pH) and temperature-related variables and the soil C emission. n = 142.
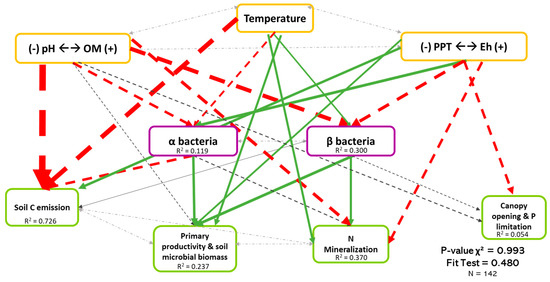
Figure 5.
Causal relationships between abiotic variables, bacterial diversity, and ecosystem functioning. Structural equation model of boreal forest ecosystems in Quebec. The direction of the arrows indicates the direction of the regression existing between the variables. The solid (green) arrows represent a positive correlation, while the dotted (red) arrows represent negative correlations (Supplementary Material Table S3.2). The small pale gray arrows show the covariation. The black arrows are the nonsignificant correlations at a threshold of 0.1. The thickness of these arrows informs about the strength of the correlation. The R2 shows the proportion of variance explained for each variable and the model′s P-value and fit test indicate the acceptability of the model. The strongest relationships are between organic matter (and pH) and temperature-related variables and the soil C emission, but there are also non neglectable relationships between the diversity and three ecosystem functions (F1, F2, and F3). n = 142.
Figure 4 shows the least-rejected SEM model for fungal diversity, which explained 72.4%, 14.9%, 36.5%, and 0.06% of the variation in soil C emission, primary productivity and soil microbial biomass, soil N mineralization and P limitation dimensions, respectively. Relationships between fungal biodiversity and ecosystem functions were similar in Figure 2, except for the soil C emission dimension. The latter occurred because the effect of biodiversity shown in Figure 2 was mainly indirect, probably due to the influence of temperature on both the fungal biodiversity and on the soil C emission dimension. The abiotic variables, mainly temperature and Eh dimension, explained 25.2% of the variation of fungal α-diversity, while fungal β-diversity was poorly explained (see Table S3.1). It is very important to note the existence of the covariation between α- and β-diversity (Coef. = 0.506), which, without it, reduced the performance of the model, thus demonstrating the importance of the interaction between the two types of diversity.
Figure 5 shows the least-rejected SEM model for bacterial diversity, which explained 72.6%, 23.7%, 37.0%, and 0.05% of the variation in soil C emission, primary productivity and soil microbial biomass, soil N mineralization, and P limitation dimensions, respectively. Relationships between bacterial biodiversity and ecosystem functions were similar to Figure 3, thus revealing that the effects of biodiversity on multifunctionality were mainly direct. Although it is well described in the literature that bacteria depend on the environment, only 11.9% of the variation in α-diversity (Coef.OM = −0.196, Coef.Temperature = −0.161, Coef.Eh = 0.231) was explained by the three environmental dimensions. The environment explained more for the β-diversity (30.0%, Coef.OM = −0.437, Coef.Temperature = 0.155, Coef.Eh = −0.303) than the α-diversity. Again, we noted the importance of the existing covariation between the two types of diversity in bacteria (Coef = 0.033).
Finally, the importance of pH and Eh on microbial diversity in boreal forest could be observed (Figure 4 and Figure 5). The role of soil pH cannot be distinguished from soil organic matter, as they are strongly covaried in the first principal component (C-cycle dimension). By analyzing the regression standardized coefficients (Supplementary Material Tables 3.1 and 3.2), we noted that the α-diversity of fungi and bacteria was driven positively by precipitation and soil pH and negatively by temperature. Bacterial β-diversity was particularly positively driven by soil pH and Eh.
3.4. Microbial Biodiversity and the Multifunctionality of Boreal Forests
To study the respective role of fungal and bacterial diversity on ecosystem functioning, we pooled all functions into a multifunctionality index in order to get an interpretable result. In that sense, the first and fourth principal components of ecosystem functions were inverted to take into consideration the benefits that a lower soil CO2 emission and P availability have on ecosystem functioning and human society. As such, ecosystems that had a high value of multifunctionality index were characterized by low atmospheric CO2 emission, high primary productivity and soil microbial biomass, low mineral N content in soil solution preventing N lixiviation but high enzymatic ability to provide N whenever required, and finally high soil P content.
Figure 6 shows the result of decision trees (RandomForest) used to analyze what variables seemed to have the greatest effect on multifunctionality. Multifunctionality was mainly influenced by the pH-OM dimension, as well as by the β-diversity of both bacteria and fungi (bB, bF) (Figure 6). Interestingly, and such as before (Figure 4 and Figure 5), the temperature appeared to have little effect on multifunctionality when compared to the PPT-Eh dimension. Local diversity (aB, aF) had a low effect on multifunctionality.
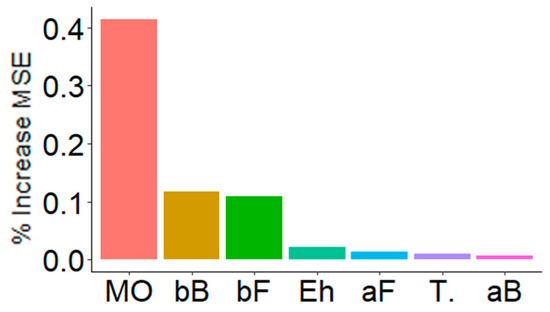
Figure 6.
Key predictors of multifunctionality. These are the main predictors, according to decision trees (RandomForest) performed with 5000 iterations. The importance of these predictors is observed according to the increase of the % of MSE (mean square error). MO = organic matter related variables (41.5%), bB = Bacterial β-diversity (12.0%), bF = Fungal β-diversity (10.9%), Eh = redox potential (2.1%), aF = Fungal α-diversity (1.4%), T. = Temperature related variables (1.0%), and aB = Bacterial α-diversity (0.7%).
Figure 7 shows the least-rejected model by SEM, which explained 50.2% of the variation in the multifunctionality of boreal forests. As shown previously, abiotic variables were the dominant explicative factors of multifunctionality, while bacterial β-diversity and fungal α-diversity showed lower but significant effects. Bacterial β-diversity had a positive effect on the multifunctionality (Coef. = 0.209), while the effect of fungal α-diversity was negative (Coef. = −0.072). As mention before, although several variables influenced microbial diversity, pH (Coef. = −0.434) and Eh (Coef. = 0.367) had the most important effect on bacterial β-diversity and fungal α-diversity, respectively. Because the sign of the correlation between microbial diversity, Eh, and pH differed, it may suggest that fungi and bacteria tended to have different habitats. When the pH is acidic and the Eh shows high reducing conditions, the bacterial community will be promoted, and fungi will be promoted with higher pH and moderated reducing conditions.
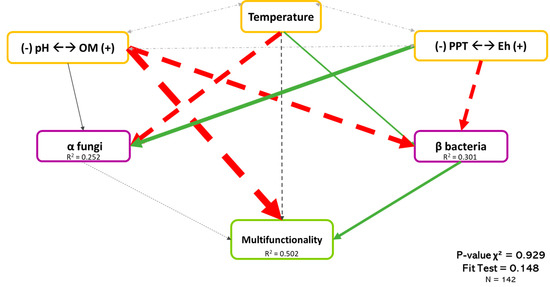
Figure 7.
Causal relationships between abiotic variables, microbial diversity, and multifunctionality. Structural equation model of boreal forest ecosystems in Quebec. The direction of the arrows indicates the direction of the regression existing between the variables. The solid (green) arrows represent a positive correlation, while the dotted (red) arrows represent negative correlations (Supplementary Material Table S3.3). The small pale gray arrows show the covariation. The black arrows are the nonsignificant correlations at a threshold of 0.1. The thickness of these arrows represents the strength of the correlation. The R2 shows the proportion of variance explained for each variable and the model′s P-value and fit test indicate the acceptability of the model. n = 142.
4. Discussion
Our study provides a better understanding of the ecosystem multifunctionality of the Northeastern Canadian boreal forest, with a final model that explained up to 50% of variation across 156 sites. We were able to show that soil organic matter, through a negative relationship, and microbial β-diversity, through a positive relationship, were the two key drivers of ecosystem multifunctionality in managed boreal forests. This level of explained variation in ecosystem multifunctionality is comparable to other studies, where 53% of variation was described in drylands around the world, 38% in Scotland, and 65% in the boreal forests of Northeastern China [4,5].
4.1. Multifunctionality and Microbial Diversity
We found that both fungal and bacterial biodiversity played a role in the ecosystem functions and multifunctionality of the boreal forests. Despite the relatively short time period since the last glaciation in Northeastern America to constitute a large diversity pool, microbial biodiversity that has developed on the acidic and reducing environment of the Canadian shield evolved to promote primary productivity and soil microbial biomass as well as limit soil organic breakdown and soil CO2 emission, both of which contribute to the mitigation of increasing atmospheric CO2 concentrations [44].
Although we found significant roles that local diversity (α-diversity) played on specific dimensions of ecosystem multifunctionality, the heterogeneity of bacterial communities (β-diversity) was found to act as a main contributor to the whole biodiversity effect. While such results were observed in plant species, to our knowledge, this study is the first to show such an impact through microbes [23,45]. The importance of heterogeneity in the regional pool of species may suggest that there were only a few groups (or families) of dominant microorganisms that acted as fundamental pillars to the multifunctionality of boreal ecosystems and other groups of an ecological niche. Recently, Delgado-Baquerizo et al. (2018) demonstrated that 41% of the relative abundance of total bacteria sequenced were only represented in 2% of the phylotypes studied. For instance, 30% of the relative abundance of bacteria in boreal environments were Proteobacteria [14]. As a result, this dominant group may have favored a strong composition effect on the bacteria of our study. For instance, Li et al. (2019) demonstrated that fungal biodiversity composition represented half of the microbial biodiversity effect in boreal forests.
In addition, we were able to show that microbial α-diversity in the boreal forest of Northeastern Canada had a minor role on ecosystem multifunctionality. The effect of local microbial diversity was significant on two particular functions (C-cycle and N-cycle for fungi and C-cycle and ecosystem productivity for bacteria), but this disappeared when looking at all functions together. Conversely, local fungal diversity remained in the final model but with a moderately negative effect on ecosystem multifunctionality, particularly through its negative impact on N mineralization and its positive impact on soil mineral N concentration. These results partially contradict the literature, which states that fungal biodiversity has been found to promote ecosystem multifunctionality [4]. However, these studies were conducted in temperate, semi-arid, and arid climates where microorganisms have long coevolved with their environment. The positive role of local fungal biodiversity was also observed in the boreal forest of Eastern China. When compared to Canada, Eastern China was not covered by ice during the last glaciation, which may have provided a longer timescale for the development of a larger and more specialized regional pool of fungal biodiversity in order to promote ecosystem multifunctionality [44,46].
Finally, both the significant role of β-diversity and bacteria, and the minor role of α-diversity and fungi, may come from the management activities of our sites within the Canadian boreal forest. The forest management involved consisted of an average forestry rotation period of 100 years, which increases both regional heterogeneity and local homogeneity of landscape [25]. Such a human disturbance may promote a preference for a particular adapted microbial species and unfavored the network of mycelium and the complementarity role of fungal biodiversity.
4.2. A Predominant Role of the Environment on Ecosystem Multifunctionality
As in northeastern China, our study showed that environmental conditions were a predominant driver of ecosystem multifunctionality in boreal forests. Soil organic matter was specifically the main environmental driver (in bivariate regressions, determination coefficient, r2SOM-Multifunctionality = 46%, while it was less than 39% between humidity variables and multifunctionality), which differs from Li et al. (2019) who found that it was mainly soil humidity. As soil humidity usually strongly covaries with soil organic matter [47], we suggested that the high concentration of soil organic matter increased soil humidity, which increased soil CO2 emission, soil mineral N content, and potentially its leaching and also decreased primary productivity and soil microbial biomass, altogether leading to lower multifunctionality.
The negative effect of soil organic matter on multifunctionality can be explained by the average very high organic matter content of the soils studied (median 9.7%, mean = 16.5%). According to ecosystem development dynamics, soils that have accumulated such an amount of organic matter content may enter a stage of retrogression that is characterized by lower total soil base fertility and ecosystem primary productivity [48,49,50]. This may be particularly true in managed boreal forests where fire disturbance is strongly reduced, which limits the burn of humus bulk and drives away the root system from the parent rock [51,52].
Temperature had a minor effect on multifunctionality, which can be explained by its positive role on primary productivity and soil microbial biomass that cancelled out the positive effect on soil CO2 emission towards the atmosphere. The soil Eh had no clear direct effect on ecosystem functions, but rather had a clear indirect effect by distinctively modulating fungal and bacterial biodiversity.
4.3. Environmental Role in Determination of Microbial Biodiversity
We found that physicochemical variables (pH and Eh), organic matter, and temperature influenced soil microbial biodiversity. Bacterial diversity was mainly increased by a reducing Eh and a neutral pH (Figure 5), which corresponded to the optimal conditions of bacteria [17]. Our results are in agreement with many study conclusions that showed the importance of soil pH for biodiversity modulation [6,14,26]. At the macroecological scale, the relationship between microbial diversity and pH is mainly quadratic, with an optimum around a pH = 7 [26]. Even though we do not have the whole pH gradient, we also observed a positive correlation with a maximum bacterial heterogeneity near a pH = 7. This positive relationship is however in contradiction with the regional species pool hypothesis, who stated that biodiversity is shaped according to the historical regional context and the conditions in which microorganisms of the region evolved during the last millennia [15]. As such, in the regional acidic Canadian shield environment, we should have found a negative relationship between soil pH and local biodiversity. Instead, we found that in an acidic environment, there is a more homogeneous, ubiquitous, and less diverse bacterial community.
The local fungal community seems, however, to respond to this theory, with high diversity when the soil pH is more acidic. It is known that pH is a great driver of diversity, but very few studies have demonstrated the importance of Eh in the regulation of diversity. I It has been shown in forest swamp sediment that fungi are more likely to grow under oxidative conditions in opposition of bacteria which will be more abundant under reducing conditions [17,27]. The mean Eh in our study was 0.22, which may have favored great regional bacterial diversity and a weak effect of the fungal diversity. As such, both pH and Eh were observed to be key factors in the regulation of microbial biodiversity in boreal forests.
5. Conclusions
This study allowed for a better understanding of the boreal forest multifunctionality in the acidic and reducing regional context of the Eastern Canadian Shield. Our study provides a clear indication of the complementary role that both fungal and bacterial biodiversity had on respective functions encapsulated into the multifunctionality index. We also were able to determine the respective and dominant role of microbial β-diversity over α-diversity on ecosystem multifunctionality. These results need to be put into perspective with regards to disturbances resulting from boreal forest management. Even though microbial diversity is important, we were able to highlight the predominant role of soil organic matter on multifunctionality.
Supplementary Materials
The following are available online at https://www.mdpi.com/1999-4907/11/2/149/s1, Figure S1.1: Visualization of the elbow (a) and variance explanation percentage (b) to establish the number of dimensions to be retained in the PCA of ecosystem function variables., Figure S1.2: Visualization of the elbow (a) and percentage of explanation of variance (b) to establish the number of dimensions to be retained in the PCA of environmental variables., Figure S1.3: PCA of abiotic variables measured in the boreal forest to perform a grouping., Figure S2.1: GLM of fungal alpha (α) and beta (β) biodiversity and abiotic environment variables., Figure S2.2: GLM of bacterial alpha (α) and beta (β) biodiversity and abiotic environment variables., Figure S2.3: GLMs explanation comparison with and without random variables of bacterial and fungal alpha (α) and beta (β) biodiversity and biotic environment variables., Table S1.1: Ecosystem functioning variables., Table S1.2: Abiotic variables., Table S3.1: Fungal SEM regressions correlations coefficients values., Table S3.2: Bacterial SEM regressions correlations coefficients values., Table S3.3: Multifunctionality SEM regressions correlations coefficients values.
Author Contributions
R.G.-T. did her Master thesis on the subject and wrote the article. G.L. did the sampling, the fungi metagenomics, helped for bacterial metagenomic in laboratory, and with the bioinformatic. A.d.G. collaborated on spatial analysis and with statistical analysis. A.M. did pH and Eh measurements. D.B. gave us access to Eco forestry maps and technical support. P.-L.C. collaborated on biodiversity metrics. H.G. and V.M. cosupervised the project. All authors have read and agreed to the published version of the manuscript.
Funding
The study was funded by MITACS Accélération, from the Natural Sciences and Engineering Research Council of Canada (NSERC), the Consortium de Recherche Bioindustrielle du Québec (CRIBIQ) and private funding from Progigraph Inc. and Temiskiming First Nation.
Acknowledgments
We would like to thank Dany Bouchard for his invaluable help in the laboratory of the RIVE (UQTR), Alexandre Brisson and Mathias Bisaillon as research assistants, Roger Larivière and Marcel Otis for their expertise about boreal forest fungi, the team involved in sampling (Isabelle Gosselin, Joëlle Rancourt, Ingrid Berenice and Perrine Juillion), and Emily Pesci for reviewing the grammar of the paper.
Conflicts of Interest
The authors declare no conflict of interest.
References
- Clemmensen, K.E.; Bahr, A.; Ovaskainen, O.; Dahlberg, A.; Ekblad, A.; Wallander, H.; Stenlid, J.; Finlay, R.D.; Wardle, D.A.; Lindahl, B.D. Roots and Associated Fungi Drive Long-Term Carbon Sequestration in Boreal Forest. Science 2013, 339, 1615–1618. [Google Scholar] [CrossRef] [PubMed]
- Bradshaw, C.J.; Warkentin, I.G. Global estimates of boreal forest carbon stocks and flux. Glob. Planet. Chang. 2015, 128, 24–30. [Google Scholar] [CrossRef]
- Maestre, F.T.; Quero, J.L.; Gotelli, N.J.; Escudero, A.; Ochoa, V.; Delgado-Baquerizo, M.; García-Gómez, M.; Bowker, M.A.; Soliveres, S.; Escolar, C.; et al. Plant species richness and ecosystem multifunctionality in global drylands. Science 2012, 335, 214–218. [Google Scholar] [CrossRef] [PubMed]
- Delgado-Baquerizo, M.; Maestre, F.T.; Reich, P.B.; Jeffries, T.C.; Gaitan, J.J.; Encinar, D.; Berdugo, M.; Campbell, C.D.; Singh, B.K. Microbial diversity drives multifunctionality in terrestrial ecosystems. Nat. Commun. 2016, 7, 10541. [Google Scholar] [CrossRef] [PubMed]
- Li, J.; Delgado-Baquerizo, M.; Wang, J.-T.; Hu, H.-W.; Cai, Z.-J.; Zhu, Y.-N.; Singh, B.K. Fungal richness contributes to multifunctionality in boreal forest soil. Soil Biol. Biochem. 2019, 136, 107526. [Google Scholar] [CrossRef]
- Fierer, N.; Jackson, R.B. The diversity and biogeography of soil bacterial communities. Proc. Natl. Acad. Sci. USA 2006, 103, 626–631. [Google Scholar] [CrossRef] [PubMed]
- Luo, P.; Han, X.; Wang, Y.; Han, M.; Shi, H. Influence of long-term fertilization on soil microbial biomass, dehydrogenase activity, and bacterial and fungal community structure in a brown soil of northeast China. Ann. Microbiol. 2015, 65, 533–542. [Google Scholar] [CrossRef]
- Jing, X.; Sanders, N.J.; Shi, Y.; Chu, H.; Classen, A.T.; Zhao, K.; Chen, L.; Shi, Y.; Jiang, Y.; He, J.-S. The links between ecosystem multifunctionalityand above- and belowground biodiversity aremediated by climate. Nat. Commun. 2015, 6, 8159. [Google Scholar] [CrossRef]
- Delgado-Baquerizo, M.; Grinyer, J.; Reich, P.B.; Singh, B.K. Relative importance of soil properties and microbial community for soil functionality: Insights from a microbial swap experiment. Funct. Ecol. 2016, 30, 1862–1873. [Google Scholar] [CrossRef]
- Kendrick, B. The Fifth Kingdom, Mycologue Publications, 2nd ed.; Focus Information Group Inc.: Newburyport, MA, USA, 1992. [Google Scholar]
- Gobat, J.-M.; Aragno, M.; Matthey, W. Le sol vivant: Bases de pédologie - Biologie des sols; Presses polytechniques et universitaires romandes: Lausanne, Suisse, 2010. [Google Scholar]
- Rousk, J.; Bååth, E.; Brookes, P.C.; Lauber, C.L.; Lozupone, C.; Caporaso, J.G.; Knight, R.; Fierer, N. Soil bacterial and fungal communities across a pH gradient in an arable soil. ISME J. 2010, 4, 1340–1351. [Google Scholar] [CrossRef]
- Bertrand, J.-C.; Caumette, P.; Lebaron, P.; Matheron, R.; Normand, P. Écologie Microbienne: Microbiologie des milieux naturels et anthropisés; Presses universitaires de Pau et des Pays de l’Adour: Charenton-le-Pont, France, 2011. [Google Scholar]
- Delgado-Baquerizo, M.; Oliverio, A.M.; Brewer, T.E.; Benavent-González, A.; Eldridge, D.J.; Bardgett, R.D.; Maestre, F.T.; Singh, B.K.; Fierer, N. A global atlas of the dominant bacteria found in soil. Science 2018, 359, 320–325. [Google Scholar] [CrossRef] [PubMed]
- Pärtel, M. Local plant diversity patterns and evolutionary history at the regional scale. Ecology 2002, 83, 2361–2366. [Google Scholar] [CrossRef]
- Hengl, T.; Jesus, J.M.D.; Heuvelink, G.B.M.; Ruiperez, M.; Kilibarda, M.; Blagoti, A.; Shangguan, W.; Wright, M.N.; Geng, X.; Bauer-marschallinger, B.; et al. SoilGrids250m: Global gridded soil information based on machine learning. PLoS ONE 2017, 12, e0169748. [Google Scholar] [CrossRef] [PubMed]
- Husson, O. Redox potential (Eh) and pH as drivers of soil/plant/microorganism systems: A transdisciplinary overview pointing to integrative opportunities for agronomy. Plant Soil 2013, 362, 389–417. [Google Scholar] [CrossRef]
- Hector, A.; Bagchi, R. Biodiversity and ecosystem multifunctionality. Nature 2007, 448, 188–190. [Google Scholar] [CrossRef]
- Cardinale, B.J.; Matulich, K.L.; Hooper, D.U.; Byrnes, J.E.; Duffy, E.; Gamfeldt, L.; Balvanera, P.; O’Connor, M.I.; Gonzalez, A. The functional role of producer diversity in ecosystems. Am. J. Bot. 2011, 98, 572–592. [Google Scholar] [CrossRef]
- Blaxter, M.; Mann, J.; Chapman, T.; Thomas, F.; Whitton, C.; Floyd, R.; Abebe, E. Defining operational taxonomic units using DNA barcode data. Philos. Trans. R. Soc. B: Biol. Sci. 2005, 360, 1935–1943. [Google Scholar] [CrossRef]
- Hautier, Y.; Isbell, F.; Borer, E.T.; Seabloom, E.W.; Harpole, W.S.; Lind, E.M.; Macdougall, A.S.; Stevens, C.J.; Adler, P.B.; Alberti, J.; et al. Local loss and spatial homogenization of plant diversity reduce ecosystem multifunctionality. Nat. Ecol. Evol. 2018, 2, 50–56. [Google Scholar] [CrossRef]
- Loreau, M.; Naeem, S.; Inchausti, P.; Bengtsson, J.; Grime, J.P.; Hector, A.; Hooper, D.U.; Huston, M.A.; Raffaelli, D.; Schmid, B.; et al. Biodiversity and Ecosystem Functioning: Current Knowledge and Future Challenges. Science 2001, 294, 804–808. [Google Scholar] [CrossRef]
- Grman, E.; Zirbel, C.R.; Bassett, T.; Brudvig, L.A. Ecosystem multifunctionality increases with beta diversity in restored prairies. Oecologia 2018, 188, 837–848. [Google Scholar] [CrossRef]
- Kurz, W.; Shaw, C.; Boisvenue, C.; Stinson, G.; Metsaranta, J.; Leckie, D.; Dyk, A.; Smyth, C.; Neilson, E. Carbon in Canada’s boreal forest — A synthesis. Environ. Rev. 2013, 21, 260–292. [Google Scholar] [CrossRef]
- Boucher, D.; De Grandpré, L.; Kneeshaw, D.; St-Onge, B.; Ruel, J.-C.; Waldron, K.; Lussier, J.-M. Effects of 80 years of forest management on landscape structure and pattern in the eastern Canadian boreal forest. Landsc. Ecol. 2015, 30, 1913–1929. [Google Scholar] [CrossRef]
- Lauber, C.L.; Hamady, M.; Knight, R.; Fierer, N. Pyrosequencing-Based Assessment of Soil pH as a Predictor of Soil Bacterial Community Structure at the Continental Scale. Appl. Environ. Microbiol. 2009, 75, 5111–5120. [Google Scholar] [CrossRef] [PubMed]
- Seo, D.C.; Delaune, R.D. Effect of redox conditions on bacterial and fungal biomass and carbon dioxide production in Louisiana coastal swamp forest sediment. Sci. Total Environ. 2010, 408, 3623–3631. [Google Scholar] [CrossRef]
- Genevieve, L.; Pierre-Luc, C.; Roxanne, G.-T.; Amélie, M.; Danny, B.; Vincent, M.; Hugo, G.; Laperriere, G.; Chagnon, P.-L.; Giguère-Tremblay, R.; et al. Estimation of Fungal Diversity and Identification of Major Abiotic Drivers Influencing Fungal Richness and Communities in Northern Temperate and Boreal Quebec Forests. Forests 2019, 10, 1096. [Google Scholar] [CrossRef]
- Noggle, G.R.; Wynd, F.L. The determination of selected chemical characteristics of soil which affect the growth and composition of plants. Plant Physiol. 1941, 16, 39–60. [Google Scholar] [CrossRef]
- Détermination de la matière organique par incinération: Méthode de perte au feu (PAF); Centre d’expertise en analyse environnementale du Québec: Quebec, QC, Canada, 2003; pp. 1–9.
- Husson, O.; Husson, B.; Brunet, A.; Babre, D.; Alary, K.; Sarthou, J.-P.; Charpentier, H.; Durand, M.; Benada, J.; Henry, M. Practical improvements in soil redox potential (Eh) measurement for characterisation of soil properties. Application for comparison of conventional and conservation agriculture cropping systems. Anal. Chim. Acta 2016, 906, 98–109. [Google Scholar] [CrossRef]
- Robertson, G.P.; Coleman, D.C.; Bledsoe, C.S.; Sollins, P. Soil Structural and Other Physical Properties. Standard Soil Methods for Long-Term Ecological Research, 1; Oxford University Press, Inc.: New York, NY, USA, 1999; Volume 1, pp. 75–78. [Google Scholar]
- Gouvernement Ouvert. Available online: https://ouvert.canada.ca (accessed on 10 February 2019).
- Earth Explorer. Available online: http://earthexplorer.usgs.gov/ (accessed on 31 January 2019).
- Johnson, S.; Kuske, C.R.; Carney, T.D.; Housman, D.C.; Gallegos-Graves, L.V.; Belnap, J. Increased temperature and altered summer precipitation have differential effects on biological soil crusts in a dryland ecosystem. Glob. Chang. Biol. 2012, 18, 2583–2593. [Google Scholar] [CrossRef]
- Microplate Enzyme Assay Using Fluorescence Original. Available online: http://enzymes.nrel.colostate.edu/assets/nrel_files/projects/enzymes/docs/microplatefluorescenceassay20120109.pdf (accessed on 2 September 2017).
- Sinsabaugh, R.L.; Hill, B.H.; Shah, J.J.F. Ecoenzymatic stoichiometry of microbial organic nutrient acquisition in soil and sediment. Nature 2009, 462, 795–798. [Google Scholar] [CrossRef]
- Sinsabaugh, R.L.; Gallo, M.E.; Lauber, C.; Waldrop, M.P.; Zak, D.R. Extracellular Enzyme Activities and Soil Organic Matter Dynamics for Northern Hardwood Forests receiving Simulated Nitrogen Deposition. Biogeochemistry 2005, 75, 201–215. [Google Scholar] [CrossRef]
- Huyben, D.; Sun, L.; Moccia, R.; Kiessling, A.; Dicksved, J.; Lundh, T. Dietary live yeast and increased water temperature influence the gut microbiota of rainbow trout. J. Appl. Microbiol. 2018, 124, 1377–1392. [Google Scholar] [CrossRef] [PubMed]
- Afgan, E.; Baker, D.; Batut, B.; Beek, M.V.D.; Bouvier, D.; Čech, M.; Chilton, J.; Clements, D.; Coraor, N.; Grüning, B.A.; et al. The Galaxy platform for accessible, reproducible and collaborative biomedical analyses: 2018 update. Nucleic Acids Res. 2018, 46, W537–W544. [Google Scholar] [CrossRef]
- Koleff, P.; Gaston, K.J.; Lennon, J.J. Measuring beta diversity for presence-absence data. J. Anim. Ecol. 2003, 72, 367–382. [Google Scholar] [CrossRef]
- Byrnes, J.E.K.; Gamfeldt, L.; Isbell, F.; Lefcheck, J.S.; Griffin, J.N.; Hector, A.; Cardinale, B.J.; Hooper, D.U.; Dee, L.E.; Duffy, J.E. Investigating the relationship between biodiversity and ecosystem multifunctionality: Challenges and solutions. Methods Ecol. Evol. 2014, 5, 111–124. [Google Scholar] [CrossRef]
- Boker, S.; Neale, M.; Maes, H.; Wilde, M.; Spiegel, M.; Brick, T.; Spies, J.; Estabrook, R.; Kenny, S.; Bates, T.; et al. OpenMx: An Open Source Extended Structural Equation Modeling Framework. Psychometrika 2011, 76, 306–317. [Google Scholar] [CrossRef] [PubMed]
- Kutzbach, J.; Gallimore, R.; Harrison, S.; Behling, P.; Selin, R.; Laarif, F. Climate and biome simulations for the past 21,000 years. Quat. Sci. Rev. 1998, 17, 473–506. [Google Scholar] [CrossRef]
- Pasari, J.R.; Levi, T.; Zavaleta, E.S.; Tilman, D. Several scales of biodiversity affect ecosystem multifunctionality. Proc. Natl. Acad. Sci. USA 2013, 110, 10219–10222. [Google Scholar] [CrossRef]
- CLIMAP. Seasonal reconstructions of the earth’s surface at the last glacial maximum. Geological Society of America Map Chart Series, MC-36. 1981. [Google Scholar]
- Maire, V.; Wright, I.J.; Prentice, I.C.; Batjes, N.H.; Bhaskar, R.; Van Bodegom, P.M.; Cornwell, W.K.; Ellsworth, D.; Niinemets, Ü.; Ordonez, A.; et al. Global effects of soil and climate on leaf photosynthetic traits and rates. Glob. Ecol. Biogeogr. 2015, 24, 706–717. [Google Scholar] [CrossRef]
- Givnish, T.J. Ecological constraints on the evolution of plasticity in plants. Evol. Ecol. 2002, 16, 213–242. [Google Scholar] [CrossRef]
- Richardson, S.J.; Peltzer, D.A.; Allen, R.B.; McGlone, M.S.; Parfitt, R.L. Rapid development of phosphorus limitation in temperate rainforest along the Franz Josef soil chronosequence. Oecologia 2004, 139, 267–276. [Google Scholar] [CrossRef]
- Lambers, H.; Raven, J.A.; Shaver, G.R.; Smith, S.E. Plant nutrient-acquisition strategies change with soil age. Trends Ecol. Evol. 2008, 23, 95–103. [Google Scholar] [CrossRef] [PubMed]
- Sirén, G. On the development of spruce forests on raw humus sites in north Finland and its ecology. Acta For. Fenn. 1955, 62, 408. [Google Scholar] [CrossRef]
- Simard, M.; LeComte, N.; Bergeron, Y.; Bernier, P.Y.; Paré, D. Forest productivity decline caused by successional paludification of boreal soils. Ecol. Appl. 2007, 17, 1619–1637. [Google Scholar] [CrossRef] [PubMed]
© 2020 by the authors. Licensee MDPI, Basel, Switzerland. This article is an open access article distributed under the terms and conditions of the Creative Commons Attribution (CC BY) license (http://creativecommons.org/licenses/by/4.0/).