Article

Temperature Sensitivity in Individual Components of Ecosystem Respiration Increases along the Vertical Gradient of Leaf–Stem–Soil in Three Subtropical Forests

1
College of Geography and Environmental Sciences, Zhejiang Normal University, Jinhua 321004, China
2
State Key Laboratory of Resources and Environmental Information System, Institute of Geographic Sciences and Natural Resources Research, Chinese Academy of Sciences, Beijing 100101, China
3
Key Laboratory of Forest Ecology and Management, Institute of Applied Ecology, Chinese Academy of Sciences, Shenyang 110016, China
4
Key Laboratory of Ecosystem Network Observation and Modeling, Institute of Geographic Sciences and Natural Resources Research, Chinese Academy of Sciences, Beijing 100101, China
5
Jiangxi Province Key Laboratory of Watershed Ecosystem Change and Biodiversity, Center for Watershed Ecology, Institute of Life Science and School of Life Science, Nanchang University, Nanchang 330031, China
6
State Key Laboratory of Vegetation and Environmental Change, Institute of Botany, Chinese Academy of Sciences, Beijing 100093, China
7
College of Environment and Planning, Henan University, Kaifeng 475004, China
*
Authors to whom correspondence should be addressed.
Forests 2020, 11(2), 140; https://doi.org/10.3390/f11020140
Submission received: 7 December 2019 / Revised: 17 January 2020 / Accepted: 22 January 2020 / Published: 25 January 2020
(This article belongs to the Section Forest Ecology and Management)

Abstract

:
Temperature sensitivity (Q10) of ecosystem respiration (ER) is a crucial parameter for predicting the fate of CO2 in terrestrial e cosystems under global warming. Most studies focus their attention in the variation of Q10 in one or two components of ER, but not in the integration or comparison among Q10 in major components of ER. Vertical and seasonal variations in individual components, including leaf respiration, stem respiration and soil respiration, of ER were observed synchronously along the gradient of leaf–stem–soil over a 2 year period in three forest stands dominated by masson pine, loblolly pine and oak, respectively, in a subtropical forest ecosystem of central China. We found that Q10 in individual components of ER increased along the vertical gradient of leaf–stem–soil. The vertical pattern of Q10 in individual components of ER was ascribed to variations of diurnal temperature range (DTR) and activation energy (ΔHa). These results suggest that a vertical pattern of Q10 in individual components of ER along the gradient of leaf–stem–soil should be taken into consideration in process-based models that simulate respiratory carbon flux in terrestrial ecosystems.

1. Introduction

Temperature sensitivity (Q10) of ecosystem respiration (ER) is a crucial parameter for linking respiratory carbon flux to global warming in terrestrial ecosystems [1]. A constant Q10 value of 2 for ER is often used to generate carbon dynamics in Earth system models (ESMs) [2]. Nonetheless, a mean Q10 value of 1.6 for ER is found based on the FLUXNET database built from a global collection of eddy covariance CO2 flux observations [3]. Moreover, there are increasing evidences that Q10 of ER is not constant instead varying with change in air temperature [4], precipitation [5], atmospheric CO2 [6] and atmospheric nitrogen deposition [7]. ER, a major flux in the global carbon cycle, drives biosynthesis, cellular maintenance and active transport in plants [8]. A GPP of 80% or more is respired by autotrophs and heterotrophs and released back into the atmosphere [9]. In addition, disturbance event, such as harvest, fire, bark beetle outbreak, windthrow, defoliation by insects, fungal attack, and droughts, strongly influences the overall Q10 of ER, as it alters leaf area and coarse woody debris (CWD) [10]. Thus, the inaccurate parameterization in Q10 of ER limits abilities of process-based models to accurately simulate the magnitude of climate–carbon feedbacks [11].
Q10 in individual components of ER has received increased attention [12]. For example, a systematic review on the dynamic response of leaf respiration to temperature proposes that Q10 of leaf respiration is associated with maximum enzyme activity and substrate availability [8]. Likewise, Q10 of stem respiration is linked to canopy photosynthesis and carbohydrates supply [13]. Q10 of soil respiration is correlated with soil moisture, soil microbe activity, soil organic carbon degradability, root maintenance and growth activities [14,15]. Although the eddy covariance technique has provided a useful tool to continuously measure ER, tower-based flux measurements do not provide direct information on component fluxes [11]. Integrative studies of Q10 in individual components of ER have rarely been reported. Therefore, comparison among Q10 in major components of ER is pivotal for reducing model uncertainties and accurately predicting carbon dynamics.
Vertical variations of abiotic and biotic factors along the gradient of leaf–stem–soil potentially lead to differences among Q10 in individual components of ER [16,17]. On the one hand, diurnal temperature range of air (DTRair) is wider than diurnal temperature range of soil (DTRsoil) although mean daily temperature in air showed the similar seasonal pattern with that of soil [18,19]. It has been hypothesized that respiratory metabolism in environments with wider temperature fluctuations may exhibit an increased capacity in temperature acclimation, that may be manifest in altered Q10, than those in constant environments [20]. On the other hand, substrate quality in respiratory metabolism changes from labile such as sugars to recalcitrant such as lignin along the vertical gradient of leaf–stem–soil [21,22]. It is well known that recalcitrant substrates require higher activation energy than labile substrates [23]. On the basis of fundamental principles of enzyme kinetics associated with the Arrhenius equation, the carbon-quality temperature (CQT) hypothesis predicts that the Q10 of respiratory metabolism should increase with increasing activation energy of a reaction [12,24]. However, there has been a lack of direct measurements of activation energy that can be used to assess differences among Q10 in individual components of ER.
The subtropical forest ecosystem in East Asian region exhibits high net ecosystem productivity (NEP) of 362 ± 39 g C m−2 year−1 derived from measurements of 106 flux sites, which is higher than that of Asian tropical and temperate forests, and is also higher than that of forests at the same latitudes in Europe, Africa and North America [25]. ER, one component of NEP, is more sensitive to temperature change than gross primary productivity (GPP), the other component of NEP, based on an integration of eddy covariance observations in this area [26]. Despite the ecological importance of ER in this area, pattern of Q10 in individual components of ER along the vertical leaf–stem–soil gradient is unclear. To address this knowledge gap, vertical and seasonal variations in individual components, including leaf respiration, stem respiration and soil respiration, of ER were measured synchronously over a 2 year period in three forest stands dominated by masson pine, loblolly pine and oak, respectively. Specifically, we hope to explain the following research questions: (1) How different is the Q10 among individual components, including leaf respiration, stem respiration and soil respiration, of ER? (2) What are the regulatory mechanisms underlying differences among Q10 in individual components of ER?

2. Materials and Methods

2.1. Study Site

The study was conducted in the Jigongshan National Nature Reserve (31.46° N–31.52° N, 114.01° E–114.06° E), located at the south of Henan Province in central China. The climate is subtropical monsoon climate, characterized by hot and rainy summer and mild and rainless winter. The mean annual temperature (MAT) is 15.2 °C, with mean monthly temperature ranging from 1.9 °C in January to 27.5 °C in July. The mean annual precipitation (MAP) is 1063 mm, with 45% falling in the summer and only 9% in the winter [27]. The soil is classified as Haplic Luvisols based on International Society of Soil Science classification or as yellow-brown soil based on Chinese classification. The dominant tree species consist of masson pine (Pinus massoniana Lamb.), loblolly pine (Pinus taeda Linn.) and oak (Quercus acutissima Carr.). Masson pine forest is dominant native species planted around 1980s with stand density of 592 trees ha−1 and an average DBH of 28.5 cm measured in 2010, while loblolly pine forest is dominant introduced species planted around 1980s with stand density of 428 trees ha−1 and an average DBH of 25.2 cm, and oak forest is a secondary natural forest regenerated in 1970s with stand density of 452 trees ha−1 and an average DBH of 29.1 cm. Woody shrubs include Lindera glauca (Sieb. et Zucc.) BI., Vitex negundo L., and Symplocos chinensis (Lour.) Druce. Understory herbaceous plants include Lygodium japonicum (Tunb.) Sw., Eriophorum comosum Nees, and Corydalis edulis Maxim.

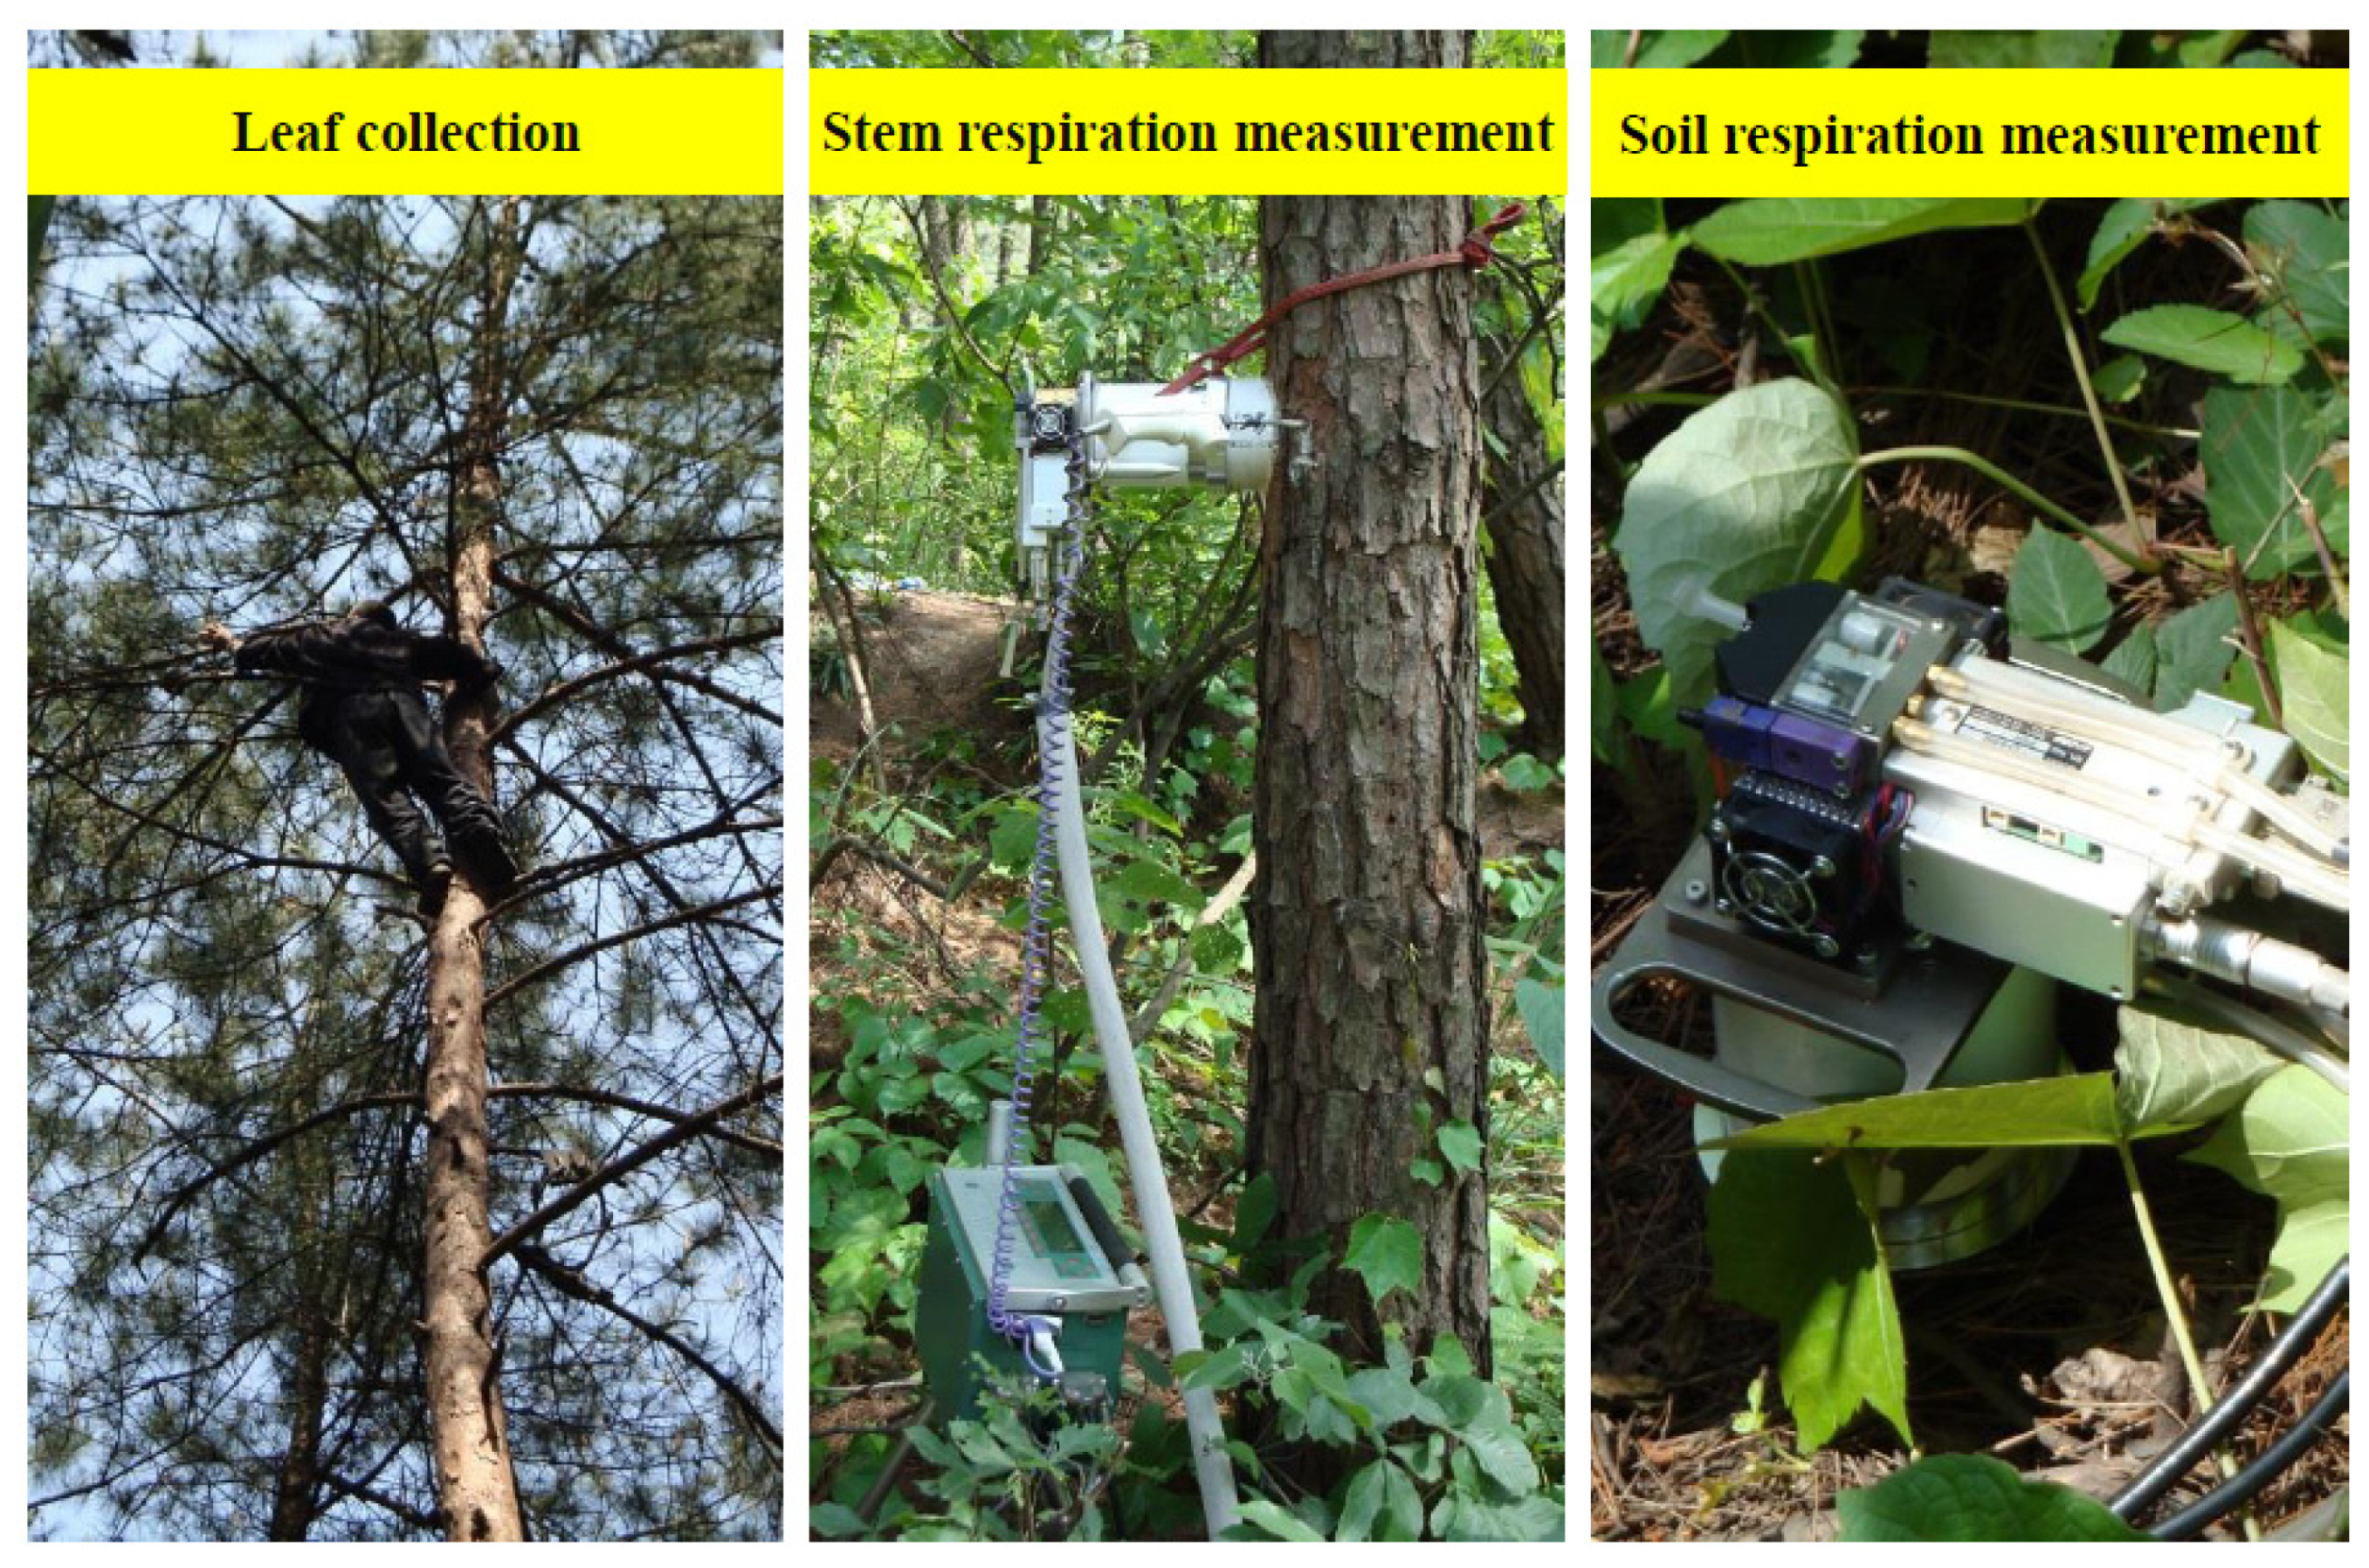
2.2. Experimental Design

The field experiments were conducted in three forest stands dominated by masson pine, loblolly pine and oak, respectively, in August 2008. All three forest stands (30 × 30 m each) were fenced to minimize anthropogenic and herbivore disturbances. The distance between any two forest stands was less than 5 km, which decreased differences in climate condition and soil type. Four replicate plots (15 × 15 m each) were established in each forest stand and one tree per plot (4 trees per forest stand) was selected randomly to measure individual components of ER synchronously (Figure 1).

2.3. Leaf Respiration

Leaf respiration was measured using a LI-6400 portable photosynthesis system (LI-COR Inc., Lincoln, NE, USA) between 9:00 to 11:00 a.m. on clear sunny day once a quarter in 2009 and 2010. Branches about 30 cm long with sun-facing leaves were excised from the middle of the crown with the help of a professional tree climber, stored immediately in a bottle with fresh water, recut under water after being placed in the bottle, and measured on the ground. Dark treatments of 20 min were performed through covering an opaque cloth on the branch samples prior to measurements.
Leaves were put into a 2 × 3 cm2 leaf cuvette sealed with plasticine to prevent leakage. Measurements of leaf respiration were taken when gas exchange had equilibrated (taken to be when the coefficient of variation for the CO2 partial pressure differential was below 1% between the sample and reference analysers). This condition was typically achieved within 1–2 min after a stable CO2 concentration had been reached. Leaf respiration of oak was not measured in January and December 2009 and January 2010 because oaks are deciduous. A total of 84 data points of leaf respiration were collected (i.e., 3 forest stands × 4 plots per forest stand × 8 times per plot—1 forest stand × 4 plots per forest stand × 3 times per plot = 84 data across two years). All measurements were carried out under ambient temperature and a CO2 concentration of 400 μmol mol−1. LI-6400 portable photosynthesis system was zeroed using H2O and CO2 free air before the respiration measurements. Leaf area enclosed in the cuvette was measured with a LI-3100 area meter (LI-COR Inc., USA). Leaf temperature was measured simultaneously using a thermocouple built in the leaf cuvette. The temperature range of leaf respiration measurements during each sampling period was an average value of 1.75 °C.

2.4. Stem Respiration

Stem respiration was measured with a horizontally oriented chamber technique between 9:00 to 11:00 a.m. on clear sunny day once a quarter in 2009 and 2010. Briefly, a custom-built polyvinyl chloride (PVC) collar (inside diameter of 10 cm) was attached to the stem at a height of 1.3 m to permit connection between the stem and a LI-6400-09 CO2 efflux chamber (LI-COR Inc., USA). One end of the PVC collar was cut to match the approximate stem curvature, and the other end was cut to match the LI-6400-09 CO2 efflux chamber. LI-6400-09 CO2 efflux chamber connected to a LI-6400 portable photosynthesis system for data collection and storage. A test of gas leakage was conducted prior to measurement and the LI-6400-09 CO2 efflux chamber was held in place with bungee cords during the measurement.
A total of 96 data points of stem respiration were collected (i.e., 3 forest stands × 4 plots per forest stand × 8 times per plot = 96 data across two years). Stem temperature at a depth of 0–3 cm was measured simultaneously using a probe with a temperature sensor connected to LI-6400 portable photosynthesis system. A depth of 0–3 cm was the appropriate measuring depth of stem temperature for evaluating the Q10 of stem respiration because nearly no hysteresis occurs between stem respiration and temperature at this depth according to work by Yang et al. (2012) [27]. The temperature range of stem respiration measurements during each sampling period was an average value of 1.42 °C.

2.5. Soil Respiration

Soil respiration was measured with an LI-6400-09 CO2 efflux chamber between 9:00 to 11:00 a.m. on clear sunny day once a quarter in 2009 and 2010. A PVC collar with 10 cm in diameter and 3 cm in height was inserted 2 cm into the soil in each stand at random locations. The distance between collars and trees was more than 1 m. Plants inside the soil rings were removed at monthly intervals. A total of 96 data points of soil respiration were collected (i.e., 3 forest stands × 4 plots per forest stand × 8 times per plot = 96 data across two years). Soil temperature at a depth of 0–5 cm was measured simultaneously using a probe with a temperature sensor connected to LI-6400 portable photosynthesis system. A depth of 0–5 cm was the appropriate measuring depth of soil temperature for evaluating the Q10 of soil respiration because nearly no hysteresis occurs between soil respiration and temperature at this depth according to work by Li et al. (2019) [28]. The temperature range of soil respiration measurements during each sampling period was an average value of 0.98 °C. Volumetric soil moisture at the depth of 0–10 cm was measured using TDR 2000 portable soil moisture probe (Spectrum Technologies Inc., Plainfield, IL, USA) when each soil respiration measurement was taken. The quarterly measurements covered the annual variation in temperature range from 4.86 to 32.50 °C for leaf and 1.51 to 27.04 °C for soil.

2.6. Leaf, Stem and Soil Characteristics

Leaf, stem and soil characteristics were measured in the middle of the growing seasons (late July to early August) in 2010. A total of 4 replicate individuals were measured in each forest stand. Typical An/Ci curves (light-saturated net CO2 assimilation rate versus intercellular CO2 concentrations) were measured at leaf temperature of 25 °C and photosynthetic photon flux density of 1500 μmol m−2 s−1. The CO2 concentrations were initially set to range from 400 to 50 μmol mol−1 and then to range from 400 to 1200 μmol mol−1 with a total of 9 points (400, 200, 100, 50, 400, 600, 800, 1000, 1200 μmol mol−1). Vcmax (the maximum rate of Rubisco carboxylation) and Jmax (the maximum rate of photosynthetic electron transport) were estimated by fitting the An/Ci curves using a spreadsheet-based software developed by Sharkey et al. (2007) [29]. An was obtained based on the An/Ci curves at CO2 concentration of 400 μmol mol−1.
Leaves were removed from branches after gas exchange measurements, and then the area was measured with a LI-3100 area meter (LI-COR Inc., USA). Leaf samples were dried at 65 °C for 48 h, and leaf carbon concentration (C) and leaf nitrogen concentration (N) were measured with a CN analyser (CE Inc., Hamburg, Germany). The leaf C/N ratio was calculated based on leaf C and leaf N, and specific leaf area (SLA) was calculated based on the leaf area and dry biomass.
A diameter at breast height (DBH) was measured with a specially calibrated diameter tape that displays the diameter measurement when wrapped around the circumference of a tree. Stand density was estimated by counting the number of trees in each plot. Stand age was measured by counting the annual rings of wood growth after extracting an increment core from the sample trees. Leaf area index (LAI) of each plot was determined at 1.5 m above the ground using LAI-2000 plant canopy analyzer (LI-COR Inc., USA).
Soil samples were collected by taking three soil cores with a 7 cm diameter at a depth of 0–10 cm in each plot. Three soil cores from each plot were mixed in situ to form one composite sample. After removal of roots and gentle homogenization, the moist soil was sieved through 2 mm mesh and was air dried. Then the dry samples were ground to powder for measuring soil C and soil N with a CN analyzer. Soil pH was measured with an Accumet Excel XL60 pH meter (Fisher Scientific, Hampton, NH, USA) at a soil to water ratio of 1:2.5.

2.7. Ecosystem Respiration

Ground-based leaf respiration was a product of LAI multiplied by measured leaf respiration. Ground-based stem respiration was estimated with stem surface area and measured stem respiration similar to study of Tang et al. (2008) [11]. Specifically, stem and branch biomass were functions of DBH:
M = aDBH b
where M is the oven-dry weight of the biomass component of a tree (kg), DBH is the diameter at breast height (cm), and a and b are parameters. Table 1 reports the parameters in allometric biomass equation for the three tree species. Biomass was converted to volume based on wood mass density with 0.40 g cm−3 for masson pine and loblolly pine, and 0.63 g cm-3 for oak, which assumes no heartwood in the young trees.

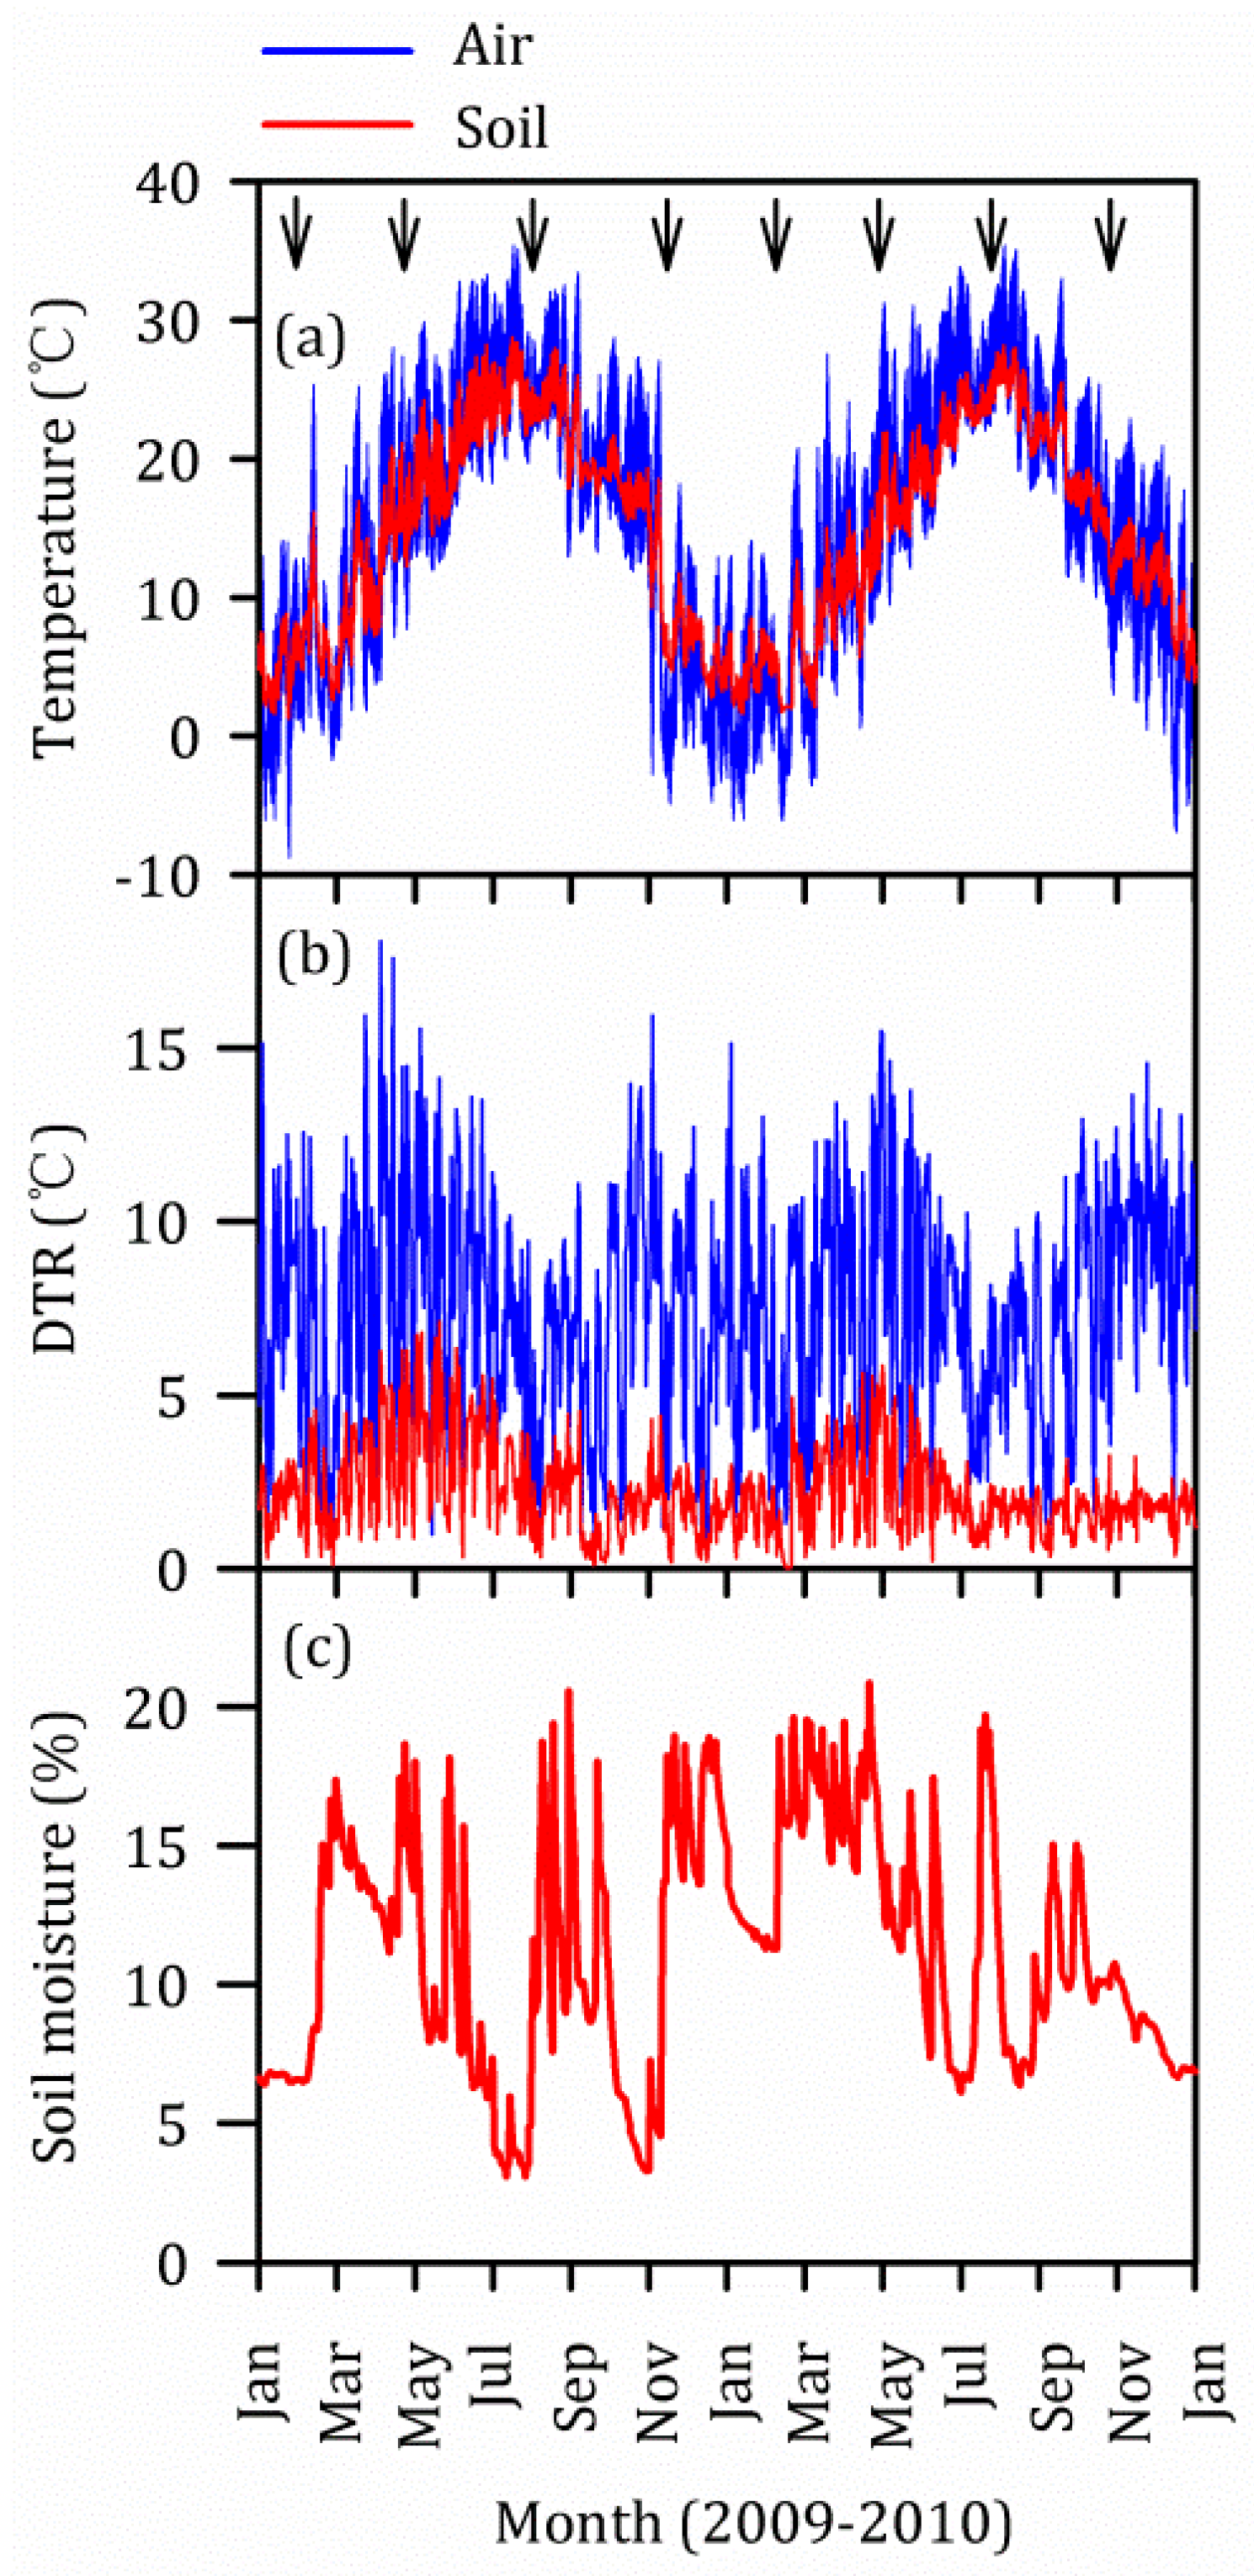
2.8. Air Temperature, Soil Temperature and Soil Moisture

Air temperature at the height of 1.5 m, soil temperature at the depth of 5 cm, and volumetric soil moisture at a depth of 0–10 cm were monitored at 30 min intervals using an EM50 datalogger (Decagon Devices Inc., Pullman, WA, USA) in masson pine stand during the entire year in 2009 and 2010.

2.9. Data Analysis

The temperature dependence in individual components of ER was assessed by an exponential model [33]:
R = R 5 Q 10 ( T 5 10 )
where R is the individual components, such as leaf respiration, stem respiration and soil respiration, of ER (μmol m−2 s−1); T is the measurement temperature (°C) in individual components of ER; R5 is the estimated base respiration based on surface area (μmol m−2 s−1) at the reference temperature of 5 °C; Q10 is a constant fitted by the least-square technique and describes the proportional increase in rate with a 10 °C increase in temperature. A total of 36 temperature response curves were taken and analyzed (i.e., 3 forest stands × 3 components per forest stand × 4 plots per component = 36 curves across two years).
The activation energy in individual components of ER was calculated by fitting the temperature response curves using the equation [34]:
R = e ( c Δ H a R g T k )
where c is a scaling constant; ΔHa is the activation energy (kJ mol−1); Rg is the molar gas constant (8.314 J mol−1 K−1); Tk is the absolute measurement temperature (K).
Kolmogorov-Smirnov and Levene’s tests were used to test the normality and homogeneity of variances, respectively. One-way ANOVA was used to evaluate the differences among the three stands in leaf traits, leaf photosynthesis, stem characteristics and soil properties. If the difference was significant, then post-hoc multiple comparisons were conducted using the least significant difference tests. Repeated Measures ANOVA (RMANOVA) were performed to examine the main and interactive effects of the vertical position and forest stand on individual components of ER. Between-subject effects were evaluated as vertical position and forest stand; within-subject effects were sample date. The missing data for oak leaves was interpolated by the existing measurements and an exponential model. Two-way ANOVAs were used to analyze the main and interactive effects of the vertical position and forest stand on Q10, ΔHa and R5 in individual components of ER. All statistical analyses were conducted using SPSS Version 17.0 (SPSS Inc., Chicago, IL, USA).

3. Results

3.1. Leaf, Stem and Soil Characteristics of the Three Forest Stands

The masson pine forest has the highest leaf An (p = 0.017), stand density (p < 0.001) and soil C/N (p = 0.001) among the three forest stands, while the loblolly pine forest has the highest leaf Jmax (p = 0.002), soil C (p < 0.001) and soil N (p < 0.001), and the oak forest has the highest SLA (p < 0.001) and leaf N (p < 0.001) (Figure 2).

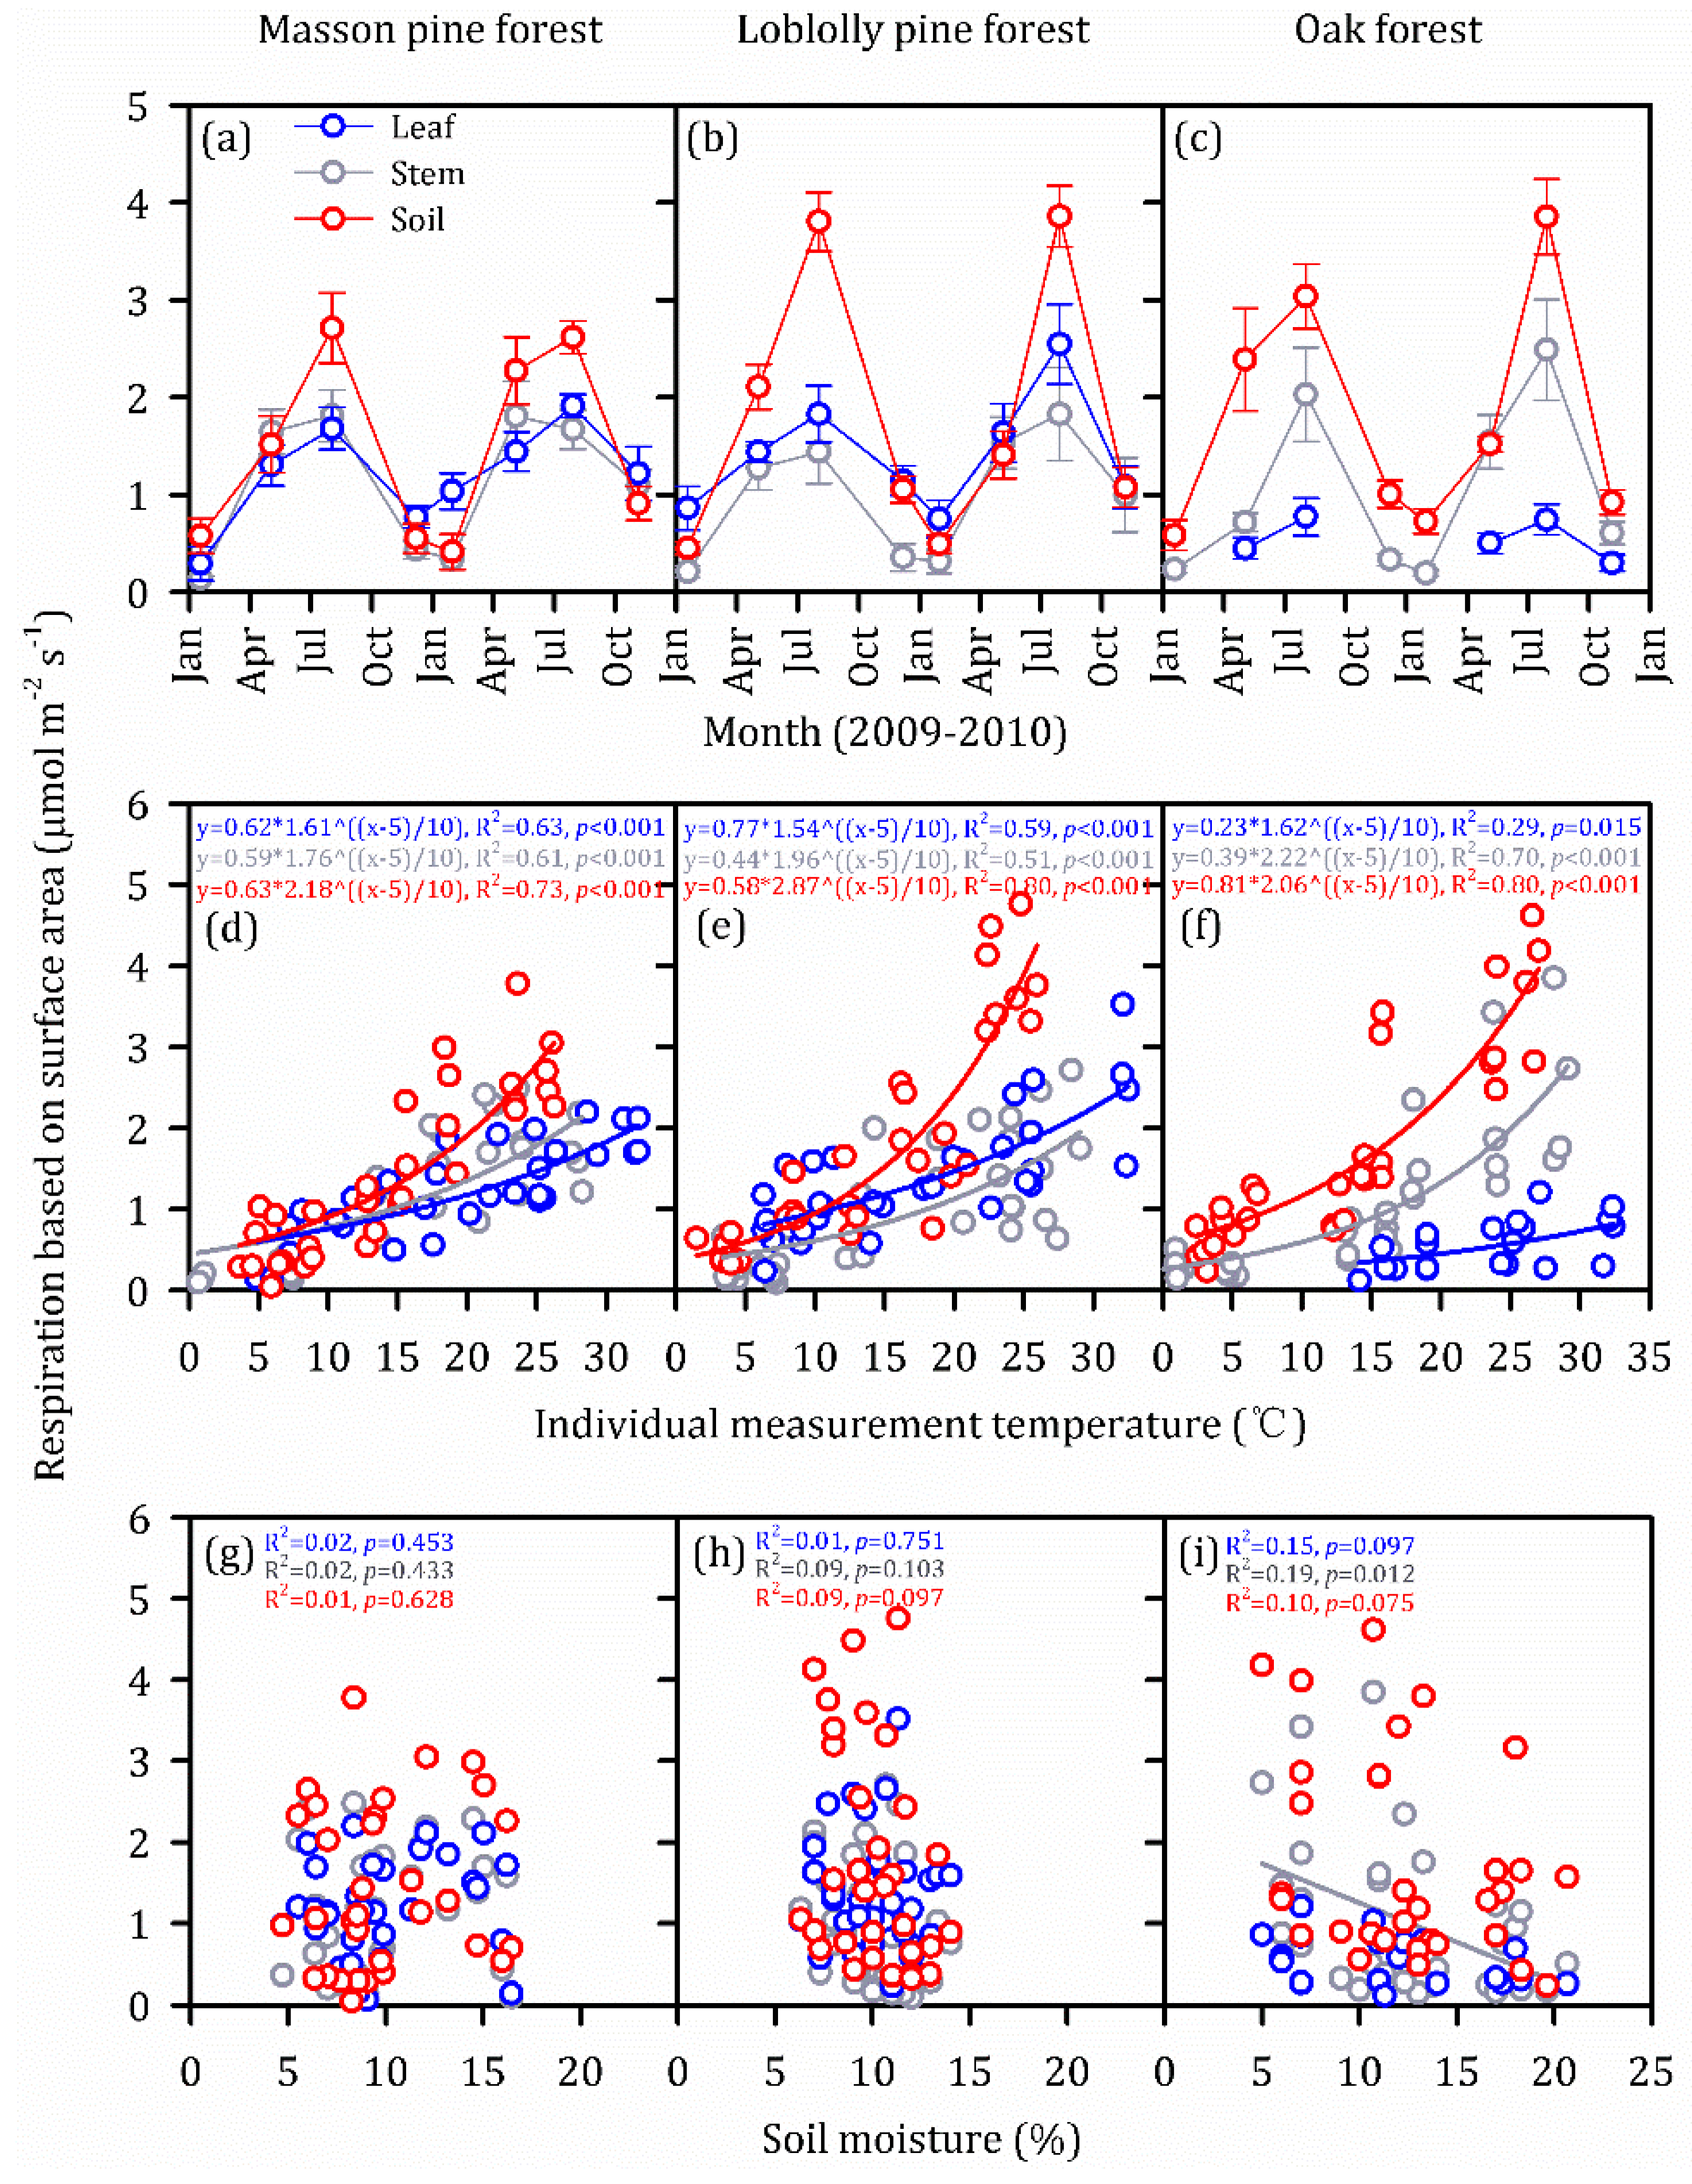
3.2. Vertical and Seasonal Variations in Individual Components of ER

The effects of the vertical position and sample date were significant for individual components of ER (both p < 0.001), while individual components of ER did not differ among forest stands (p = 0.091) (Table 2). The individual components of ER exhibited apparent vertical gradients, showing lowest mean values across forest stands and sampling dates in leaf respiration (1.02 ± 0.07 μmol m−2 s−1), intermediate in stem respiration (1.04 ± 0.09 μmol m−2 s−1) and highest in soil respiration (1.66 ± 0.12 μmol m−2 s−1) (Figure 3a–c). The seasonal dynamics in individual components of ER exhibited bell-shaped curves, showing lowest mean values in early January (winter) and highest in late July (summer) (Figure 3a–c).

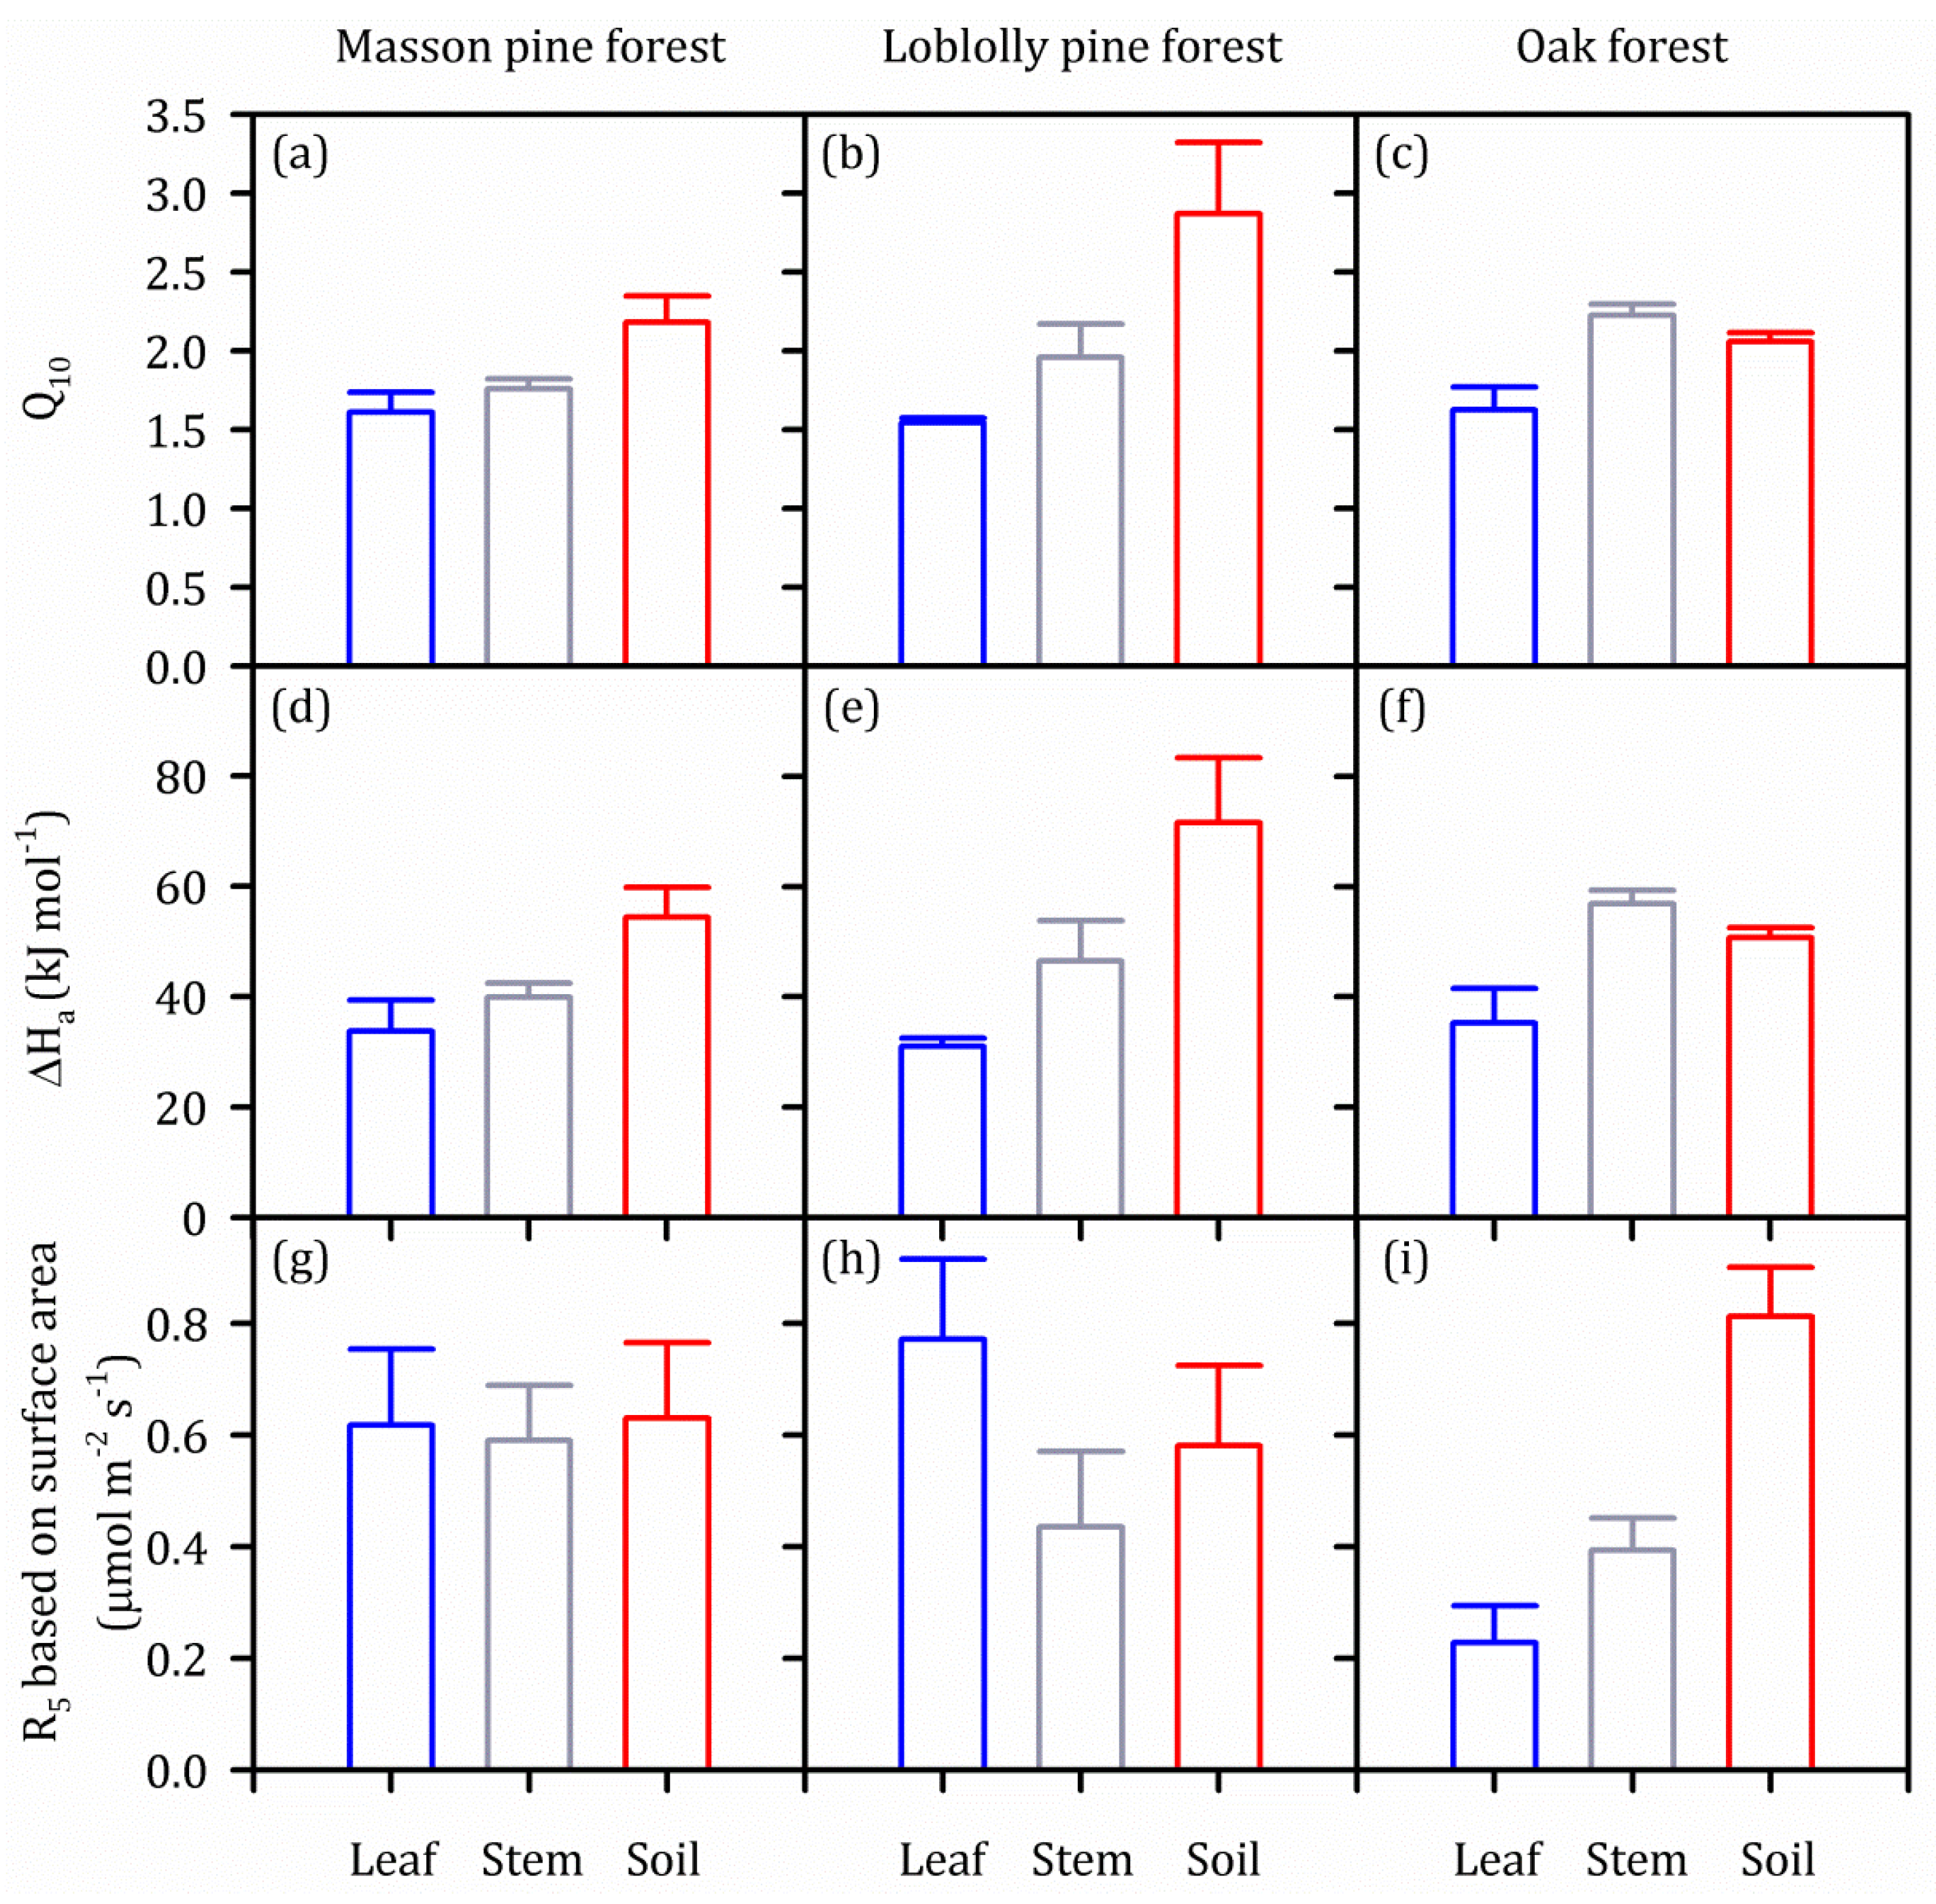
3.3. Temperature Dependence and Soil Moisture Dependence in Individual Components of ER

The individual components of ER exhibited close exponential relationships with individual measurement temperatures, which explained 29–80% of the seasonal variation in individual components of ER (Figure 3d,e,f). Soil moisture dependence explained just 1–19% of the seasonal variation in individual components of ER (Figure 3g,h,i). The effects of the vertical position were significant for Q10 in individual components of ER (p < 0.001), while Q10 in individual components of ER did not differ among forest stands (p = 0.230) (Table 3 and Figure 4a–c). ΔHa in individual components of ER showed a similar pattern with Q10 (Table 3 and Figure 4d–f). R5 in individual components of ER exhibited an interactive effect of the vertical position and forest stands (p = 0.024) (Table 3 and Figure 4g,h,i).

3.4. Overall ER per Ground Area from Specific Components during the Temperatures Peak

Total ecosystem respiration averaged 11.20 μmol m−2 s−1 in the masson pine stand, 12.45 μmol m−2 s−1 in the loblolly pine stand, and 7.41 μmol m−2 s−1 in the oak stand during the growing season when temperatures peak (Table 4). Maximum of ecosystem respiration was estimated as 10.36 μmol m−2 s−1 from the three stands when temperatures peak in a subtropical forest ecosystem of central China (Table 4).

3.5. Vertical and Seasonal Variations of Temperature

The diurnal temperature range of air (DTRair) was significantly greater than the diurnal temperature range of soil (DTRsoil) (p < 0.001), although the mean daily temperature in air showed the similar seasonal pattern with that in soil (Figure 5).

4. Discussion

4.1. Q10 in Individual Components of ER Increased along the vertical gradient of Leaf–stem–soil

Our study reported that Q10 in individual components of ER increased along the vertical leaf–stem–soil gradient in subtropical ecosystem of central China (Figure 4). In other words, soil respiration was more sensitive to temperature change than leaf respiration. Higher Q10 values in soil respiration while lower Q10 values in leaf respiration have been observed in other studies [35,36]). For example, Q10 of soil respiration range of 2.6–3.3 has been found in a meta-analysis based on 818 studies constituting 3379 records at global scale [36]. A study based on a multichannel automated measurement system shows Q10 of 2.81 for soil respiration in subtropical evergreen forest ecosystems [26]. However, Q10 of leaf respiration range of 2.1–2.6 has been observed in a synthesis of published results consisting of 238 data points in 56 plant species [35]. It has been proposed that even a small shift in Q10 of ER may cause a great change in CO2 efflux [37,38]. Therefore, our observations suggest that differences among Q10 in individual components of ER should be taken into consideration in process-based models that simulate respiratory carbon flux in terrestrial ecosystems.

4.2. Mechanisms Underlying Differences among Q10 in Individual Components of ER

Vertical pattern of Q10 in individual components of ER along the gradient of leaf–stem–soil may be ascribed to different degree of temperature acclimation induced by temperature fluctuations in individual components. In current study, DTRair was found to be significantly wider than DTRsoil, although mean daily temperature in air showed the similar seasonal pattern with that in soil (Figure 5). Wider temperature fluctuations may result in greater degree in temperature acclimation of respiratory metabolism compared with constant environments [39]. According to the mechanisms underlying temperature acclimation of respiration proposed by Atkin and Tjoelker (2003) [8], the degree in temperature acclimation of respiration is manifest primarily through the magnitude in reduction of Q10. In addition, higher degrees in temperature acclimation of leaf respiration but lower degrees in temperature acclimation of soil respiration have been reported in previous studies [40,41]. For instance, temperature acclimation of leaf respiration is remarkably uniform across biomes and plant functional types based on a comprehensive database of 231 species spanning seven biomes [41]. Nonetheless, there is limited evidence for temperature acclimation of soil respiration based on a global synthesis of 27 experimental warming studies spanning nine biomes [40]. Thus, the determining role of vertical variations of DTR observed here, together with mechanisms underlying temperature acclimation of respiration, jointly indicates the importance of temperature fluctuations in governing the vertical pattern of Q10 in individual components of ER.
Variations of ΔHa in individual components of ER also contribute to vertical pattern of Q10 in individual components of ER along the gradient of leaf–stem–soil. Activation energy, reflecting the energy required to initiate a reaction, is associated with substrate quality in respiratory metabolism [23]. The breakdown of more recalcitrant substrates—that is, those that require higher activation energy—generally should be more sensitive to changes in temperature than the decomposition of more labile substrates [42]. It is well known that substrate quality in respiratory metabolism changes from labile such as sugars to recalcitrant such as lignin along the vertical leaf–stem–soil gradient [21,22]. In the current study, the ΔHa in individual components of ER was found to increase along the vertical leaf–stem–soil gradient (Figure 4). Moreover, higher ΔHa values in soil respiration while lower ΔHa values in leaf respiration have been observed in other studies [43,44]. For instance, a global dataset on the distribution of organic carbon shows up to 154 kJ mol−1 of activation energy for soil respiration [44]. However, activation energy of leaf respiration with a range of just 70–105 kJ mol−1 has been observed in a study of Eucalyptus grandis in a differing nitrogen supply [43]. Therefore, vertical patterns of Q10 in individual components of ER along the gradient of leaf–stem–soil may be ascribed to variations of ΔHa induced by substrate quality in individual components.

4.3. Uncertainty Analysis

There were three issues worthy of note. First, the air temperature was measured under the canopy at the height of 1.5 m above the ground, because the installment of the air temperature sensor is difficult within the canopy. Our study ignored the difference between air temperature and leaf temperature. Second, only one soil temperature sensor was used in masson pine stand. Our study ignored the spatial variability in climate condition within plots and among stand types. Third, because of the lack of respiratory temperature response curves within the quarterly measurements, this study could not evaluate the seasonal dynamics of Q10 or ΔHa. Therefore, our conclusions should be treated with some caution and need to be confirmed by future experiments.
Our comparison between chamber and eddy covariance measurements of respiration showed larger Q10 in individual components of ER than overall Q10 of ER (Table 5). The lower Q10 of ER from eddy covariance measurements is probably due to underestimation of nocturnal respiration when turbulence is weak and drainage is significant [11]. Eddy covariance methods need to be complemented and compared to component fluxes when studying forest carbon dynamics from stand to regional scale.

5. Conclusions

Taken together, our study found that Q10 in individual components of ER increased along the vertical leaf–stem–soil gradient based on synchronous observation of leaf respiration, stem respiration and soil respiration in three forest stands over a 2 year period in the subtropical forest ecosystem of central China. The vertical pattern of Q10 in individual components of ER may be ascribed to different degree of temperature acclimation induced by temperature fluctuations, or to variations of ΔHa induced by substrate quality. The finding of a vertical pattern of Q10 in individual components of ER along the gradient of leaf–stem–soil suggests that warmer climate will enhance the magnitude of respiratory carbon efflux from soil relative to that from canopy.

Author Contributions

Y.C., Q.Y., L.Z. and M.X. conceived and designed the research. Y.C., Q.Y. and R.S. collected and processed the data. Y.C., L.Z., Z.Z. (Zhaoyang Zhang), Z.Z. (Zhenzhen Zhang), C.W., X.L. and J.J. analyzed the data. Y.C., Q.Y., L.Z., R.S. and S.Z. wrote the manuscript. All authors have read and agreed to the published version of the manuscript.

Funding

This research was funded by National Key Research and Development Program of China (2017YFB0504000 and 2016YFB0501501), National Natural Science Foundation of China (41871084, 41671046 and 31400393,), Zhejiang Provincial Natural Science Foundation of China (LY19C030004), and a grant from State Key Laboratory of Resources and Environmental Information System.

Conflicts of Interest

The authors declare no conflict of interest.

References

  1. Reichstein, M.; Ciais, P.; Papale, D.; Valentini, R.; Running, S.; Viovy, N.; Cramer, W.; Granier, A.; Ogee, J.; Allard, V.; et al. Reduction of ecosystem productivity and respiration during the European summer 2003 climate anomaly: A joint flux tower, remote sensing and modelling analysis. Glob. Chang. Biol. 2007, 13, 634–651. [Google Scholar] [CrossRef]
  2. Friedlingstein, P.; Cox, P.; Betts, R.; Bopp, L.; Von Bloh, W.; Brovkin, V.; Cadule, P.; Doney, S.; Eby, M.; Fung, I.; et al. Climate-carbon cycle feedback analysis: Results from the (CMIP)-M-4 model intercomparison. J. Clim. 2006, 19, 3337–3353. [Google Scholar] [CrossRef]
  3. Mahecha, M.D.; Reichstein, M.; Carvalhais, N.; Lasslop, G.; Lange, H.; Seneviratne, S.I.; Vargas, R.; Ammann, C.; Arain, M.A.; Cescatti, A.; et al. Global convergence in the temperature sensitivity of respiration at ecosystem level. Science 2010, 329, 838–840. [Google Scholar] [CrossRef] [Green Version]
  4. Araki, M.G.; Gyokusen, K.; Kajimoto, T. Vertical and seasonal variations in temperature responses of leaf respiration in a Chamaecyparis obtusa canopy. Tree Physiolgy 2017, 37, 1269–1284. [Google Scholar] [CrossRef] [PubMed]
  5. Li, Q.; Xia, J.; Shi, Z.; Huang, K.; Du, Z.; Lin, G.; Luo, Y. Variation of parameters in a Flux-Based Ecosystem Model across 12 sites of terrestrial ecosystems in the conterminous USA. Ecol. Model. 2016, 336, 57–69. [Google Scholar] [CrossRef]
  6. Drake, J.E.; Stoy, P.C.; Jackson, R.B.; DeLucia, E.H. Fine-root respiration in a loblolly pine (Pinus taeda L.) forest exposed to elevated CO2 and N fertilization. Plant Cell Environ. 2008, 31, 1663–1672. [Google Scholar]
  7. Li, Q.; Song, X.; Chang, S.X.; Peng, C.; Xiao, W.; Zhang, J.; Xiang, W.; Li, Y.; Wang, W. Nitrogen depositions increase soil respiration and decrease temperature sensitivity in a Moso bamboo forest. Agric. For. Meteorol. 2019, 268, 48–54. [Google Scholar] [CrossRef]
  8. Atkin, O.K.; Tjoelker, M.G. Thermal acclimation and the dynamic response of plant respiration to temperature. Trends Plant Sci. 2003, 8, 343–351. [Google Scholar] [CrossRef]
  9. Janssens, I.A.; Lankreijer, H.; Matteucci, G.; Kowalski, A.S.; Buchmann, N.; Epron, D.; Pilegaard, K.; Kutsch, W.; Longdoz, B.; Gruenwald, T.; et al. Productivity overshadows temperature in determining soil and ecosystem respiration across European forests. Glob. Chang. Biol. 2001, 7, 269–278. [Google Scholar] [CrossRef]
  10. Williams, C.A.; Gu, H.; MacLean, R.; Masek, J.G.; Collatz, G.J. Disturbance and the carbon balance of US forests: A quantitative review of impacts from harvests, fires, insects, and droughts. Glob. Planet. Chang. 2016, 143, 66–80. [Google Scholar] [CrossRef]
  11. Tang, J.; Bolstad, P.V.; Desai, A.R.; Martin, J.G.; Cook, B.D.; Davis, K.J.; Carey, E.V. Ecosystem respiration and its components in an old-growth forest in the Great Lakes region of the United States. Agric. For. Meteorol. 2008, 148, 171–185. [Google Scholar] [CrossRef]
  12. Davidson, E.A.; Janssens, I.A. Temperature sensitivity of soil carbon decomposition and feedbacks to climate change. Nature 2006, 440, 165–173. [Google Scholar] [CrossRef] [PubMed]
  13. Yang, J.; He, Y.; Aubrey, D.P.; Zhuang, Q.; Teskey, R.O. Global patterns and predictors of stem CO2 efflux in forest ecosystems. Glob. Chang. Biol. 2016, 22, 1433–1444. [Google Scholar] [CrossRef] [PubMed]
  14. Tang, J.; Baldocchi, D.D. Spatial-temporal variation in soil respiration in an oak-grass savanna ecosystem in California and its partitioning into autotrophic and heterotrophic components. Biogeochemistry 2005, 73, 183–207. [Google Scholar] [CrossRef]
  15. Meyer, N.; Welp, G.; Amelung, W. The temperature sensitivity (Q10) of soil respiration: Controlling factors and spatial prediction at regional scale based on environmental soil classes. Glob. Biogeochem. Cycles 2018, 32, 306–323. [Google Scholar] [CrossRef]
  16. Xu, M.; DeBiase, T.A.; Qi, Y.; Goldstein, A.; Liu, Z. Ecosystem respiration in a young ponderosa pine plantation in the Sierra Nevada Mountains, California. Tree Physiol. 2001, 21, 309–318. [Google Scholar] [CrossRef] [Green Version]
  17. Van Gestel, N.C.; Schwilk, D.W.; Tissue, D.T.; Zak, J.C. Reductions in daily soil temperature variability increase soil microbial biomass C and decrease soil N availability in the Chihuahuan Desert: Potential implications for ecosystem C and N fluxes. Glob. Chang. Biol. 2011, 17, 3564–3576. [Google Scholar] [CrossRef]
  18. van Gestel, N.C.; Dhungana, N.; Tissue, D.T.; Zak, J.C. Seasonal microbial and nutrient responses during a 5-year reduction in the daily temperature range of soil in a Chihuahuan Desert ecosystem. Oecologia 2016, 180, 265–277. [Google Scholar] [CrossRef]
  19. Sun, X.; Ren, G.; You, Q.; Ren, Y.; Xu, W.; Xue, X.; Zhan, Y.; Zhang, S.; Zhang, P. Global diurnal temperature range (DTR) changes since 1901. Clim. Dyn. 2019, 52, 3343–3356. [Google Scholar] [CrossRef]
  20. Tjoelker, M.G.; Oleksyn, J.; Lorenc-Plucinska, G.; Reich, P.B. Acclimation of respiratory temperature responses in northern and southern populations of Pinus banksiana. New Phytol. 2009, 181, 218–229. [Google Scholar] [CrossRef]
  21. He, M.; Zhang, K.; Tan, H.; Hu, R.; Su, J.; Wang, J.; Huang, L.; Zhang, Y.; Li, X. Nutrient levels within leaves, stems, and roots of the xeric species Reaumuria soongorica in relation to geographical, climatic, and soil conditions. Ecol. Evol. 2015, 5, 1494–1503. [Google Scholar] [CrossRef] [PubMed]
  22. Wang, Q.; Qi, L.; Zhou, W.; Liu, C.; Yu, D.; Dai, L. Carbon dynamics in the deciduous broadleaf tree Erman’s birch (Betula ermanii) at the subalpine treeline on Changbai Mountain, Northeast China. Am. J. Bot. 2018, 105, 42–49. [Google Scholar] [CrossRef] [PubMed] [Green Version]
  23. Craine, J.M.; Fierer, N.; McLauchlan, K.K.; Elmore, A.J. Reduction of the temperature sensitivity of soil organic matter decomposition with sustained temperature increase. Biogeochemistry 2013, 113, 359–368. [Google Scholar] [CrossRef]
  24. Fierer, N.; Craine, J.; McLauchlan, K.; Schimel, J. Litter quality and the temperature sensitivity of decomposition. Ecology 2005, 85, 320–326. [Google Scholar] [CrossRef] [Green Version]
  25. Yu, G.; Chen, Z.; Piao, S.; Peng, C.; Ciais, P.; Wang, Q.; Li, X.; Zhu, X. High carbon dioxide uptake by subtropical forest ecosystems in the East Asian monsoon region. Proc. Natl. Acad. Sci. USA 2014, 111, 4910–4915. [Google Scholar] [CrossRef] [PubMed] [Green Version]
  26. Tan, Z.; Zhang, Y.; Liang, N.; Hsia, Y.; Zhang, Y.; Zhou, G.; Li, Y.; Juang, J.; Chu, H.; Yan, J. An observational study of the carbon-sink strength of East Asian subtropical evergreen forests. Environ. Res. Lett. 2012, 7, 044017. [Google Scholar] [CrossRef] [Green Version]
  27. Yang, Q.; Xu, M.; Chi, Y.; Zheng, Y.; Shen, R.; Li, P.; Dai, H. Temporal and spatial variations of stem CO2 efflux of three species in subtropical China. J. Plant Ecol. 2012, 5, 229–237. [Google Scholar] [CrossRef]
  28. Li, R.; Zheng, W.; Yang, Q.; Zhang, W.; Chi, Y.; Wang, P.; Xu, M.; Guan, X.; Chen, L.; Wang, Q.; et al. The response of soil respiration to thinning was not affected by understory removal in a Chinese fir (Cunninghamia lanceolata) plantation. Geoderma 2019, 353, 47–54. [Google Scholar] [CrossRef]
  29. Sharkey, T.D.; Bernacchi, C.J.; Farquhar, G.D.; Singsaas, E.L. Fitting photosynthetic carbon dioxide response curves for C3 leaves. Plant Cell Environ. 2007, 30, 1035–1040. [Google Scholar]
  30. Xiang, W.; Zhou, J.; Ouyang, S.; Zhang, S.; Lei, P.; Li, J.; Deng, X.; Fang, X.; Forrester, D.I. Species-specific and general allometric equations for estimating tree biomass components of subtropical forests in southern China. Eur. J. For. Res. 2016, 135, 963–979. [Google Scholar] [CrossRef]
  31. Gonzalez-Benecke, C.A.; Zhao, D.; Samuelson, L.J.; Martin, T.A.; Leduc, D.J.; Jack, S.B. Local and General Above-Ground Biomass Functions for Pinus palustris Trees. Forests 2018, 9, 310. [Google Scholar] [CrossRef] [Green Version]
  32. Ozdemir, E.; Makineci, E.; Yilmaz, E.; Kumbasli, M.; Caliskan, S.; Beskardes, V.; Keten, A.; Zengin, H.; Yilmaz, H. Biomass estimation of individual trees for coppice-riginated oak forests. Eur. J. For. Res. 2019, 138, 623–637. [Google Scholar] [CrossRef]
  33. Lloyd, J.; Taylor, J.A. On the temperature dependence of soil respiration. Funct. Ecol. 1994, 8, 315–323. [Google Scholar] [CrossRef]
  34. Chi, Y.; Xu, M.; Shen, R.; Yang, Q.; Huang, B.; Wan, S. Acclimation of foliar respiration and photosynthesis in response to experimental warming in a temperate steppe in northern China. PLoS ONE 2013, 8, e56482. [Google Scholar] [CrossRef]
  35. Tjoelker, M.G.; Oleksyn, J.; Reich, P.B. Modelling respiration of vegetation: Evidence for a general temperature-dependent Q10. Glob. Chang. Biol. 2001, 7, 223–230. [Google Scholar] [CrossRef]
  36. Bond-Lamberty, B.; Thomson, A. A global database of soil respiration data. Biogeosciences 2010, 7, 1915–1926. [Google Scholar] [CrossRef] [Green Version]
  37. Chi, Y.; Xu, M.; Shen, R.; Wan, S. Acclimation of leaf dark respiration to nocturnal and diurnal warming in a semiarid temperate steppe. Funct. Plant Biol. 2013, 40, 1159–1167. [Google Scholar] [CrossRef]
  38. Bradford, M.A.; Wieder, W.R.; Bonan, G.B.; Fierer, N.; Raymond, P.A.; Crowther, T.W. Managing uncertainty in soil carbon feedbacks to climate change. Nat. Clim. Chang. 2016, 6, 751–758. [Google Scholar] [CrossRef]
  39. Seebacher, F.; Holmes, S.; Roosen, N.J.; Nouvian, M.; Wilson, R.S.; Ward, A.J. Capacity for thermal acclimation differs between populations and phylogenetic lineages within a species. Funct. Ecol. 2012, 26, 1418–1428. [Google Scholar] [CrossRef]
  40. Carey, J.C.; Tang, J.; Templer, P.H.; Kroeger, K.D.; Crowther, T.W.; Burton, A.J.; Dukes, J.S.; Emmett, B.; Frey, S.D.; Heskel, M.A.; et al. Temperature response of soil respiration largely unaltered with experimental warming. Proc. Natl. Acad. Sci. USA 2016, 113, 13797–13802. [Google Scholar] [CrossRef] [Green Version]
  41. Heskel, M.A.; O’Sullivan, O.S.; Reich, P.B.; Tjoelker, M.G.; Weerasinghe, L.K.; Penillard, A.; Egerton, J.J.G.; Creek, D.; Bloomfield, K.J.; Xiang, J.; et al. Convergence in the temperature response of leaf respiration across biomes and plant functional types. Proc. Natl. Acad. Sci. USA 2016, 113, 3832–3837. [Google Scholar] [CrossRef] [PubMed] [Green Version]
  42. Craine, J.M.; Fierer, N.; McLauchlan, K.K. Widespread coupling between the rate and temperature sensitivity of organic matter decay. Nat. Geosci. 2010, 3, 854–857. [Google Scholar] [CrossRef]
  43. Kruse, J.; Rennenberg, H.; Adams, M.A. Three physiological parameters capture variation in leaf respiration of Eucalyptus grandis, as elicited by short-term changes in ambient temperature, and differing nitrogen supply. Plant Cell Environ. 2018, 41, 1369–1382. [Google Scholar] [CrossRef] [PubMed]
  44. Hemingway, J.D.; Rothman, D.H.; Grant, K.E.; Rosengard, S.Z.; Eglinton, T.I.; Derry, L.A.; Galy, V.V. Mineral protection regulates long-term global preservation of natural organic carbon. Nature 2019, 570, 228–234. [Google Scholar] [CrossRef] [PubMed]
  45. Cui, X.; Liang, J.; Lu, W.; Chen, H.; Liu, F.; Lin, G.; Xu, F.; Luo, Y.; Lin, G. Stronger ecosystem carbon sequestration potential of mangrove wetlands with respect to terrestrial forests in subtropical China. Agric. For. Meteorol. 2018, 249, 71–80. [Google Scholar] [CrossRef]
  46. Wen, X.; Yu, G.; Sun, X.; Li, Q.; Liu, Y.; Zhang, L.; Ren, C.; Fu, Y.; Li, Z. Soil moisture effect on the temperature dependence of ecosystem respiration in a subtropical Pinus plantation of southeastern china. Agric. For. Meteorol. 2006, 137, 166–175. [Google Scholar] [CrossRef]
  47. Yu, G.; Wen, X.; Li, Q.; Zhang, L.; Ren, C.; Liu, Y.; Guan, D. The seasonal patterns of ecosystem respiration and its response to environmental conditions for subtropical and temperate typical ecosystems. Sci. China Ser. D-Earth Sci. 2004, 34, 84–94. [Google Scholar]
Figure 1. Field measurements of individual components, including leaf respiration, stem respiration and soil respiration, of ecosystem respiration (ER) in subtropical forest ecosystem of central China.
Forests 11 00140 g001
Figure 2. Leaf (blue, (a,b,e,f,i,j,m,n)), stem (grey, (c,g,k,o)) and soil (red, (d,h,l,p)) characteristics for masson pine, loblolly pine and oak forests in subtropical forest ecosystem of central China. SLA (cm g−1), specific leaf area; leaf C concentration (%), leaf carbon concentration; leaf N concentration (%), leaf nitrogen concentration; An (μmol m−2 s−1), light-saturated net CO2 assimilation rate; Vcmax (μmol m−2 s−1), maximum rate of Rubisco carboxylation; Jmax (μmol m−2 s−1), maximum rate of photosynthetic electron transport; DBH (cm), diameter at breast height; LAI, leaf area index; soil C concentration (‰), soil carbon concentration; soil N concentration (‰), soil nitrogen concentration. Values are means ± SE (n = 4). Different lowercases represent significant differences among forest stands (p < 0.05).
Forests 11 00140 g002
Figure 3. Seasonal variations (top panels), temperature dependence (middle panels), and soil moisture dependence (bottom panels) in individual components, including leaf respiration (blue), stem respiration (grey) and soil respiration (red), of ecosystem respiration (ER) for masson pine (a,d,g), loblolly pine (b,e,h) and oak (c,f,i) forests over a 2 year period. Values are means ± SE (n = 4). Leaf respiration of oak forest was not measured in January and December 2009 and January 2010 because oaks are deciduous.
Forests 11 00140 g003
Figure 4. Temperature sensitivity (Q10, ac), activation energy (ΔHa, df), and base respiration (R5, gi) in individual components, including leaf respiration (blue), stem respiration (grey) and soil respiration (red), of ecosystem respiration (ER) for masson pine (left panels), loblolly pine (middle panels) and oak (right panels) forests. Values are means ± SE (n = 4).
Forests 11 00140 g004
Figure 5. Daily maximum temperature, daily minimum temperature in air (blue) and soil (red) (a), diurnal temperature range (DTR) in air (DTRair) and soil (DTRsoil) (b), and soil moisture (c) over a 2 year period in subtropical forest ecosystem of central China. DTR is the difference between maximum and minimum temperature within one calendar day. The arrows mark the timing of field campaigns when the measurements of respiration were initiated.
Forests 11 00140 g005
Table 1. Parameters in allometric biomass equation for the three tree species.
SpeciesStemBranchReferences
abab
Masson pine0.17302.15400.06302.5690Xiang et al. 2016 [30]
Loblolly pine0.07252.50740.00163.0786Gonzalez-Benecke et al. 2018 [31]
Oak0.24862.13500.01122.7353Ozdemir et al. 2019 [32]
Table 2. Effects of the vertical position, forest stand, sampling date and their interactions on individual components of ecosystem respiration (ER) by repeated measures ANOVA analysis.
d.f.FP
Vertical position213.03<0.001
Forest stand22.620.091
Vertical position × Forest stand43.620.017
Sampling date7178.81<0.001
Sampling date × Vertical position1417.40<0.001
Sampling date × Forest stand143.36<0.001
Sampling date × Vertical position × Forest stand283.64<0.001
Table 3. Effects of the vertical position, forest stand and their interactions on temperature sensitivity (Q10), activation energy (ΔHa), and base respiration (R5) in individual components of ecosystem respiration (ER) by two-way ANOVA analysis.
Q10ΔHaR5
d.f.Fpd.f.Fpd.f.Fp
Vertical position212.29<0.001214.23<0.00122.380.112
Forest stand21.550.23021.130.33821.200.316
Vertical position×Forest stand42.570.06042.360.07943.340.024
Table 4. Ecosystem respiration, ground-based component respiration (μmol m−2 s−1) and percentage (%) in three stands during the growing season when temperatures peak.
RespirationMasson PineLoblolly PineOakAverage
200920102009201020092010
Leaf respiration6.03 (55%)6.86 (60%)6.58 (60%)9.17 (66%)3.03 (44%)2.91 (37%)5.76 (54%)
Stem respiration2.18 (20%)2.01 (17%)0.66 (6%)0.84 (6%)0.89 (13%)1.09 (14%)1.28 (13%)
Soil respiration2.71 (25%)2.62 (23%)3.80 (34%)3.86 (28%)3.04 (44%)3.86 (49%)3.32 (34%)
Ecosystem respiration10.92 (100%)11.49 (100%)11.04 (100%)13.87 (100%)6.96 (100%)7.86 (100%)10.36 (100%)
Table 5. Q10 values of ecosystem respiration from eddy covariance measurements in subtropical forests in the literature.
SiteLongitudeLatitudeQ10Forest TypeReferences
Dinghushan112°34′ E23°10′ N1.25Evergreen broad-leave forestCui et al. 2018 [45]
Qianyanzhou115°03′ E26°44′ N1.26Evergreen coniferous forestCui et al. 2018 [45]
Qianyanzhou115°03′ E26°44′ N1.54Evergreen coniferous forestWen et al. 2006 [46]
Qianyanzhou115°03′ E26°44′ N1.57Evergreen coniferous forestYu et al. 2004 [47]

