Article

Determination of Elastic Properties of Beech Plywood by Analytical, Experimental and Numerical Methods

Department of Wood Science and Technology, Biotechnical Faculty, University of Ljubljana, 1000 Ljubljana, Slovenia
Forests 2020, 11(11), 1221; https://doi.org/10.3390/f11111221
Submission received: 22 October 2020 / Revised: 8 November 2020 / Accepted: 18 November 2020 / Published: 20 November 2020
(This article belongs to the Special Issue Performance of Wood and Wood-Based Materials)

Abstract

:
This research article examines the application of various methods to determine the effective elastic properties of beech veneer-wood composites. Using laminate theory, the theoretically calculated effective values of the in-plane and out-of-plane modulus of elasticity as well as shear modulus are compared with the values determined from the natural frequencies of flexural, torsional and longitudinal vibrations of samples having different orientations and numbers of composite layers. The samples are also modelled using the finite element method, and their natural frequencies are calculated by the modal analysis. Research has shown that the laminate theory, which is well established and applied in the world of synthetic composites, can also be applied to beech plywood composites, where the theoretically calculated effective values can be up to 15% higher. Similarly, due to the higher calculated effective elastic properties, higher natural frequencies of flexural, torsional and longitudinal vibrations are also calculated by the finite element method.

1. Introduction

Plywood is a widespread and long used building material. It is usually made from peeled veneer, where poor quality veneers can be used on the inside and higher quality veneers of various species are used on the visible outside. The good aspect of plywood is undoubtedly the reduction in anisotropy, as different combinations of veneer layers can affect the mechanical properties of the panel. One of the first who experimentally analysed the relationship between the number of layers, fibre angle, modulus of elasticity and strength, was undoubtedly Norris [1,2]. He was later followed by many other researchers. Kallakas et al. [3] investigated the influence of different layer structures and the use of various wood species on the mechanical properties of plywood, while Biadala et al. [4] carried out similar research trying to develop water-resistant plywood with combinations of different wood species. The influence of fibre reinforcement and wood species on the physical and mechanical properties of veneer plywood as well as on laminated veneer lumber was also investigated [5,6,7], as well as the influence of veneer densification on the mechanical properties of plywood [8]. Surface layer polymerisation by active monomers proved to have a positive effect on the modulus of elasticity and strength of wood-based flooring panels [9]. Kral et al. [10] investigated the use of cork in the middle layer of composite plywood panels, while Hao et al. [11] experimented with wood-based sandwich panels with honeycomb structure, and Zhou et al. [12] with the use of bamboo in laminated veneer lumber.
As different combinations of the factors listed can lead to different properties, many authors have dealt with the determination of the properties of plywood already produced. Some have determined the modulus of elasticity, where the comparison between the calculated and experimentally determined modulus of elasticity, using static bending tests has been carried out [13]. A similar study was conducted by Yoshihara [14], in which he investigated the influence of the dimensions of industrially produced plywood on the measured modulus of elasticity using flexural vibration. In another study [15], he compared the shear modulus determined by square-plate twist method with the values calculated from flexural vibrations. He found that the calculated shear modulus from the vibration test was higher than the values obtained with the static square plate twist method. The application of the same technique to full-size composite wood panels was also investigated [16,17] and new equations were developed to calculate the equivalent shear modulus of plywood from the shear moduli of the individual lamellae [18]. Since plywood can also be given spatial forms, the springback effect must be taken into account [19].
Between the methods, static and dynamic tests are the most popular to determine the mechanical properties of wood and wood composites. Among the static tests, the three- and four-point bending tests are used to determine the modulus of elasticity [20] and the plate-twist method is used to determine the shear modulus [21]. In the dynamic bending tests, the specimen can be clamped as a cantilever [22,23,24], whereby the boundary conditions, i.e., the stiffness of the clamping, must be taken into account, or the specimen can be free at both ends. As with both cantilever and free-free specimens, inertia and shear effects must be taken into account for smaller length-to-height ratios [25,26,27,28]. The influence of shear also depends on the flexural vibrational mode number [29] and the ratio between the modulus of elasticity and the shear modulus [29,30]. For example, the influence is greater in spruce than in beech, because in the first case the ratio can be up to 25, while in the second case it is 13 [31]. In most of the tests performed, the mechanical properties of the dynamic tests were higher than those of the static tests [32,33,34]. However, even more obvious were the differences between the mechanical properties obtained at very high strain rates and those obtained in the quasi-static tests; the former differences are much higher [35].
Today, many artificial materials [36] are known, such as carbon fibres, Kevlar, and glass fibres, which are characterised by very good mechanical properties in the main direction of orientation. For their modelling, the laminate theory [37,38] is used, with the help of which the mechanical properties of a composite material made of the mentioned materials can be calculated. In addition, the application of the finite element method is very widespread or indispensable, especially for complicated shapes and loads. While these approaches are already well established and used for the abovementioned synthetic materials, their application in modelling wood composites is not so widespread [39,40].
Plywood is nowadays a very common material in the furniture industry, especially in contemporary plywood furniture design [41], where it is used as a planotropic material due to its reduced anisotropy. It can therefore be used in the manufacture of a chair [41], where the front and back legs of one side of the chair, together with the crossbar and the support for the backrest, are cut from one piece of plywood. Such an element requires knowledge of the material properties of the plywood panel at various angles, both in the direction of orientation of the face material and at certain angles up to right angles. If a designer wants to calculate the dimensions of such an element, they must know the material properties in all mentioned directions and not only in the direction of orientation of the outer veneer layer. There are also well known examples of the use of plywood in the manufacture of table legs [41], where a single block has a certain dimension both in the direction of the outer veneer layer and in the rectangular direction. In case of insufficient stiffness in the cross direction or at a certain angle to the longitudinal direction of the outer veneer layer, the final product does not provide satisfactory stiffness, so that the end user of the product has no feeling of furniture stability.
The literature presented describes many individual investigations that were carried out to explain the influence of various factors on the mechanical properties of plywood. What they all have in common is that the results are based on experimental findings and are usually not supported by analytical calculations, such as the application of laminate theory. To the authors’ knowledge, there is no research work that deals comprehensively with the determination of the elastic properties of plywood of different compositions, as this study attempts to show.
The aim of this work is therefore to investigate the application of laminate theory and to combine individual approaches in order to model the elastic properties of beech plywood as a composite material. Constructive factors such as the number of layers and the orientation of the tissue in individual layers as well as the method for determining and calculating the elastic-mechanical properties are included. A 7- and 11-layer plywood panel made of beech veneer with uniform known mechanical properties were produced (Figure 1). Samples with different combinations of tissue orientation were cut from the board, the mechanical properties of which were then determined on the basis of free vibration of the samples. The mechanical properties were also determined theoretically by the laminate theory, and compared to experimentally determined values. Each sample was modelled by the finite element method using the composite principle, and then its natural frequency was calculated by modal analysis. The calculated frequency was then also compared to the measured frequency. In this way, different approaches such as the method of laminate theory and the finite element method, in the case of using wood in composite materials, were verified.
The weakness of the approach shown lies in the possible lack of knowledge of the input data, such as elasticity and shear modulus in the main directions of the wood tissue. In this case, the user could use the mean values known from the publicly available literature [42]. An additional weakness is also the variability of material properties, where the properties within a tree species can change by up to several 10%, which means that the calculated material properties for a given plywood combination vary accordingly. For a quantitative uncertainty determination, it would be necessary to perform an uncertainty analysis, whereby for a given case, if the mean values and standard deviations of the input material properties were known, the output material variations would be calculated under a given confidence interval. However, since the abovementioned analysis would go beyond the scope of this article, it is not performed in the present work.

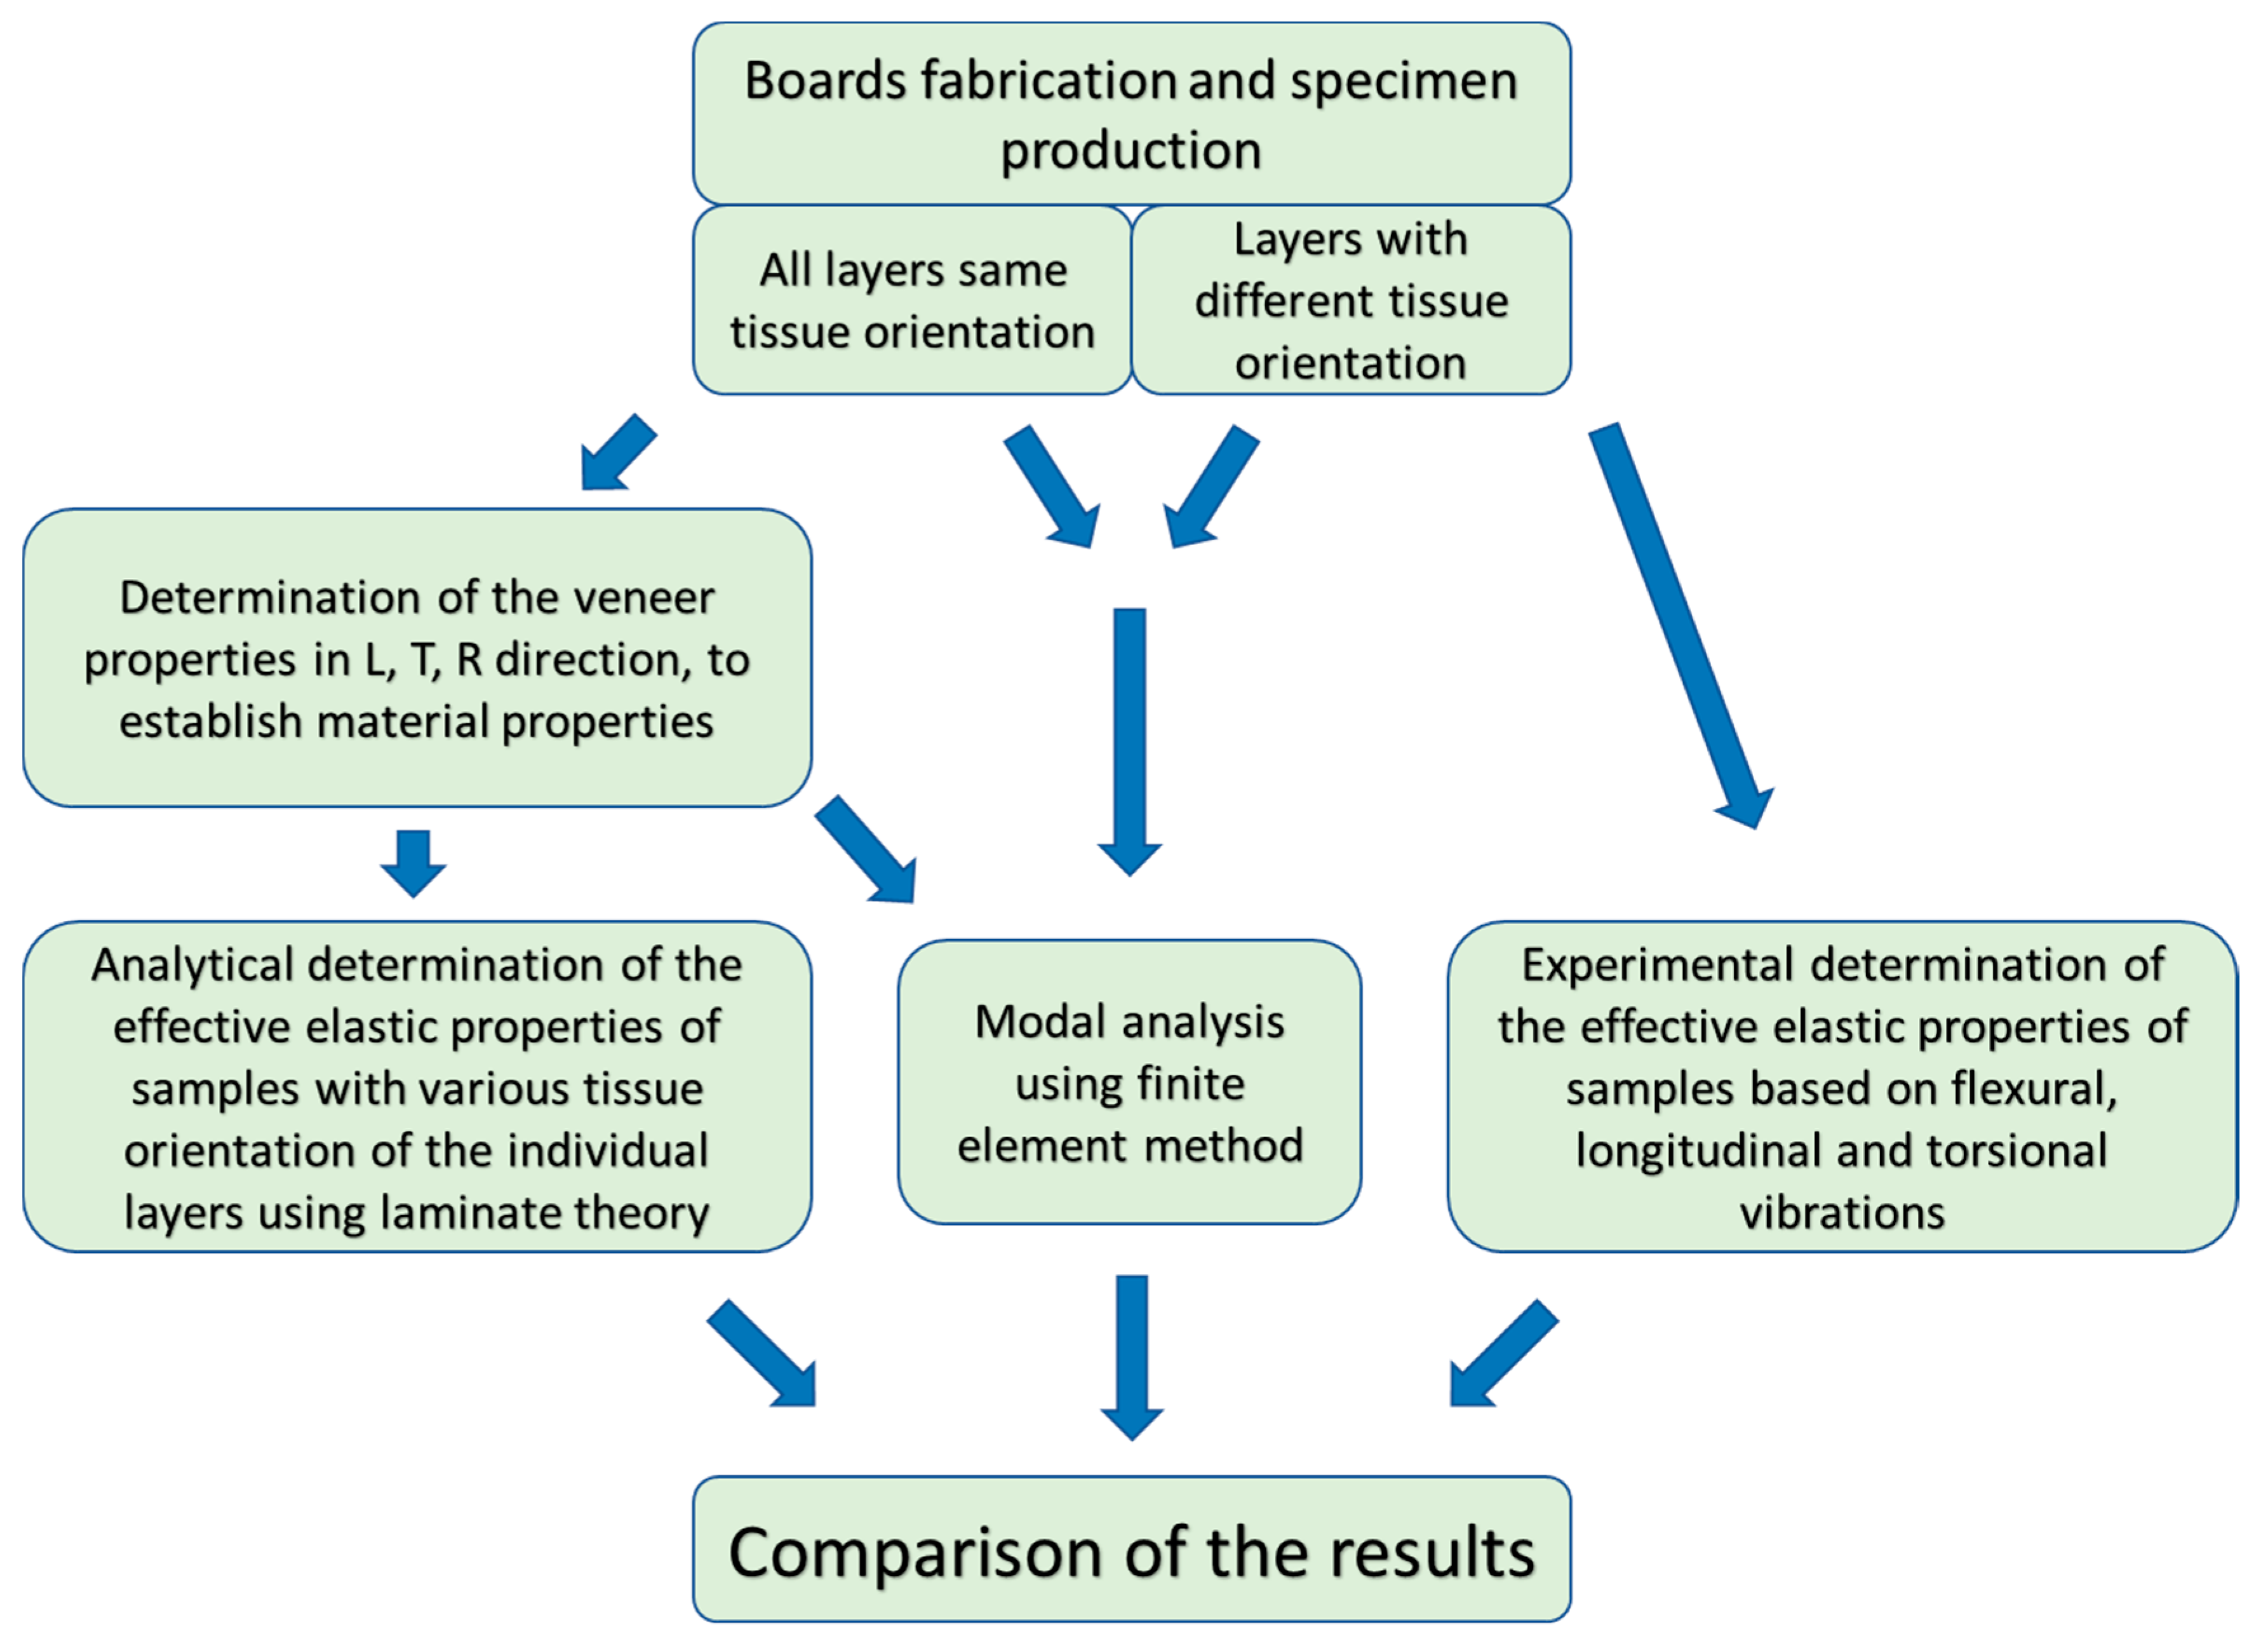
2. Materials and Methods

2.1. Plyboards Fabricaton

For the purpose of the experiment, a custom-made peeled beech (Fagus sylvatica) veneer with tangential texture and nominal thickness of 1.5 mm, made from a single log with uniform annual growth, was purchased. Veneer sheets measuring 1400 × 600 mm were first conditioned in the laboratory at a constant temperature of 22 ℃ and a relative humidity of 45% to an average equilibrium moisture content of 6.7%.
For the production of plywood, a veneer without visual defects and homogeneous structure was chosen. Seven- and 11-layer plywood boards of 600 × 600 mm in size, with different as well as identical veneer orientations, were produced (Table 1, Figure 2). The latter was used to determine the material properties in the principal material directions. Because the veneer was peeled from a cylindrical log and had a strictly tangential orientation in width, it can be described as an orthotropic material with a rectangular coordinate system of principal material properties [43,44].
The melamine–urea–formaldehyde adhesive Meldur H97 was used for production of the panels, to which 1% NH4Cl catalyst and 5% filler (rye flour) were added to increase the viscosity. The mixture was then stirred with an electric mixer for 15 min until a homogeneous mixture was obtained. The adhesive application was 180 g/m2, and the compression pressure and temperature were 1.6 MPa and 130 ℃, respectively, while the compression time for 7- and 11-layer plywood panels was 10 and 13 min, respectively. Afterwards the boards were stacked, weighed and conditioned for 1 week. In this way nine 7-layer plywood boards and twelve 11-layer plywood boards were produced.
After conditioning, the boards were cut to the size of 550 × 550 mm, and their thickness was measured. The 7-layer board was 9.9 mm thick, while the 11-layer board was 15.6 mm thick, corresponding to 1.42 mm per layer.

2.2. Determination of Elastic Properties

This section is divided into four parts. The first part presents the experiments that were carried out to determine the material properties used in the finite element and analytical models using modal analysis and laminate theory, respectively. The second part describes the experimental determination of the effective elastic properties of plywood with different wood tissue orientations of the individual layers based on the natural frequencies of flexural, torsional and longitudinal vibrations. In the third part, the effective elastic properties are calculated using the laminate theory, while the fourth part describes the modal analysis using the finite element method, which is used to calculate the natural frequencies in the vibration modes mentioned above.

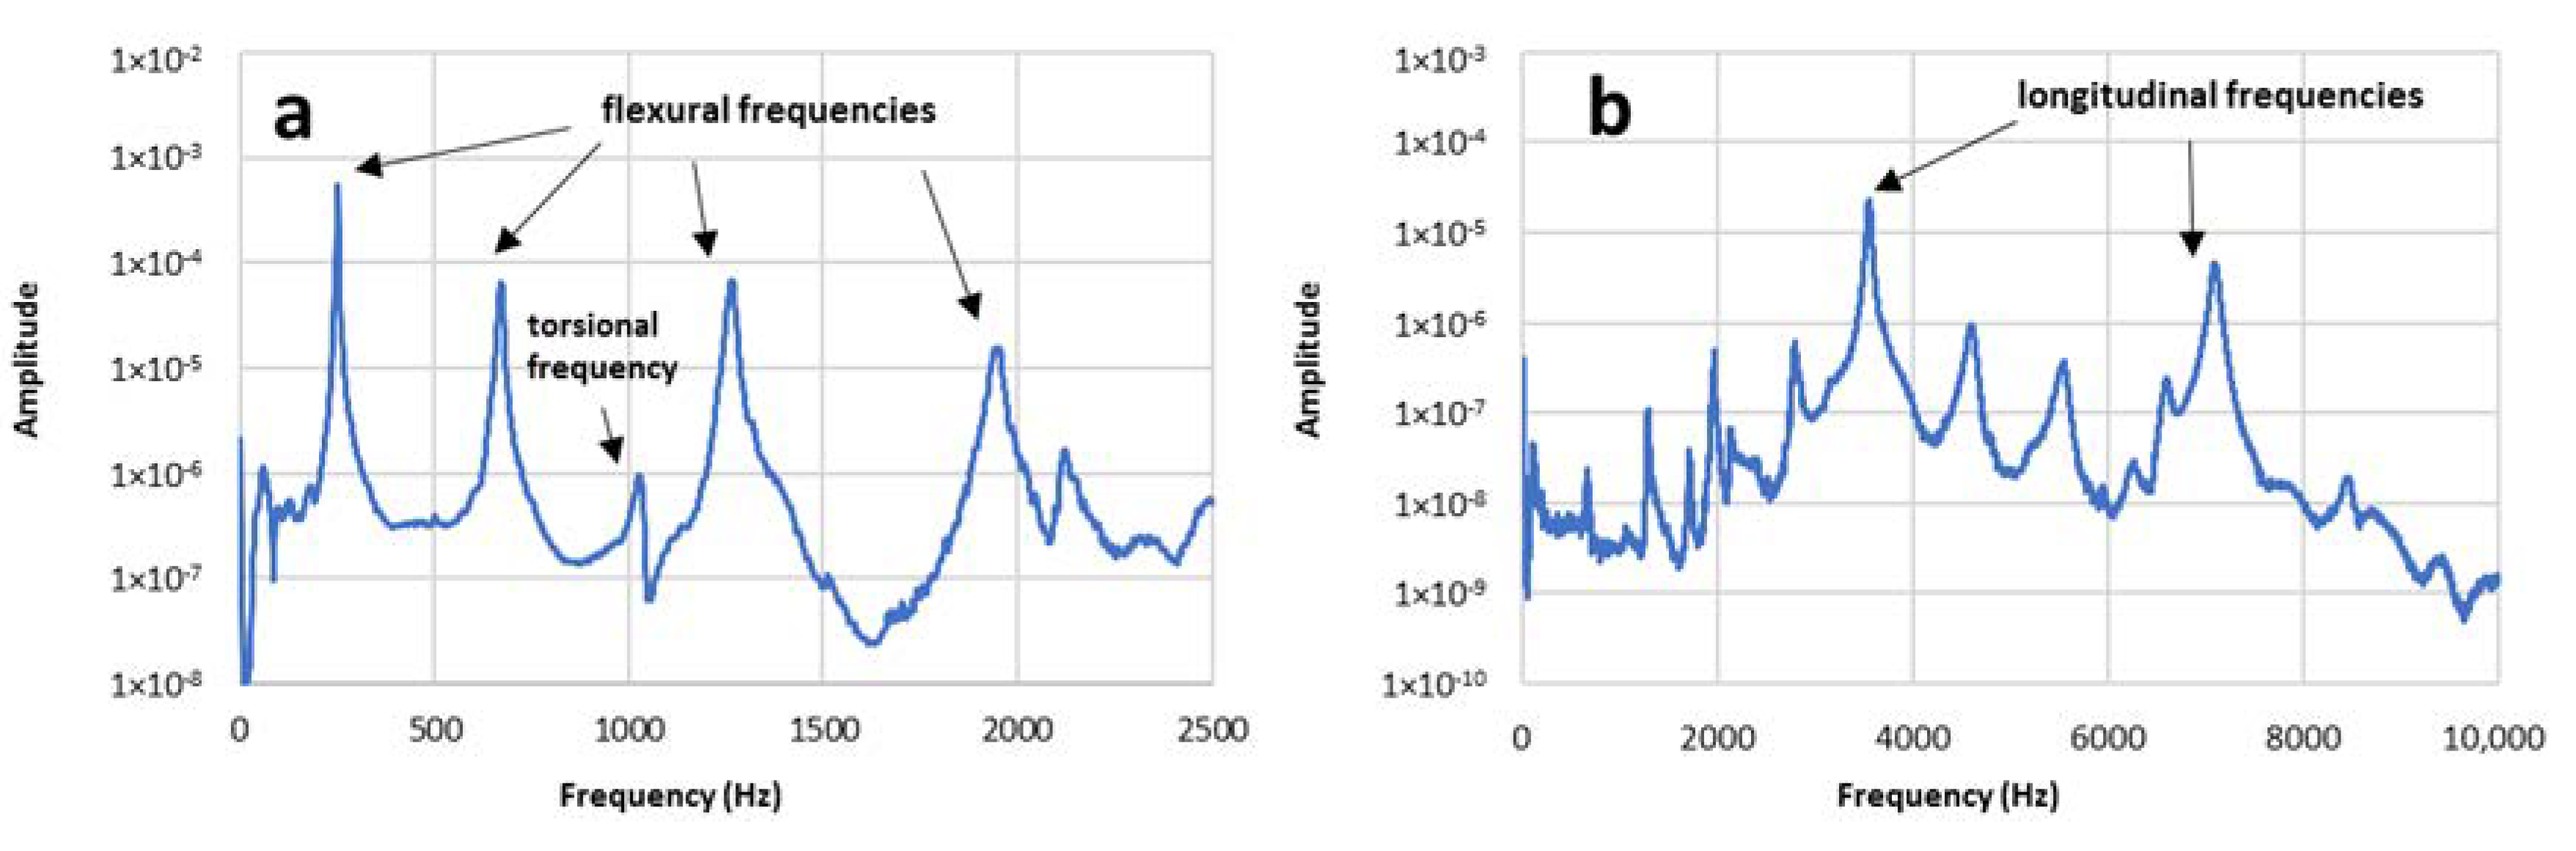
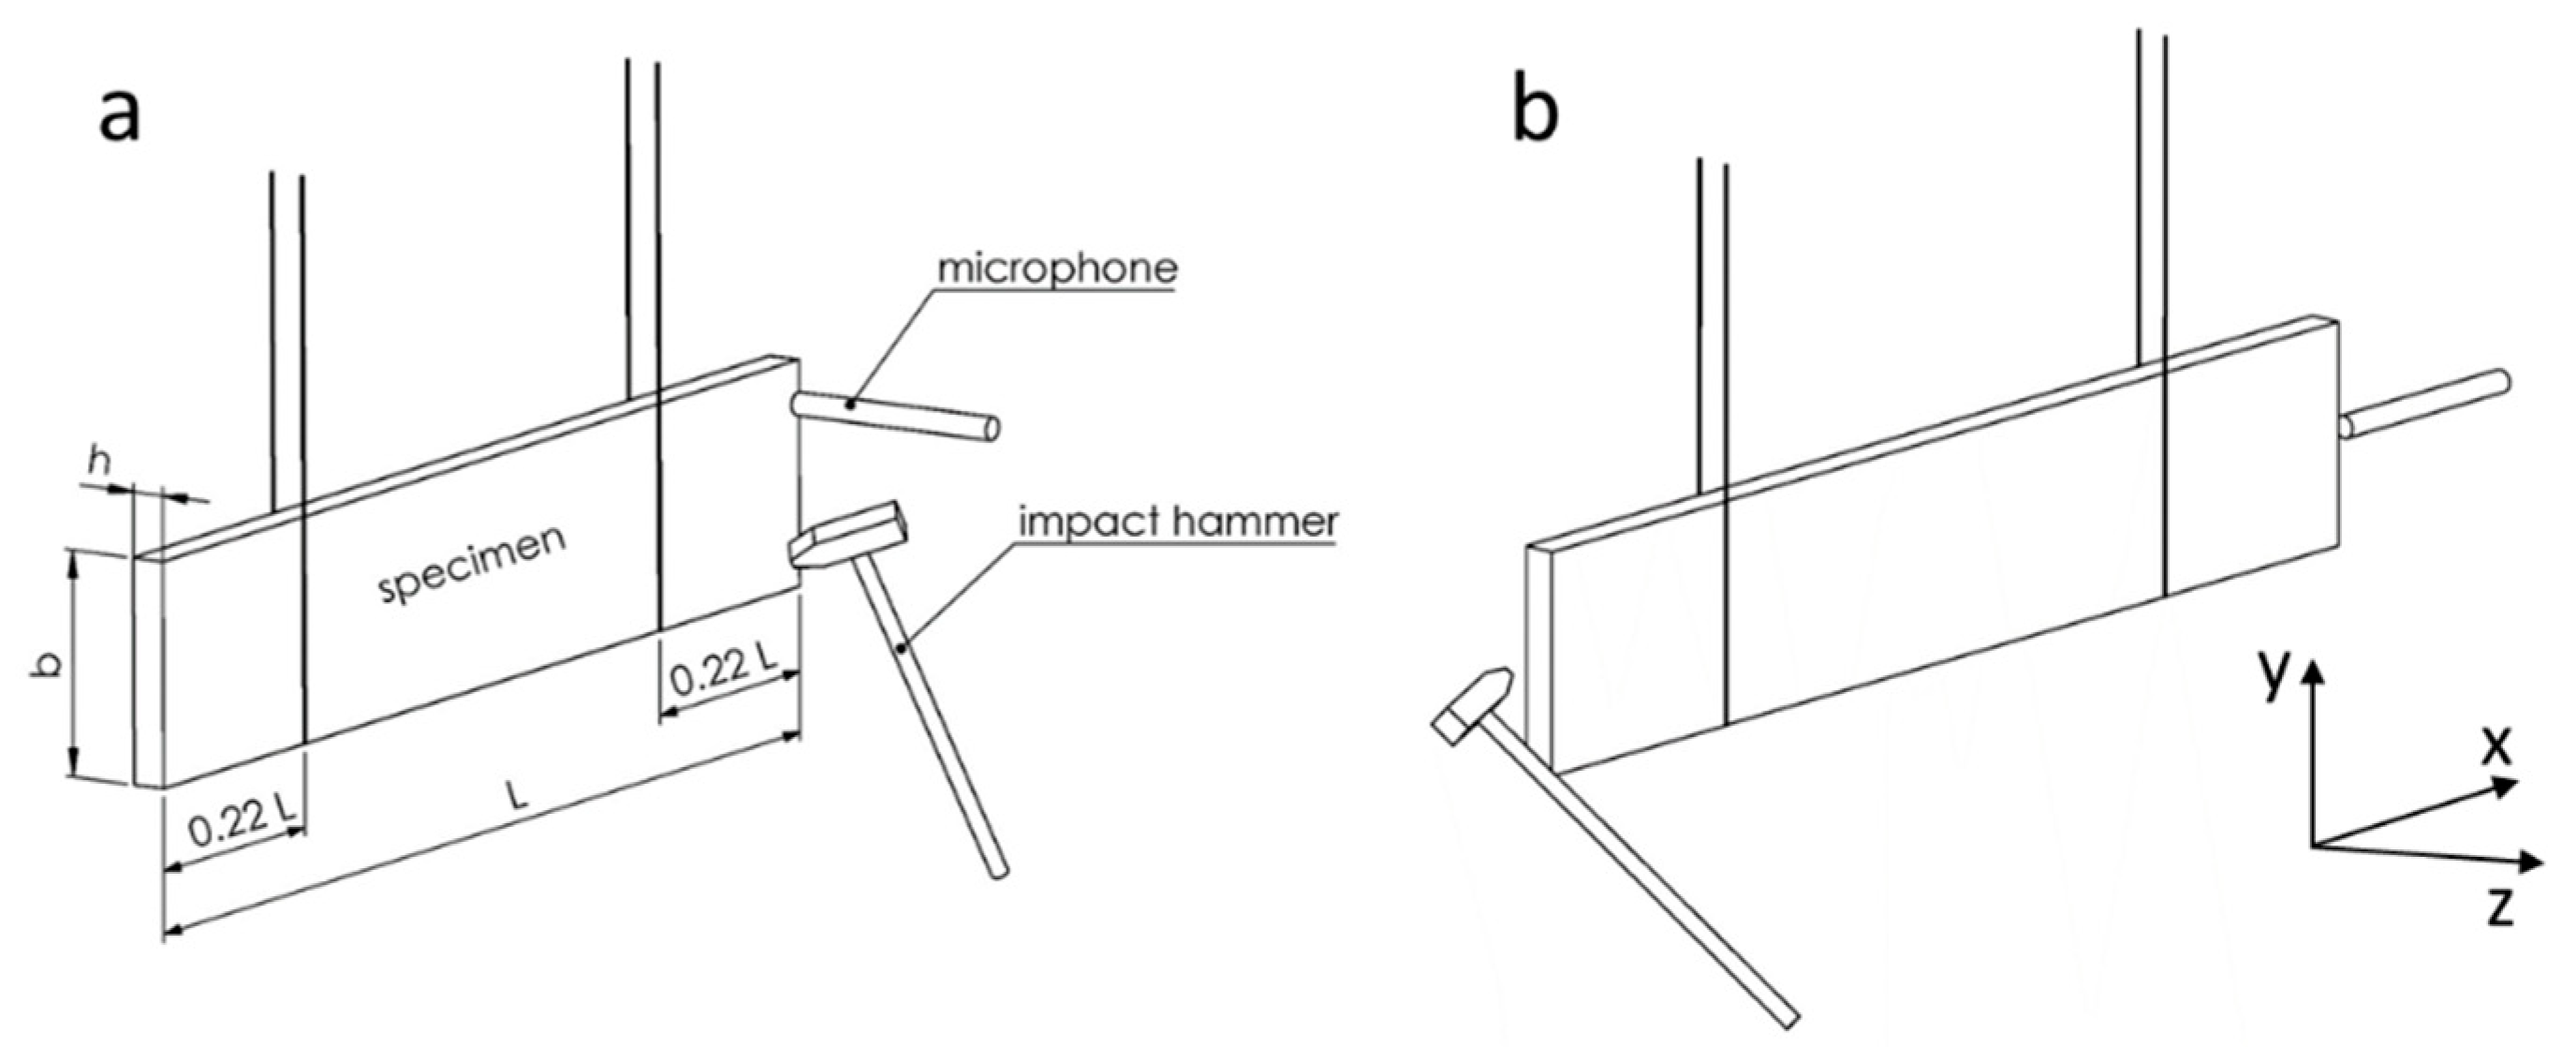
2.2.1. Determination of Elastic Properties of Beech Veneer in Principal (L—Longitudinal, T—Tangential, R—Radial) Directions by Flexural and Torsional Vibrations

From 11-layer boards (11E) with the same orientation of all veneer layers, 3 samples with dimensions 410 × 40 × 15.6 mm were cut in L × T × R direction and 3 samples were cut in T × L × R direction to determine the elastic and shear moduli in the principal tissue directions.
Since care was taken during the production of the boards to ensure that all veneers were oriented in the same direction and also had uniform mechanical properties, as they were made from a log with uniform annual growth, we assumed that 3 samples of the same veneer-orientation combination would be sufficient to determine the principal properties. In case of significant differences in the test results of the three samples, additional samples would be made from the boards.
The modulus of elasticity and shear modulus were determined from flexural and torsional frequencies of specimens with both ends free. Since the vibration amplitudes are the highest in the first flexural vibration mode, the specimen should be supported at the corresponding nodal lines, which are for the first flexural vibration mode at 0.22 and 0.78 L. To reduce the influence of the supports, the specimens were supported on elastic ropes in the lengths of 0.22 and 0.78 L and initially excited in the transverse direction by means of a hammer so that the specimens were subjected to flexural and torsional vibrations at their natural frequencies (Figure 3). Then, the samples were further excited in the longitudinal direction so that they vibrated in the longitudinal direction at their longitudinal natural frequencies.
The vibration of the samples was measured with a Bruel & Kjaer Type 4939 microphone, NI USB 6361 measurement card and LabVIEW software at a sampling rate of 100 kHz, with each measurement repeated 10 times. From each time signal, an FFT (Fast Fourier transformation) was performed and linearly averaged to obtain the averaged frequency spectrum from which the natural frequencies fn for different vibration modes were extracted.
From the measured flexural natural frequencies of 1 to 4 vibration modes, the out-of-plane (OP) modulus of elasticity in the longitudinal direction (EL), corresponding for the flexural stiffness, and the in-plane (IP) shear modulus (GLR) were determined from L × T × R (length × width × thickness) samples, while modulus of elasticity in the tangential direction (ET) and the shear modulus (GTR) were determined from T × L × R samples, using the Timoshenko equation [34]
E x I 4 z x 4 + ρ S 2 z t 2 ρ I ( 1 + s E x G xz ) 4 z x 2 t 2 + ρ 2 I s G xz 4 z t 4 = 0
where Ex and Gxz are the modulus of elasticity and shear modulus, in x-z direction of the sample coordinate system according to Figure 3, respectively; z is transverse displacement; I, S and ρ are moment of inertia, cross-sectional area and material density of the beam, respectively. s is the shear factor, which depends on the geometry of cross-section and the material properties, where the value of 1.2 was used in this case.
The modulus of elasticity and the shear modulus were calculated by the linear regression of the equation [30,45]
E x ρ s   E x G x z [ Q f   F 2 ( m ) 4   π 2 S   L 4   f i 2 I   P n ] = 4 π 2 S   L 4   f i 2 I   P n [ 1 + Q f   F 1 ( m ) ] Q f = I S   L 2 F 1 ( m ) = θ 2 ( m ) + 6   θ ( m ) F 2 ( m ) = θ 2 ( m ) 2   θ ( m ) θ ( m ) = m   tan ( m ) tan h ( m ) tan ( m ) tan h ( m ) m = P i 4 = ( 2   i + 1 ) π 2 ,   i N
fi is the ith flexural natural frequency, and parameters m, F1(m) and F2(m) are calculated based on index i for the ith natural frequency.
The out-of-plane (OP) shear modulus Gxy (GLT), corresponding for out-of-plane torsional vibration, was calculated from an L × T × R sample with a rectangular cross-section with the length, width and thickness of L, b and h, respectively, according to the following equation [46,47,48]
G xy = 4 f t , j 2 J t L 2 ρ K t j 2 , j = 1 , 2 , 3
J t = b h 12 ( b 2 + h 2 )
K t = b h 3 3 ( 1 192 h π 5 b G xy G xz i = 0 tan h [ b G xz G xy ( 2 i + 1 ) π 2 h ] ( 2 i + 1 ) 5 )
ft,j is the jth torsional frequency, ρ specimen density and Gxz in-plane shear modulus. Since the shear modulus Gxy is already involved in the calculation of Kt (Equation (5)), the approximate shear modulus from the literature can be used to calculate Kt the first time. The result is then used in Equation (3) to calculate the provisional value of Gxy, which is then used again in Equation (5). The procedure is repeated until Gxy converges to a constant value. Usually 5 to 10 iterations are required to obtain the converged value of Gxy. Equation (5) also needs the shear modulus Gxz (GLR), which is determined from flexural vibrations (Equation (2)).
The in-plane (IP) modulus of elasticity in the x direction (EL), corresponding to in-plane longitudinal stiffness, was also determined from the first natural frequency of longitudinal vibration using the equation [33]
E x = 4 ρ f x , j 2 L 2 j 2 , j = 1 , 2 , 3
where f x , j is jth natural frequency, and ρ and L are specimen density and length, respectively.

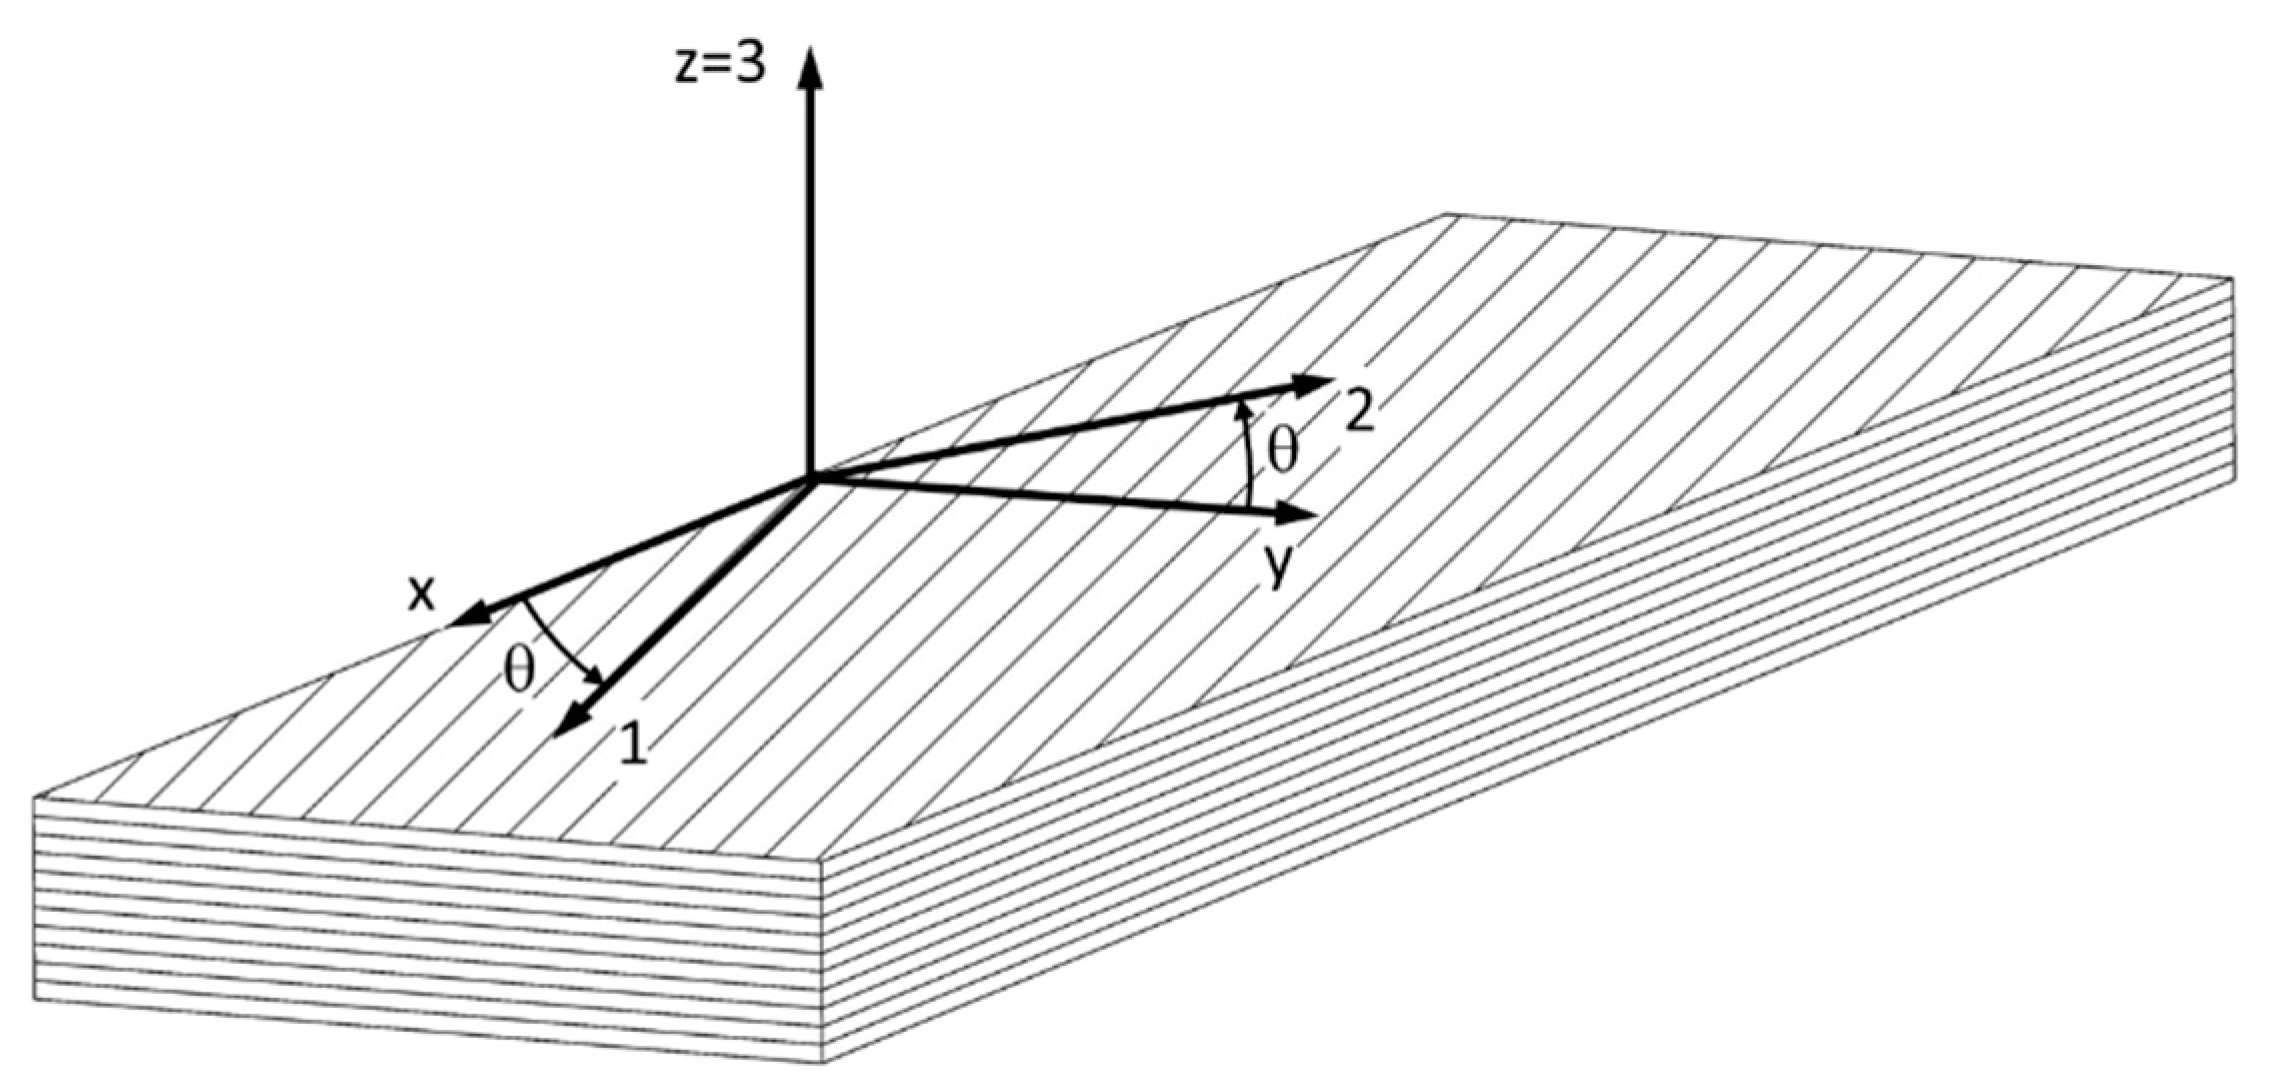
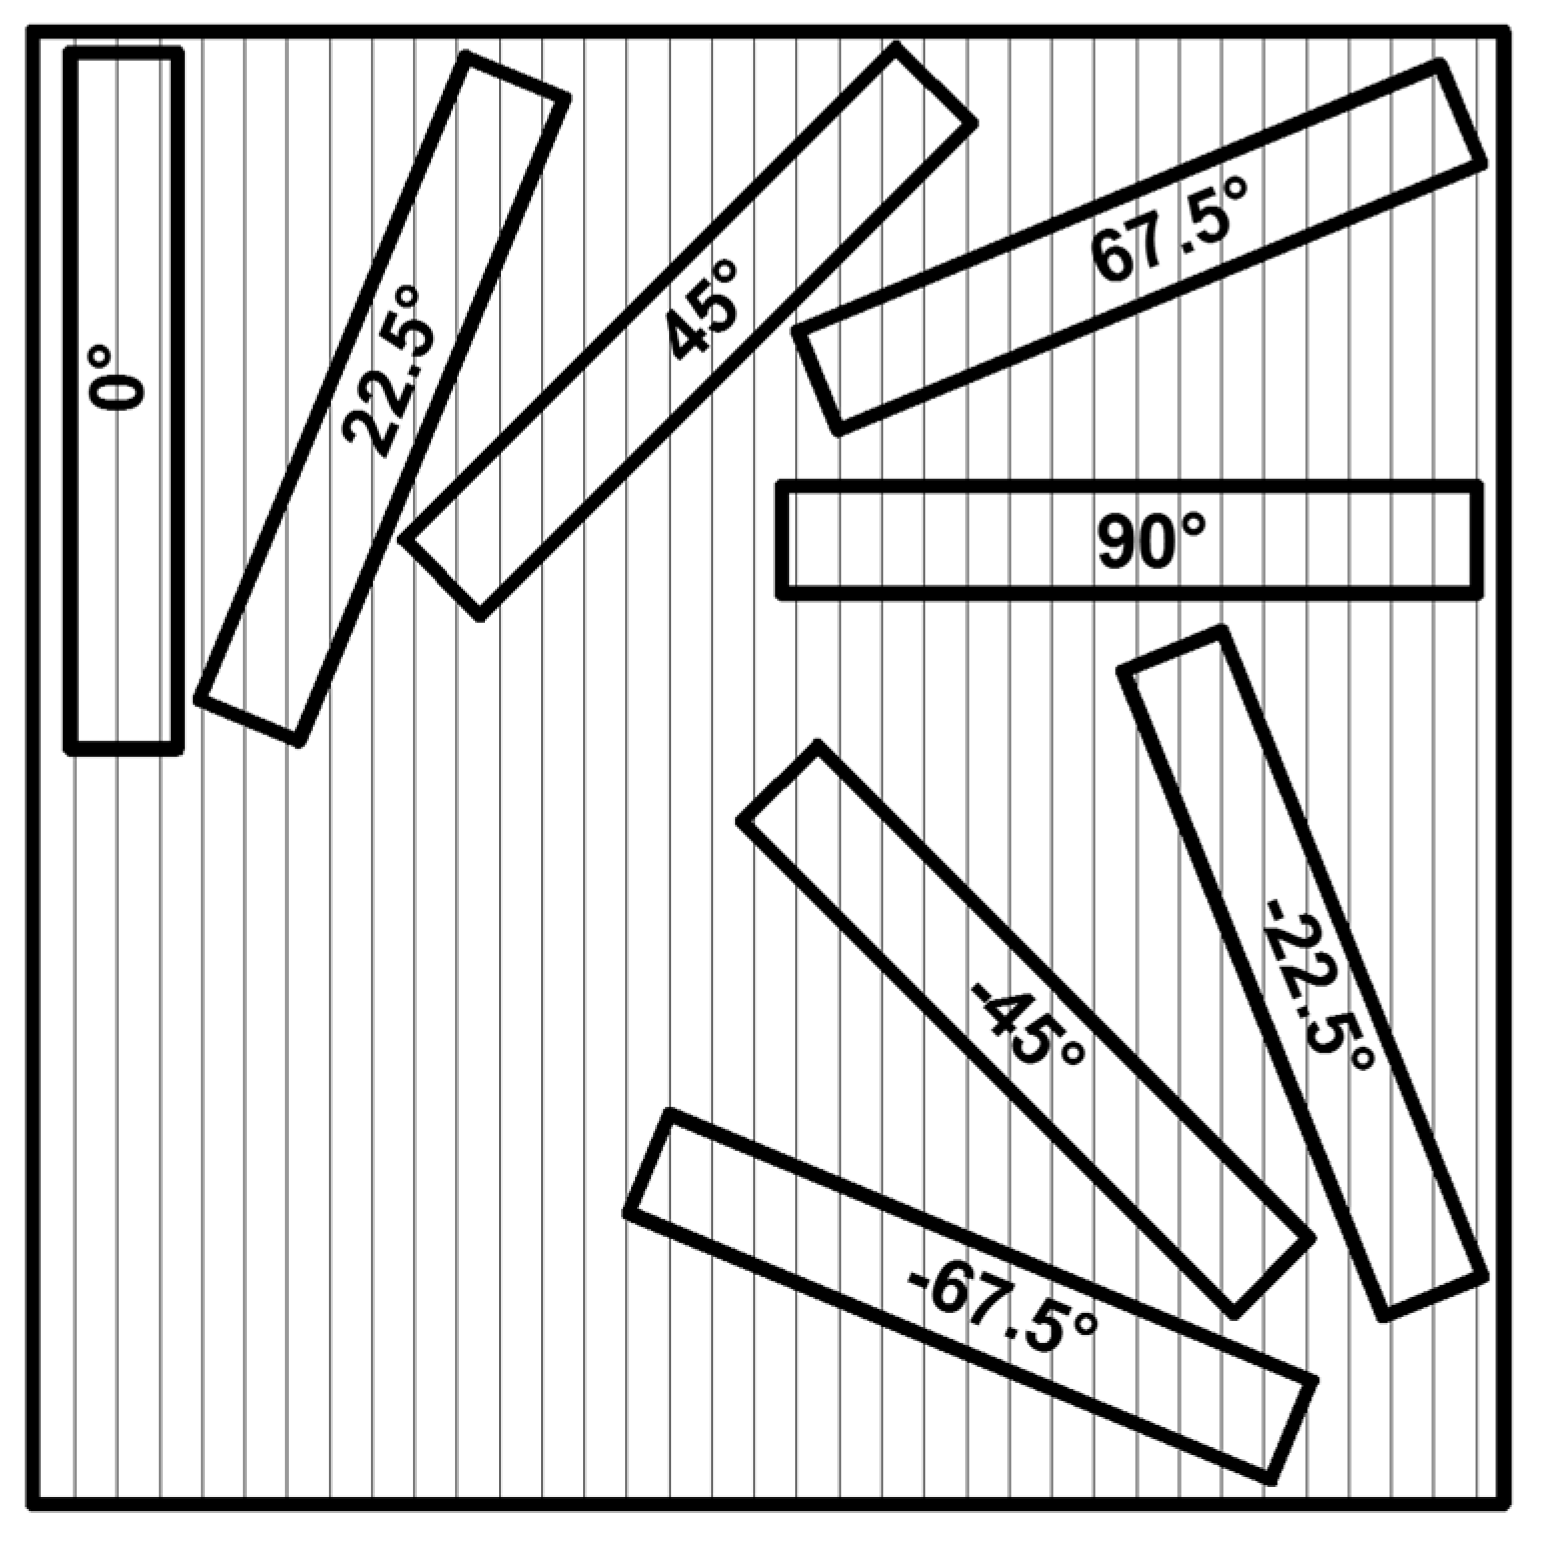
2.2.2. Determination of Effective Elastic Properties in x and y Directions from Specimens with Different Tissue Orientation of Individual Layers

From boards with different tissue orientations of individual veneer layers, 40 mm-wide and 270 mm- and 410 mm-long samples were cut from the boards for the 7- and 11-layer boards, respectively. The samples from the 7A and 11A plates were cut at an angle difference of 22.5°, namely 0°, 22.5°, 45°, 67.5°, 90°, −22.5°, −45° and −67.5°, and the samples from the 7P and 11P plates were cut only at the angles of 0°, 22.5°, 45°, 67.5° and 90° due to symmetry, as shown in Figure 4. Since the boards were made of veneers with similar well-defined mechanical properties, it was decided to initially produce only four samples for each combination of tissue orientation. In case of a significant difference in the test results of the four samples, additional samples were to be produced from the boards as would be necessary in the case of commercially purchased plywood, where the individual veneers have different, unknown mechanical properties and generally lower quality veneers are used in the middle layers of the plywood.
As in the case of the specimens with the same tissue orientation of all layers, the specimens were freely supported on elastic ropes in lengths of 0.22 and 0.78 L and excited in the transverse direction with a hammer, so that the specimens were subjected to flexural and torsional vibrations at their natural frequencies (Figure 3). The samples were then further excited in the longitudinal direction so that they vibrated in the longitudinal direction at their natural longitudinal frequencies. Elastic properties of each sample were then determined using Equations (2)–(6).
Since the properties in the x-direction vary from layer to layer, the constant value of 1.2 for the shear factor s in Equation (2) is not valid, since it can deviate significantly from the value of 1.2 [29,49] and a new shear factor was then calculated for each combination of layers using the equation [50]
s = A G x z ,   e f f   J s b ( i = 1 n E x , i I i ) 2
where S is the cross-section of the sample, b is the width, Gxz,eff is the effective shear modulus of the whole sample, Ex,i is the modulus of elasticity of the ith veneer layer in the x direction, and Ii is the moment of inertia of the ith veneer layer, while Js can be written
J s = h / 2 h / 2 1 G x z , i ( j = 0 k + 1 E x , j   y j d S ) 2 d y ,   j = 0 , 1 , 2 , , n 1
Gxz,i is the shear modulus of the ith layer, n is the total number of layers of the sample, and   y j d S is the static moment of area for the jth layer.
Gxz,eff can be calculated using equation [51]
1 G x z , e f f = 1 h i = 1 n h i G x z , i
where for Gxz,i and Ex,i calculations, Equation (A8) (Appendix A) can be used
G x z , i = 1 sin 2 ( θ ) G TR + cos 2 ( θ ) G LR
E x , i = 1 sin 2 ( θ ) ( 4 cos 2 ( θ ) G LT 2 ν 12 cos 2 ( θ ) E T + sin 2 ( θ ) E T ) + cos 4 ( θ ) E L
h and hi are the total thickness of plywood and thickness of ith layer, respectively.
Since it was assumed that the modulus of elasticity, the shear modulus and Poisson’s ratios in the principal directions were not known prior to determination of the elastic properties of plywood, literature data were used to calculate the shear factor as shown in Table 2 [31].

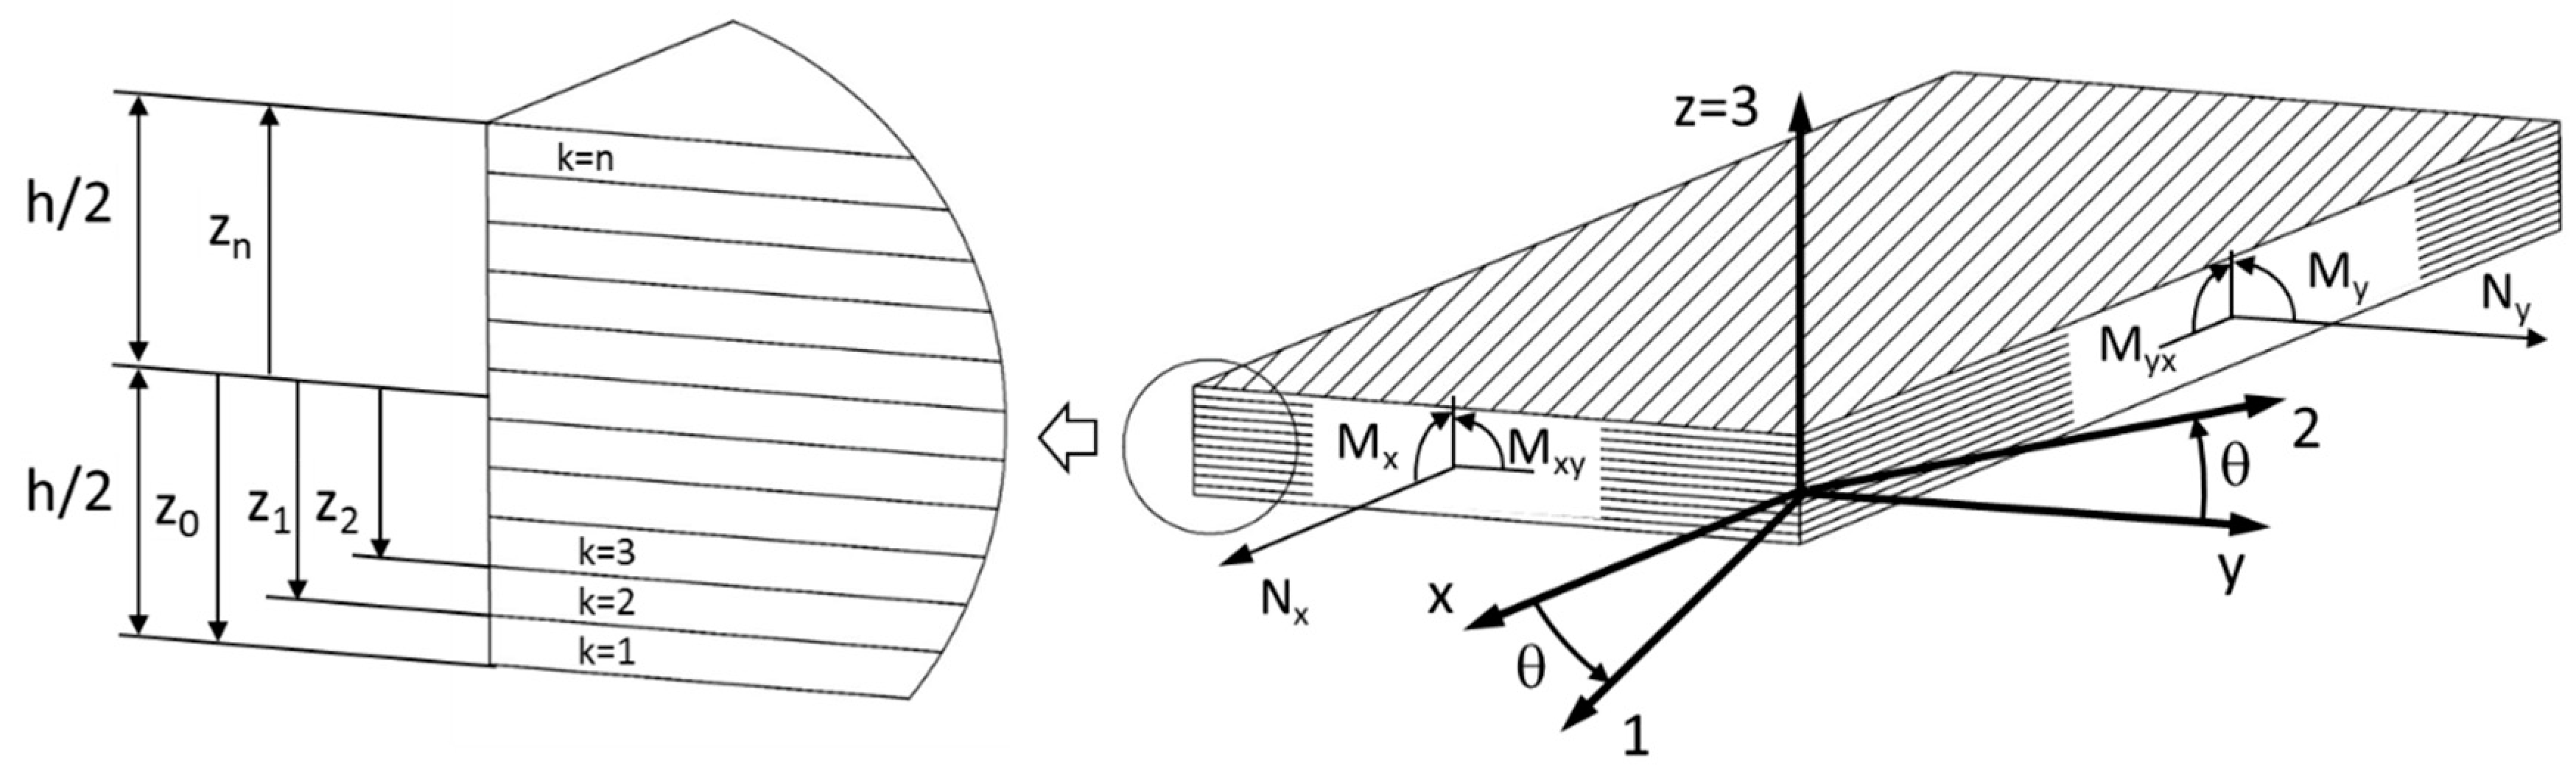
2.2.3. Determination of Effective Elastic Properties Using Laminate Theory

Samples with different tissue orientations of individual layers, for which the effective elastic properties were determined experimentally on the basis of flexural, torsional and longitudinal vibration, were also determined analytically using laminate theory. The effective out-of-plane (OP) laminate modulus of elasticity and out-of-plane shear modulus in x-y direction can be calculated using the following equation [37,38]
E x , O P , e f f = 1 d 11 * ; E y , O P , e f f = 1 d 22 * ; G x y , O P , e f f = 1 d 66 *
where constants d 11 * , d 22 * and d 66 * are elements of the matrix [D], explained in detail in Appendix A (Equation (A22)), and the effective in-plane (IP) modulus of elasticity in x and y directions as well shear modulus can be calculated by the following equation
E x , I P , e f f = 1 a 11 * ; E y , I P , e f f = 1 a 22 * ; G x y , I P , e f f = 1 a 66 *
where constants a 11 * , a 22 * and a 66 * are elements of the matrix [A], also explained in detail in Appendix A (Equation (A21)).

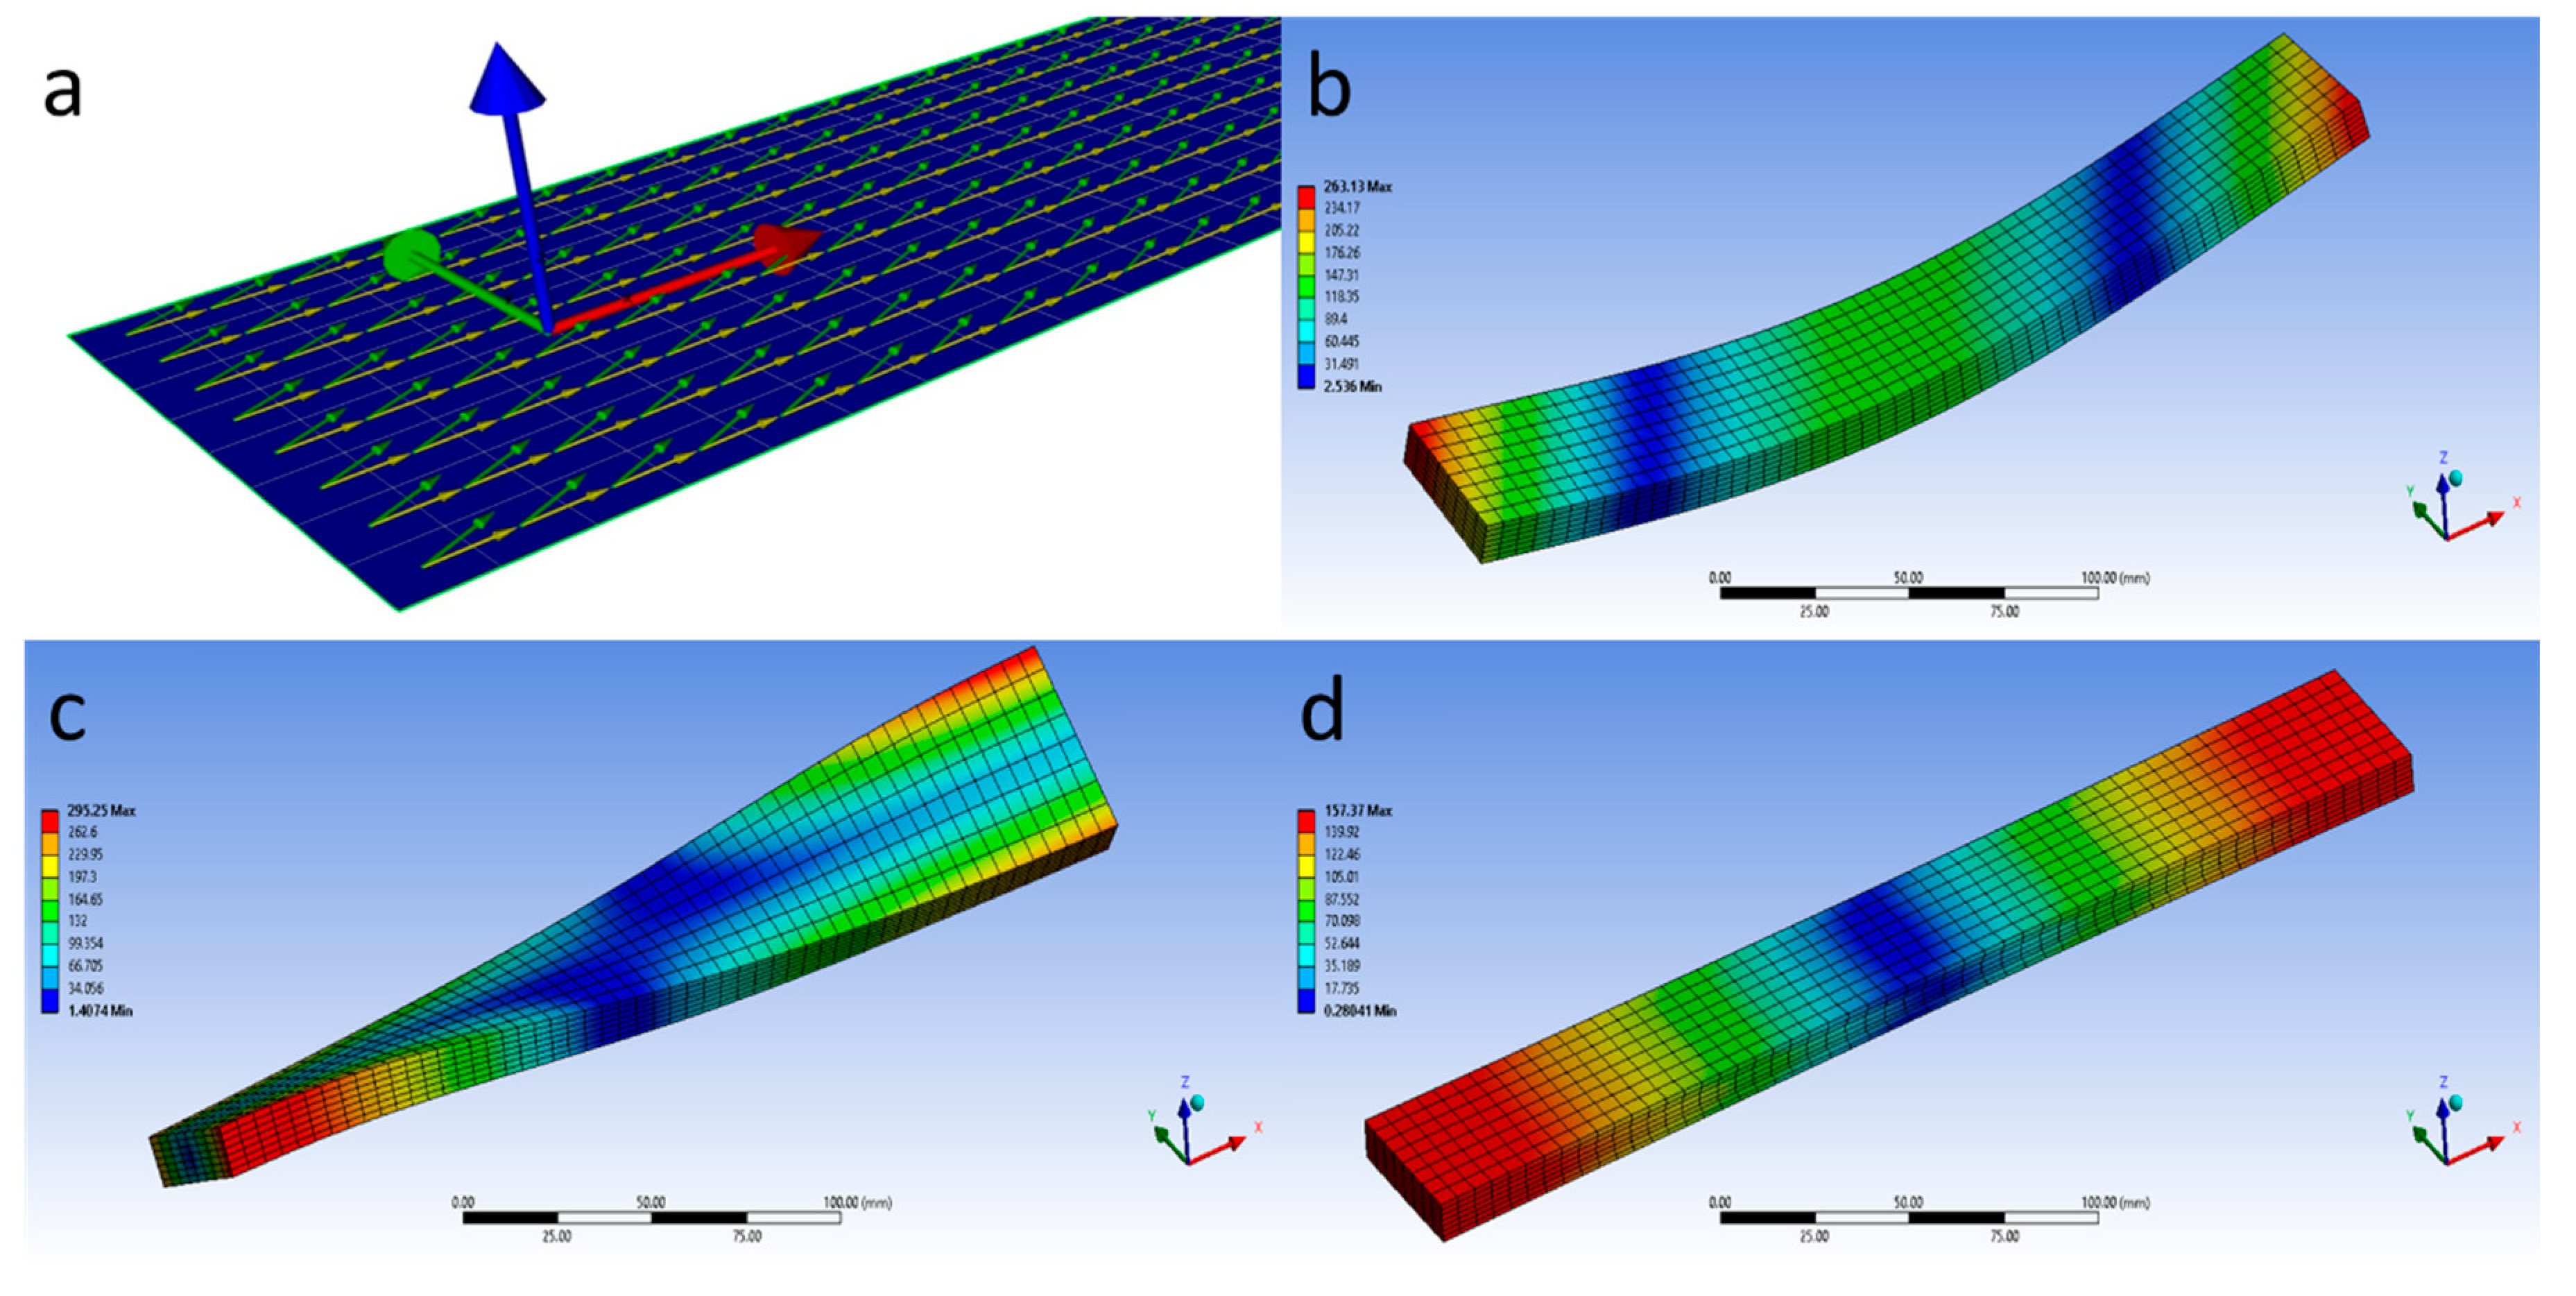
2.2.4. Modal Analysis Using the Finite Element Method

In the fourth part of the experiment, all samples were modelled with the finite element method as composite material with 7 and 11 layers using the Composite module of Ansys software where the materials properties were taken from first part of the experiment. The length of the samples was 410 and 270 mm for 11- and 7-layer samples respectively, the width of the samples was 40 mm and the thickness of each layer was 1.42 mm. The size of the element in x- and y-direction of the sample was 5 mm, while in z-direction the size was equal to the layer thickness, i.e., 1.42 mm. A test with a smaller element dimension was also carried out, but the results were the same as the given dimension. The flexural natural frequencies for 1–4 mode, the torsional frequency for the first mode and the first natural frequency for the longitudinal mode were calculated by modal analysis and then compared to the measured natural frequencies.

3. Results and Discussion

The average density of all samples was 755.3 kg/m3 with a standard deviation of 12.9 kg/m3. Since the standard deviation is small, the same density was considered for all samples.
Figure 5a shows an averaged frequency spectrum of the flexural vibration of the 11-layer sample with a tissue orientation of the top layer of −45°, where the peaks for the first four flexural vibration frequencies and the first torsional frequency at transverse excitation of the sample are visible. The flexural frequencies have very high peaks, while the torsional vibration frequency is less pronounced and increases when the sample is excited at the corner. For the same specimen, the longitudinal vibration spectrum is shown in Figure 5b, where two distinct peaks belonging to the first and second mode of the longitudinal vibration are clearly visible. Only the first longitudinal natural frequency of the vibration was used to calculate the effective in-plane modulus of elasticity in the x direction.

3.1. Elastic Properties in Principal Material Directions in Specimens with the Same Layer Orientation

Table 3 shows the mechanical properties determined from the flexural, torsional and longitudinal natural frequencies together with the coefficient of variation. The modulus of elasticity differs very little between individual specimens, as do the shear moduli. Likewise, the mean principal out-of-plane modulus of elasticity from flexural vibration differs from the in-plane modulus of elasticity from longitudinal vibrations in the L and T directions by only 3.5 and 2.5%, respectively, and it is comparable to values from the literature [52,53,54,55]. Due to the small differences, it was decided that three samples are sufficient for determination of the basic mechanical properties in the main tissue directions (L, T, R), therefore the number of samples was not increased.

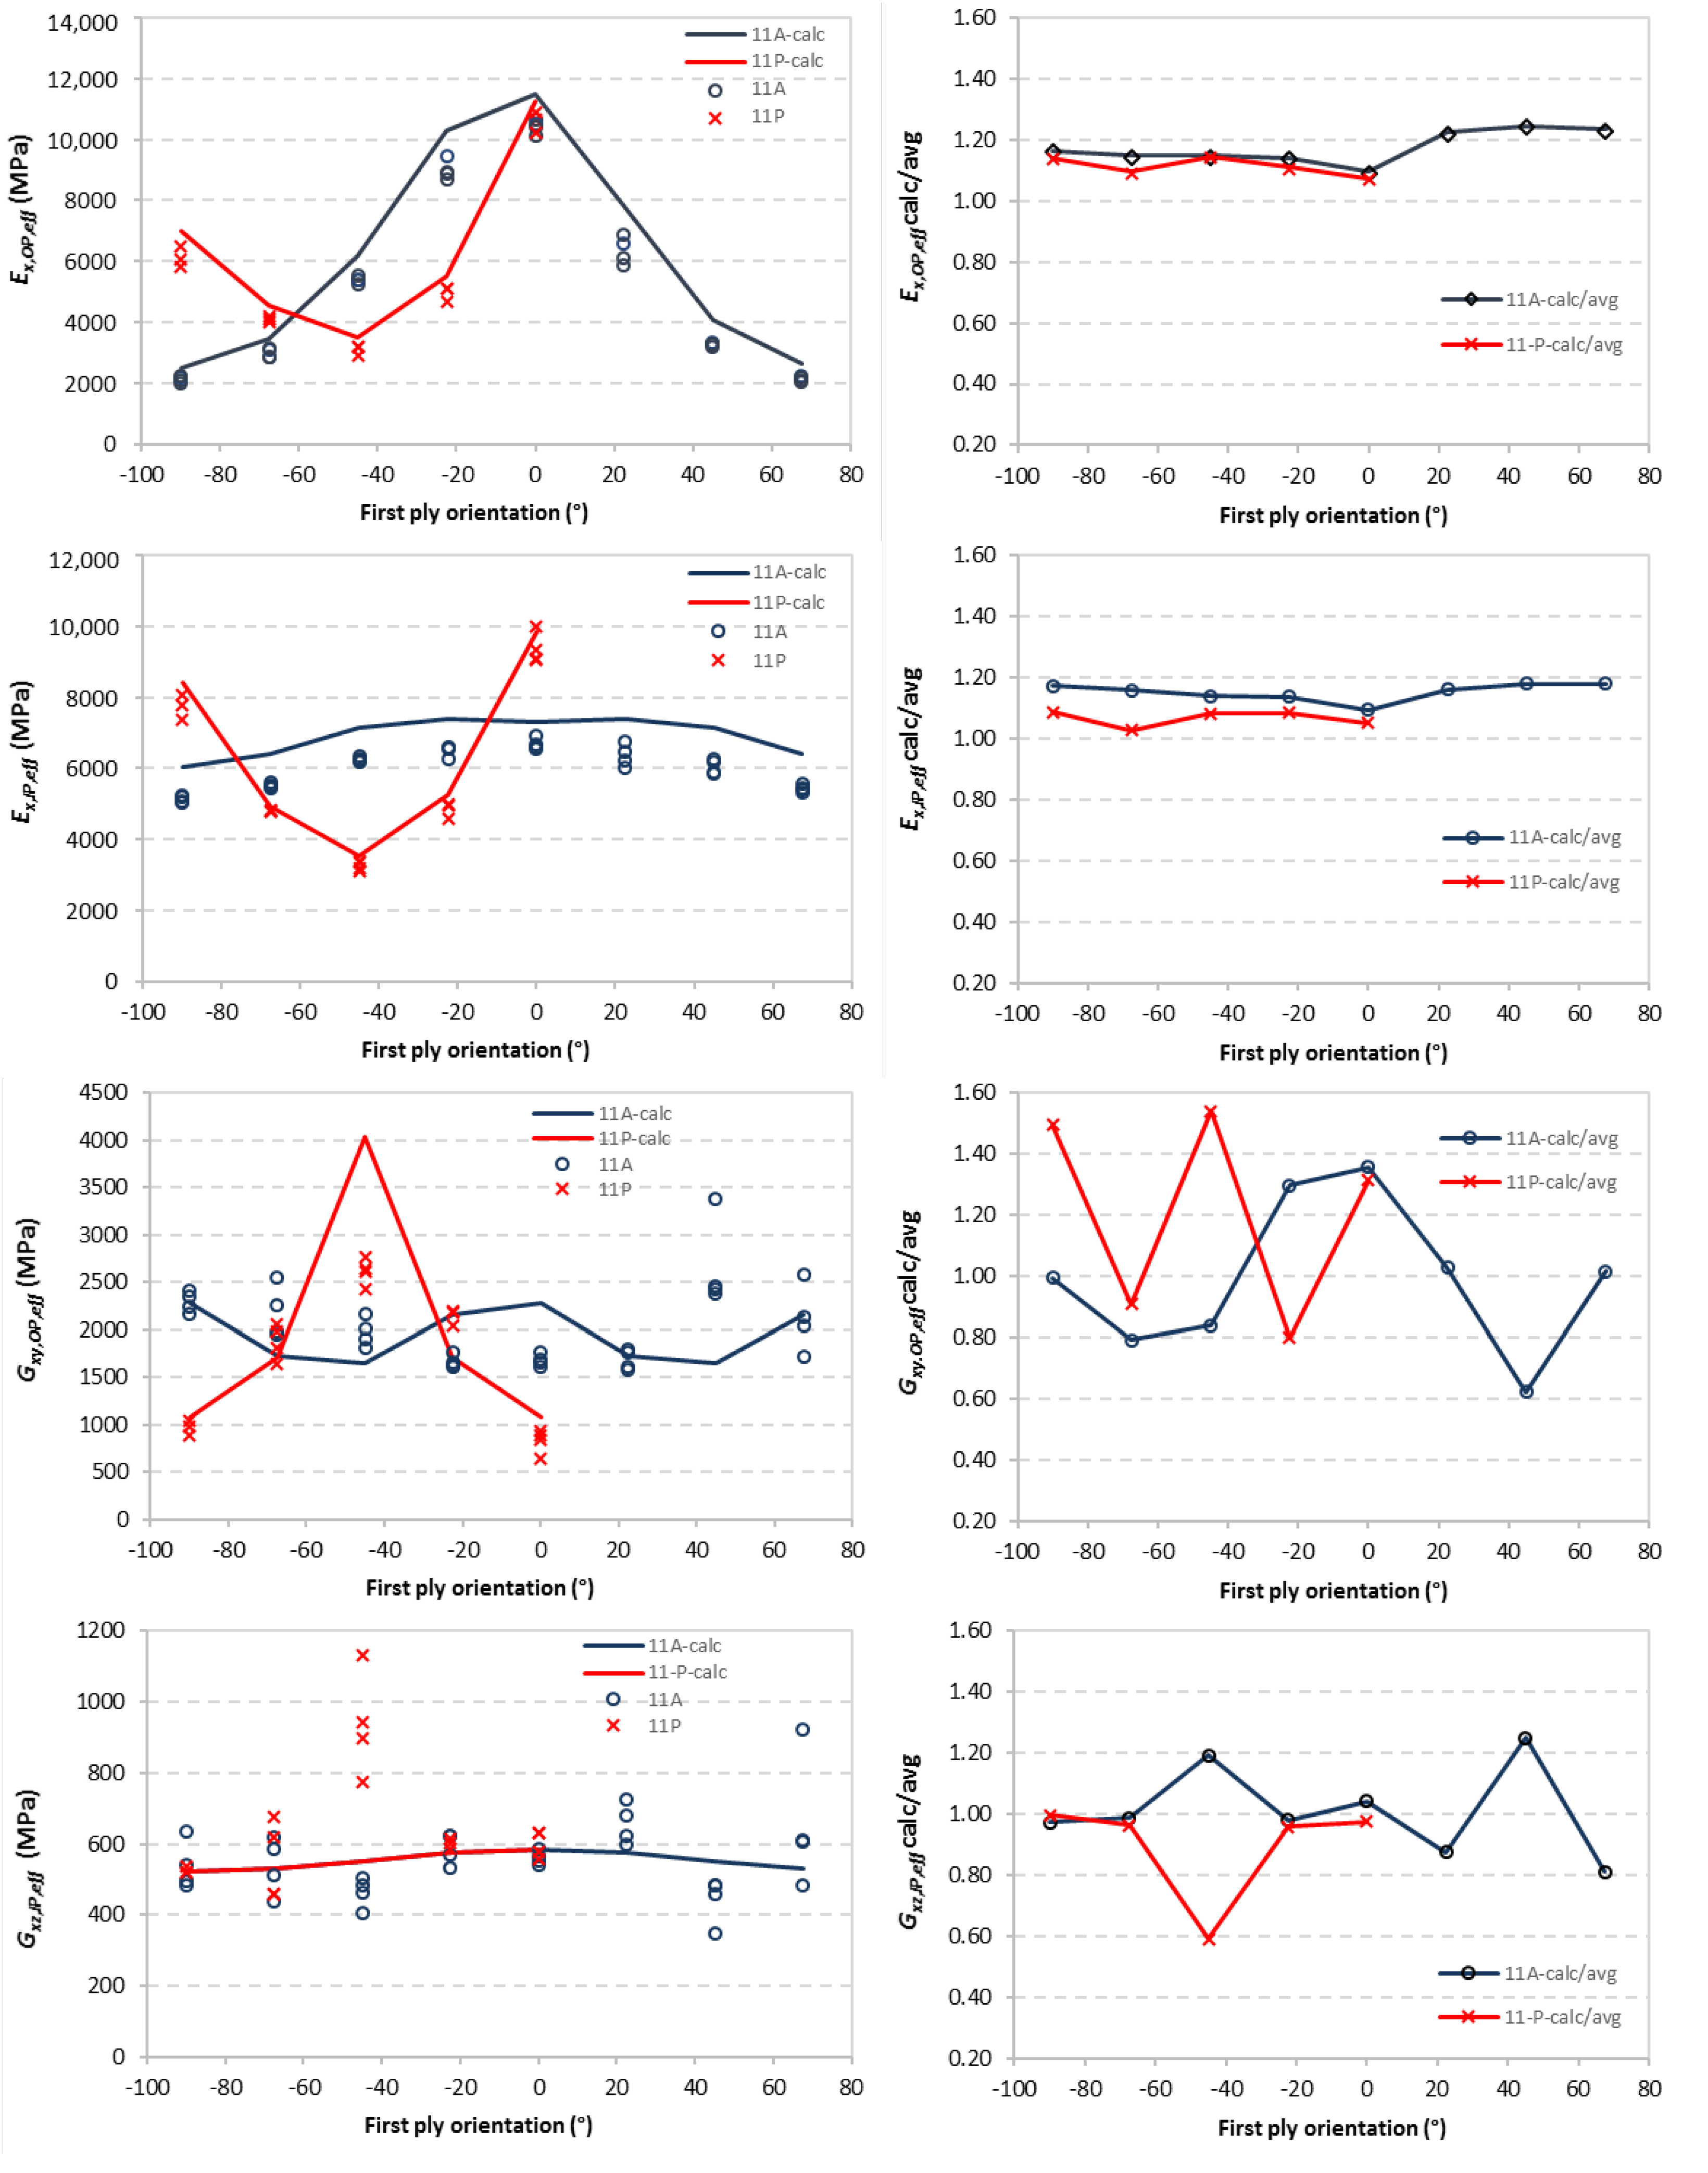
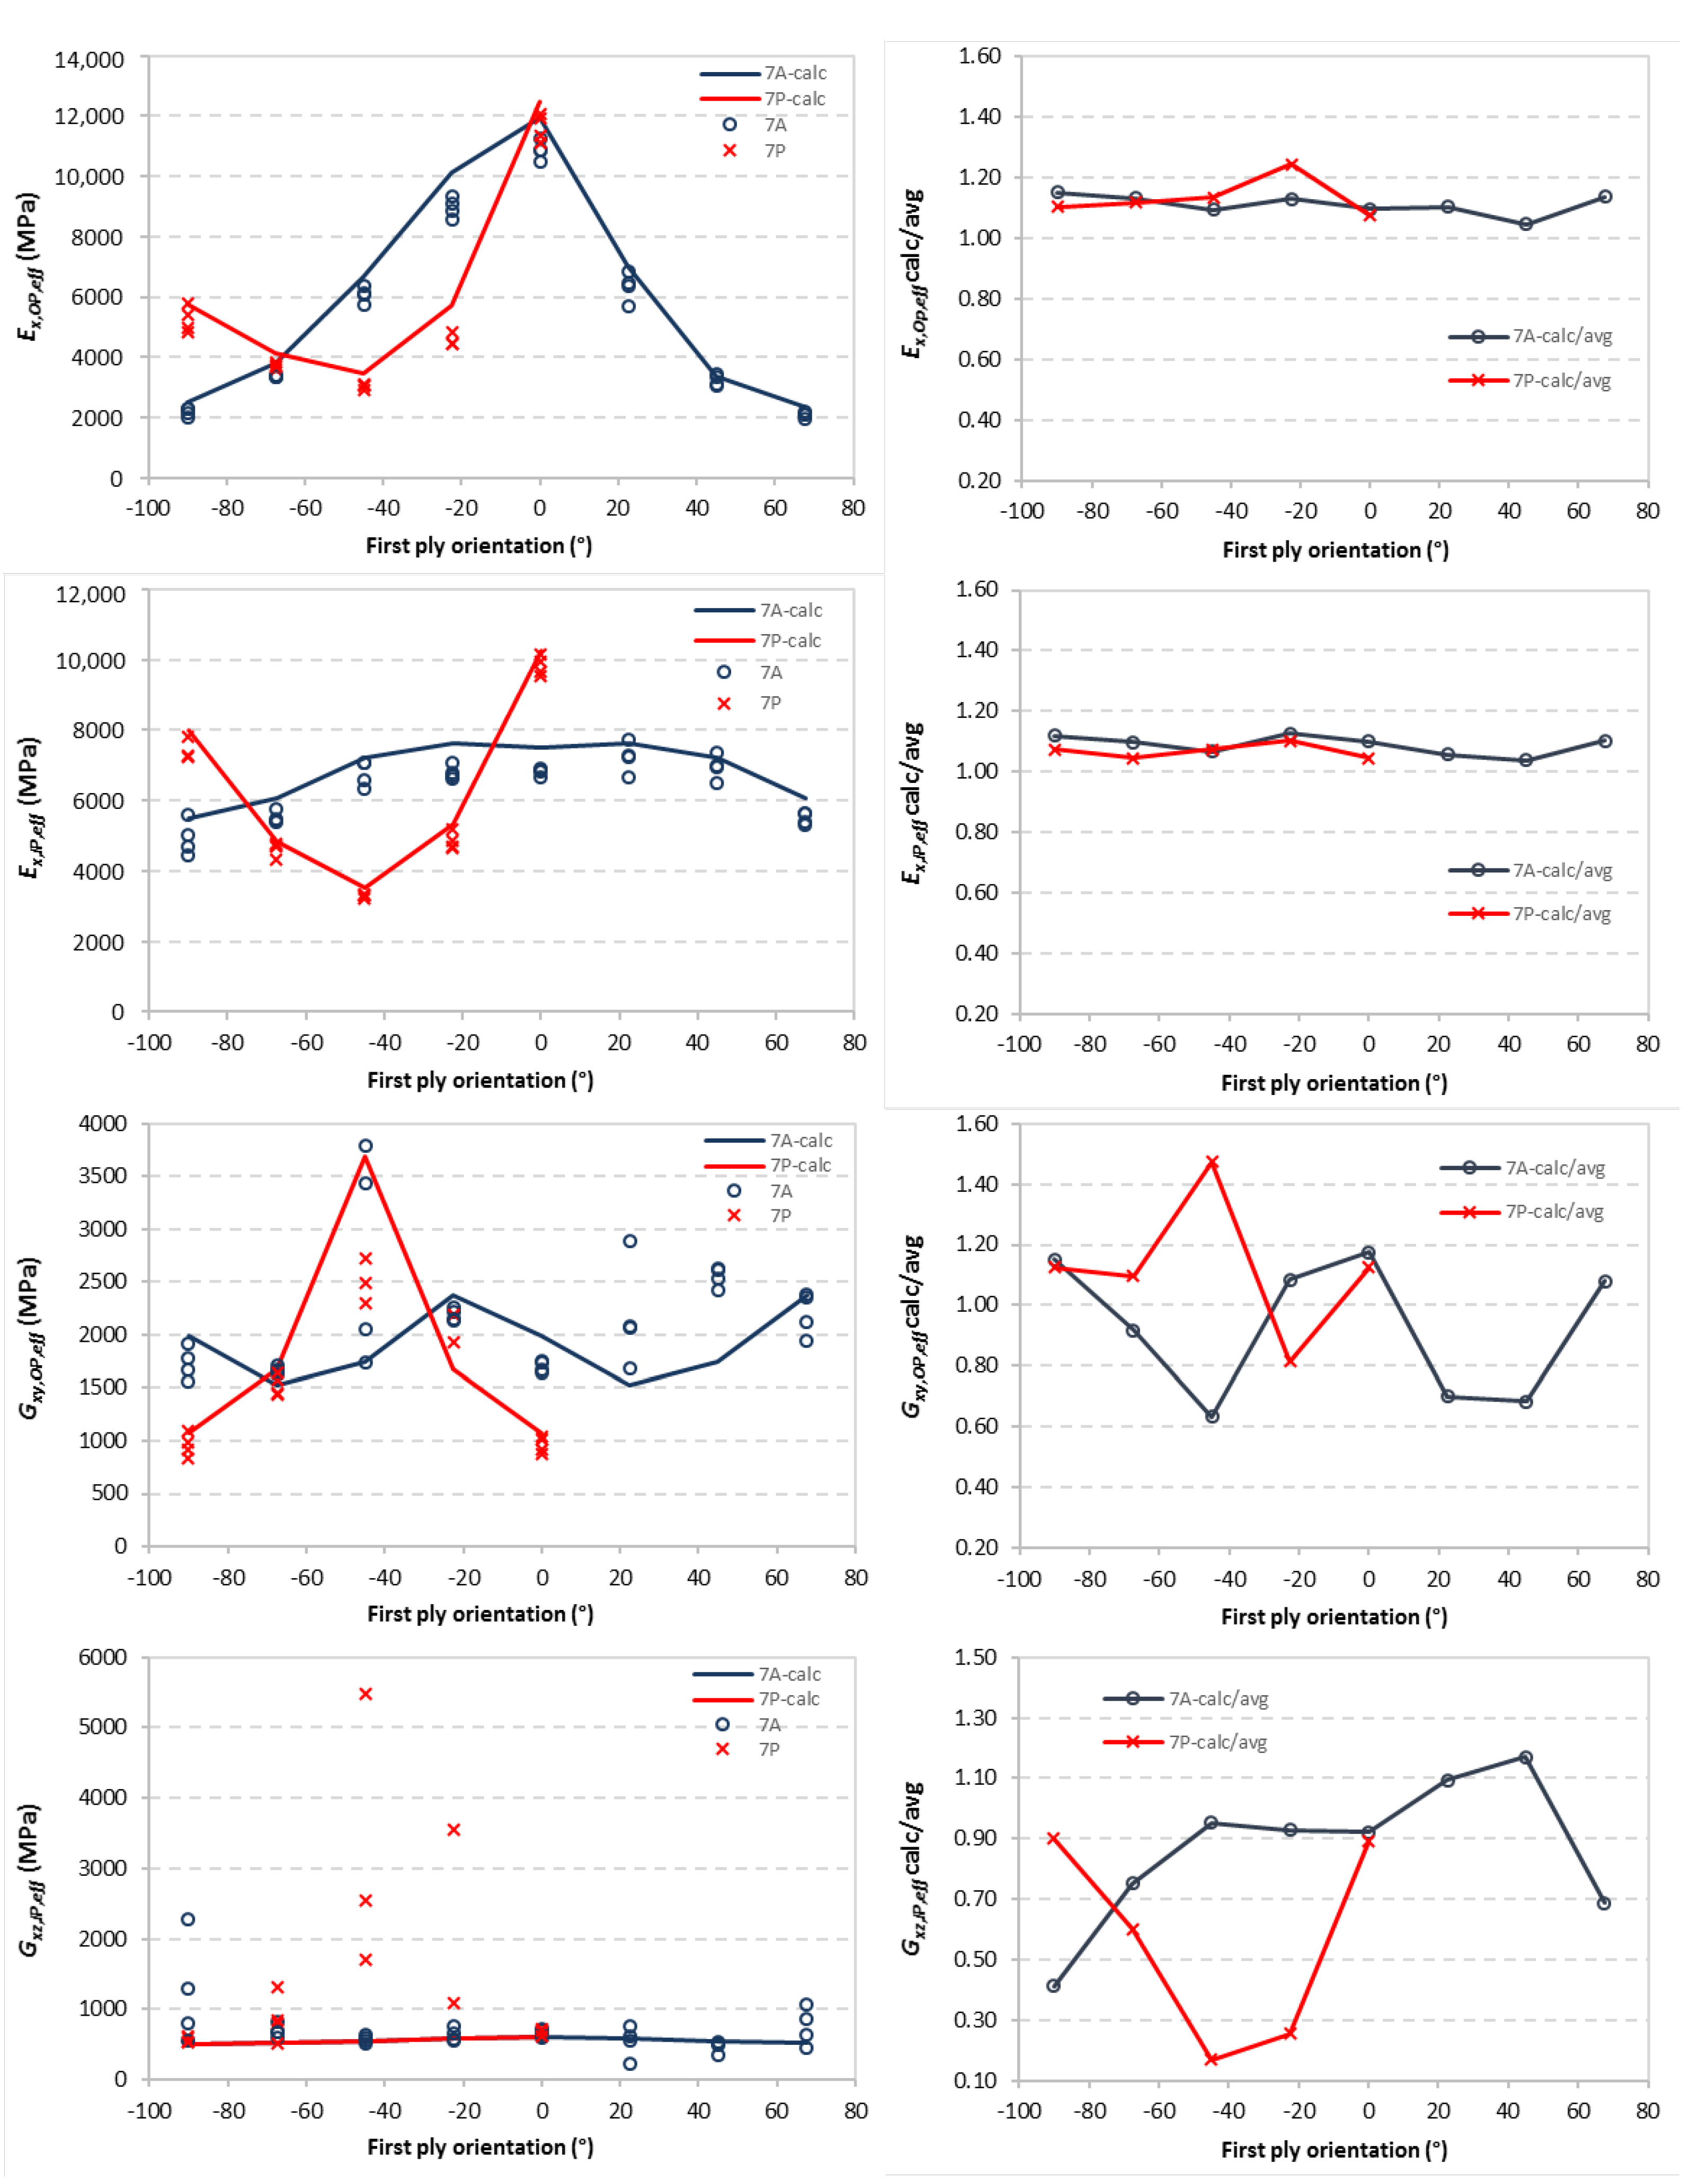
3.2. Effective Elastic Properties in Specimen with Various Layer Orientations

Figure 6 and Figure 7 show the calculated effective modulus of elasticity and shear modulus together with the measured values of individual samples for 11- and 7-layer samples. The measured values of the Young’s modulus do not differ significantly between individual specimens with the same combinations of tissue orientations both in in-plane and out-of-plane values. This confirms our assumption that four specimens are sufficient for any combination of tissue orientations, since all veneers have the same elastic properties that we have measured.
The effective out-of-plane modulus of elasticity (Ex,OP,eff) is greatest in the orientation of the tissue of the outer layer of 0°, as it contributes most to the stiffness due to the longitudinal modulus of elasticity (EL) of the wood tissue, while inwardly the influence of the layers decreases. However, the situation is different with the effective in-plane modulus of elasticity in x direction, where all layers have the same effect.
The effective theoretical values calculated using the laminate theory are, in all cases, greater than the measured moduli, i.e., the ratio between the calculated and the average measured value is between 1.03 and 1.25, or the average values are 1.15 and 1.12 for the out-of-plane and in-plane modulus of elasticity of 11-ply samples, respectively, and 1.12 and 1.08 for 7-ply samples, respectively. The latter means that when dimensioning the plate, it must be considered that the calculated effective values will be, on average, 8 to 15% higher than the actual values.
The situation is different for the effective shear moduli, where the measured shear moduli between samples with the same combinations scatter very little in some cases, and in other cases very much. The reason for this is that for certain combinations of tissue orientation, it was difficult to determine the correct flexural and torsional frequency because they differed very little and it was not entirely clear which belonged to the flexural mode and which was for the torsional mode. In some cases, it was also very difficult to induce torsional vibration. This leads to an error in the calculation of both the Gxz and Gxy shear modulus. In some combinations of layer orientations, where the ratio of Ex,OP,eff/Gxz,IP,eff is small, the accuracy of the determination of Gxz,IP,eff is also lower [29,30,46] which consequently produces a lower accuracy of Gxy,OP,eff. This is the case of the first ply orientation of −45° for 11-layer samples of P-type plates, where the average out-of-plane modulus of elasticity amounts 3059 MPa and the average in-plane shear modulus 937 MPa. In this case the ratio is only 3.26, and the accuracy of determined Gxz,IP,eff is very low, which is seen as high scatter in Figure 6. However, in cases where the frequencies were clearly identifiable and the ratio between elasticity and shear modulus was correspondingly high, such as in the case of the first ply orientation of 0°, where the average out-of-plane modulus of elasticity amounts to 10,500 MPa and the average in-plane shear modulus is 600 MPa, the ratio increases to 17.5, and correspondingly also increases the accuracy of the determined shear modulus.
The calculated effective shear moduli are comparable to the measured moduli and are slightly higher in some places and slightly lower in others. The ratios between the calculated and average measured values for the 11-layer plate vary between 0.59 and 1.25 for Gxz,IP,eff and between 0.62 and 1.54 for Gxy,OP,eff and are on average 1.07 and 0.94 for Gxy,OP,eff and Gxz,IP,eff, respectively. Similarly, the ratios for 7-layer plates vary between 0.63 and 1.47 for Gxz,OP,eff and between 0.17 and 1.17 for Gxy,OP,eff, or, on average, 0.97 and 0.76 for Gxy,OP,eff and Gxz,IP,eff, respectively. The high variation of ratios in some tissue orientations can be explained by the fact that at lower values of the E/G ratio, the accuracy of the shear modulus determination is lower, as already explained.
Figure 8 shows the calculated shear factor s for specimens with various combinations of tissue orientation, considering the modulus of elasticity, shear modulus and Poisson values from the literature. The figure shows that the shear factor is in the range of 0.9 to 1.65, which means that if the variability of the cross-sectional composition is not considered, a large error can be made. In our case, the shear factor was also calculated with the measured data, but the difference between the value calculated from literature data and the value calculated from measurement data for a given sample was only a few percent. This confirms the assumption that in the absence of knowledge of the material properties required to determine the shear factor, values from the literature can be used. This results in an error of only a few percent, which is significantly smaller than in the case of using a constant value of 1.2.
Figure 9 shows a composite finite element model of the 7A sample with the first layer orientation of 22.5°, together with the relative deformation of the first flexural, torsional and longitudinal modes obtained by modal analysis using the Ansys software. The image clearly shows non-uniform flexural and longitudinal vibrations as a result of the tissue orientation. The flexural vibration image shows that the nodal line is not perpendicular to the long edge, which can lead to certain problems if perpendicular nodal lines are assumed, and specimen is perpendicularly supported at 0.22 and 0.78 L.
Table 4 shows the average measured and calculated natural frequencies using the finite element method with the Ansys software for vibration mode 1–4 of the flexural vibration and the first mode of the torsional and longitudinal vibration. The table shows that the frequencies of the 11-layer sample with the same tissue orientations (11E-0° and 11E-90°) are in very good agreement between the measured and calculated values for the flexural as well as for the longitudinal and torsional vibration.
However, the difference is somewhat greater for different combinations of tissue orientations of individual layers, where the values calculated using the finite element method are somewhat higher. The reason for this is that the Ansys program calculates a slightly higher effective modulus of elasticity and shear modulus, similar to the calculation of effective values using laminate theory.

4. Conclusions

The research showed the application of the experimental determination of the modulus of elasticity and shear modulus from the natural frequencies of flexural, longitudinal and torsional vibrations of plywood samples with various combinations of the orientation of the individual layers. It has been shown that the method is particularly useful for slender and wide elements where it is possible to excite and accurately determine both flexural and torsional frequencies from which the modulus of elasticity and shear moduli can be calculated.
It was also found that the accuracy of the determination of the shear modulus is strongly dependent on the ratio of modulus of elasticity to shear modulus, since the ratios vary greatly for different combinations of tissue orientations of the individual layers. For example, the ratio varied in the experiment from a value of 3.26, where the accuracy of the shear modulus determined was very low, as evidenced by a high scatter of the individual values, to 17.5, where the accuracy of the modules was much higher and the scatter was negligible.
The research also confirmed that the laminate theory, which is already well established and widely used for composites of synthetic materials, can be used for modelling plywood in all tissue combinations. In this way, it is possible to determine the effective out-of-plane flexural and in-plane longitudinal modulus of elasticity, as well as in-plane and out-of-plane shear moduli. Research has shown that the calculated effective modulus of elasticity can be on average up to 15% higher than the actual one, which must be considered when using such composites in practice.
When applying the laminate theory to plywood, the weakness of the theory could be the lack of input data and also the variability of the data for a particular tree species, which must also be taken into account. As mentioned in the introduction, in the absence of precise material properties and taking into account the data from the literature and the fact that the variability of wood properties in the main directions can be up to several 10%, the calculated values can also vary accordingly.
The situation is similar for modal analysis using the finite element method, where the software calculates higher effective values and thus higher natural frequencies. So, it can be said that the applicability of the finite element method for planar elements is equal to the applicability of the laminate theory, but the applicability for spatial elements, where the classical analytical methods can hardly provide an accurate calculation, is greatly increased.

Funding

The research was supported by the Programs P2-0182, co-financed by the Slovenian Research Agency.

Acknowledgments

The author wish to thank Dominik Koderman for his help with sample preparation.

Conflicts of Interest

The author declares no conflict of interest.

Appendix A

The linear elastic stress–strain Hook’s law constitutive relationship can be written as [37,38]
σ ij = C ijkl ϵ kl
where Cijkl is a fourth-order tensor with 81 elastic constants, and the inverted form of Hooke’s law in the case of orthotropic material
ϵ i = S ij σ j
Coefficients Sij are called compliance coefficients which is the inverse of the stiffness matrix
S ij = C ij 1
The constitutive Equation (A2) for an orthotropic material can then be written in matrix form as
[ ϵ 1 ϵ 2 ϵ 3 γ 23 γ 13 γ 12 ] = [ S 11 S 12 S 13 0 0 0 S 12 S 22 S 23 0 0 0 S 13 S 23 S 33 0 0 0 0 0 0 S 44 0 0 0 0 0 0 S 55 0 0 0 0 0 0 S 66 ]   [ σ 1 σ 2 σ 3 τ 23 τ 13 τ 12 ]
where individual compliance coefficients in the terms of the engineering constants are
S 11 = 1 E 1 ; S 12 = ν 21 E 2 ; S 13 = ν 31 E 3 ; S 21 = ν 12 E 1 ; S 22 = 1 E 2 ; S 23 = ν 32 E 3 ; S 31 = ν 13 E 1 ; S 32 = ν 23 E 2 ; S 33 = 1 E 3 ; S 44 = 1 G 23 ; S 55 = 1 G 13 ; S 66 = 1 G 12 S ij = S ji
E1, E2, E3 are the modulus of elasticity in the principal material (1-2-3) coordinate system (Figure A1), G12, G13, G23, shear modulus in and νij Poisson’s ratios.
Figure A1. Multidirectional laminate with coordinate notation of individual plies, subjected to forces and moments per unit length.
Forests 11 01221 g0a1
When the principal material coordinate system does not coincide with the global x-y-z coordinate system, but it is rotated through an angle θ about the common z-(3) axis, as indicated in Figure A1, the transformed compliance matrix can be defined as
[ S ¯ ] = [ T 2 ] 1 [ S ] [ T 1 ] [ S ¯ ] = [ S ¯ 11 S ¯ 12 S ¯ 13 0 0 S ¯ 16 S ¯ 12 S ¯ 22 S ¯ 23 0 0 S ¯ 26 S ¯ 13 S ¯ 23 S ¯ 33 0 0 S ¯ 36 0 0 0 S ¯ 44 S ¯ 45 0 0 0 0 S ¯ 45 S ¯ 55 0 S ¯ 16 S ¯ 26 S ¯ 36 0 0 S ¯ 66 ]
where the transformation matrices [T1] and [T2] are
[ T 1 ] = [ u 2 v 2 0 0 0 2 u v v 2 u 2 0 0 0 2 u v 0 0 1 0 0 0 0 0 0 u v 0 0 0 0 v u 0 u v u v 0 0 0 u 2 v 2 ] [ T 2 ] = [ u 2 v 2 0 0 0 u v v 2 u 2 0 0 0 u v 0 0 1 0 0 0 0 0 0 u v 0 0 0 0 v u 0 2 u v 2 u v 0 0 0 u 2 v 2 ]
and u= cos(θ) and v= sin(θ).
From transformed compliance coefficients the desired modulus of elasticity and shear modulus in x-y-z directions for each separate layer can be calculated as follows
E x = 1 S ¯ 11 = 1 sin 2 ( θ ) ( 4 cos 2 ( θ ) G 12 2 ν 12 cos 2 ( θ ) E 2 + sin 2 ( θ ) E 2 ) + cos 4 ( θ ) E 1 G xz = 1 S ¯ 55 = 1 sin 2 ( θ ) G 23 + cos 2 ( θ ) G 13 G xy = 1 S ¯ 66 = 1 cos 2 ( 2 θ ) G 12 + ( 2 E 1 ν 12 + E 1 + E 2 ) sin 2 ( 2 θ ) E 1 E 2
It the case of thin composites for which a condition of plane stress exists or is a very good approximation, an orthotropic material with principal material coordinates, plane stress constitutive Equation (A4), has the following simplified form for reduced stiffness
[ ϵ 1 ϵ 2 γ 12 ] = [ S 11 S 12 0 S 12 S 22 0 0 0 S 66 ] [ σ 1 σ 2 τ 12 ]
and for reduced compliance
[ σ 1 σ 2 τ 12 ] = [ Q 11 Q 12 0 Q 12 Q 22 0 0 0 Q 66 ] [ ϵ 1 ϵ 2 γ 12 ]
where the stiffness is the inverse of the compliance
Q ij = S ij 1
In the case of rotation of x axis about the 3 (z) axis using [T1] transformation matrix for stress and [T2] for transformation of strain, we get the plane stress transformed reduced stiffness matrix
[ Q ¯ ] = [ T 1 ] 1 [ Q ] [ T 2 ]
and
[ T 1 ] = [ u 2 v 2 2 u v v 2 u 2 2 u v u v u v u 2 v 2 ] ; [ T 2 ] = [ u 2 v 2 u v v 2 u 2 u v 2 u v 2 u v u 2 v 2 ]
The stresses at any z-location of the kth layer can now be determined by plane stress constitutive equation
[ σ ] x = [ Q ¯ ] k   [ ϵ ] x
where [ Q ¯ ] k is the transformed reduced stiffness of the kth layer in the z-location, which varies with the tissue orientation of each layer.
Acting on the composites with the in-plane forces per unit length [Nx, Ny, Nxy] and moments per unit length [Mx, My, Mxy] (Figure A1), the fundamental equation of lamination theory can be written
[ N M ] = [ A B B D ] [ ϵ 0 κ ]
where [κ] is the curvature due to moment [M], [ε0] is midplane strain, matrix [A] represents the in-plane stiffness, [B] is the matrix which defines the bending-stretching coupling and [D] is bending stiffness matrix, all defined as
[ A ] = k = 1 n [ Q ¯ ] k ( z k z k 1 ) ; [ B ] = 1 2 k = 1 n [ Q ¯ ] k ( z k 2 z k 1 2 ) ; [ D ] = 1 3 k = 1 n [ Q ¯ ] k ( z k 3 z k 1 3 )
When the laminate is symmetric, matrix [B] = 0, and the constitutive Equation (A15) becomes
[ N ] = [ A ] [ ϵ 0 ] [ M ] = [ D ] [ κ ]
or
[ ϵ 0 ] = [ A ] 1 [ N ] [ κ ] = [ D ] 1 [ M ]
To obtain the effective constants of the laminate, first the laminate average stress [ σ ¯ ] is defined, and Equation (A18) is used. If the laminate is symmetric, the response is uncoupled from the bending response and the Equation (A18) governs the in-plane response.
[ σ ¯ ] = 1 h [ N ] = 1 h [ A ] [ ϵ 0 ]
Inverting this equation gives the strains as a function of the average applied stress
[ ϵ 0 ] = h [ A ] 1 [ σ ¯ ] = [ a * ] [ σ ¯ ]
and [ a * ] is defined as laminate compliance
[ a * ] = h [ A ] 1 = [ a 11 * a 12 * a 16 * a 12 * a 22 * a 26 * a 16 * a 26 * a 66 * ]
Similar procedure can be used to calculate laminate bending compliance [ d * ]
[ d * ] = h 3 12 [ D ] 1 = [ d 11 * d 12 * d 16 * d 12 * d 22 * d 26 * d 16 * d 26 * d 66 * ]

References

  1. Norris, C.B.; McKinnon, P.F. Compression, Tension, and Shear Tests on Yellow-Poplar Plywood Panels of Sizes that do not Buckle with Tests Made at Various Angles to the Face Grain; U.S. Dept. of Agriculture, Forest Service, Forest Products Laboratory: Madison, WI, USA, 1956.
  2. Norris, C.B. Strength of Orthotropic Materials Subjected to Combined Stresses; U.S. Dept. of Agriculture, Forest Service, Forest Products Laboratory: Madison, WI, USA, 1962; p. 40.
  3. Kallakas, H.; Rohumaa, A.; Vahermets, H.; Kers, J. Effect of different hardwood species and lay-up schemes on the mechanical properties of plywood. Forests 2020, 11, 649. [Google Scholar] [CrossRef]
  4. Biadała, T.; Czarnecki, R.; Dukarska, D. Water resistant plywood of increased elasticity produced from European wood species. Wood Res. 2020, 65, 111–123. [Google Scholar] [CrossRef]
  5. Bal, B.C. Some physical and mechanical properties of reinforced laminated veneer lumber. Constr. Build. Mater. 2014, 68, 120–126. [Google Scholar] [CrossRef]
  6. Svoboda, T.; Sikora, A.; Zaborsky, V.; Gaffova, Z. Laminated Veneer Lumber with Non-Wood Components and the Effects of Selected Factors on Its Bendability. Forests 2019, 10, 470. [Google Scholar] [CrossRef] [Green Version]
  7. Sikora, A.; Svoboda, T.; Zaborsky, V.; Gaffova, Z. Effect of Selected Factors on the Bending Deflection at the Limit of Proportionality and at the Modulus of Rupture in Laminated Veneer Lumber. Forests 2019, 10, 401. [Google Scholar] [CrossRef] [Green Version]
  8. Salca, E.A.; Bekhta, P.; Seblii, Y. The effect of veneer densification temperature and wood species on the plywood properties made from alternate layers of densified and non-densified veneers. Forests 2020, 11, 700. [Google Scholar] [CrossRef]
  9. Yu, X.; Xu, D.; Sun, Y.; Geng, Y.; Fan, J.; Dai, X.; He, Z.; Dong, X.; Dong, Y.; Li, Y. Preparation of wood-based panel composites with poplar veneer as the surface layer modified by in-situ polymerization of active monomers. Forests 2020, 11, 893. [Google Scholar] [CrossRef]
  10. Král, P.; Klímek, P.; Mishra, P.K.; Rademacher, P.; Wimmer, R. Preparation and characterization of cork layered composite plywood boards. BioResources 2014, 9, 1977–1985. [Google Scholar] [CrossRef] [Green Version]
  11. Hao, J.; Wu, X.; Oporto-Velasquez, G.; Wang, J.; Dahle, G. Compression properties and its prediction of wood-based sandwich panels with a novel taiji honeycomb core. Forests 2020, 11, 886. [Google Scholar] [CrossRef]
  12. Zhou, H.Y.; Wei, X.; Smith, L.M.; Wang, G.; Chen, F.M. Evaluation of Uniformity of Bamboo Bundle Veneer and Bamboo Bundle Laminated Veneer Lumber (BLVL). Forests 2019, 10, 921. [Google Scholar] [CrossRef] [Green Version]
  13. Wilczyński, M.; Warmbier, K. Elastic moduli of veneers in pine and beech plywood. Drewno 2012, 188, 47–56. [Google Scholar]
  14. Yoshihara, H. Influence of the specimen depth to length ratio and lamination construction on Young’s modulus and in-plane shear modulus of plywood measured by flexural vibration. BioResources 2012, 7, 1337–1351. [Google Scholar]
  15. Yoshihara, H. Edgewise shear modulus of plywood measured by square-plate twist and beam flexure methods. Constr. Build. Mater. 2009, 23, 3537–3545. [Google Scholar] [CrossRef]
  16. Guan, C.; Liu, J.; Zhang, H.; Wang, X.; Zhou, L. Evaluation of modulus of elasticity and modulus of rupture of full-size wood composite panels supported on two nodal-lines using a vibration technique. Constr. Build. Mater. 2019, 218, 64–72. [Google Scholar] [CrossRef]
  17. Guan, C.; Zhang, H.; Zhou, L.; Wang, X. Dynamic determination of modulus of elasticity of full-size wood composite panels using a vibration method. Constr. Build. Mater. 2015, 100, 201–206. [Google Scholar] [CrossRef]
  18. Park, H.M.; Fushitani, M.; Byeon, H.S. Derivation and application of an equation for calculating shear modulus of three-ply laminated material beam from shear moduli of individual laminae. J. Wood Sci. 2009, 55, 181–189. [Google Scholar] [CrossRef]
  19. Sanne, M.; Ahn-Ercan, G.; Pfriem, A. A mathematical solution for calculating the springback of laminated beech stacks molded within the elastic range. Forests 2020, 11, 725. [Google Scholar] [CrossRef]
  20. Brancheriau, L.; Bailleres, H.; Guitard, D. Comparison between modulus of elasticity values calculated using 3 and 4 point bending tests on wooden samples. Wood Sci. Technol. 2002, 36, 367–383. [Google Scholar] [CrossRef]
  21. Krüger, R.; Wagenführ, A. Comparison of methods for determining shear modulus of wood. Eur. J. Wood Wood Prod. 2020. [Google Scholar] [CrossRef]
  22. Merhar, M.; Bučar, B. Determination of correction coefficient for dynamic modulus of elasticity obtained by analysing the frequency response of a clamped cantilever specimen. Holz Als Roh Und Werkst. 2008, 66, 233–235. [Google Scholar] [CrossRef]
  23. Hoffmann, J.A.; Wertheimer, T. Cantilever beam vibration. J. Sound Vib. 2000, 229, 1269–1276. [Google Scholar] [CrossRef]
  24. Roohnia, M. An estimation of dynamic modulus of elasticity in cantilever flexural timber beams. Drv. Ind. 2014, 65, 3–10. [Google Scholar] [CrossRef]
  25. Huang, T.C. The effect of rotatory inertia and of shear deformation on the frequency and normal mode equations of uniform beams with simple end conditions. J. Appl. Mech. Trans. Asme 1960, 28, 579–584. [Google Scholar] [CrossRef]
  26. Hearmon, R.F.S. The influence of shear and rotatory inertia on the free flexural vibration of wooden beams. Br. J. Appl. Phys. 1958, 9, 381–388. [Google Scholar] [CrossRef]
  27. Chui, Y.H.; Smith, I. Influence of rotatory inertia, shear deformation and support condition on natural frequencies of wooden beams. Wood Sci. Technol. 1990, 24, 233–245. [Google Scholar] [CrossRef]
  28. Ip, K.H.; Tse, P.C. Determination of dynamic flexural and shear moduli of thick composite beams using natural frequencies. J. Compos. Mater. 2001, 35, 1553–1569. [Google Scholar] [CrossRef]
  29. Brancheriau, L. Influence of cross section dimensions on Timoshenko’s shear factor—Application to wooden beams in free-free flexural vibration. Ann. For. Sci. 2006, 63, 319–321. [Google Scholar] [CrossRef]
  30. Brancheriau, L.; Bailleres, H. Natural vibration analysis of clear wooden beams: A theoretical review. Wood Sci. Technol. 2002, 36, 347–365. [Google Scholar] [CrossRef]
  31. Kollmann, F.F.P.; Côte, W.A. Principles of Wood Science and Technology. Solid Wood.; Springer: Berlin, Germany, 1975; p. 592. [Google Scholar]
  32. Arriaga, F.; Monton, J.; Segues, E.; Íñiguez-Gonzalez, G. Determination of the mechanical properties of radiata pine timber by means of longitudinal and transverse vibration methods. Holzforschung 2014, 68, 299–305. [Google Scholar] [CrossRef]
  33. Haines, D.W.; Leban, J.M.; Herbé, C. Determination of Young’s modulus for spruce, fir and isotropic materials by the resonance flexure method with comparisons to static flexure and other dynamic methods. Wood Sci. Technol. 1996, 30, 253–263. [Google Scholar] [CrossRef]
  34. Boruvka, V.; Novák, D.; Šedivka, P. Comparison and Analysis of Radial and Tangential Bending of Softwood and Hardwood at Static and Dynamic Loading. Forests 2020, 11, 896. [Google Scholar] [CrossRef]
  35. Pang, S.; Liang, Y.; Tao, W.; Liu, Y.; Huan, S.; Qin, H. Effect of the strain rate and fiber direction on the dynamic mechanical properties of beechwood. Forests 2019, 10, 881. [Google Scholar] [CrossRef] [Green Version]
  36. Hu, N. Composites and Their Properties; InTech: Rijeka, Croatia, 2012. [Google Scholar]
  37. Herakovich, C.T. Mechanics of Fibrous Composites; John and Wiley and Sons: New York, NY, USA, 1998; p. 450. [Google Scholar]
  38. Isaac, M.D.; Ishai, O. Engineering Mechanics of Composite Materials, 2nd ed.; Oxford University Press: New York, NY, USA, 2006. [Google Scholar]
  39. Mohammadabadi, M.; Jarvis, J.; Yadama, V.; Cofer, W. Predictive models for elastic bending behavior of a wood composite sandwich panel. Forests 2020, 11, 624. [Google Scholar] [CrossRef]
  40. Fortino, S.; Hradil, P.; Salminen, L.I.; De Magistris, F. A 3D micromechanical study of deformation curves and cell wall stresses in wood under transverse loading. J. Mater. Sci. 2016, 50, 482–492. [Google Scholar] [CrossRef]
  41. Contemporary Plywood Furniture Designs. Available online: https://www.architectureartdesigns.com/27-contemporary-plywood-furniture-designs/ (accessed on 3 October 2020).
  42. Ross, R.J. Wood Handbook: Wood as an Engineering Material; The Forest Products Laboratory: Forest Products Society: Madison, WI, USA, 2010; p. 508.
  43. Aicher, S.; Dill-Langer, G. Effect of lamination anysotropy and lay-up in glued-laminated timbers. J. Struct. Eng. 2005, 131, 1095–1103. [Google Scholar] [CrossRef]
  44. Fortino, S.; Mirianon, F.; Toratti, T. A 3D moisture-stress FEM analysis for time dependent problems in timber structures. Mech. Time-Depend. Mater. 2009, 13, 333–356. [Google Scholar] [CrossRef]
  45. Hein, P.R.G.; Lima, J.T.; Gril, J.; Rosado, A.M.; Brancheriau, L. Resonance of scantlings indicates the stiffness even of small specimens of Eucalyptus from plantations. Wood Sci. Technol. 2012, 46, 621–635. [Google Scholar] [CrossRef]
  46. Yoshihara, H.; Maruta, M. Shear moduli in the longitudinal-radial and radial-tangential planes of Sitka spruce measured by torsional vibration tests. Holzforschung 2018, 72, 507–512. [Google Scholar] [CrossRef]
  47. Nakao, T.; Okano, T.; Asano, I. Measurement of the anisotropic-shear modulus by the torsional-vibration method for free-free wooden beams. Mokuzai Gakkaishi 1984, 30, 877–885. [Google Scholar]
  48. Love, A. A Treatise on the Mathematical Theory of Elasticity; Cambridge University Press: Cambridge, UK, 1892. [Google Scholar]
  49. Yoshihara, H. Off-axis Young’s modulus and off-axis shear modulus of wood measured by flexural vibration tests. Holzforschung 2012, 66, 207–213. [Google Scholar] [CrossRef]
  50. Kubojima, Y.; Tonosaki, M. Young’s and shear moduli of glued laminated timber composed of different species obtained by a flexural vibration test. Holzforschung 2012, 66, 871–875. [Google Scholar] [CrossRef]
  51. Bodig, J.; Jayne, B.A. Mechanics of Wood and Wood Composites; Van Nostrand Reinhold: New York, NY, USA, 1982. [Google Scholar]
  52. Hering, S.; Keunecke, D.; Niemz, P. Moisture-dependent orthotropic elasticity of beech wood. Wood Sci. Technol. 2012, 46, 927–938. [Google Scholar] [CrossRef] [Green Version]
  53. Ozyhar, T.; Hering, S.; Niemz, P. Moisture-dependent elastic and strength anisotropy of European beech wood in tension. J. Mater. Sci. 2012, 47, 6141–6150. [Google Scholar] [CrossRef]
  54. Milch, J.; Tippner, J.; Sebera, V.; Brabec, M. Determination of the elasto-plastic material characteristics of Norway spruce and European beech wood by experimental and numerical analyses. Holzforschung 2016, 70, 1081–1092. [Google Scholar] [CrossRef]
  55. Boruvka, V.; Zeidler, A.; Holecek, T.; Dudik, R. Elastic and Strength Properties of Heat-Treated Beech and Birch Wood. Forests 2018, 9, 197. [Google Scholar] [CrossRef] [Green Version]
Figure 1. Experiment design.
Forests 11 01221 g001
Figure 2. Plywood with specimen coordinate system (x-y-z) and principal material coordinate system (1-2-3), rotated by an angle θ.
Forests 11 01221 g002
Figure 3. Experimental system for determination of natural frequencies: (a) flexural and torsional vibration; (b) longitudinal vibration.
Forests 11 01221 g003
Figure 4. Scheme of cutting specimens from 7-ply A-type boards. Numbers designate the first layer tissue orientation according to the individual specimen coordinate system (x, y, z).
Forests 11 01221 g004
Figure 5. Averaged frequency spectrum for 11A specimen natural vibrations, for a specimen with an angle of −45° of the first ply orientation: (a) flexural and torsional vibration spectrum. Flexural frequencies were used for out-of-plane modulus of elasticity and in-plane shear modulus determination, while torsional frequency was used for out-of-plane shear modulus determination; (b) longitudinal vibration spectrum for in-plane modulus of elasticity determination.
Forests 11 01221 g005
Figure 6. Calculated and measured effective modulus of elasticity and shear modulus for 11-layer samples for different combinations of layer orientations. The points represent single values obtained from the natural frequencies of flexural, torsional and longitudinal vibrations. Solid lines represent calculated values using the laminate theory.
Forests 11 01221 g006
Figure 7. Calculated and measured effective modulus of elasticity and shear modulus for 7-layer samples for different combinations of layer orientations. The points represent single values obtained from the natural frequencies of flexural, torsional and longitudinal vibrations. Solid lines represent calculated values using the laminate theory.
Forests 11 01221 g007
Figure 8. Calculated Timoshenko shear factor s for different combinations of tissue orientations.
Forests 11 01221 g008
Figure 9. Composite finite element model using Ansys software for a specimen 7A with first ply orientation of 22.5°: (a) first layer with specimen coordinate system and designation of the main direction (yellow arrow) and first ply orientation (green arrow); (b) relative deformation of the first flexural vibration mode in specimen coordinate system; (c) relative deformation of the first torsional vibration mode in specimen coordinate system; (d) relative deformation of the first longitudinal vibration mode in specimen coordinate system.
Forests 11 01221 g009
Table 1. Tissue orientations of individual layers for 7- and 11-layer beech veneer plywood.
7 Layers11 Layers
Ply No.7A (°)7P (°)11E (°)11A (°)11P (°)
100000
2459003090
3−4500−300
4909006090
5−4500−600
6459009090
7000−600
8--06090
9--0−300
10--03090
11--000
Table 2. Elastic properties for beech wood [31], taken for shear factor calculation.
Modulus of Elasticity (MPa)Shear Modulus (MPa)Poisson’s Ratio
E1 = ELE2 = ETE3 = ERG12 = GLTG23 = GTRG13 = GLRν12 = νLTν23 = νTRν13 = νLR
13,73911382240105645616080.520.360.45
Table 3. Modulus of elasticity, shear modulus and Poisson’s ratio, determined from vibration tests and literature. Modulus of elasticity and shear modulus are in MPa. The values in bold type indicate data (only for EL) that are used for subsequent calculations in finite element method and laminate theory.
SourcePropertySpecimen No. AvgStdevCov (%)
123
Flexural vibrationE1 = EL16,80316,86116,91616,860570.34
Flexural vibrationE2 = ET120212101199120460.47
Longitudinal vibrationEL15,97716,22516,66516,2893482.14
ET1139121611661174393.31
Kollman [31]E3 = ER---2737
Torsional vibrationG12 = GLT1055107011241083373.39
Torsional vibrationG23 = GTR365341383363215.81
Torsional vibrationG13 = GLR1416144214281429130.89
Kollman [31]ν12 = νLT---0.52
Kollman [31]ν23 = νTR---0.36
Kollman [31]ν13 = νLR---0.45
Table 4. Average measured and calculated natural frequencies, using finite element modal analysis.
Experiment—Average ValueModal Analysis—Finite Element Method
FlexuralTorsLongFlexuralTorsLong
SpecimenFirst Ply Orientation (°)f1f2f3f4f1f1f1f2f3f4fif1
11E044511882230349193856624451192224335269535755
11E901203276301021781152412032863410288081547
11A035292417002612101636623639541751268110533732
11A22.527874113892252104635932977901477232810843705
11A4519954010151661110634942185891098178610983648
11A67.5162443855138611173322174474914148311733488
11A−90160440845136811103207169460888144111613354
11A−22.532986515922453102236253429001656254310703730
11A−4525367812751957103435562667111338205110903647
11A−67.51895169821575108933282005421029165811373471
11P0351925170426347794314362954175927038694412
11P−22.524265612621952110831032546841313202411433214
11P−4519152510101628127325512045541063171112932638
11P−67.522159611431792103430942316231192187310703114
11P−90271721135521138243945286763142622268684078
7A05271395258539891163561854714422661409411895787
7A22.54001072203030031210572941111012082329512385743
7A4528677915112362130656322937971552242513280
7A67.523363912312007129650362456711293211613425180
7A−9023865812782039120747702506821329213812614901
7A−22.54761270234536251282559049713122425373513095792
7A−453951047195830551368557740810852028316612255665
7A−67.529780215362489115750513088321595258912005148
7P054214352665409090967185591471271141649606837
7P−22.5349949184030381352472137810211963318113614914
7P−4527877014962435149538622978141583256015263992
7P−67.531084216172600112346103248771679270111944675
7P−903669891866292690058953831027193230399566040
Publisher’s Note: MDPI stays neutral with regard to jurisdictional claims in published maps and institutional affiliations.

