Abstract
Ginkgo biloba, a deciduous tree species in the Ginkgo family, has a long history of cultivation in China and is widely used in garden landscapes, medicine, food, and health products. However, few reports have focused on the systematic selection of optimal reference genes based on transcriptomic data in G. biloba. The purpose of our research was to select an internal reference gene suitable for different experimental conditions from thirteen candidate reference genes by the delta cycle threshold (ΔCt) method, geNorm, BestKeeper, NormFinder, and RefFinder programs. The reference genes were used for gene expression analyses of Ginkgo biloba. These results showed that elongation factor 1(EF1) and ubiquitin (UBI) were the best choices for samples of different ginkgo genotypes. The expression of UBI and HAS28 presented the most stable at different developmental stages of ginkgo, and EIF3I and RPII were considered as suitable reference genes in different tissues of ginkgo. For methyl jasmonate (MeJA) treatment, ACA and ACT were identified as the optimal reference genes. For cold stress treatment, RPII and EIF4E were chosen for the gene expression normalizations. HAS28 and GAPDH presented the most stable expression for the heat treatment. To validate the above results, a chalcone synthase gene (GbCHS) in ginkgo was amplified by quantitative real-time polymerase chain reaction (qRT-PCR). Our results provide different suitable reference genes for further gene expression studies in ginkgo.
1. Introduction
Quantitative real-time polymerase chain reaction (qRT-PCR) is a commonly used method to analyze the expression level of functional genes and has become the preferred method to quantify mRNA, as this method meets the requirements for quantitative analyses of data in molecular medical, biotechnological, microbiological, and diagnostic-type studies [1,2]. The benefits of this technique compared with traditional RNA measurement methods include its good specificity, high accuracy, wide detection range, simple operation, and safety. Some traditional reference genes (ribosomal 18S, glyceraldehyde-3-phosphate dehydrogenase, and elongation factor 1-α) have been used extensively for RT-qPCR-based analysis [3,4,5,6]. However, the most appropriate reference genes may not be the same for different experimental groups, as shown for Elymus sibiricus [7], Glycine max [8], Fragaria ananassa [9], Caragana korshinskii [10], and Daucus carota [11]. Inappropriate selection of internal reference genes may lead to quantitative errors. Therefore, the expression data may be misinterpreted. In the last decade, several methods, including the delta cycle threshold (ΔCt) method [12] and the use of software programs such as geNorm [13], BestKeeper [14], NormFinder [15], and RefFinder [16], have been commonly used to select the appropriate reference genes.
Ginkgo biloba L. is a world-famous relic plant referred to as a “living fossil” in the plant kingdom. However, the temperature extremes of the natural habitat of G. biloba are 40 and 4 °C, which affects its regional expansion [17]. Flavonoids, terpenoids, and ginkgolic acids are important metabolites in ginkgo [18]. Ginkgo is one of the most popular and explored herbal drugs [19]. Leaf extracts of Ginkgo biloba (EGb 761), comprising 24% flavonoids and 6% terpenoid trilactones (TTLs) (3.1% ginkgolides and 2.9% bilobalides), have been used for years to treat age-related memory-deficit problems [20,21]. Previous studies with ginkgo mainly focused on both the contents of terpene lactone and flavonoids in different species at different developmental stages [22,23,24] and methods to improve extraction efficiency [25,26,27,28]. With advancements in technology, several molecular techniques, including transcriptome sequencing, the use of molecular markers, and gene cloning, have been applied to ginkgo research [29,30,31,32]. Gene expression analysis plays an important role in the advancement of molecular biology research.
The present research was conducted to identify and evaluate the thirteen candidate reference genes to determine the most suitable choice under different experimental conditions. Transcriptome sequencing plays an important role in plant biological research, providing a better understanding of important plant molecular mechanisms [33,34,35]. Moreover, transcriptomic data provide an important basis for identifying and exploring reference genes. In ginkgo, glyceraldehyde-3-phosphate dehydrogenase (GAPDH) is frequently used as a reference gene for normalization [3,4,5,6] and the sequence was extracted from the National Center for Biotechnology Information (NCBI) database (Genebank Accession number: L26924.1). Therefore, in the present study, with the exception of GAPDH, the other genes were selected on the basis of previous articles [11,36,37,38], and their sequences were extracted from existing transcriptomic data. The other twelve candidate reference genes included tubulin (TUB), eukaryotic translation initiation factor 3 subunit I (EIF3I), eukaryotic translation initiation factor 4E (EIF4E), 28 kDa heat- and acid-stable phosphoprotein (HAS28), ubiquitin (UBI), RNA polymerase II (RPII), hypothetical protein (HYP), elongation factor 1(EF1), histone H2A.6 (H2A), actin (ACT), acetyl-coenzyme A carboxylase (ACA), and adenylosuccinate synthetase (ADSS). GbCHS, a key enzyme gene in the flavonoid biosynthesis pathway, was selected as a target gene [39] to explore candidate references under different experimental conditions. Therefore, our objectives were to identify the expression stability of thirteen G. biloba candidate reference genes in leaf samples from different genotypes and different tissues (branches, male flowers, female flowers, testae, and leaves), leaf tissues from different developmental stages, and under hormone and abiotic stress treatments (heat, cold stresses, and MeJA treatments). The selected internal reference genes under different conditions were validated in qRT-PCR experiments to standardize and evaluate the value of one target gene, which will assist in further gene discovery and putative expression patterns studies in G. biloba and other plants. Our results will provide helpful guidelines for identifying optimal reference genes, providing reliable target gene expression under different experimental conditions.
2. Materials and Methods
2.1. Materials and Treatments
Leaf samples (4–6) of six different ginkgo genotypes were collected from the Pizhou Ginkgo Germplasm Garden and Nanjing Forestry University (Supplementary Table S1). Leaf samples of genotype Nanjing (NJ) were collected every 30 days from May to October 2018 (M1–M6). Different tissue samples were collected as follows: branches, male flowers, and female flowers were collected at the flowering stage, and leaves and testae were collected during the fruiting period. Ginkgo seedlings of uniform size were subjected to hormone and abiotic stress treatments. For the methyl jasmonate (MeJA) treatments, the leaves of seedlings were sprayed with 1 mmol/L MeJA solution and were collected after 0, 12, and 24 h. For the heat and cold treatments, the seedlings were subjected to 42 and 4 °C for 0, 12, and 24 h, respectively. Under each treatment, 4–6 leaves were collected at each time point. A total of 87 samples (3 biological replicates each) were collected for this study. All the samples were collected and quickly frozen in liquid nitrogen and then stored at −80 °C for later use.
2.2. Total RNA Isolation and cDNA Synthesis
The total RNA of ginkgo samples was isolated by an RNA Simple Total RNA Kit (Omega Bio-tek, Inc., Norcross, GA, USA). RNA quality and concentration were determined by a NanoDrop 2000 spectrophotometer (Thermo, Wilmington, DE, USA). The OD260/280 nm and OD260/230 absorbance ratios of the total RNA were 1.8–2.0 and 2.0–2.6, respectively. The integrity of the RNA was evaluated by 1% agarose gel electrophoresis. Then, following the manufacturer’s instructions, cDNA was synthesized in 20 μL of the reaction mixture with the PrimeScript™ RT master mix (TaKaRa, Beijing, China), and cDNA was stored at −20 °C until use.
2.3. Gene Sequence Search and Primer Design
Thirteen candidate reference genes and one target gene were selected based on the transcriptomic data of eight different tissues (root, immature leaf, mature leaf, microstrobilus, ovulate strobilus, immature fruit, stem, and mature fruit tissues) and six different leaf developmental stages in ginkgo (unpublished data) (Supplementary Table S2). All the RNA sequencing (RNA-seq) data of eight tissues were downloaded from the National Center for Biotechnology Information (NCBI) database (accession Nos. SRR7948405–SRR7948413 and SRP149113) [40]. Fragments per kilobase of exon model per million mapped reads (FPKM), the mean expression values (MV), standard deviations (SDs), and coefficients of variation (CVs) (calculated by the division of the SDs by the MVs), were calculated to estimate the expression stability of each gene, and stable genes with a CV < 0.5 were chosen (Supplementary Table S2) [41,42,43]. The specificity of the primers was confirmed by 1% agarose gel electrophoresis. The primers were designed with Primer Premier 5.0, and the specific sequences and related parameters are shown in Table 1.

Table 1.
Description of reference genes and associated primers used for the quantitative real-time polymerase chain reaction (qRT-PCR) study.
2.4. qRT-PCR Assays
qRT-PCR amplification was performed with TB Green® Fast qPCR Mix (TaKaRa, Beijing, China) on an Applied Biosystems 7300 Real-Time PCR System (Applied Biosystems, Foster City, CA, USA). All cDNA was diluted to 100 ng·μL−1. The PCR mixtures and the procedures were set according to the instructions. The primer specificity was verified by evaluating the melting curve of each reaction. We used a chalcone synthase gene (GbCHS) to validate the accuracy of the final selected internal reference genes. All qRT-PCR experiments’ reactions contained three technical replicates and three biological replicates.
2.5. Data Analysis
The ranking of the thirteen reference genes was calculated by the geNorm, NormFinder, BestKeeper, the ΔCt method, and RefFinder (http://www.ciidirsinaloa.com.mx/RefFinder-master/). The stability value (M) and the pairwise variation (Vn/Vn + 1) are the main parameters used for evaluating the stability level of the reference gene within the geNorm [13]. A gene associated with the lower M value is more stable. The NormFinder program also screens the most suitable internal reference genes based on stable values, not only to rank the intragroup expression of the reference gene but also to calculate intergroup variations [15]. Through the BestKeeper, the standard deviation (SD) and coefficient of variation (CV) were calculated, and the reference gene having the lower CV and SD (CV ± SD) is considered the more stable [14]. RefFinder is a web-based comprehensive tool that integrates the above computational programs. Therefore, RefFinder was used for the overall final ranking of the tested genes [16]. The correlation coefficient (R2) and the amplification efficiency (E) were calculated by the slope (k) of standard curves. The applied equation was E = (10−1/k−1) × 100% [44]. The regression coefficient (R2) of the standard curve was greater than 0.98, and the E value was between 90% and 110%. The expression profiles of GbCHS were validated using the 2−ΔΔct method with three biological samples [45], and the significant differences were analyzed with SPSS statistical software 23.
3. Results
3.1. Designing and Validation of Primers
Thirteen potential reference genes (Table 1) based on the transcriptomic data from ginkgo were selected, and the sequences were used as the basis for specific primer design. Primer specificity was evaluated by RT-PCR products. PCR products generated by each primer pair using cDNA from G. biloba as a template were visualized as single bands on 1% agarose gel. All amplification products were between 100 and 200 bp (Supplementary Figure S1). Additionally, the no-template controls showed no peaks, which indicated that there were no primer dimers present. The qRT-PCR E-values of the thirteen candidate reference genes ranged from 95.76% (HAS28) to 107.28% (ADSS), and the R2 ranged from 0.9801 (RPII) to 0.999 (ACT).
3.2. Expression Profile of Candidate Reference Genes
For the transcription profile analysis, the primers of thirteen candidate reference genes were used for qRT-PCR to obtain the Ct values of all samples. The Ct values of thirteen reference genes ranged from 20.82 (H2A expressed in the YL samples) to 28.70 (GAPDH expressed in the testa samples) among all the samples (Figure 1).
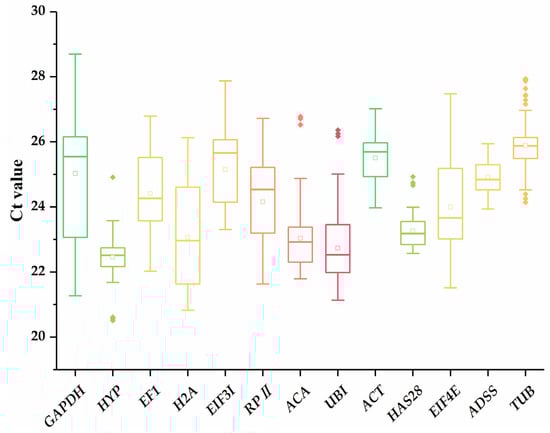
Figure 1.
cycle threshold (Ct) values of thirteen candidate reference genes in G. biloba samples. The whiskers, boxes, lines, boxes, and hollow and solid dots represent maximums/minimums, 25th/75th percentiles, medians, means, Ct values, and potential outliers. The different color lines have no practical meaning.
3.3. geNorm Analysis
The geNorm algorithm was used to evaluate the stability values (Ms) of reference genes and calculate the average pairwise variations (Vs) to determine the optimal number of internal reference genes. According to the geNorm program, only candidate genes with an M value lower than 1.5 could be selected as suitable reference genes. The smaller the M value is, the higher the expression stability of the candidate reference gene. Most genes were stable, with M values lower than 1.5 (Figure 2). Our results showed that RPII and UBI had the smallest M values (0.054), so these two genes were the most stable in the different genotypes, while HAS28 was the least stable (0.625) (Figure 2a). At the different developmental stages, H2A and UBI with an M value of 0.107 were the most suitable genes, while ADSS with the highest M value (0.621) was the most unsuitable (Figure 2b). EIF3I and HAS28 were indicated as the most suitable genes in the different tissues, but the common internal reference gene GAPDH was considered as the least suitable (Figure 2c). ACT and ACA (0.099) were identified as the most stably expressed reference genes for MeJA treatment (Figure 2d). After heat stress treatment, GAPDH and HAS28 (0.04) were the most suitable genes with a stability value of 0.04 (Figure 2e). For the above treatments, EF1 was the most unstable gene. Within the cold stress group, EIF4E and RPII (M = 0.097) were the most suitable genes, and H2A (0.557) ranked last (Figure 2f). ACT and HAS28, reflecting the highest stability, were the optimal reference genes, while GAPDH was also the worst choice in all the samples (Figure 2g). On the basis of our results, we found that the most appropriate genes under various experimental conditions were different.
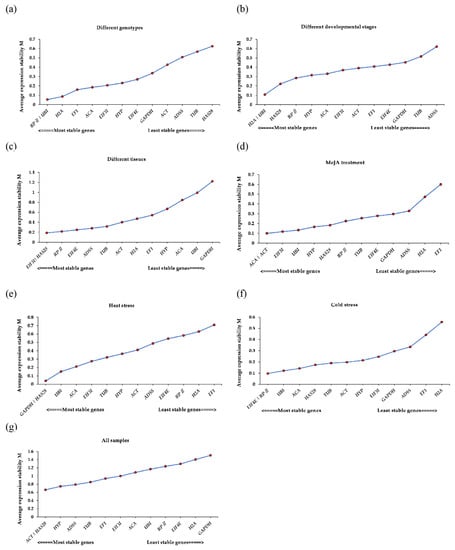
Figure 2.
The stability values (Ms) of thirteen reference genes under different experimental conditions according to geNorm. (a) Different genotypes, (b) different developmental stages, (c) different tissues, (d) Methyl Jasmonate (MeJA) treatment, (e) heat stress, (f) cold stress, and (g) all samples.
The optimal number of reference genes to be used was determined by pairwise variation (V), which is an important parameter in the geNorm and the cut-off value was 0.150 (Figure 3). As shown in Figure 3, all Vs were lower than 0.15 in the groups, except for V12/13 of the different tissues (0.185) and the cold stress group V12/13 (0.204), so two reference genes were adequate for normalization. In all the samples, V5/6 (0.137) and V4/5 (0.177) indicated that ACT, HAS28, HYP, ADSS, and TUB were needed for normalization.
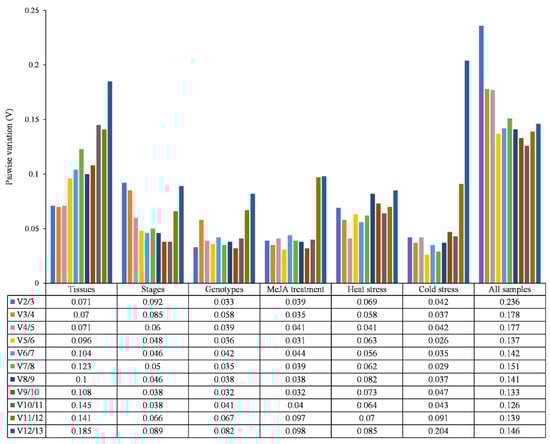
Figure 3.
Pairwise variation (V) of thirteen candidate reference genes according to geNorm. The Vn/n + 1 is used to determine the optimal number of reference genes for accurate normalization. A cut-off value of Vn/n + 1 < 0.15 indicates that no additional reference genes need to be added. Otherwise, n + 1 genes need to be introduced.
3.4. NormFinder Analysis
In NormFinder analysis, reference genes were ranked according to their stability value (Figure 4a and Supplementary Table S4). The gene with the lowest stability value ranked first. The results indicated that EF1 was the optimal reference gene for the different genotypes, but was the most inappropriate choice for different developmental stages. For different tissues, EIF3I was the most stable gene, with a stability value of 0.248. The stability value of HAS28 was the most stable for different developmental stages and heat treatments. For cold stress, EIF4E was the most stable gene while H2A was the least stable gene. The most suitable reference genes indicated by the NormFinder algorithm in most experimental datasets differed from those obtained with the geNorm program. However, the results of the two methods for the most unstable reference gene in all groups were consistent. For the MeJA treatment, RPII was the most suitable gene within NormFinder analysis, whereas RPII was ranked seventh by geNorm. In all the samples, HYP was the most stable gene, but HYP was ranked third with the geNorm program.
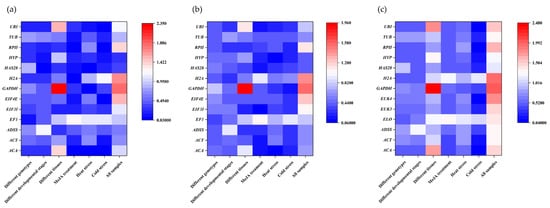
Figure 4.
The expression stabilities of G. biloba reference genes according to three software methods: (a) the NormFinder program, (b) the BestKeeper program, and (c) the ΔCt method. The spectrum from red to blue indicates low- to high-stability.
3.5. BestKeeper Analysis
The BestKeeper program ranks reference genes according to SD, CV, and r values. A lower SD value corresponded to a more stable gene (Figure 4b and Supplementary Table S4). Therefore, the reference gene EF1 was the most suitable in the different genotypes. Across the different developmental stages, the expression of H2A was the most stable, so H2A was considered as the most appropriate reference gene. For the different tissues, EIF3I was the optimal reference gene with the lowest SD value of 0.23. In the MeJA treatment group, EIF3I was also the most suitable gene according to BestKeeper. For cold stress, GAPDH was considered to be the most stable gene with the lowest SD value (0.17). For heat stress, the SD value of ACA was the lowest, so ACA was the most stable gene. In all the samples, HAS28 was the best choice for normalization of target gene expression. RPII, EIF4E, H2A, and GAPDH were considered to be the least stable genes, as their SD values were the highest.
3.6. Analysis by the ΔCt Method
The value of the standard deviation (SD) was used as the indicator for evaluating the expression stability of reference genes. A reference gene with a lower SD value is more stable (Figure 4c and Supplementary Table S5). In the groups of different genotypes, developmental stages, and tissues, UBI, HYP, and EIF3I presented the most stable expression, while HAS28, ADSS, and GAPDH presented the least stable expression. In the MeJA, cold stress, and heat stress treatment groups, ACA, UBI, and HAS28 were the most appropriate reference genes. EF1 was the worst in both the MeJA treatment and heat stress groups. For cold stress, H2A was the worst choice. These results were the same as the results obtained with the geNorm, NormFinder, and BestKeeper analyses.
3.7. RefFinder Analysis
RefFinder performed a comprehensive evaluation to obtain the overall final ranking based on the ranking of the other four methods (Table 2). Among the different genotypes, UBI, EF1, and RPII were the three most stable genes, while HYP, HAS28, and UBI ranked in the top three across the different developmental stages. In the different issues, EIF3I, RPII, and HAS28 were the three most suitable choices. Under MeJA treatment, ACA, ACT, and HAS28 ranked first to third respectively, and the expression stabilities of UBI, RPII, and ACA ranked as the top three genes in terms of expression stability for cold stress. In the heat stress group, HAS28, GAPDH, and ACA were identified as the three most suitable genes. In all samples, HAS28, HYP, and ADSS were the most suitable choices. However, HAS28 was the most unstable gene in the different genotypes and ADSS was the worst gene across the different developmental stages. Under heat stress and MeJA treatment, EF1 presented the lowest expression stability. Across the developmental stages, GAPDH had the lowest expression stability. GAPDH was also the worst choice for all the samples. Finally, H2A was ranked as the worst choice under cold stress.
Table 2.
The ranking of thirteen reference genes according to the ΔCt method and the BestKeeper, NormFinder, geNorm, and RefFinder programs.
A comparison of the different experimental sample sets showed that the most suitable genes differed. Therefore, it is necessary to select the appropriate reference gene for each experimental condition. Through RefFinder analysis, we chose the two most suitable reference genes and the least suitable gene under each experimental group to verify the accuracy of the expression of the reference genes.
3.8. Validation of the Stability of Reference Genes
The relative expression of GbCHS was calculated using the selected reference genes to validate the stability of the reference genes. Figure 5 shows that similar expression patterns of GbCHS were obtained when using the two suitable reference genes. In contrast, when an unstable reference gene was selected for expression normalization, the relative expression level of GbCHS showed an abnormal trend. The expression of GbCHS in Yezi ginkgo (YZ) and NJ significantly changed compared to that in GL when using UBI and EF1 as the reference genes. However, the expression of GbCHS did not change significantly when HAS28 was chosen as the reference gene. When HAS28 and UBI were used, the expression of GbCHS in M2–M6 was significantly changed compared with that in M1. The expression of GbCHS in M5 was 7.47 times higher than that in M1 when HAS28 was used as the reference gene. Similarly, in different tissues, when the EIF3I and RPII genes were used as references, the expression change trends were similar, and the expression of GbCHS in the female flowers was 2.57 and 2.36 times higher than that in the leaves, respectively. The expression in the female flowers was 10.72 times higher than that in the leaves when using GAPDH as a reference gene. Taking GAPDH and HAS28 as reference genes, the expression of GbCHS at 8 h was 1.73 and 1.63 times higher than that at 0 h after heat stress. However, the expression was 8.4 times higher than at 0 h when EF1 was used as the reference gene. There was no significant change in the expression of GbCHS after cold stress. Upon choosing H2A as a reference gene, the expression of GbCHS decreased significantly, and its expression significantly decreased after MeJA treatment. When using EF1 as the reference gene, we found that the expression of GbCHS at 12 h was significantly higher than that at 0 h.
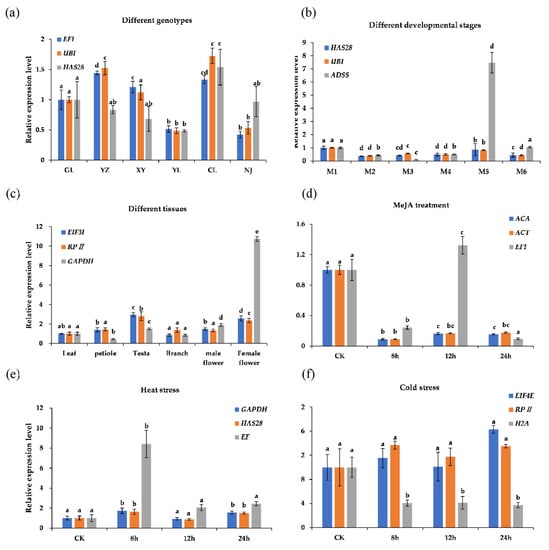
Figure 5.
Relative expression levels of the GbCHS target gene in all samples under different experimental conditions. In each bar chart, the blue and orange bars represent the two best reference genes, and the grey bars represent the worst. (a) Different genotypes, (b) different developmental stages: M1–M6 represent May, June, July, August, September, and October respectively, (c) different tissues, (d) MeJA treatment, (e) heat stress, and (f) cold stress. CK means control. The error bars and different letters above the bars indicate the standard deviations (SDs) and significant differences (p < 0.05).
4. Discussion
The qRT-PCR method has become a prevalent tool for analysis of gene expression. Reports have indicated that inappropriate reference genes cause contrasting conclusions in gene expression analyses [46,47]; therefore, appropriate reference genes are needed for normalization. To the best of our knowledge, this is the first study concerning the systematic selection and evaluation of reference genes based on transcriptomic data for RT-qPCR normalization in G. biloba.
Plants are challenged with numerous abiotic stresses, such as cold, heat, drought stresses, etc. These stresses have adverse effects on the production, growth, and development of plant seeds [48,49,50,51]. Plants have different cold responses, and cold-tolerant species can develop effective strategies to adapt to the cold environment [48]. The freezing tolerance of most plants from temperate regions can be improved by exposure to low, nonfreezing temperatures (0 to 10 °C) via cold acclimation [52,53]. Previous studies have shown that the expression of flavonoid synthesis genes is closely related to the response of plants to cold and heat stresses. Chalcone synthase (CHS) catalyzes the first and key regulatory step of the flavonoid biosynthesis pathway [54], and we selected one GbCHS as a target gene. For example, in Citrus sinensis, the expression of PAL, CHS, DFR, and UFGT is significantly upregulated under a low-temperature environment [55]. After heat stress, the expression of three of the four SmCHS genes (SmCHS1, SmCHS2, and SmCHS3) was continuously downregulated, while that of SmCHS4 was upregulated [56]. Similarly, the expression of PAL, 4CL, CHS, ANR, FLS, and LAR was upregulated after cold stress in Tetrastigma hemsleyanum [57]. The expression of GbCHS was also upregulated in response to cold and heat stresses in our study. MeJA has been proposed to be an important signal transduction compound involved in the process of elicitation, leading to overproduction of a variety of secondary metabolites and several environmental stress factors [58]. Several recent studies have shown that MeJA treatment can increase the contents of flavonoids and terpenes in several different species, including Hypericum perforatum [59], Norway spruce [60], Camellia sinensis [61], and G. biloba [62]. Moreover, MeJA treatment was shown to induce CHS gene expression in Coleus forskohlii [63], Carthamus tinctorius [64], and Nicotiana tabacum [65], among others. After the citrus leaves were treated with MeJA, the expression of the two CHS genes decreased but the expression increased after 24 h [66]. In Physalis angulata, CHS1 was significantly downregulated by treatment with MeJA [67]. The expression of GbCHS was also downregulated under MeJA treatment in this study.
To better normalize the expression data, selection of reference genes based on transcriptomic data has been performed in many plant species, such as Eucalyptus globulus [68], Oxytropis ochrocephala [42], Arabidopsis pumila [69], Sinocalycanthus chinensis [70], and Polygonum cuspidatum [71]. In our study, the thirteen candidate reference genes were chosen based on transcriptome sequencing data. The expression stability was evaluated in all samples. The range of amplification efficiencies was 95.76–107.28%, the range of R2 values was 0.9801–0.999, and Cq values ranged from 20.82 to 28.70, which indicates that the qRT-PCR data can be used for subsequent analysis. We used five common methods, the geNorm, NormFinder, BestKeeper, and RefFinder programs and the ΔCt method, to evaluate the expression stability of the thirteen candidate reference genes. RefFinder integrates the above statistical algorithms for the overall final ranking. The above results showed that the most appropriate reference genes indicated by the four algorithms were inconsistent, even within the same experimental samples, which is consistent with previous research results [7]. For example, EF1 was the most suitable reference gene identified by the BestKeeper and NormFinder algorithms in the different genotypes but ranked fourth according to the geNorm analysis. Across the different developmental stages, H2A was the most suitable choice according to the BestKeeper and geNorm analyses, while it ranked sixth and fifth according to the ΔCT and NormFinder analyses, respectively. In the MeJA treatment group, EIF3I was also the most suitable gene according to BestKeeper, but it was ranked eighth and third according to the NormFinder and geNorm analyses, respectively. For heat stress, the SD value of ACA was the lowest, so it was the most stable gene, whereas it ranked third and fourth according to the NormFinder and geNorm analyses, respectively. The most stable genes were different under the other conditions. Therefore, RefFinder should be used for a comprehensive evaluation to select the most suitable gene.
In all the samples, HAS28 and HYP were the most stable genes, and they were sufficient for normalization according to their pairwise variation (Figure 3). The stability of reference genes varied greatly with different conditions. For example, EF1 was the most suitable reference gene in different genotypes, while it was the least stable reference gene after heat stress and MeJA treatment. Across different developmental stages, UBI was the most appropriate reference gene but was not an eligible option across different tissues. GAPDH is a frequently used reference gene and is widely applied for normalization in the qRT-PCR-based analysis. For heat stress, GAPDH was the best option. In contrast, it was ranked least in the different tissues, which was consistent with the results in different issues of Sorghum bicolor [72] and Salix matsudana [38]. For MeJA treatment, ACT was the most appropriate reference gene; moreover, ACT7 was one of the best-ranked reference genes in Brassica napus [73]. ACT was also highly stably expressed in Lagerstroemia indica, and GAPDH was shown to be an eligible reference gene for Lagerstroemia speciosa at different flower developmental stages [74]; however, these reference genes were unstable in ginkgo across different leaf developmental stages. Similarly, TUB was shown to be an unsuitable gene in L. indica [74] and G. biloba. These results indicated that different experimental conditions require different reference genes, thus demonstrating the importance of selecting appropriate reference genes.
5. Conclusions
In our study, the expression levels of thirteen candidate reference genes were analyzed with five methods and the appropriate reference genes were indeed found to differ under the different experimental conditions. Appropriate reference genes must be selected for specific experimental conditions to obtain accurate gene expression analysis results. We selected stably expressed genes on the basis of transcriptomic data, which is more targeted, convenient, and efficient than other methods for identifying new and more stably expressed genes. The geNorm, BestKeeper, NormFinder, and RefFinder programs and the ΔCt method were the best-suited strategies for analyzing the suitability of the reference genes, and the expression of the target gene GbCHS was normalized across all conditions. Moreover, we not only screened several eligible reference genes of G. biloba under specific conditions but also offered a theoretical basis for the selection of reference genes in other plants.
Supplementary Materials
The following are available online at https://www.mdpi.com/1999-4907/11/11/1217/s1, Table S1: Information of the six Ginkgo biloba accessions, Table S2: FPKM values of 12 reference genes covering 14 transcriptomes data of G. biloba, Table S3: Ranking of the potential reference genes of G. biloba by NormFinder (The tabulated data of Figure 4a), Table S4: Ranking of the potential reference genes of G. biloba by Bestkeeper (The tabulated data of Figure 4b), Table S5: Ranking of the potential reference genes of G. biloba by Delta CT (The tabulated data of Figure 4c), Figure S1: The primer specificity and amplification products of thirteen candidate reference genes.
Author Contributions
T.Z. designed and performed the experiments and wrote the manuscript; T.Z. and X.Y. treated and collected the experimental material; X.Y., G.W., F.F., and F.C. interpreted the data and revised the manuscript. All authors have read and agreed to the published version of the manuscript.
Funding
This work was supported by the National Key Research and Development Program of China (2017YFD0600700), the National Science Foundation of China (31971689), the China Postdoctoral Science Foundation (2018M642261), the Natural Science Fund for Colleges and Universities in Jiangsu Province (19KJB220002), and the Postdoctoral Science Foundation of Jiangsu Province (2018K197C).
Conflicts of Interest
The authors declare no conflict of interest.
References
- Nolan, T.; Hands, R.E.; Bustin, S.A. Quantification of mRNA using real-time RT-PCR. Nat. Protoc. 2006, 1, 1559–1582. [Google Scholar] [CrossRef]
- Overbergh, L.; Giulietti, A.; Valckx, D.; Decallonne, B.; Bouillon, R.; Mathieu, C. The use of real-time reverse transcriptase PCR for the quantification of cytokine gene expression. J. Biomol. Tech. 2003, 14, 33–43. [Google Scholar] [PubMed]
- Cheng, H.; Li, L.; Xu, F.; Cheng, S.; Cao, F.; Wang, Y.; Yuan, H.; Jiang, D.; Wu, C. Expression patterns of a cinnamyl alcohol dehydrogenase gene involved in lignin biosynthesis and environmental stress in Ginkgo biloba. Mol. Biol. Rep. 2013, 40, 707–721. [Google Scholar] [CrossRef] [PubMed]
- Cheng, H.; Li, L.; Cheng, S.; Cao, F.; Wang, Y.; Yuan, H. Molecular cloning and function assay of a chalcone isomerase gene (GbCHI) from Ginkgo biloba. Plant Cell Rep. 2011, 30, 49–62. [Google Scholar] [CrossRef] [PubMed]
- Xu, F.; Li, L.; Zhang, W.; Cheng, H.; Sun, N.; Cheng, S.; Wang, Y. Isolation, characterization, and function analysis of a flavonol synthase gene from Ginkgo biloba. Mol. Biol. Rep. 2011, 39, 2285–2296. [Google Scholar] [CrossRef]
- Liao, Y.L.; Shen, Y.B.; Chang, J.; Zhang, W.W.; Cheng, S.Y.; Xu, F. Isolation, expression, and promoter analysis of GbWRKY2: A novel transcription factor gene from Ginkgo biloba. Int. J. Genom. 2015, 2015, 607185. [Google Scholar] [CrossRef]
- Zhang, J.; Xie, W.; Yu, X.; Zhang, Z.; Zhao, Y.; Wang, N.; Wang, Y. Selection of suitable reference genes for RT-qPCR gene expression analysis in Siberian wild rye (Elymus sibiricus) under different experimental conditions. Genes 2019, 10, 451. [Google Scholar] [CrossRef]
- Gao, M.; Liu, Y.; Ma, X.; Shuai, Q.; Gai, J.; Li, Y. Evaluation of Reference Genes for Normalization of Gene Expression Using Quantitative RT-PCR under Aluminum, Cadmium, and Heat Stresses in Soybean. PLoS ONE 2017, 12, e0168965. [Google Scholar] [CrossRef]
- Galli, V.; Borowski, J.M.; Perin, E.C.; Da Silva Messias, R.; Labonde, J.; Dos Santos Pereira, I.; Silva, S.D.; Rombaldi, C.V. Validation of reference genes for accurate normalization of gene expression for real time-quantitative PCR in strawberry fruits using different cultivars and osmotic stresses. Gene 2015, 554, 205–214. [Google Scholar] [CrossRef]
- Yang, Q.; Yin, J.; Li, G.; Qi, L.; Yang, F.; Wang, R.; Li, G. Reference gene selection for qRT-PCR in Caragana korshinskii Kom. under different stress conditions. Mol. Biol. Rep. 2014, 41, 2325–2334. [Google Scholar] [CrossRef]
- Jain, M.; Tian, C.; Jiang, Q.; Wang, F.; Wang, G.L.; Xu, Z.S.; Xiong, A.S. Selection of suitable reference genes for qPCR normalization under abiotic stresses and hormone stimuli in carrot leaves. PLoS ONE 2015, 10, e0117569. [Google Scholar] [CrossRef]
- Silver, N.; Best, S.; Jiang, J.; Thein, S.L. Selection of housekeeping genes for gene expression studies in human reticulocytes using real-time PCR. BMC Mol. Biol. 2006, 7, 33. [Google Scholar] [CrossRef] [PubMed]
- Vandesompele, J.; De Preter, K.; Pattyn, F.; Poppe, B.; Van Roy, N.; De Paepe, A.; Speleman, F. Accurate normalization of real-time quantitative RT-PCR data by geometric averaging of multiple internal control genes. Genome Biol. 2002, 3, research0034. [Google Scholar] [CrossRef] [PubMed]
- Pfaffl, M.W.; Tichopad, A.; Prgomet, C.; Neuvians, T.P. Determination of stable housekeeping genes, differentially regulated target genes and sample integrity: BestKeeper–Excel-based tool using pair-wise correlations. Biotechnol. Lett. 2004, 26, 509–515. [Google Scholar] [CrossRef]
- Andersen, C.L.; Jensen, J.L.; Orntoft, T.F. Normalization of real-time quantitative reverse transcription-PCR data: A model-based variance estimation approach to identify genes suited for normalization, applied to bladder and colon cancer data sets. Cancer Res. 2004, 64, 5245–5250. [Google Scholar] [CrossRef]
- De Spiegelaere, W.; Dern-Wieloch, J.; Weigel, R.; Schumacher, V.; Schorle, H.; Nettersheim, D.; Bergmann, M.; Brehm, R.; Kliesch, S.; Vandekerckhove, L.; et al. Reference gene validation for RT-qPCR, a note on different available software packages. PLoS ONE 2015, 10, e0122515. [Google Scholar] [CrossRef]
- Cao, F.; Cheng, H.; Cheng, S.; Li, L.; Xu, F.; Yu, W.; Yuan, H. Expression of selected Ginkgo biloba heat shock protein genes after cold treatment could be induced by other abiotic stress. Int. J. Mol. Sci. 2012, 13, 5768–5788. [Google Scholar] [CrossRef]
- Yao, X.; Zhou, G.S.; Tang, Y.P.; Qian, Y.F.; Guan, H.L.; Pang, H.; Zhu, S.; Mo, X.; Su, S.L.; Jin, C.; et al. Simultaneous quantification of flavonol glycosides, terpene lactones, biflavones, proanthocyanidins, and ginkgolic acids in Ginkgo biloba leaves from fruit cultivars by ultrahigh-performance liquid chromatography coupled with triple quadrupole mass spectrometry. Biomed. Res. Int. 2013, 2013, 582591. [Google Scholar] [CrossRef]
- Ude, C.; Schubert-Zsilavecz, M.; Wurglics, M. Ginkgo biloba extracts: A review of the pharmacokinetics of the active ingredients. Clin. Pharmacokinet. 2013, 52, 727–749. [Google Scholar] [CrossRef]
- Kressmann, S.; Müller, W.; Blume, H. Pharmaceutical quality of different Ginkgo biloba brands. J. Pharm. Pharmacol. 2010, 54, 661–669. [Google Scholar] [CrossRef]
- Mohanta, T.K.; Tamboli, Y.; Zubaidha, P.K. Phytochemical and medicinal importance of Ginkgo biloba L. Nat. Prod. Res. 2014, 28, 746–752. [Google Scholar] [CrossRef] [PubMed]
- Zhang, Y.; Liu, P.; Kong, Q.; Xing, S.; Liu, X.; Sun, L. The contents of terpene trilactone and flavonoid in leaves of seedlings from ancient female Ginkgo trees in China. Hortic. Plant J. 2017, 3, 165–171. [Google Scholar] [CrossRef]
- Yao, X.; Shang, E.; Zhou, G.; Tang, Y.; Guo, S.; Su, S.; Jin, C.; Qian, D.; Qin, Y.; Duan, J.A. Comparative characterization of total flavonol glycosides and terpene lactones at different ages, from different cultivation sources and genders of Ginkgo biloba leaves. Int. J. Mol. Sci. 2012, 13, 10305–10315. [Google Scholar] [CrossRef]
- Lobstein, A.; Rietsch-Jako, L.; Haag-Berrurier, M.; Anton, R. Seasonal variations of the flavonoid content from Ginkgo biloba leaves. Planta Med. 1991, 57, 430–433. [Google Scholar] [CrossRef]
- Chiu, K.L.; Cheng, Y.C.; Chen, J.H.; Chang, C.J.; Yang, P.W. Supercritical fluids extraction of Ginkgo ginkgolides and flavonoids. J. Supercrit. Fluids 2002, 24, 77–87. [Google Scholar] [CrossRef]
- Miao, S.F.; Yu, J.P.; Du, Z.; Guan, Y.X.; Yao, S.J.; Zhu, Z.Q. Supercritical fluid extraction and micronization of Ginkgo flavonoids from Ginkgo biloba leaves. Ind. Eng. Chem. Res. 2010, 49, 5461–5466. [Google Scholar] [CrossRef]
- Chen, S.; Xing, X.H.; Huang, J.J.; Xu, M.S. Enzyme-assisted extraction of flavonoids from Ginkgo biloba leaves: Improvement effect of flavonol transglycosylation catalyzed by Penicillium decumbens cellulase. Enzyme Microb. Technol. 2011, 48, 100–105. [Google Scholar] [CrossRef] [PubMed]
- Sati, P.; Dhyani, P.; Bhatt, I.D.; Pandey, A. Ginkgo biloba flavonoid glycosides in antimicrobial perspective with reference to extraction method. J. Tradit. Complement. Med. 2019, 9, 15–23. [Google Scholar] [CrossRef]
- Han, S.; Wu, Z.; Jin, Y.; Yang, W.; Shi, H. RNA-Seq analysis for transcriptome assembly, gene identification, and SSR mining in Ginkgo (Ginkgo biloba L.). Tree Genet. Genomes 2015, 11, 37. [Google Scholar] [CrossRef]
- Wu, Y.; Guo, J.; Zhou, Q.; Xin, Y.; Wang, G.; Xu, L.A. De novo transcriptome analysis revealed genes involved in flavonoid biosynthesis, transport and regulation in Ginkgo biloba. Ind. Crops Prod. 2018, 124, 226–235. [Google Scholar] [CrossRef]
- Zhou, X.; Liao, Y.; Kim, S.U.; Chen, Z.; Nie, G.; Cheng, S.; Ye, J.; Xu, F. Genome-wide identification and characterization of bHLH family genes from Ginkgo biloba. Sci. Rep. 2020, 10, 13723. [Google Scholar] [CrossRef] [PubMed]
- Rao, S.; Meng, X.; Liao, Y.; Yu, T.; Cao, J.; Tan, J.; Xu, F.; Cheng, S. Characterization and functional analysis of two novel 3-hydroxy-3-methylglutaryl-coenzyme A reductase genes (GbHMGR2 and GbHMGR3) from Ginkgo biloba. Sci. Rep. 2019, 9, 14109. [Google Scholar] [CrossRef] [PubMed]
- Nagano, A.J.; Kawagoe, T.; Sugisaka, J.; Honjo, M.N.; Iwayama, K.; Kudoh, H. Annual transcriptome dynamics in natural environments reveals plant seasonal adaptation. Nat. Plants 2019, 5, 74–83. [Google Scholar] [CrossRef] [PubMed]
- Covington, M.F.; Maloof, J.N.; Straume, M.; Kay, S.A.; Harmer, S.L. Global transcriptome analysis reveals circadian regulation of key pathways in plant growth and development. Genome Biol. 2008, 9, R130. [Google Scholar] [CrossRef] [PubMed]
- Zheng, C.; Wang, Y.; Ding, Z.; Zhao, L. Global transcriptional analysis reveals the complex relationship between tea quality, leaf senescence and the responses to cold-drought combined stress in Camellia sinensis. Front. Plant Sci. 2016, 7, 1858. [Google Scholar] [CrossRef]
- Migocka, M.; Papierniak, A. Identification of suitable reference genes for studying gene expression in cucumber plants subjected to abiotic stress and growth regulators. Mol. Breed. 2010, 28, 343–357. [Google Scholar] [CrossRef]
- Niu, X.; Chen, M.; Huang, X.; Chen, H.; Tao, A.; Xu, J.; Qi, J. Reference gene selection for qRT-PCR normalization analysis in kenaf (Hibiscus cannabinus L.) under abiotic stress and hormonal stimuli. Front. Plant Sci. 2017, 8, 771. [Google Scholar] [CrossRef]
- Zhang, Y.; Han, X.; Chen, S.; Zheng, L.; He, X.; Liu, M.; Qiao, G.; Wang, Y.; Zhuo, R. Selection of suitable reference genes for quantitative real-time PCR gene expression analysis in Salix matsudana under different abiotic stresses. Sci. Rep. 2017, 7, 40290. [Google Scholar] [CrossRef]
- Pang, Y.; Shen, G.A.; Liu, C.; Liu, X.; Tan, F.; Sun, X.; Tang, K. Molecular cloning and sequence analysis of a novel chalcone synthase cDNA from Ginkgo biloba. DNA Seq. 2004, 15, 283–290. [Google Scholar] [CrossRef]
- Ye, J.; Cheng, S.; Zhou, X.; Chen, Z.; Kim, S.U.; Tan, J.; Zheng, J.; Xu, F.; Zhang, W.; Liao, Y. A global survey of full-length transcriptome of Ginkgo biloba reveals transcript variants involved in flavonoid biosynthesis. Ind. Crops Prod. 2019, 139, 111547. [Google Scholar] [CrossRef]
- Narsai, R.; Ivanova, A.; Ng, S.; Whelan, J. Defining reference genes in Oryza sativa using organ, development, biotic and abiotic transcriptome datasets. BMC Plant Biol. 2010, 10, 56. [Google Scholar] [CrossRef] [PubMed]
- Zhuang, H.; Fu, Y.; He, W.; Wang, L.; Wei, Y. Selection of appropriate reference genes for quantitative real-time PCR in Oxytropis ochrocephala Bunge using transcriptome datasets under abiotic stress treatments. Front. Plant Sci. 2015, 6, 475. [Google Scholar] [CrossRef] [PubMed]
- Zhou, Z.; Cong, P.; Tian, Y.; Zhu, Y. Using RNA-seq data to select reference genes for normalizing gene expression in apple roots. PLoS ONE 2017, 12, e0185288. [Google Scholar] [CrossRef]
- Radonić, A.; Thulke, S.; Mackay, I.M.; Landt, O.; Siegert, W.; Nitsche, A. Guideline to reference gene selection for quantitative real-time PCR. Biochem. Biophys. Res. Commun. 2004, 313, 856–862. [Google Scholar] [CrossRef] [PubMed]
- Livak, K.J.; Schmittgen, T.D. Analysis of relative gene expression data using real-time quantitative PCR and the 2−ΔΔCT method. Methods 2001, 25, 402–408. [Google Scholar] [CrossRef]
- Dheda, K. Validation of housekeeping genes for normalizing RNA expression in real-time PCR. Biotechniques 2004, 37, 118–119. [Google Scholar] [CrossRef]
- Dheda, K.; Huggett, J.F.; Chang, J.S.; Kim, L.U.; Bustin, S.A.; Johnson, M.A.; Rook, G.A.W.; Zumla, A. The implications of using an inappropriate reference gene for real-time reverse transcription PCR data normalization. Anal. Biochem. 2005, 344, 141–143. [Google Scholar] [CrossRef]
- Shinozaki, K.; Yamaguchi-Shinozaki, K.; Seki, M. Regulatory network of gene expression in the drought and cold stress responses. Curr. Opin. Plant Biol. 2003, 6, 410–417. [Google Scholar] [CrossRef]
- Chinnusamy, V.; Zhu, J.; Zhu, J.K. Cold stress regulation of gene expression in plants. Trends Plant Sci. 2007, 12, 444–451. [Google Scholar] [CrossRef]
- Weinmann, S.; Roll, S.; Schwarzbach, C.; Vauth, C.; Willich, S.N. Effects of Ginkgo biloba in dementia: Systematic review and meta-analysis. BMC Geriatr. 2010, 10, 14. [Google Scholar] [CrossRef]
- Hu, Y.; Jiang, Y.; Han, X.; Wang, H.; Pan, J.; Yu, D. Jasmonate regulates leaf senescence and tolerance to cold stress: Crosstalk with other phytohormones. J. Exp. Bot. 2017, 68, 1361–1369. [Google Scholar] [CrossRef] [PubMed]
- Dong, C.H.; Hu, X.; Tang, W.; Zheng, X.; Kim, Y.S.; Lee, B.H.; Zhu, J.K. A putative Arabidopsis nucleoporin, AtNUP160, is critical for RNA export and required for plant tolerance to cold stress. Mol. Cell Biol. 2006, 26, 9533–9543. [Google Scholar] [CrossRef] [PubMed]
- Ruelland, E.; Vaultier, M.N.; Zachowski, A.; Hurry, V. Chapter 2 cold signalling and cold acclimation in plants. Adv. Bot. Res. 2009, 49, 35–150. [Google Scholar] [CrossRef]
- Xu, F.; Cheng, S.; Cheng, S.; Wang, Y.; Du, H. Time course of expression of chalcone synthase gene in Ginkgo biloba. J.Plant Physiol. Mol. Biol. 2007, 33, 309. [Google Scholar]
- Lo Piero, A.R.; Puglisi, I.; Rapisarda, P.; Petrone, G. Anthocyanins accumulation and related gene expression in red orange fruit induced by low temperature storage. J. Agric. Food Chem. 2005, 53, 9083–9088. [Google Scholar] [CrossRef]
- Wu, X.; Zhang, S.; Liu, X.; Shang, J.; Zhang, A.; Zhu, Z.; Zha, D. Chalcone synthase (CHS) family members analysis from eggplant (Solanum melongena L.) in the flavonoid biosynthetic pathway and expression patterns in response to heat stress. PLoS ONE 2020, 15, e0226537. [Google Scholar]
- Peng, X.; Wu, H.; Chen, H.; Zhang, Y.; Qiu, D.; Zhang, Z. Transcriptome profiling reveals candidate flavonol-related genes of Tetrastigma hemsleyanum under cold stress. BMC Genom. 2019, 20, 687. [Google Scholar] [CrossRef]
- Anjum, S.A.; Wang, L.; Farooq, M.; Khan, I.; Xue, L. Methyl jasmonate-induced alteration in lipid peroxidation, antioxidative defence system and yield in soybean under drought. J. Agron. Crop Sci. 2011, 197, 296–301. [Google Scholar] [CrossRef]
- Wang, J.; Qian, J.; Yao, L.; Lu, Y. Enhanced production of flavonoids by methyl jasmonate elicitation in cell suspension culture of Hypericum perforatum. Bioresour. Bioprocess. 2015, 2, 5. [Google Scholar] [CrossRef]
- Martin, D.M.; Gershenzon, J.; Bohlmann, J. Induction of volatile terpene biosynthesis and diurnal emission by methyl jasmonate in foliage of Norway spruce. Plant Physiol. 2003, 132, 1586–1599. [Google Scholar] [CrossRef]
- Shi, J.; Ma, C.; Qi, D.; Lv, H.; Yang, T.; Peng, Q.; Chen, Z.; Lin, Z. Transcriptional responses and flavor volatiles biosynthesis in methyl jasmonate-treated tea leaves. BMC Plant Biol. 2015, 15, 233. [Google Scholar] [CrossRef] [PubMed]
- Zheng, J.; Zhang, X.; Fu, M.; Zeng, H.; Ye, J.; Zhang, W.; Liao, Y.; Xu, F. Effects of different stress treatments on the total terpene trilactone content and expression levels of key genes in Ginkgo biloba leaves. Plant Mol. Biol. Rep. 2020. [Google Scholar] [CrossRef]
- Awasthi, P.; Mahajan, V.; Jamwal, V.L.; Kapoor, N.; Rasool, S.; Bedi, Y.S.; Gandhi, S.G. Cloning and expression analysis of chalcone synthase gene from Coleus forskohlii. J. Genet. 2016, 95, 647–657. [Google Scholar] [CrossRef]
- Chen, J.; Wang, J.; Wang, R.; Xian, B.; Ren, C.; Liu, Q.; Wu, Q.; Pei, J. Integrated metabolomics and transcriptome analysis on flavonoid biosynthesis in safflower (Carthamus tinctorius L.) under MeJA treatment. BMC Plant Biol. 2020, 20, 353. [Google Scholar] [CrossRef] [PubMed]
- Chen, S.; Pan, X.; Li, Y.; Cui, L.; Zhang, Y.; Zhang, Z.; Pan, G.; Yang, J.; Cao, P.; Yang, A. Identification and characterization of chalcone synthase gene family members in Nicotiana tabacum. J. Plant Growth Regul. 2017, 36, 374–384. [Google Scholar] [CrossRef]
- Wang, Z.; Yu, Q.; Shen, W.; El Mohtar, C.A.; Zhao, X.; Gmitter, F.G., Jr. Functional study of CHS gene family members in citrus revealed a novel CHS gene affecting the production of flavonoids. BMC Plant Biol. 2018, 18, 189. [Google Scholar] [CrossRef] [PubMed]
- Zhan, X.; Luo, X.; He, J.; Zhang, C.; Liao, X.; Xu, X.; Feng, S.; Yu, C.; Jiang, Z.; Meng, Y.; et al. Bioactive compounds induced in Physalis angulata L. by methyl-jasmonate: An investigation of compound accumulation patterns and biosynthesis-related candidate genes. Plant Mol. Biol. 2020, 103, 341–354. [Google Scholar] [CrossRef] [PubMed]
- De Almeida, M.R.; Ruedell, C.M.; Ricachenevsky, F.K.; Sperotto, R.A.; Pasquali, G.; Fett-Neto, A.G. Reference gene selection for quantitative reverse transcription-polymerase chain reaction normalization during in vitro adventitious rooting in Eucalyptus globulus Labill. BMC Mol. Biol. 2010, 11, 73. [Google Scholar] [CrossRef]
- Jin, Y.; Liu, F.; Huang, W.; Sun, Q.; Huang, X. Identification of reliable reference genes for qRT-PCR in the ephemeral plant Arabidopsis pumila based on full-length transcriptome data. Sci. Rep. 2019, 9, 8408. [Google Scholar] [CrossRef]
- Zhang, C.; Jiang, Q.N.; Wang, Y.G.; Fu, J.X.; Dong, B.; Zhou, L.H.; Zhao, H.B. Transcriptome-based validation of proper reference genes for reverse trascription quantitative PCR analysis of Sinocalycanthus chinensis. Biol. Plant. 2020, 64, 253–257. [Google Scholar] [CrossRef]
- Wang, X.; Wu, Z.; Bao, W.; Hu, H.; Chen, M.; Chai, T.; Wang, H. Identification and evaluation of reference genes for quantitative real-time PCR analysis in Polygonum cuspidatum based on transcriptome data. BMC Plant Biol. 2019, 19, 498. [Google Scholar] [CrossRef] [PubMed]
- Sudhakar Reddy, P.; Srinivas Reddy, D.; Sivasakthi, K.; Bhatnagar-Mathur, P.; Vadez, V.; Sharma, K.K. Evaluation of sorghum [Sorghum bicolor (L.)] reference genes in various tissues and under abiotic stress conditions for quantitative real-time PCR data normalization. Front. Plant Sci. 2016, 7, 529. [Google Scholar] [CrossRef] [PubMed]
- Yang, H.; Liu, J.; Huang, S.; Guo, T.; Deng, L.; Hua, W. Selection and evaluation of novel reference genes for quantitative reverse transcription PCR (qRT-PCR) based on genome and transcriptome data in Brassica napus L. Gene 2014, 538, 113–122. [Google Scholar] [CrossRef] [PubMed]
- Zheng, T.; Chen, Z.; Ju, Y.; Zhang, H.; Cai, M.; Pan, H.; Zhang, Q. Reference gene selection for qRT-PCR analysis of flower development in Lagerstroemia indica and L. speciosa. PLoS ONE 2018, 13, e0195004. [Google Scholar] [CrossRef]
Publisher’s Note: MDPI stays neutral with regard to jurisdictional claims in published maps and institutional affiliations. |
© 2020 by the authors. Licensee MDPI, Basel, Switzerland. This article is an open access article distributed under the terms and conditions of the Creative Commons Attribution (CC BY) license (http://creativecommons.org/licenses/by/4.0/).