Article

Discovering Douglas-Fir Woodlands in the Historical Forests of Umatilla National Forest, Eastern Oregon and Washington

by
Brice B. Hanberry
1,*,
Donald C. Justice
2 and
David C. Powell
2
1
Rocky Mountain Research Station, USDA Forest Service, Rapid City, SD 57702, USA
2
Umatilla National Forest, USDA Forest Service, Pendleton, OR 97801, USA
*
Author to whom correspondence should be addressed.
Forests 2020, 11(10), 1122; https://doi.org/10.3390/f11101122
Submission received: 27 August 2020 / Revised: 16 October 2020 / Accepted: 19 October 2020 / Published: 21 October 2020
(This article belongs to the Special Issue Analysis and Management of Disturbance Effects on Forest Ecosystems)

Abstract

:
We discovered unique Douglas-fir open woodlands in the Umatilla National Forest using historical surveys. Historical ponderosa pine forests of the western United States are transitioning to denser forests comprised of a greater proportion of fire-sensitive species, including true firs. We used historical (1879 to 1887) surveys to quantify the composition and structure of the Umatilla National Forest in eastern Oregon and Washington and provided contemporary forest information for comparison. We also modeled fir and pine distributions using environmental predictors and the random forests and extreme gradient boosting classifiers. Historically, ponderosa pine and Douglas-fir comprised about 80% of all trees, with western larch relatively abundant at 10% of all trees. Currently, ponderosa pine and Douglas-fir are about 40% of all trees, while grand fir and lodgepole pine increased from rare species to about 40% of all trees. Historical density was about 165 trees/ha (trees > 12.7 cm in diameter). The wetter north unit of steep slopes and predominantly Douglas-fir was about 120 trees/ha, or open woodlands, whereas the drier, flatter south units of predominantly ponderosa pine were about 210 trees/ha, and densities of 160 and 190 trees/ha occurred on flat and gentle slopes, respectively, with predominantly ponderosa pine. Currently, Umatilla National Forest averages about 390 trees/ha; the north unit of grand fir and Douglas-fir tripled in density to 365 trees/ha, whereas the south units of ponderosa and lodgepole pines doubled in density to 410 trees/ha. Douglas-fir woodlands are an unusual combination of a relatively fire-sensitive tree species with an open structure, which may result from surface fires that remove tree regeneration, resulting in one layer of trees over an understory of herbaceous and shrubby vegetation. We interpreted that a spatially and temporally variable fire return interval favored Douglas-fir, but fires were frequent enough to allow herbaceous vegetation and shrubs to out-compete trees, maintaining the balance between trees and other vegetation in woodlands. Fire exclusion has resulted in forest-type transition and also an information deficit about circumstances under which relatively fire-sensitive Douglas-fir instead of fire-tolerant ponderosa pine would establish at low densities over large extents.

1. Introduction

Since Euro-American settlement during the late 1800s, ponderosa pine (Pinus ponderosa C. Lawson) forests of the western United States have increased in tree density, decreased in tree diameter, and shifted in composition to more fire-sensitive species, such as Douglas-fir (Pseudotsuga menziesii (Mirb.) Franco), true firs (Abies), and spruces (Picea), due to active fire exclusion in combination with increased grazing pressure, roads, and other land uses that break up fuels and fire spread [1,2,3,4,5,6,7,8,9,10,11,12,13,14]. Consequences may include increased risk of high-severity fires, due to greater fuel loads including ladder fuels from small trees that are continuous to the canopy, and increased risk of beetle infestation and drought [15,16,17,18,19,20,21,22]. Additionally, suppression of herbaceous vegetation, by surface fuels and loss of light, affects both herbaceous diversity and dependent species, such as pollinators and species that forage for insects in open forests [23]. Numerous species, chiefly birds, select large diameter trees for nesting and roosting; large diameter trees are a missing element in most current forests due to recent timber harvests [24,25,26,27,28].
Although fires have been suppressed, fires likely occurred about every 5 to 20 years, up to 35 years, in ponderosa pine forests of eastern Oregon and Washington [29,30,31,32]. Arno [33] identified primarily a low-severity fire regime of 5 to 35 years with a more minor influence of mixed severity fires on a 35 to 200 year schedule for inland ponderosa or ponderosa-Douglas-fir forests, whereas Hessburg et al. [34] determined a mixed severity fire regime for the ecological area that includes Umatilla National Forest, where mixed severity fires are defined as removing 20–70% of the dominant tree basal area or canopy cover. Numerous travel accounts mention fire presence, attributed to Native Americans, in the Blue Mountains of northeastern Oregon and southeastern Washington during the 1830s and 1840s [35,36], while early surveyors estimated 10% of ponderosa pine area had been recently burned [37,38]. Munger [39] wrote: “Light, slowly spreading fires that form a blaze not more than 2 or 3 feet high and that burn chiefly the dry grass, needles, and underbrush start freely in yellow-pine forests, because for several months each summer the surface litter is dry enough to burn readily. Practically every acre of virgin yellow-pine timberland in central and eastern Oregon has been run over by fire during the lifetime of the present forest, and much of it has been repeatedly scourged.”
Lightning ignitions started frequent fires in dry ponderosa pine forests, but fire also was used by Native Americans and early settlers as a tool to manage open ecosystems, including ponderosa pine forests [40,41,42,43,44]. Indeed, prescribed burns were an established practice during the late 1800s, at least in California forests, to prevent high-severity crown fires until fire suppression became a national policy during the early 1900s [44]. Show and Kotok [44] documented that although forests were still open due to repeated fires of the past, young growth was beginning to fill up the open forest, and uncontrollable crown fire was to be expected as an inevitable consequence. Despite increased hazard from severe crown fires, Show and Kotok [44] were among those that favored fire suppression because a frequent fire regime results in understocked forests with an herbaceous ground layer, that is, loss of a valuable timber commodity to an undesirable utilization of growing space. A century later, fire suppression costs reach billions of dollars per year and lives are threatened, whereas use of prescribed fire as a preventative tool is minimal due to fire risks and smoke management constraints [45,46].
To reestablish the characteristics of open ponderosa pine forests after a long policy of fire suppression, since about 1900 in this region [31], reconstruction studies characterized the structure and composition of historical forests before high density Euro-American settlement. In northeastern Oregon’s southern Blue Mountains in part of the Malheur National Forest, Johnston et al. [47] determined tree densities of 76 trees/ha, or savannas [48], from General Land Office (GLO) surveys, for which almost all trees have diameter ≥ 12.7 cm. In part of the Blue Mountains of Oregon, Williams and Baker [49] quantified densities of about 167 trees/ha from GLO surveys, which may be classified as open woodlands verging on closed woodlands [48]. In the Cascade Mountains of central Oregon, Baker [50] calculated densities of about 250 trees/ha for dry pine (78% pine) forests from GLO surveys. We note that recent work demonstrated that the mean-based harmonic Voronoi density estimator, used by Baker [50] and Williams and Baker [49], was the most biased of tree density estimators for point-centered quarter samples, increasing densities by 1.2 to 3.8 times [51]. In central Oregon’s eastern Cascades forests, reconstructions generally showed that ponderosa pine forests had densities ranging from 35 to 170 trees/ha, for larger trees, diameter ≥ 10 cm [9,50,52,53]. Historical ponderosa pine densities reported for Oregon correspond to densities reported in the Pacific Northwest (for “mixed conifer forests”) and Southwest, generally ranging from 35 to 200 trees/ha [9,12,17].
The GLO surveys provide the most comprehensive measure of historical forests, but because they were intended as land and not tree surveys, they necessarily include some uncertainty in both species identification and density estimation. The General Land Office, created during 1812, directed the Public Land Survey System of townships and ranges. Surveyors recorded species, distance, bearing, and diameter for two to four selected bearing trees at survey points every 0.8 km along section lines. Surveys for bearing trees most closely resembled a point-centered quarter method, where each survey point was delineated into four equal quarters by cardinal directions. Although the fastest choice, which would have been incentivized by challenging accessibility during the 1800s, was to mark and measure the nearest trees, surveyors may not have selected the nearest bearing trees, resulting in bias. Surveyors may have had preferences for, or aversion to, certain tree species; for example, smooth trunks without branches are easier to blaze. For species identification, most surveyors often referred casually to major species as simply for example, pine or fir, and thus, contemporaneous accounts are necessary to help inform uncertainty. All evidence for this region indicates that the dominant widespread pine and fir species were ponderosa and Douglas-fir, whereas fire-sensitive fir species like grand fir (Abies grandis (Douglas ex D. Don) Lindl.) and postfire reproducers like lodgepole pine (Pinus contorta Douglas ex Louden) were localized to fire refugia or high-severity fire perimeters, respectively [13,39,54,55,56]. Certainly, some percentage of the unidentified species includes other pine and true fir species, but it is not likely to be possible to estimate their composition. Two options are to partition the unknown species based on identified species proportions, although this is a more reasonable approach for minor species with relatively few unidentified species, and to model identified species and predict for unknown species, although species may be identified in clusters from surveys of surveyors who followed this practice, resulting in samples with poor representation of the species distribution (as demonstrated here).
Regarding tree densities, density estimates using the point-centered quarter method and the Morisita estimator are likely to be within ±10% of the true estimate, with simple correction factors for overestimation particularly by clustered patterns, if sample sizes are at least 2000 survey points for two trees and 1000 points for three trees (after removal of the most distant tree) and if trees are randomly sampled, although different research has generated some variation in minimum sample size and greater accuracy for points with two trees [51,57,58]. Surveyors, due to survey instructions and personal decisions, did not always select the nearest tree, which leads to underestimated density (i.e., recorded trees are more distant than they should be). Adjustments give some indication of the magnitude of bias, with the range of potential densities from unadjusted for surveyor bias to maximum adjustment, if selected trees represented steps of sequential, additive sources of bias (e.g., independent, non-overlapping bias from azimuth, quadrant, species, and diameter selection) rather than a decision that encompassed minimizing and merging bias sources [59]. Likely on a landscape, the full range of densities will occur. Bias also can be roughly calculated with a rank-based method to increase density by simple adjustment factors, similar to a mean rank of up to 2 (i.e., assuming surveyors typically selected trees that were on average the second nearest), when it is not possible to determine bias [59]. In summary, while not exact, mean density estimates may be greater typically by a factor of 1.1 to 1.5 than uncorrected density estimates, whereas minimum values are 0.6 to 0.8 of the uncorrected density estimates and maximum values perhaps are greater by a factor of 1.3 to 1.8.
Here, we used GLO surveys of the Umatilla National Forest (560,000 ha) in the Blue Mountains of northeastern Oregon and southeastern Washington to reconstruct historical forests for the whole forest and by north and south units (Figure 1). Surveys occurred during 1879 to 1887, during which cattle and sheep grazing were present in the Blue Mountains since the 1870s, but commercial timber harvest did not start until railroad lines were built during the 1880s [38]. We examined historical composition, then explored the issue of unidentified fir and pine species and influence of environmental variables on fir and pine distributions, compared historical composition to current composition with incorporation of a similarity metric, and quantified historical and current tree density. According to reconstructed evidence of forests and fire, we expected predominantly variable density ponderosa pine forests that were open (<200 to 250 trees/ha for trees > 12.7 cm in diameter) with the inclusion of greater density mixed conifer forests composed of more fire-sensitive species. We compared historical composition and structure to current composition and structure from current surveys of Umatilla National Forest, anticipating increases in fire-sensitive species and density. We then discuss these historical tree surveys in the context of other developed research.

2. Materials and Methods
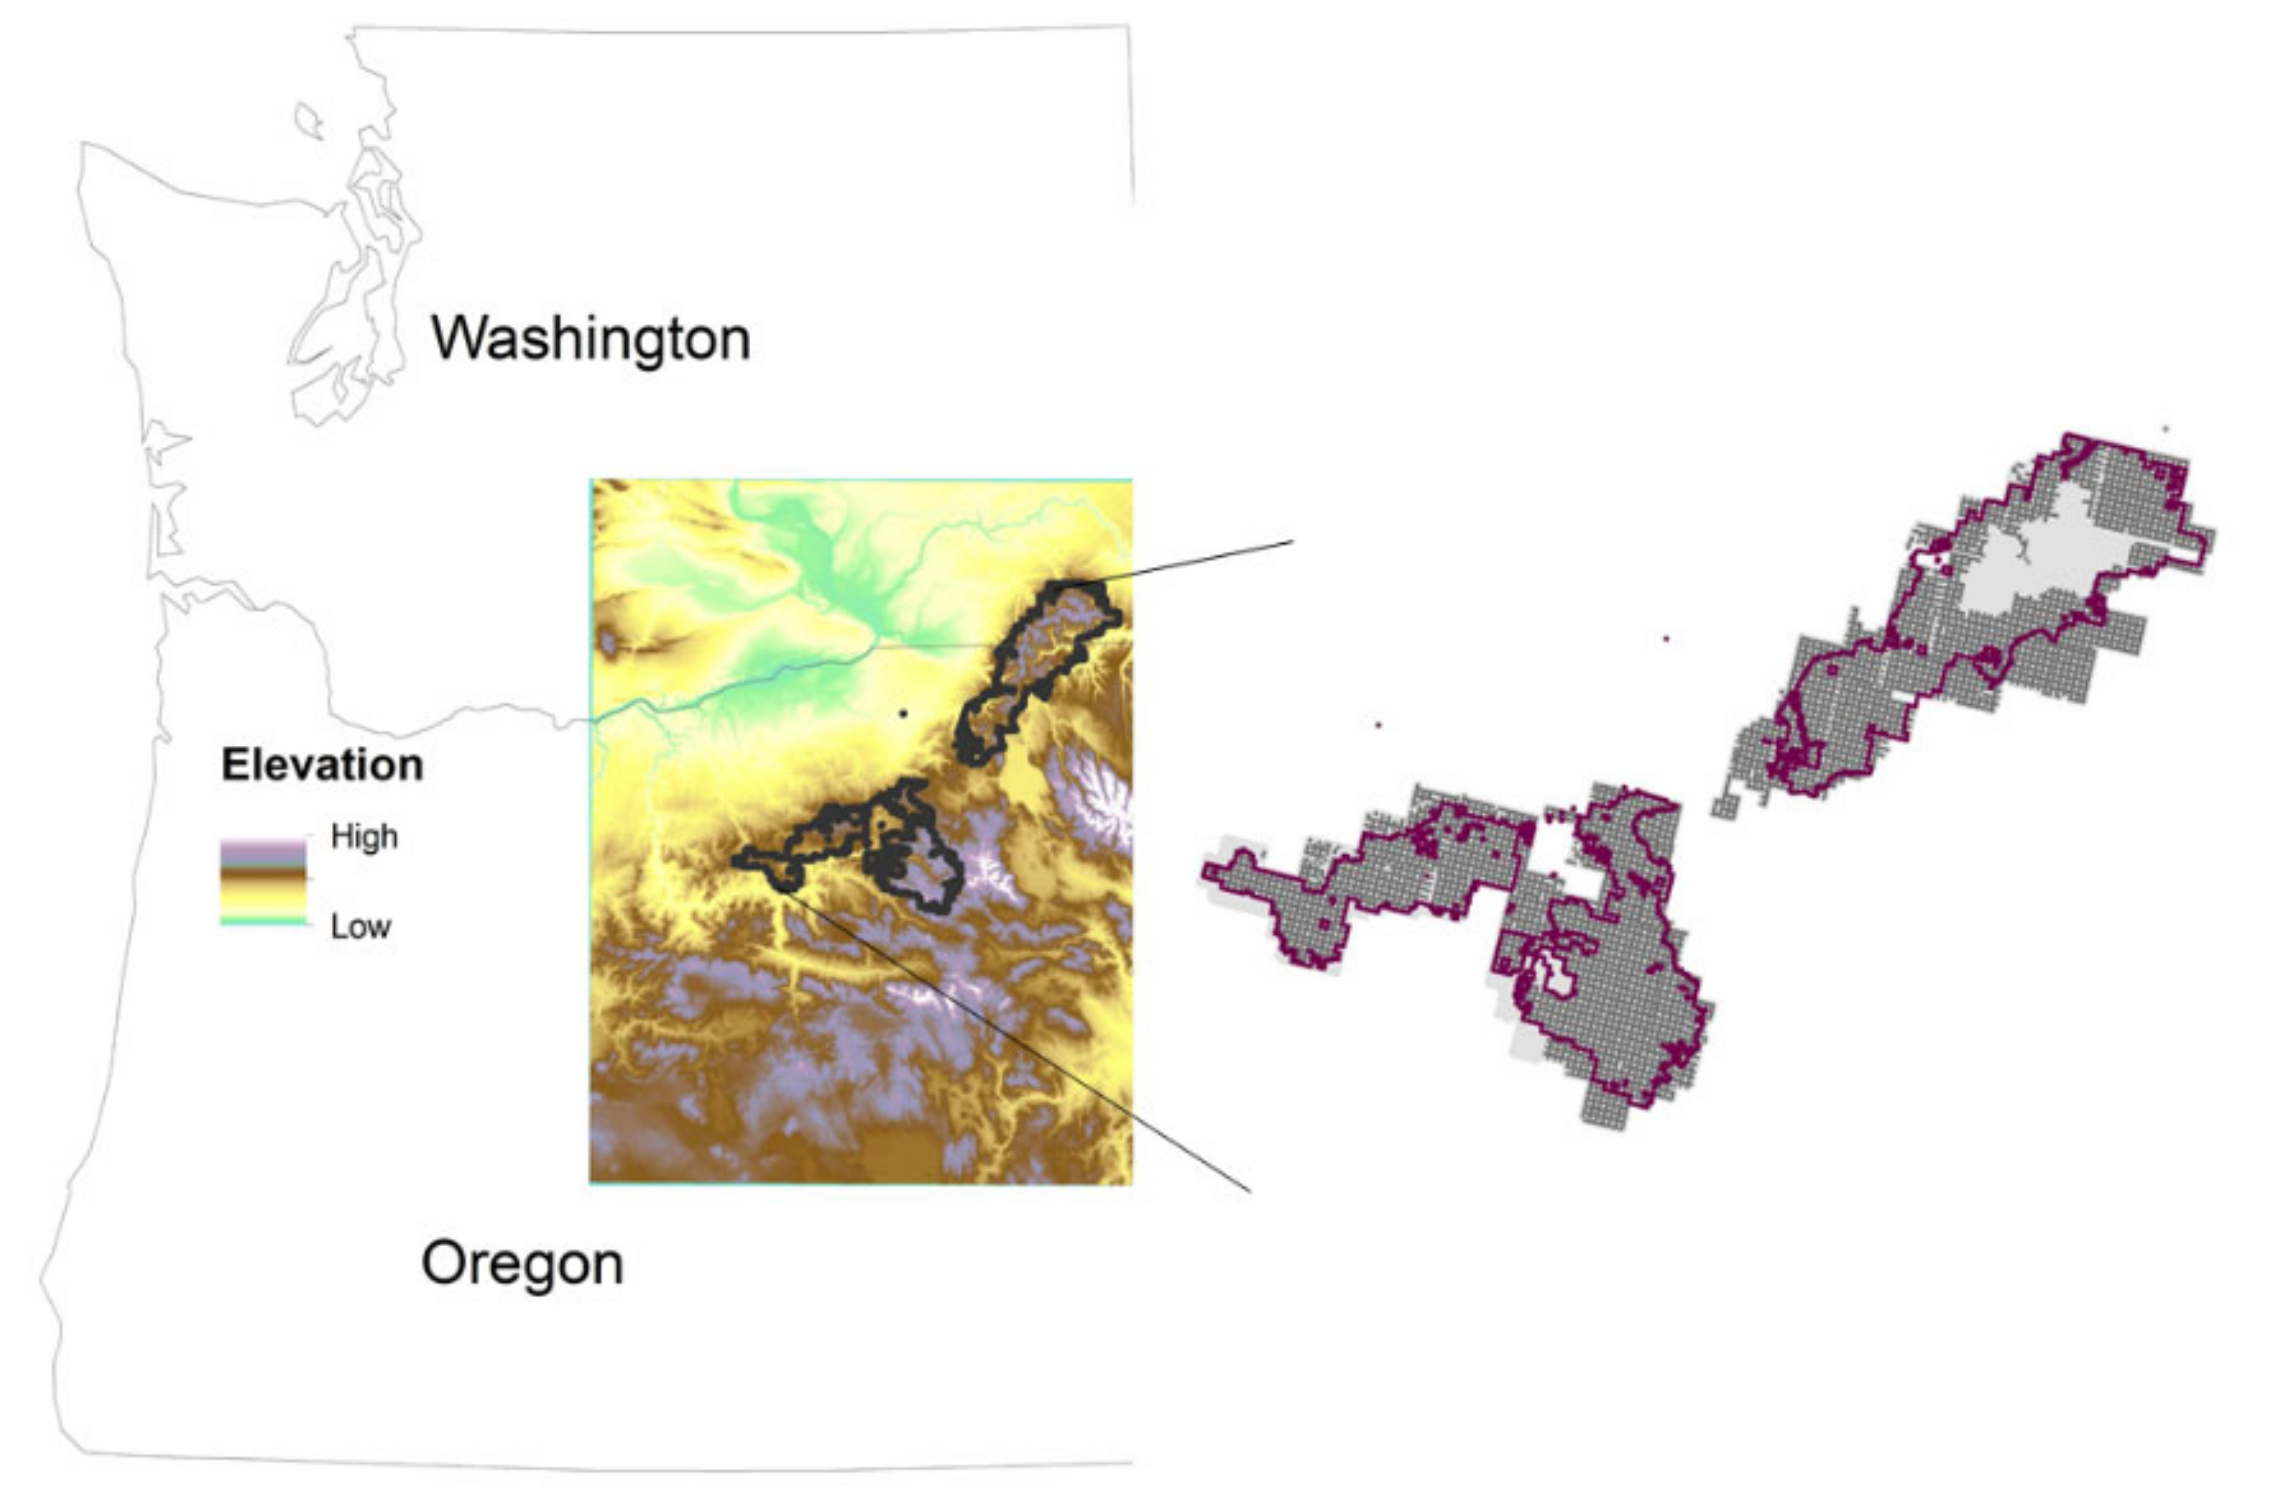
2.1. Study Area

The Umatilla National Forest has a north unit and two south units (Figure 1). The north unit is in a northern maritime or marine zone with greater precipitation and warmer winter temperatures, and steeper topography, whereas the south units are in a southern continental zone with less precipitation and a sharp temperature profile, especially during winter, and more gentle slopes. The north unit (where survey points are located) averages about 900 mm of annual precipitation and about 1250 m elevation and 20 degree slopes, whereas the south units average about 600 mm of annual precipitation and about 1410 m elevation and 12 degree slopes. The Umatilla National Forest may represent less typical “dry” forests, and particularly, the north unit may be transitional to prototypical northern Rockies moist forests. At least currently, the north unit of the Umatilla is more shrub-dominated, whereas the south is herb-dominated.

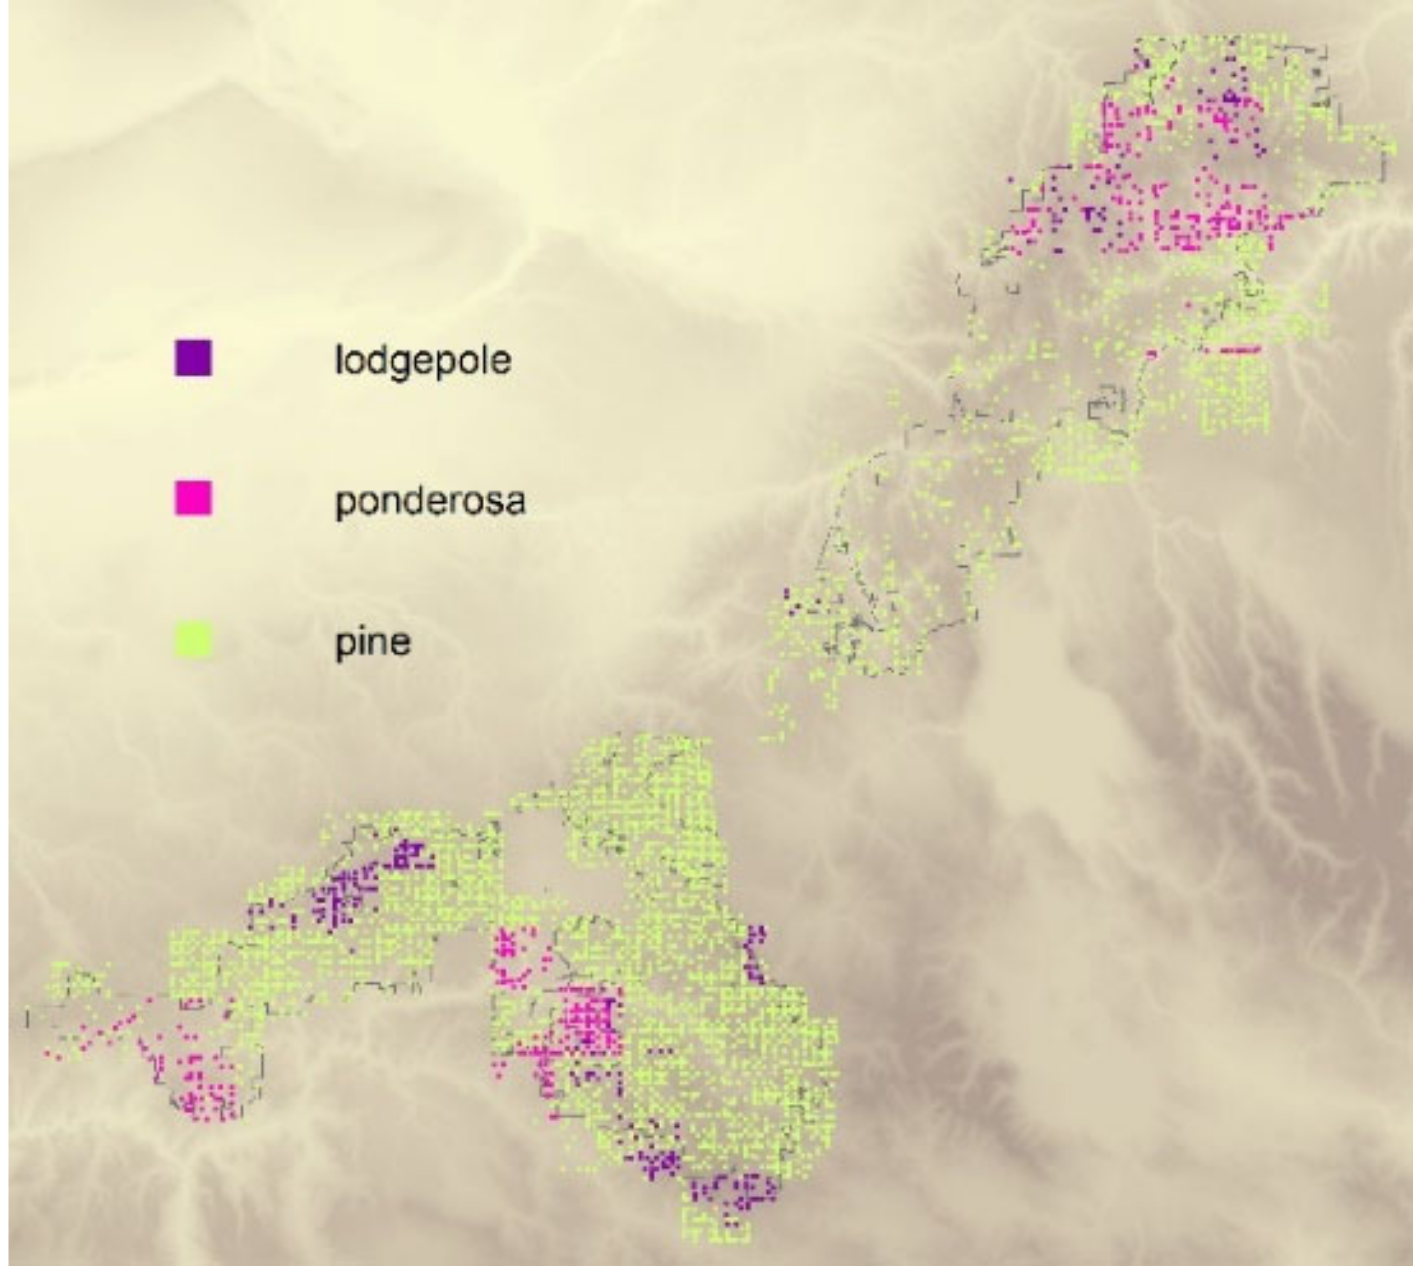
2.2. Historical Surveys and Composition

General Land Office surveys occurred in Umatilla National Forest during 1879 to 1887 for a total of 20,175 trees for trees ≥ 12.7 cm in diameter [60]. Surveyors recorded species, distance, bearing, and diameter for two to four selected bearing trees at survey points every 0.8 km along section lines, resembling a point-centered quarter, where each survey point was delineated into four equal quarters by cardinal directions. Surveyors also recorded line trees encountered along section lines, a sampling protocol that may result in less bias, but line tree sample sizes were smaller. Therefore, presentation of both surveys allows depiction of the magnitude of variation in species bias. A tree size bias may also have occurred, with a preference for moderately sized trees that would hold blazes for the longest time. However, even though the selected trees may not represent large tree diameters, a lack of measurements for small diameter trees (<7.6 cm) is not a hindrance for comparison because current tree surveys can be truncated and indeed, even modern survey methods often record small diameter trees less comprehensively than large diameter trees. Given the limited growing space, most small diameter trees are never able to compete well enough to reach the upper canopy layer, making species composition of regeneration less relevant for analysis than the composition of larger diameter trees.
We determined the historical composition of larger diameter trees (≥12.7 cm) for the entire forest and for the north and south units. To aid in species identification for trees recorded informally, we used Munger [39], a regional USDA Forest Service authority, who identified ponderosa pine and Douglas-fir as the most abundant species by far in Oregon. Thus, we grouped pine and yellow pine as ponderosa pine and fir and red fir as Douglas-fir, which was the same supposition that Powell [60] made, and a typical recording procedure by surveyors in regions where one or two species were extremely common, e.g., [61]. Black pine was lodgepole pine. Any firs recorded as white, alpine, or balsam, we grouped as a true fir, either grand or subalpine (Abies grandis, A. lasiocarpa (Hook.) Nutt.; Powell 2008 [60]).

2.3. Models of Identified and Unidentified Firs and Pines

We also examined both historical species identification and distributions of firs and pines, expecting that the results would have inherent uncertainty arising from small, clustered samples of identified species (i.e., not “fir” or “pine” designation from the majority of about 50 surveyors) or else from identifying all unknown fir species as Douglas-fir and all unknown pine species as ponderosa (Figure 2). We applied a classifier modeling approach with 19 topographic, climate, and soil predictor variables extracted from survey point locations. From a 10 m digital elevation model, we derived elevation, dissection, roughness, slope (gradient in degrees), and two wetness indices, compound topographic index and integrated moisture index [62]. From the PRISM climate group [63], we obtained 800 m annual mean temperature and precipitation from 1981 to 2010 for instrumental accuracy, realizing that temperature and precipitation have changed since the 1800s. Unfortunately, SSURGO soil coverage was incomplete and lacking at about 1000 survey points (Figure 1), but soil variables were depth to bedrock, depth to soil restriction, and organic matter depth; means (for horizon and component percentage) of available water capacity, percent sand, percent clay, organic matter, and effective cation exchange capacity; and from the major component, parent material kind (e.g., loess, volcanic ash, residuum, colluvium) and texture (ash and/or loess, all others). An additional variable was a category of three landforms, modified from two landform layers, of plateau, gentle slopes, and steep slopes. For classifiers, we used random forests and extreme gradient boosting, which are among the best performing classifiers, albeit extreme gradient boosting has not been widely assessed for ecological datasets [64] (https://www.kaggle.com/getting-started/145362), in the caret package [65,66] that trained the model with three repeats of 10-fold cross-validation (Supplementary File S1). Because some of the identified species had small sample sizes, of about 280 Douglas-fir at 180 points and 140 grand fir at 90 points (and 230 Douglas-fir and 105 grand fir with soil data), we used all samples for modeling of the identified species without reserving a test set for a separate validation. For modeling of the unidentified firs and pines, we used all samples, which had relatively equal prevalence at 7650 firs and 8680 pines, but partitioned into training (75% of samples) and test sets, and validated the model on the withheld test set [67]. The most influential variables provided a way to explore species distributions and we predicted fir and pine distributions as well.

2.4. Current Surveys and Composition

We used two data sources to determine the current composition of the larger diameter trees (≥12.7 cm) for the entire forest and for the north and south units. The Field Sampled Vegetation (FSVeg) database provides primary tree cover for every stand in the National Forest, determined by field surveys or aerial imagery (http://fsweb.nrm.fs.fed.us/support/docs.php?appname=fsveg). We imputed more exact composition from the FSVeg database by using the FSVeg Data Analyzer (https://www.fs.fed.us/fvs/software/index.shtml). We supplemented imputations from FSVeg surveys with information derived from 635 Current Vegetation Survey (CVS) plots installed and remeasured on the Umatilla National Forest between 1997 and 2005. The CVS plots, arranged on a systemic grid, consist of five subplots distributed across a circular, primary sampling unit covering one hectare of land area [68]. The CVS plots also were used as the source of current structural information. The presentation of both surveys demonstrates the magnitude of variation in species measurement bias.

2.5. Similarity Metric

To provide a measure of (dis)similarity among surveys, we applied the squared chord distance metric, which has been applied to tree genera from pollen samples and has a threshold value of 0.12 and 0.15 for divergence between samples [69]. Modern pollen samples collected from historically different forest types tend to have squared chord distance ≥ 0.15. We compared (1) two historical surveys, (2) two current surveys, and (3) historical bearing tree surveys and current 1997 to 2005 surveys for seven species or groups: Douglas-fir, true fir, ponderosa pine, lodgepole pine, spruce (Picea engelmannii Parry ex Engelm.), western juniper (Juniperus occidentalis Hook.), and western larch (Larix occidentalis Nutt.).

2.6. Historical and Current Tree Densities

We used larger diameter trees (≥12.7 cm) to calculate the tree density for the entire forest and the north and south units for both historical and current surveys. Additionally, to assess how densities changed with topography, we divided the study area into three classes based on slope gradient thresholds: flat < 2 degrees, gentle slopes 2 to 20 degrees, and steep slopes > 20 degrees. We note that for the greatest accuracy, at least 1000 (for points with four trees) to 2000 survey points (for points with two trees) are required and that fine scale density estimates may be inaccurate; the north and south units and gentle and steep slopes had about 2500 points with two trees, but flat slopes had only 260 points [59]. For historical surveys, we estimated the density for points with two trees with the Morisita plotless estimator, adjusted (decreased) the density for points with two trees, and also produced a low value based on adjustment (decreased density) for potential clustered spatial patterning, and then, adjusted (increased) the density to account for surveyor selection for trees that were not nearest to a survey point, as indicated by a rank-based method; azimuth and quadrant were not available [57,59]. For the rank-based method, we adjusted density estimates to estimate a low value, based on selected trees having a mean rank of 1.4, and mean and maximum values, assuming selected trees had a mean rank of 1.8; ranks were based on a tree selection dataset [59]. In the end, original estimates increased by a factor of 1.3 for mean density, 1.6 for maximum density, and 0.7 for minimum density. Adjustments provided correction for bias so that densities probably fall within the range from low to high estimates. Note that tree densities are based on points with two trees; therefore, estimation by species would require only using points that had that species, reducing the sample size, but that would also require an assumption that density remained the same when the species was mixed with other species. We also estimated basal area and percent stocking or growing space occupied [61]. For current surveys, we calculated density per species per plot and then, a mean density per species for all plots and the sum of species mean densities.

3. Results

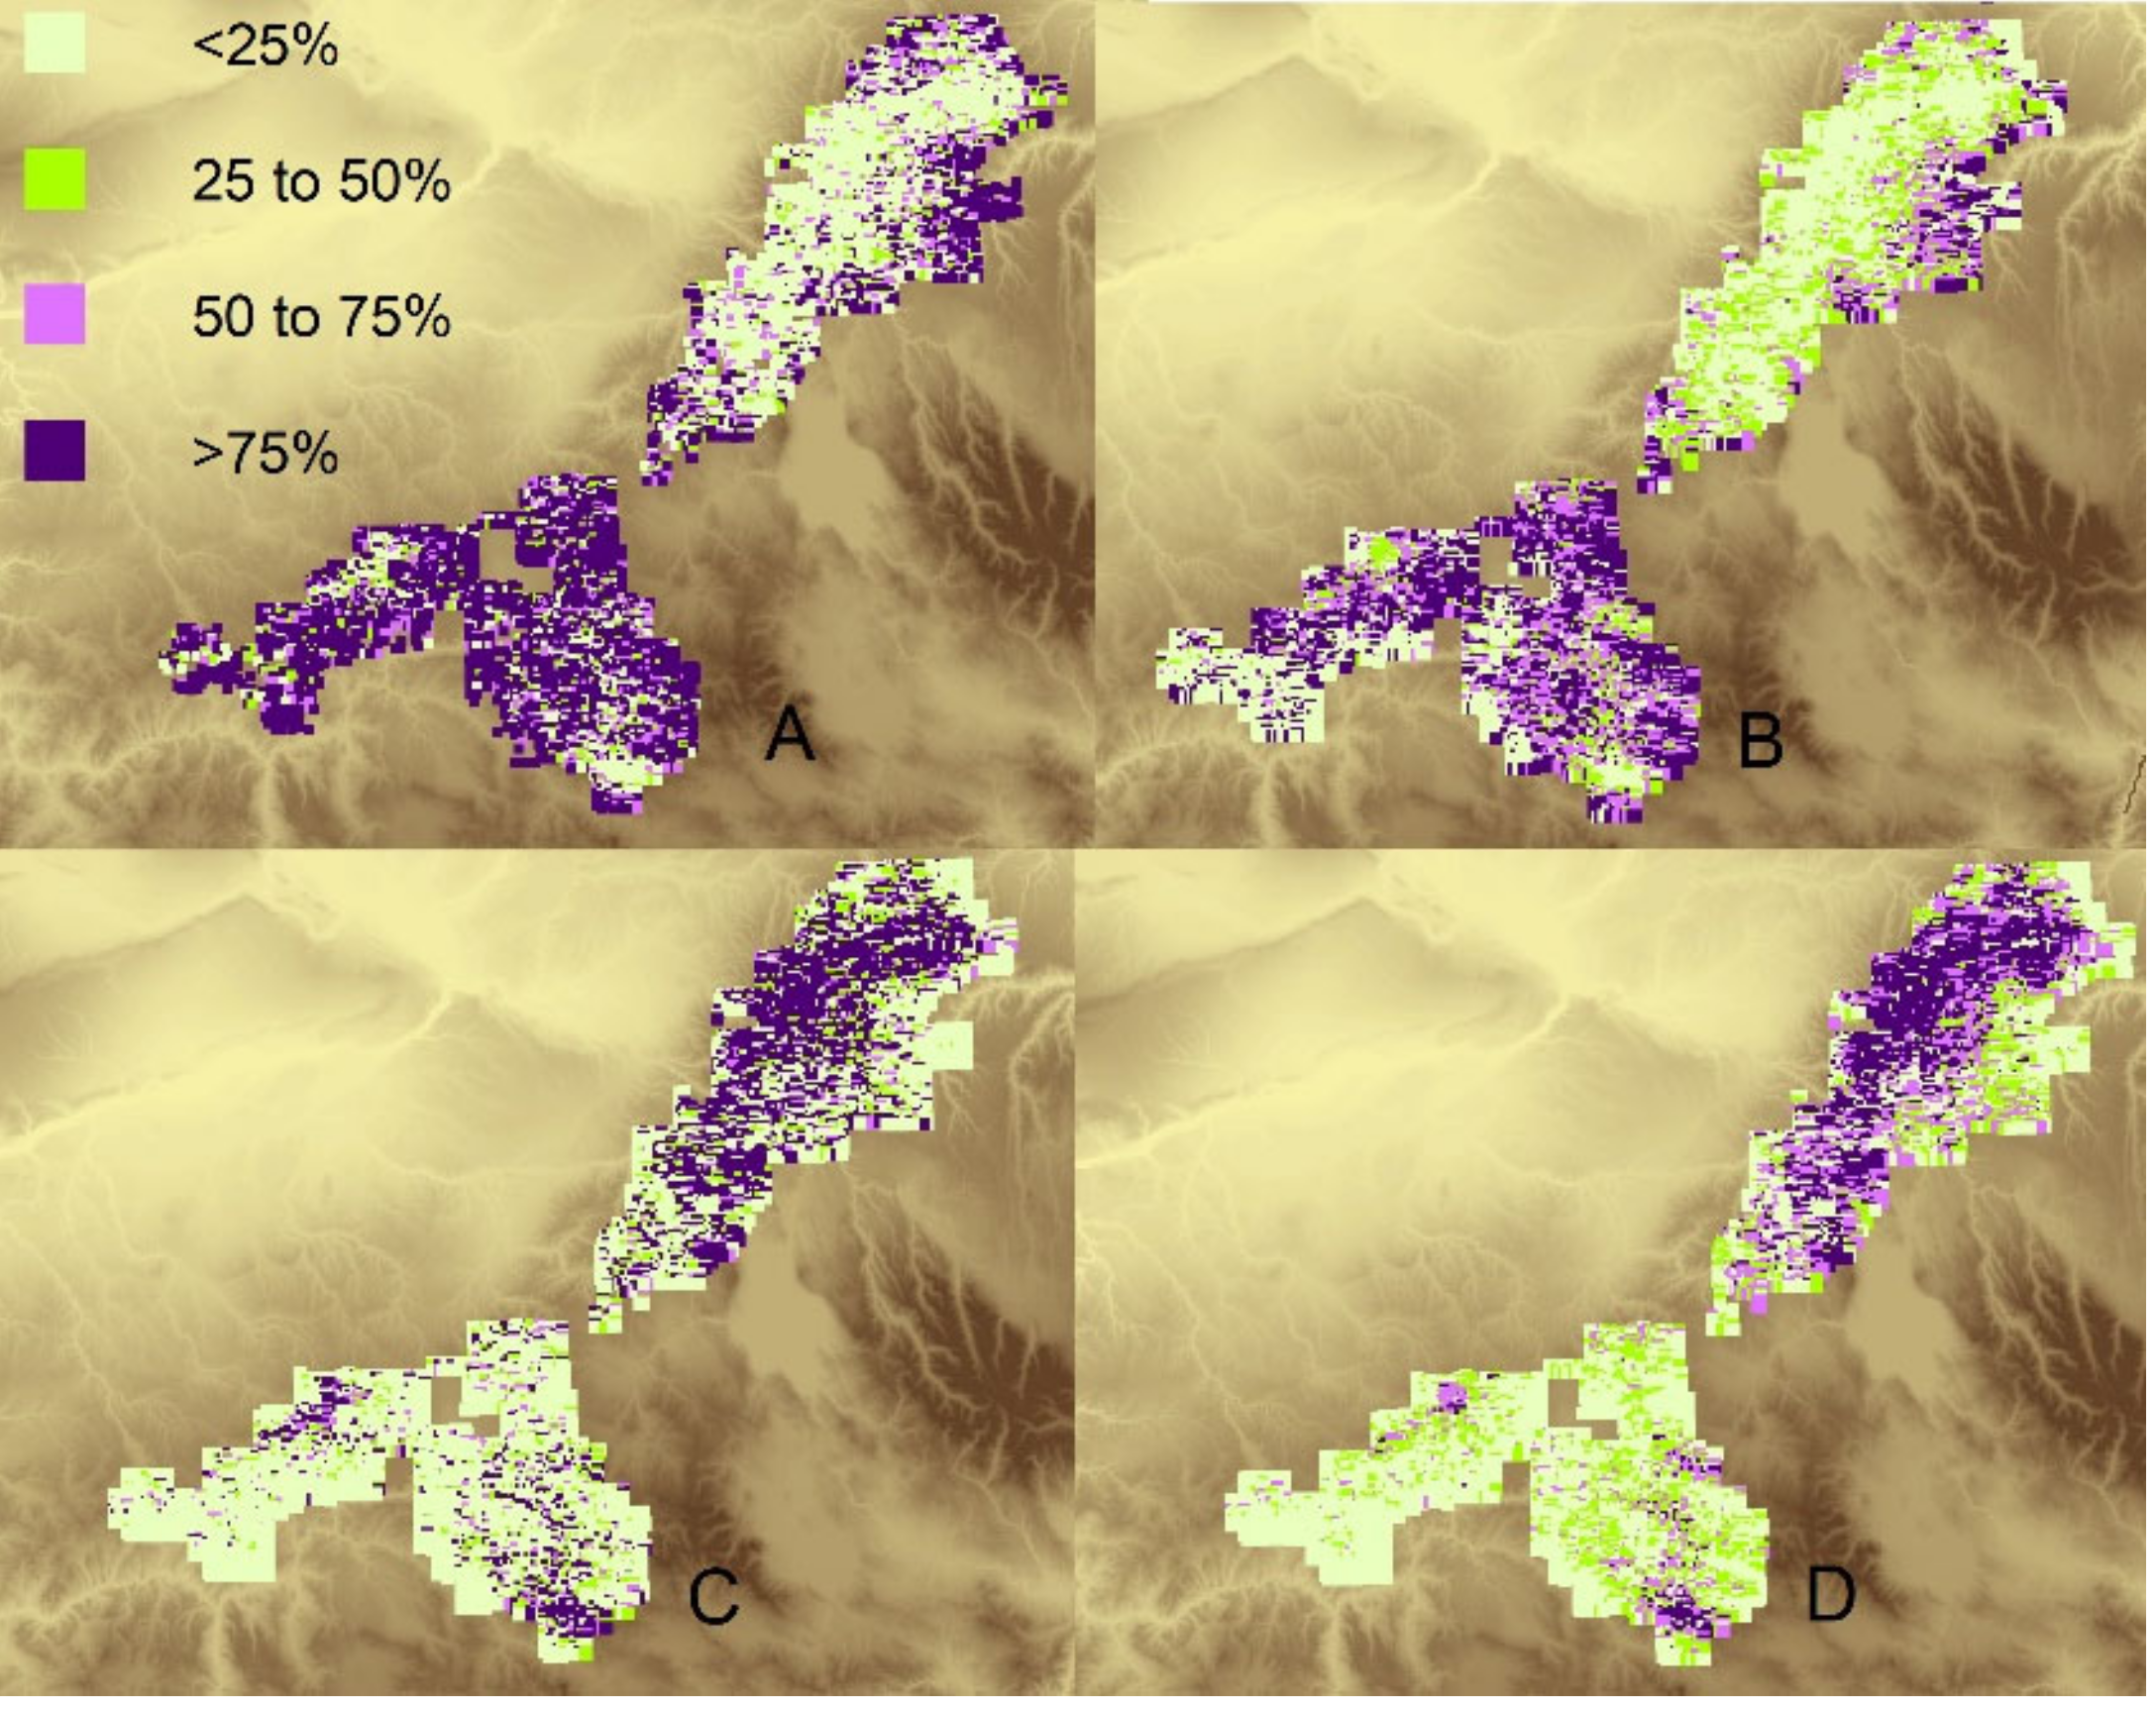
3.1. Historical Composition and Similarity

For the historical composition of the Umatilla National Forest, bearing and line tree surveys generally agreed but indicated some discrepancies (Table 1). The squared chord distance was 0.03, demonstrating similarity. In any event, both historical surveys corroborated that pine and fir, most probably ponderosa pine and Douglas-fir, together represented 81% of all trees. The first four species followed the same descending abundance order, with ponderosa pine most abundant, followed by Douglas-fir, western larch, and Engelmann spruce. In the line tree surveys, however, ponderosa pine was more abundant by 11 percentage points (54% vs. 43% of all trees) and Douglas-fir was less abundant by 11 percentage points (27% vs. 38%), whereas the other two species had comparable composition. A minor species, lodgepole pine, was more common in bearing tree surveys than line tree surveys (2.6% vs. <1%), while true firs were more common in line tree surveys (>1% vs. <1%). Bearing trees have the potential to be more biased, based on the surveyor selection of trees at survey points, whereas line trees should represent a random sample of trees along section line transects, but line trees have a small sample size. Given that there were less than 1000 line trees, we focused on bearing trees for comparison to current surveys. Even for current surveys, imputations from FSVeg do not exactly match the 1997 to 2005 surveys for the Umatilla National Forest, although the squared chord distance was very similar at 0.007.

3.2. Models of Identified and Unidentified Firs and Pines

After assignment of unidentified species, predicted by models of clustered, small samples of identified fir and pine species, Douglas-fir was 25% of all species, true fir was 8% of all species, and either option (due to classifier disagreement) was 6%. These assignments seem reasonable. However, assignment of unidentified pines produced 22% lodgepole and 21% ponderosa pine, and because we are unaware of any other lines of evidence to support these pine assignments and in fact only contradictory evidence (see Introduction section), we determined the models were unsound due to poor samples from a few clustered locations. Despite being based on unrepresentative samples, models were accurate for the full and reduced (without incomplete soil) variable sets (accuracy 0.79 to 0.81 for firs and 0.96 to 0.97 for pines).
Thus, for historical distributions of ponderosa pine and Douglas-fir, we compared unidentified pines and ponderosa pine and unidentified firs and Douglas-fir. For predictions with only one of the genera assigned as present per survey point, predictions resulted in 47% pine and 35% Douglas-fir, with the remainder as either species. Accuracy overall was 0.810 for random forests and 0.757 for extreme gradient boosting classification of the full model and 0.801 for random forests and 0.758 for extreme gradient boosting classification of the reduced (no soil) model, with better prediction of pines than firs (Table 2; only the more accurate random forests model is presented). The similar accuracies between full and reduced variable models demonstrated the influence of topographic variables to differentiate the firs and pines; precipitation, roughness, slope, and temperature were the most influential variables for both classifiers. The north unit, where Douglas-fir was predominant, is wetter, steeper, and more topographically rough than the south unit, where ponderosa pine is predominant. Predicted probabilities for the reduced model, which covered the entire extent, displayed the presence of Douglas-fir in the north unit and ponderosa pine in the south units (Figure 3).

3.3. Comparison of Historical and Current Composition and Similarity

Ponderosa pine and Douglas-fir (i.e., primarily unidentified pines and firs) decreased in relative abundance, by about 26 and 17 percentage points, respectively, currently comprising 35% or 42% of all trees, depending on the survey (i.e., FSVeg versus 1997 to 2005 surveys; Table 1). Grand fir historically was a rare species and currently is the most abundant species, increasing from <1% of all trees to 25% or 28% of all trees. Lodgepole pine also increased by about 14 percentage points, from 3% of all trees. Western larch was relatively abundant at 11% of all trees and decreased slightly, whereas Engelmann spruce was 4% of all trees and increased slightly. The squared chord distance between the historical bearing trees and 1997 to 2005 surveys was 0.41, which substantiated dissimilarity.
The north unit in the past primarily was Douglas-fir (53% of all trees), with 28% ponderosa pine and 10% western larch (Table 3). Douglas-fir decreased by about 25 percentage points, relative to all trees, to about 27% of all trees, and ponderosa pine decreased by about 20 percentage points. Western larch decreased by about 5 percentage points to about 5% of all trees. The north unit is where the greatest conversion to grand fir occurred; grand fir increased from 1% to 39% of all trees. Engelmann spruce also increased in abundance from 6% of all trees to about 11% of all trees.
The south units primarily were ponderosa pine (60% of all trees), with 23% Douglas-fir and 10% western larch (Table 3). Although ponderosa pine remained the most abundant species, even after decreasing by 32 to 38 percentage points in relative abundance, lodgepole pine increased from 4% of all trees to 27% of all trees. Grand fir increased from no presence to 14% or 18% of all trees.

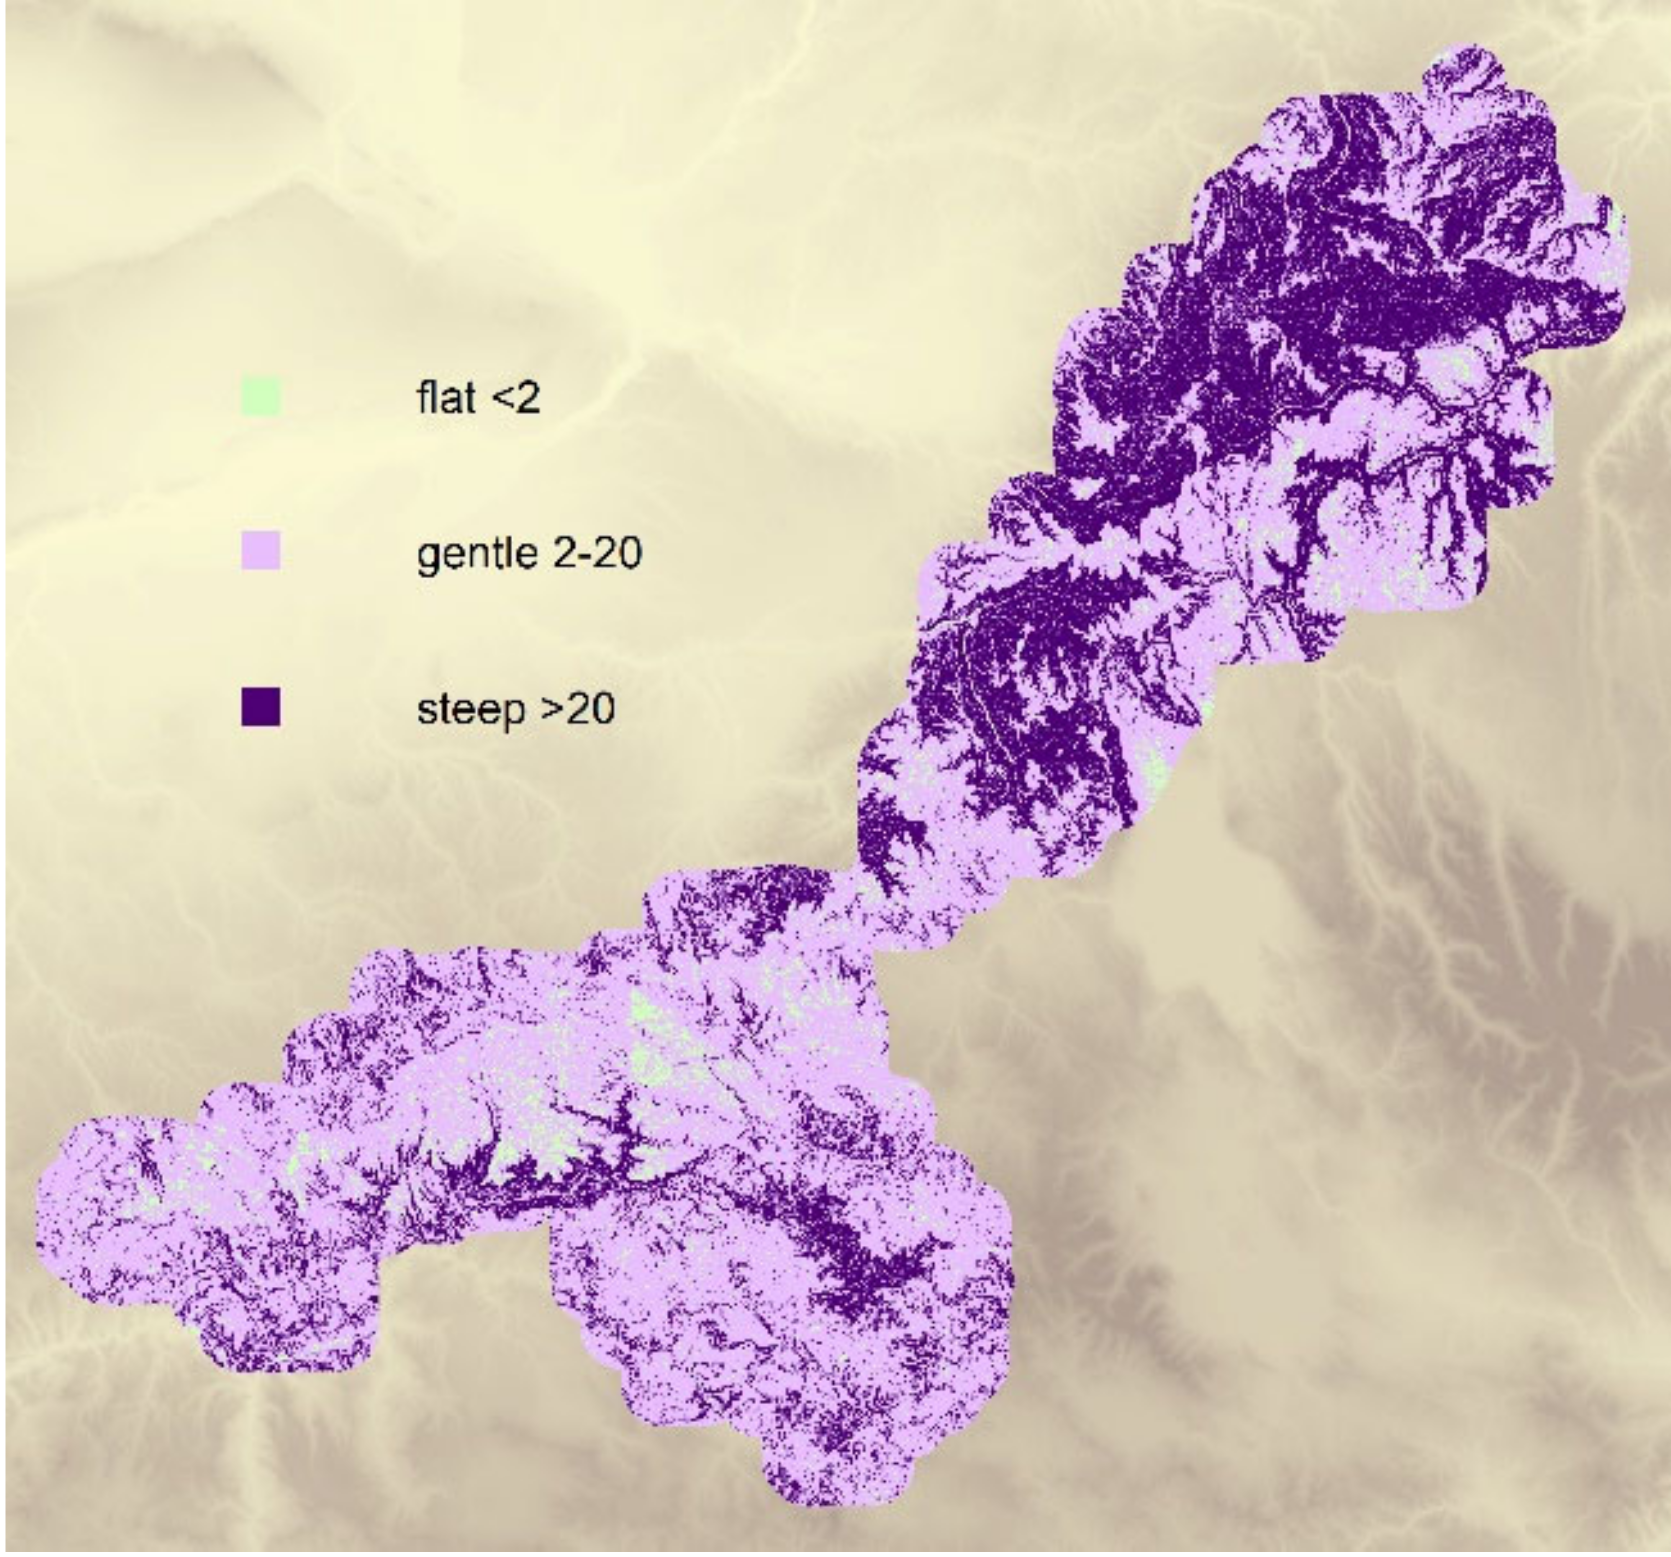
3.4. Comparison of Historical and Current Density
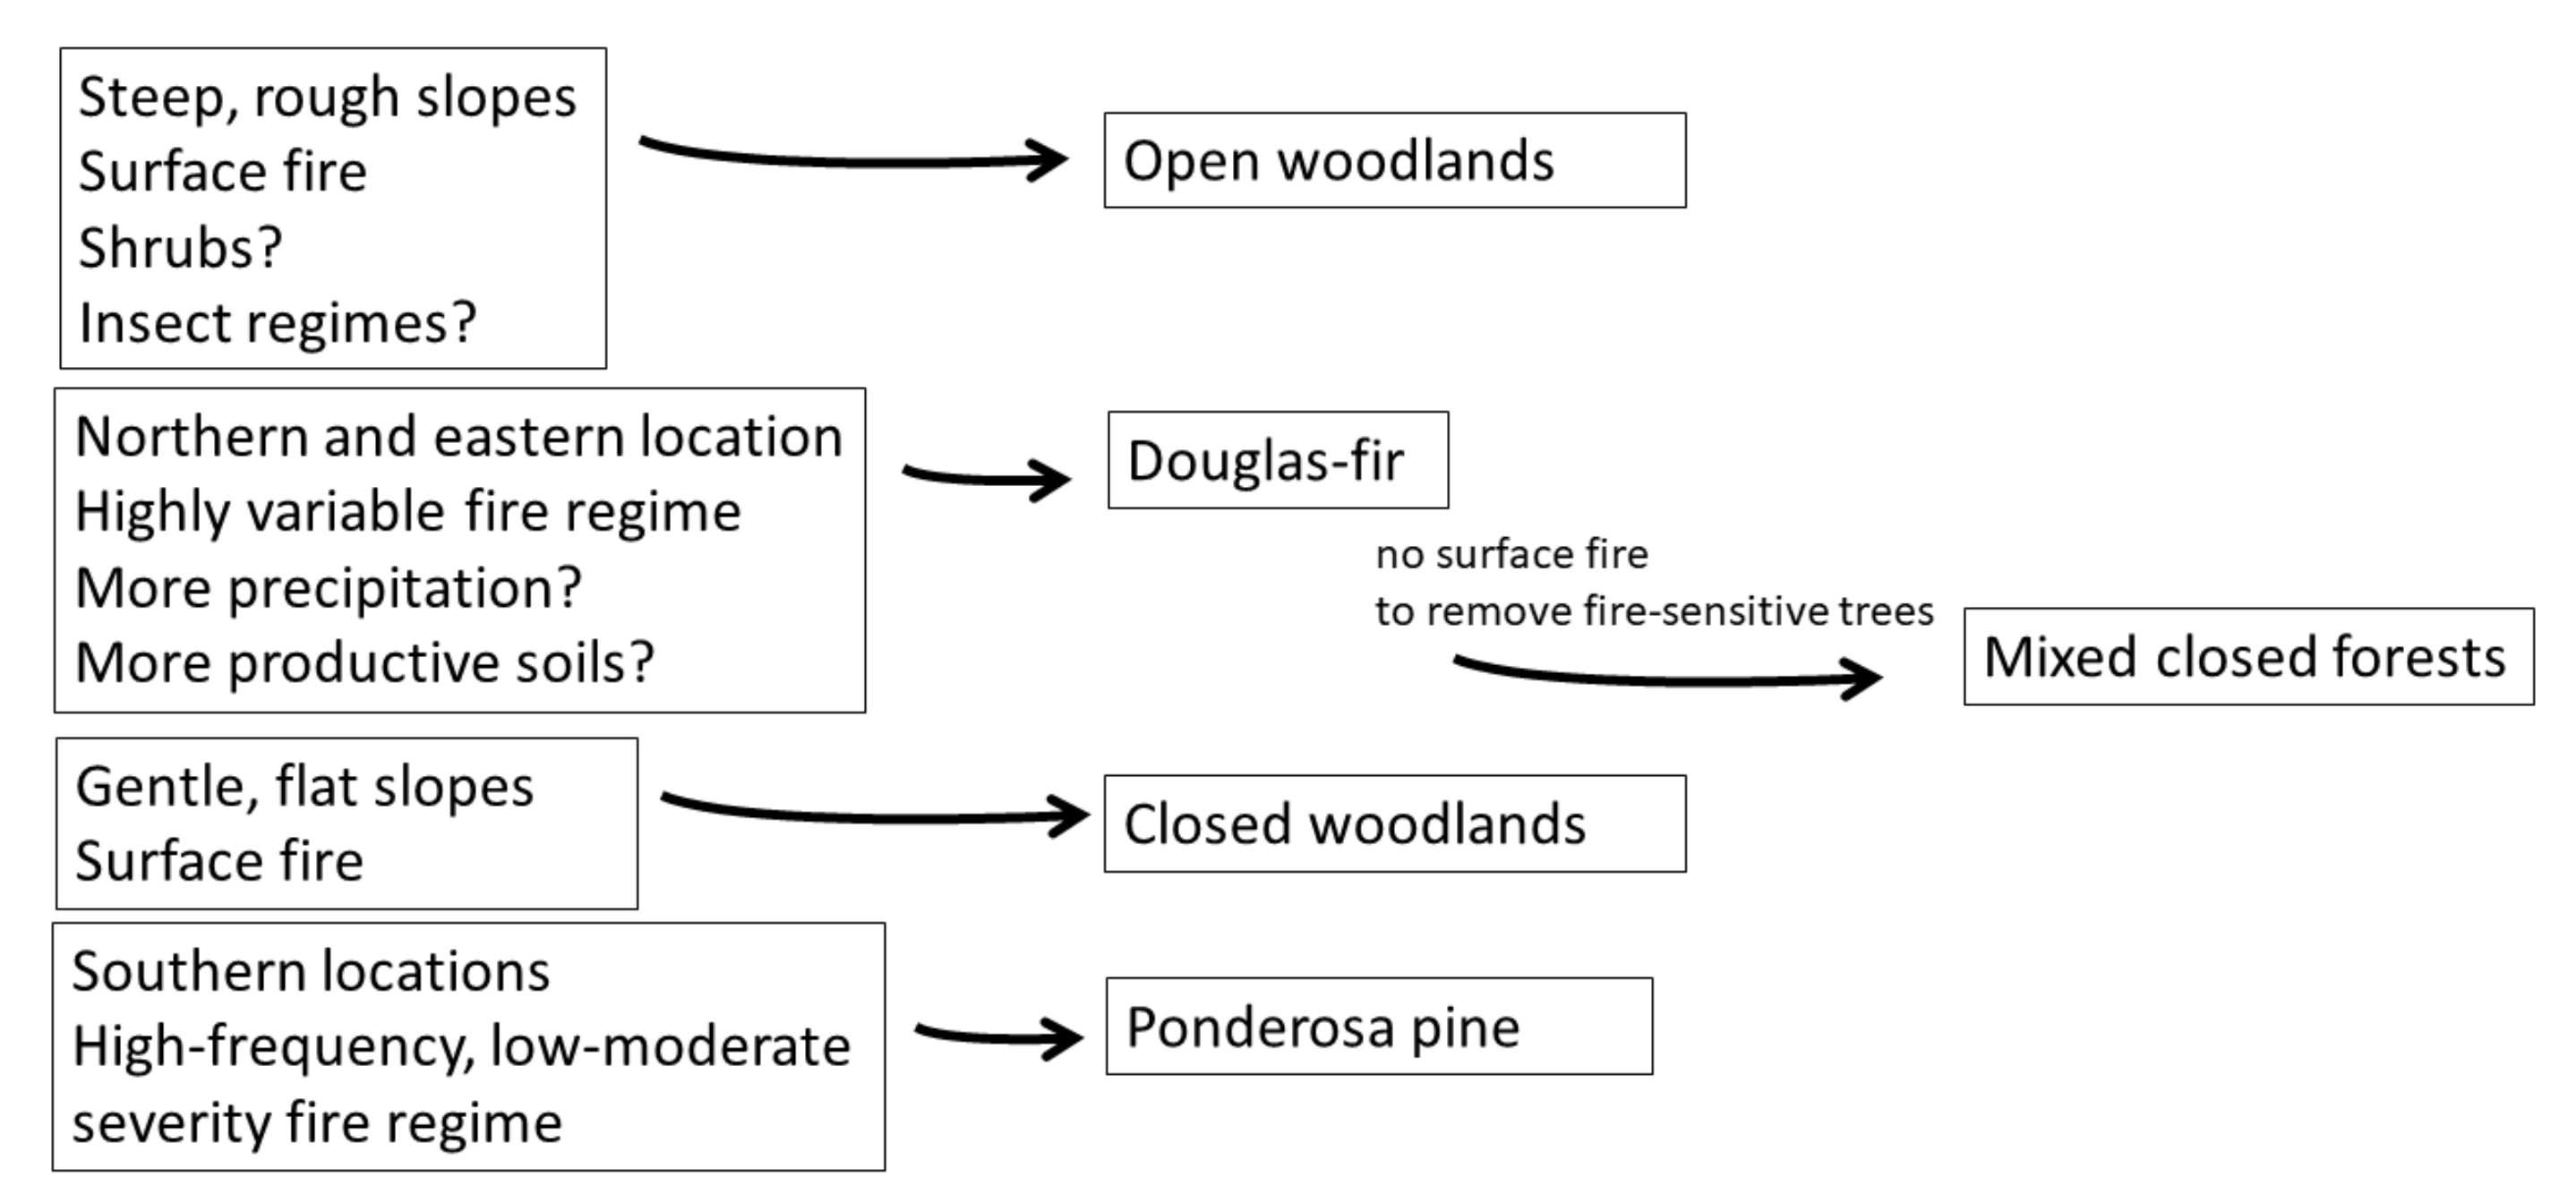
For tree density, the historical Umatilla National Forest was about 165 trees/ha (for trees > 12.7 cm; basal area = 27.8 m2/ha; Table 4). The north unit was less dense at 122 trees/ha, whereas the south units averaged 211 trees/ha. Currently, the Umatilla National Forest has about 389 trees/ha (basal area = 29.8 m2/ha). Of the two forest halves, the north unit remained less dense at 366 trees/ha, although this represents a tripling of tree density, and the south units were 412 trees/ha, a doubling of density.
Density and composition by topography exhibited that gentle slopes had the greatest density, followed by flat areas and steep slopes (Table 5, Figure 4). Douglas-fir and grand fir percentage increased with slope and ponderosa pine percentage decreased with slope. Lodgepole pine was most abundant on gentle slopes.
For data access, we archived the GLO dataset at the Forest Service archive (https://www.fs.usda.gov/rds/archive/). Current surveys are available upon request. FSVeg is a living database that is updated frequently.

4. Discussion

Historical surveys during 1879 to 1887 showed the Umatilla National Forest was predominantly open Douglas-fir woodlands in the north unit and closed ponderosa woodlands in the south units, which had markedly less precipitation and gentler, smoother slopes than the north unit. The main interrelated points about forest composition for the Umatilla National Forest were historical dominance by both ponderosa pine and Douglas-fir (Table 1, 81% of all trees) and a decrease in relative abundance of ponderosa pine and Douglas-fir (39% of all trees) due to a substantial increase in grand fir and to a lesser extent, lodgepole pine, from about 3% of all trees to about 43% of all trees in current forests. The main points about density are that historical forests of the Umatilla National Forest were likely open to closed woodlands, with a mean density of 165 trees/ha, ranging from 122 trees/ha in the north unit to 211 trees/ha in the south units (Table 4; vegetation phases based on [48]) and current forests had a 2- to 3-fold increase in tree density. We note that in the historical tree surveys, most pine and fir were unidentified and some percentage was likely to be lodgepole pine and not ponderosa pine and some percentage was likely to be grand fir and not Douglas-fir, which we were not able to resolve by modeling. Based on contemporaneous documents, regional studies, experience with historical datasets, and fire ecology, we made the assumption and interpretation that the well-dispersed and abundant “pine” and “fir” were ponderosa pine and Douglas-fir, whereas identified lodgepole pine and grand fir were in concentrated clusters of either severe fire perimeters or fire refugia, respectively, and currently, without restrictions by low- to moderate-severity fires, their distribution and abundance have increased. It may be that the exchange between historical ponderosa pine and Douglas-fir to current grand fir and lodgepole pine was less extreme than a 40 percentage transfer, but densities still increased by the same magnitude.
Ponderosa pine decreases and grand fir increases agreed with other studies that show fire-sensitive fir species have expanded into ponderosa pine forests that historically experienced frequent fire regimes [1,2,3,4,5,6,7,8,9,10,11,12,13,14]. Likewise, research demonstrates that relatively fire-sensitive Douglas-fir generally increases initially following fire exclusion because of vulnerability to fire of small diameter young trees, even though Douglas-fir is fire-tolerant when mature [52,70]. Decreases in historical Douglas-fir abundance relative to true fir and lodgepole pine, which occurred in the Umatilla National Forest, do not appear to be well-documented when comparing historical and current forests. However, Douglas-fir also is not typically as abundant as ponderosa pine in historical studies, indicating normally that historical disturbance did not favor this species where research has been conducted. Despite relative decreases in Douglas-fir, it is likely that Douglas-fir density overall increased, while ponderosa pine density was stable or decreased slightly, based on the percent of all trees and total densities, although the density estimates are for all trees, as accurate density estimation of any one species is not feasible based on tree distances from survey points, which may have either one or two (or three) species and likely vary in density accordingly. Density increased in the Umatilla National Forest by a factor of 2.4, tripling in the north unit and doubling in the south units. Increased density (trees > 12.7 cm) in current forests is in agreement with many other studies, e.g., [12,17].
To our knowledge, Douglas-fir open woodland is an unusual ecosystem type that has not been reconstructed in previous large-scale studies. Open Douglas-fir forests are distinctive from and less well-described than open ponderosa pine forests (Figure 5). In our estimation, Douglas-fir forests, perhaps with greater representation by the western larch component in some areas, may have been historically representative of moist upland forest ecosystems transitional to northern Rockies forests that extend into Canada, for some portions of eastern Washington and Oregon, Idaho and adjacent Montana, and into British Columbia and Alberta [5,31,71]. To produce the low densities of open woodlands, we suspect that steep, rough slopes and greater moisture present in the north unit interacted with irregular mixed severity fire. Steep slopes typically have lower tree densities and fire may not have needed to be as frequent or regular to maintain tree densities, as occurred in the drier south units that likely had a more characteristic high-frequency, low-severity fire regime known to support ponderosa pine [32]. Heyerdahl et al. [31] found that the southern Blue Mountains burned twice as frequently, due to a longer, drier fire season than the northern unit of the Umatilla; however, Maruoka [30] determined mean fire intervals of 10 to 30 years in four sites in the northern unit of the Umatilla, which was not very different than a mean of 17 years and range of 10 to 50 years, including more southern sites. Moreover, based on the current abundance of shrubs, we speculate that historically, a dense shrub undergrowth also was effective at inhibiting tree regeneration and thereby contributing to the maintenance of a woodland structure. We are unaware of any other research that provides direct support for our conjectures and we recognize that under different conditions, steep slopes, which can act as firebreaks, and more precipitation may support greater tree densities.
Douglas-fir distributions in more northerly locations than ponderosa pine may not be particularly related to more successful competition under different climatic, topographic, and edaphic conditions. Modeling suggested that precipitation and steep, rough slopes were most influential at differentiating the two species distributions, with little influence by soil variables. However, environmental variables also reflect the spatial separation between north and south units, which may be the boundary between predominantly ponderosa pine and Douglas-fir distributions. For example, despite greater precipitation in the north unit, some evidence suggests that interior Douglas-fir has less vulnerability to water stress-induced cavitation than ponderosa pine [72]. Furthermore, as proven by the wholesale transition in vegetation and densities under the same relatively static environmental variables, these variables are secondary in influence to disturbance regimes that filter species and densities, although disturbance, vegetation, and environmental variables interact. Extended fire-free intervals will favor Douglas-fir over ponderosa pine, but when fire is excluded, eventually other species with minimal allocation of resources to tolerate fire, such as true firs, will out-compete Douglas-fir [70].
Some contemporary mesic forests may have been woodlands in the past, given fire in the landscape. Here, Douglas-fir open woodlands covered most of a 300,000 hectares extent, with ample precipitation and deep loamy soils, albeit with steep, rough slopes, but overall superior tree-growing conditions in comparison to the southern units where ponderosa pine was dominant. Douglas-fir woodlands as an ecosystem type appears to be rare in the current literature, except in cases of encroachment by Douglas-fir into open systems, such as prairies, ponderosa pine savanna, or western oak woodlands, and where site quality limitations on tree densities occur, such as poor soils or limited moisture or on slopes and ridges, resulting in Douglas-fir instead of ponderosa pine in the first forest zone encountered above steppe or valley environments, although some exceptions may occur [73,74,75]. NatureServe Explorer [76] lists eight Douglas-fir woodland alliances, but sites are specific to slopes or ridges with shallow soils of little moisture-holding capacity that effectively are dry, which we do not consider to occur in the north unit, where precipitation and site quality are relatively high. Another possible alliance is grand fir-Douglas-fir forest and woodland, but this is a novel alliance that has developed as grand fir—an extremely fire-sensitive, shade-tolerant species—has encroached on sites formerly dominated by Douglas-fir and ponderosa pine that were maintained by fire [76]. Most of the unidentified “fir” in historical surveys was probable to be Douglas-fir, which at least has some tolerance to fire and open conditions compared to true firs. Douglas-fir develops thick bark after approximately 40 years, depending on site productivity, which creates fire tolerance, depending on fire severity, when diameters are in the range of 8 to 20 cm if an extended fire return interval allows young trees to become mature [74]. Munger [39], a contemporaneous regional authority, also identified ponderosa pine and Douglas-fir as the most abundant species in Oregon. Thus, it would be a greater challenge to interpret scenarios where true firs were 20%, 40%, or 50% of the trees in historical forests and occurred at lower densities than ponderosa pine.
It is possible that antecedent disturbances may have been influential in shaping a unique and potentially transitory ecosystem. It may be that this time period of 1879 to 1887 had enough of a lag period since Euro-American land use changes to reflect changes in both understory and overstory tree disturbance. A substantial portion of the north unit was affected by large, severe wildfires around 1850 to 1855 [77], although we believe these fires may be relatively representative of the disturbance regime. Indeed, historical tree sizes averaged 40 cm overall and 42 cm for the north unit, which did not indicate recent overstory disturbance. Cattle and sheep grazing occurred by the 1870s and timber harvest started after railroad lines were built during the 1880s [38]. Another option for speculative interpretation is control by insect regimes of Douglas-fir tussock moth and western spruce budworm.
In the Umatilla National Forest, grand fir established with greater abundance in the lower elevation north unit than in the higher elevation south units. Historically, fire interacted with climate to regulate tree distributions into elevational gradients because fire requires weather that allows growth of herbaceous vegetation, which are fine fuels, followed by ignition conditions that are not too wet or cold to cure vegetation. These fire-climate relationships typically resulted in ponderosa pine and Douglas-fir at lower elevations, where conditions are suitable for fire occurrence during a longer fire season interval, thereby increasing probability of fire, than fire-sensitive grand fir [17], but precipitation appears to have favored greater grand fir establishment in the lower maritime climatic zone with greater precipitation, rather than higher elevations with less precipitation. Nonetheless, without control by fire and similar to other fire-sensitive species, grand fir has a wide ecological amplitude and now occurs in dry environments across thousands of acres in the central and southern Blue Mountains. Fire suppression served as a releasing process, allowing expansion by fire-sensitive species and demonstrating that perhaps the ecological range of many tree species is controlled more by fire occurrence and frequency and less by climate.
Tree composition in the GLO surveys is representative of hundreds of years, both directly due to the longevity of overstory ponderosa pine and Douglas-fir trees (i.e., hundreds of years), but also because of the advantage that existing overstory trees have in establishing the next tree cohort. That is, sampled trees reflect compositional effects of the prevailing disturbance regime before surveys occurred. Lodgepole pine was not abundant in historical surveys, suggesting that historical disturbance processes were not favorable to adult survivorship for lodgepole pine (assuming that historical accounts of ponderosa pine abundance and not lodgepole pine were correct). Lodgepole pine has the trait of cone serotiny (i.e., release of seeds after heat from fire melts resin binding cone scales) that confers rapid response to severe fires, after which successful seedling establishment is promoted by the absence of competition from overstory trees. For this study area, it appears that prevailing disturbance regimes allowed ponderosa pine and Douglas-fir to fully capture growing space to the detriment of lodgepole pine establishment.
Our overall estimate of 165 trees/ha, after increases to adjust for surveyor bias (overall increase by 1.3), concurs almost exactly with Williams and Baker [49], who determined about 167 trees/ha, despite use of a biased estimator that increases density estimates by 1.2 to 3.8 times [51], but without increases for surveyor bias, for an extent that generally was south of the north Umatilla unit, with some probable overlap in the eastern unit of the two south units. Although a density of 211 trees/ha in the pine-dominated south units is relatively high compared to other reconstructions of ponderosa pine, ponderosa pine can establish in dense clusters, density varied considerably across the canopy spectrum, and this region may be likely to have greater tree densities than more southerly locations. Ponderosa pine forests are wide-ranging and may characteristically span a gradient of tree density, including aggregated trees and large patches of dense trees, with occasional high-severity fire. This is indicated by wildlife, particularly birds, that use both open stands for foraging and denser stands for nesting, such as raptors, and woodpeckers that use high densities of large diameter snags after high-severity fires [24,25,26,27,28].
Nevertheless, the primary change between historical and current forests occurs in the understory, where uncontrolled small diameter trees capture the growing space from herbaceous and non-tree woody vegetation. Currently, 66% of trees ≥ 2.54 cm are saplings, primarily of grand fir and lodgepole pine [68]. The historical tree surveys did not include small diameter trees, but the mechanism of surface fire removes understory trees. Extensive documentation of both the history of surface fire regimes and the openness of forests, which permitted travel by horseback and wagons, indicates a general lack of small diameter trees, e.g., [13]. Similar to historical accounts from other regions, observations suggest Oregon ponderosa forests typically were open, but not always [9,50].

The Information Deficit and Historical Tree Surveys

Fire has been deferred for almost a century, resulting not only in loss of open forest structure but also loss of knowledge about fire effects on forests, including situations that support woodlands of tree species classified as fire-sensitive, such as Douglas-fir when it is immature, in comparison to ponderosa pine. Under some fire disturbance circumstances, herbaceous and shrubby vegetation may be able to hold growing space against Douglas-fir in-filling. Historically, approximately 1.8 million hectares burned annually in California, which almost equals the current 2 million ha burned annually in the entire US [78]. Rephrasing Show and Kotok [44], “… failure to appreciate in full the role of fire in our forests …serves merely to maintain the present unsatisfactory condition of our forest property, a condition in itself the outcome …” of almost a century of fire exclusion. Research about open forests and fire has been interrupted [1,44], and the delay has resulted in a need for research to better describe the role of fire for atypical forests, such as Douglas-fir woodlands or where fire-tolerant species commonly intermix with less fire-tolerant species.
Williams and Baker [49], Odion et al. [79], Hanson et al. [80], and others argued that moderate- and high-severity fire regimes were much more common than recognized in ponderosa pine forests and indeed, that many of these historical forests primarily had mixed fire regimes, with low-, moderate-, and high-severity effects. However, Odion et al. [79] stated that high-severity fire occurred on rotations of 825 to 850 years in the Blue Mountains, which, at longer than the lifetimes of most trees, is infrequent disturbance. Therefore, the region represents some proportion of low- and moderate-severity fire, and may follow Arno’s [33] assessment of a low-severity fire regime of 5 to 35 years, with a more minor influence of mixed severity fires on a 35 to 200 years schedule for inland ponderosa or ponderosa-Douglas-fir forests. A mixed severity regime has overstory mortality ranging between 26 and 75 percent, and in low density woodlands, fire mortality would be spatially variable without sufficient tree densities to spread crown fires. Indeed, the lesser densities in Douglas-fir woodlands suggest limited possibility for spatially contiguous crown fire spread (rather than discontinuous torching) compared to the denser ponderosa pine woodlands. Hessburg et al. [34] generally agreed with Arno’s [33] assessment. Fulé et al. [81] recognized that fire regimes of dry western forests were not uniformly of low severity but made clear that high-severity fires were relatively rare.
It is possible to infer general fire regimes from historical tree densities, with support from other lines of evidence, keeping in mind that discrepancy may occur in estimated tree densities from different sources [47,82,83,84]. Historical densities of about 165 trees/ha and even up to 250 trees/ha, although considered high by the standards of densities reconstructed by dendroecological methods, are not unusual for historical tree surveys, particularly for this more northern region and given that ponderosa pine often establishes in dense clusters (“patchy, clumpy, groupy”) and pines often establish at high densities, which are subsequently reduced by fire [1]. Munger [39] noted: “In the Blue Mountains the reproduction of yellow pine is very abundant, both in the virgin forest and after cuttings. Perhaps it is more prolific here than anywhere else. In this region where an area has not been burned over by a surface fire for a number of years, there is quite commonly a veritable thicket of little trees from a few inches to several feet high. Actual counts have shown that there are sometimes 14,000 seedlings on a single acre, the ages ranging from 13 to 21 years.” In general, ponderosa pine forests have densities comparable with longleaf pine (Pinus palustris) forests in the eastern US, which have a well-documented frequent low-severity fire regime of 2 to 5 years [61]. In contrast to low-severity fire regimes that shape ponderosa pine and longleaf pine ecosystems, high-severity fire regimes, e.g., catastrophic loss of overstory trees on a 50- to 150-year schedule, produce extremely high-density forests, often exceeding 400 trees/ha [85]. In between these extremes, a mixed severity fire regime or a less frequent low-severity fire regime may fit poorly described Douglas-fir woodlands, which were present in the north unit of the Umatilla National Forest.
Additionally, composition dominated by only two species, albeit one that is not typically considered fire-tolerant except for older individuals, signals the constant filtering effect of frequent low-severity fires on understory trees. For example, historical forests in Indiana were limited primarily (>52% of all species) to fire-tolerant oaks and American beech (Fagus grandifolia), a species considered fire-sensitive, despite the presence of > 80 other species that could have become established [86]. When forests are composed predominantly of two long-lived species, those species have a lock on both present and future composition, due to the longevity and capture of reproductive space for auto-replacement, given the continuance of primarily understory rather than overstory disturbance. Where large trees remain throughout the forest extent at all times, that is, old growth forests, the forest remains functionally continuous with infrequent overstory loss. Essentially, succession is not a meaningful term for long-lived tree species under a disturbance regime that characteristically removes understory trees rather than overstory trees, and composition is secured by extremely dominant species [87].

5. Conclusions

We reconstructed overstory composition and structure for the historical Umatilla National Forest, which had both relatively greater densities than other historical forests and greater percentage of Douglas-fir (albeit some percentage could have been grand fir). Nonetheless, in current forests, ponderosa pine and Douglas-fir have decreased relative to grand fir particularly, and lodgepole pine and tree density increased 2- to 3-fold. To our knowledge, we described a new ecosystem type of Douglas-fir open woodland that was not limited by site quality or an unstable state of Douglas-fir encroachment into fire-maintained open ecosystems. Because of fire exclusion, an information deficit exists about conditions that favor Douglas-fir open woodlands, although we speculate that the northern unit, with greater precipitation and high site quality but steep slopes, had a spatially and temporally variable fire return interval that favored Douglas-fir woodlands. We additionally interpreted that fires also were frequent enough to allow herbaceous vegetation and shrubs to out-compete trees, maintaining lower tree densities. Douglas-fir open woodlands and forests may represent a unique type of historical forest ecosystem transitional to northern Rockies moist forests, perhaps extending into Canada, that is poorly documented. Other reconstructions in eastern Washington, Idaho, Wyoming, western Montana, and western Canada may discover similar Douglas-fir woodlands or at least dominance by Douglas-fir. Further research on Douglas-fir woodlands to determine the disturbance regime and life history traits that balance Douglas-fir, ponderosa pine, and herbaceous or shrub vegetation, e.g., [19,88], will provide a more nuanced description of the drivers vital for interpretation.

Supplementary Materials

The following is available online at https://www.mdpi.com/1999-4907/11/10/1122/s1, Supplementary File S1: Modeling code.

Author Contributions

Conceptualization, B.B.H.; Methodology, B.B.H., D.C.J., D.C.P.; Formal Analysis, B.B.H., D.C.J.; Investigation, D.C.J., D.C.P.; Resources, D.C.J., D.C.P.; Writing—Original Draft Preparation, B.B.H.; Writing—Review and Editing, B.B.H., D.C.J., D.C.P. All authors have read and agreed to the published version of the manuscript.

Funding

This research received no external funding.

Acknowledgments

We thank the three anonymous reviewers for their contributions in developing the manuscript.

Conflicts of Interest

The authors declare no conflict of interest.

References

  1. Weaver, H. Fire as an ecological and silvicultural factor in the ponderosa-pine region of the Pacific slope. J. For. 1943, 41, 7–14. [Google Scholar] [CrossRef] [Green Version]
  2. Kilgore, B.M. The ecological role of fire in Sierran conifer forests: Its application to national park management. Quat. Res. 1973, 3, 496–513. [Google Scholar] [CrossRef]
  3. Dickman, A. Reduced fire frequency changes species composition of a ponderosa pine stand. J. For. 1978, 76, 24–25. [Google Scholar]
  4. Parsons, D.J.; DeBenedetti, S.H. Impact of fire suppression on a mixed-conifer forest. For. Ecol. Manag. 1979, 2, 21–33. [Google Scholar] [CrossRef]
  5. Steele, R.; Arno, S.F.; Geier-Hayes, K. Wildfire patterns change in central Idaho’s ponderosa pine–Douglas-fir forest. West. J. Appl. For. 1986, 1, 16–18. [Google Scholar] [CrossRef]
  6. Mutch, R.W.; Arno, S.F.; Brown, J.K.; Carlson, C.E.; Ottmar, R.D.; Peterson, J.L. Forest Health in the Blue Mountains: A Management Strategy for Fire-Adapted Ecosystems; USDA Forest Service, Pacific Northwest Research Station: Corvallis, OR, USA, 1993. [Google Scholar]
  7. Sloan, J.P. Historical Density and Stand Structure of an Old-Growth Forest in the Boise Basin of Central Idaho; US Department of Agriculture, Forest Service, Intermountain Research Station: Fort Collins, CO, USA, 1998. [Google Scholar]
  8. Sloan, J.P. Interruption of the Natural Fire Cycle in a Grand Fir Forest of Central Idaho: Changes in Stand Structure and Composition; US Department of Agriculture, Forest Service, Intermountain Research Station: Fort Collins, CO, USA, 1998. [Google Scholar]
  9. Youngblood, A.; Max, T.; Coe, K. Stand structure in eastside old-growth ponderosa pine forests of Oregon and northern California. For. Ecol. Manag. 2004, 199, 191–217. [Google Scholar] [CrossRef]
  10. Keeling, E.G.; Sala, A.; DeLuca, T.H. Effects of fire exclusion on forest structure and composition in unlogged ponderosa pine/Douglas-fir forests. For. Ecol. Manag. 2006, 237, 418–428. [Google Scholar] [CrossRef]
  11. Knapp, E.E.; Skinner, C.N.; North, M.P.; Estes, B.L. Long-term overstory and understory change following logging and fire exclusion in a Sierra Nevada mixed-conifer forest. For. Ecol. Manag. 2013, 310, 903–914. [Google Scholar] [CrossRef]
  12. Reynolds, R.T.; Sanchez Meador, A.J.; Youtz, J.A.; Nicolet, T.; Matonis, M.S.; Jackson, P.L.; DeLorenzo, D.G.; Graves, A.D. Restoring Composition and Structure in Southwestern Frequent-Fire Forests: A Science-Based Framework for Improving Ecosystem Resiliency; US Department of Agriculture, Forest Service, Intermountain Research Station: Fort Collins, CO, USA, 2013. [Google Scholar]
  13. Powell, D.C. Active Management of Dry Forests in the Blue Mountains: Silvicultural Considerations; USDA Forest Service, Pacific Northwest Research Station: Corvallis, OR, USA, 2014. [Google Scholar]
  14. Stephens, S.L.; Lydersen, J.M.; Collins, B.M.; Fry, D.L.; Meyer, M.D. Historical and current landscape-scale ponderosa pine and mixed conifer forest structure in the Southern Sierra Nevada. Ecosphere 2015, 6, 79. [Google Scholar] [CrossRef]
  15. Kolb, T.E.; Agee, J.K.; Fule, P.Z.; McDowell, N.G.; Pearson, K.; Sala, A.; Waring, R.H. Perpetuating old ponderosa pine. For. Ecol. Manag. 2007, 249, 141–157. [Google Scholar] [CrossRef]
  16. Martinson, E.J.; Omi, P.N. Fuel Treatments and Fire Severity: A Meta-Analysis; US Department of Agriculture, Forest Service, Intermountain Research Station: Fort Collins, CO, USA, 2013. [Google Scholar]
  17. Stine, P.; Hessburg, P.; Spies, T.; Kramer, M.; Fettig, C.J.; Hansen, A.; Lehmkuhl, J.; O’Hara, K.; Polivka, K.; Singleton, P.; et al. The Ecology and Management of Moist Mixed-Conifer Forests in Eastern Oregon and Washington: A Synthesis of the Relevant Biophysical Science and Implications for Future Land Management; US Department of Agriculture, Forest Service, Intermountain Research Station: Fort Collins, CO, USA, 2014. [Google Scholar]
  18. Davis, K.T.; Dobrowski, S.Z.; Higuera, P.E.; Holden, Z.A.; Veblen, T.T.; Rother, M.T.; Parks, S.A.; Sala, A.; Maneta, M.P. Wildfires and climate change push low-elevation forests across a critical climate threshold for tree regeneration. Proc. Natl. Acad. Sci. USA 2019, 116, 6193–6198. [Google Scholar] [CrossRef] [PubMed] [Green Version]
  19. Downing, W.M.; Krawchuk, M.A.; Meigs, G.W.; Haire, S.L.; Coop, J.D.; Walker, R.B.; Whitman, E.; Chong, G.; Miller, C. Influence of fire refugia spatial pattern on post-fire forest recovery in Oregon’s Blue Mountains. Landsc. Ecol. 2019, 34, 771–792. [Google Scholar] [CrossRef]
  20. Hankin, L.E.; Higuera, P.E.; Davis, K.T.; Dobrowski, S.Z. Impacts of growing-season climate on tree growth and post-fire regeneration in ponderosa pine and Douglas-fir forests. Ecosphere 2019, 10, e02679. [Google Scholar] [CrossRef] [Green Version]
  21. Korb, J.E.; Fornwalt, P.J.; Stevens-Rumann, C.S. What drives ponderosa pine regeneration following wildfire in the western United States? For. Ecol. Manag. 2019, 454, 117663. [Google Scholar] [CrossRef]
  22. Boag, A.E.; Ducey, M.J.; Palace, M.W.; Hartter, J. Topography and fire legacies drive variable post-fire juvenile conifer regeneration in eastern Oregon, USA. For. Ecol. Manag. 2020, 474, 118312. [Google Scholar] [CrossRef]
  23. Hanula, J.L.; Ulyshen, M.D.; Horn, S. Conserving pollinators in North American forests: A review. Nat. Areas J. 2016, 36, 427–439. [Google Scholar] [CrossRef]
  24. Quigley, T.M.; Arbelbide, S.J. An Assessment of Ecosystem Components in the Interior Columbia Basin and Portions of the Klamath and Great Basins; US Department of Agriculture, Forest Service, Intermountain Research Station: Fort Collins, CO, USA, 1997. [Google Scholar]
  25. Wisdom, M.J.; Holthausen, R.S.; Wales, B.C.; Hargis, C.D.; Saab, V.A.; Lee, D.C.; Hann, W.J.; Rich, T.D.; Rowland, M.M.; Murphy, W.J.; et al. Source Habitats for Terrestrial Vertebrates of Focus in the Interior Columbia Basin: Broadscale Trends and Management Implications; US Department of Agriculture, Forest Service, Intermountain Research Station: Fort Collins, CO, USA, 2000. [Google Scholar]
  26. Bunnell, F.L. Sustaining cavity-using species: Patterns of cavity use and implications to forest management. ISRN For. 2013, 457698. [Google Scholar] [CrossRef] [Green Version]
  27. Irwin, L.L.; Riggs, R.A.; Verschuyl, J.P. Reconciling wildlife conservation to forest restoration in moist mixed-conifer forests of the inland northwest: A synthesis. For. Ecol. Manag. 2018, 424, 288–311. [Google Scholar] [CrossRef]
  28. Hanberry, B.B.; Dumroese, R.K. Biodiversity and representative species in dry pine forests. In Northeastern California Plateaus Bioregion Science Synthesis to Support Forest Plan Development by the Lassen National Forest and the Modoc National Forest; US Department of Agriculture, Forest Service, Intermountain Research Station: Fort Collins, CO, USA, 2020. [Google Scholar]
  29. Hall, F.C. Fire History—Blue Mountains, Oregon; USDA Forest Service, Pacific Northwest Research Station: Corvallis, OR, USA, 1980; pp. 75–81. Available online: https://www.fs.usda.gov/treesearch/pubs/41408 (accessed on 20 October 2020).
  30. Maruoka, K.R. Fire History of Pseudotsuga menziesii and Abies grandis Stands in the Blue Mountains of Oregon and Washington. Master’s Thesis, University of Washington, Seattle, WA, USA, 1994. [Google Scholar]
  31. Heyerdahl, E.K.; Brubaker, L.B.; Agee, J.K. Spatial controls of historical fire regimes: A multiscale example from the interior west, USA. Ecology 2001, 82, 660–678. [Google Scholar] [CrossRef]
  32. Johnston, J.D.; Bailey, J.D.; Dunn, C.J. Influence of fire disturbance and biophysical heterogeneity on pre-settlement ponderosa pine and mixed conifer forests. Ecosphere 2016, 7, e01581. [Google Scholar] [CrossRef]
  33. Arno, S.F. Fire in western forest ecosystems. In Wildland Fire in Ecosystems: Effects of Fire on Flora; US Department of Agriculture, Forest Service, Intermountain Research Station: Fort Collins, CO, USA, 2000. [Google Scholar]
  34. Hessburg, P.F.; Spies, T.A.; Perry, D.A.; Skinner, C.N.; Taylor, A.H.; Brown, P.M.; Stephens, S.L.; Larson, A.J.; Churchill, D.J.; Povak, N.A. Tamm review: Management of mixed-severity fire regime forests in Oregon, Washington, and Northern California. For. Ecol. Manag. 2016, 366, 221–250. [Google Scholar] [CrossRef] [Green Version]
  35. Beckham, S.D. The Grande Ronde Valley and Blue Mountains: Impressions and Experiences of Travelers and Emigrants, the Oregon Trail, 1812–1880; Beckham and Associates: Lake Oswego, OR, USA, 1991. Available online: https://www.fs.usda.gov/Internet/FSE_DOCUMENTS/fseprd482690.pdf (accessed on 20 October 2020).
  36. Evans, J.W. Powerful Rockey: The Blue Mountains and the Oregon Trail, 1811–1883, 1st ed.; Eastern Oregon State College: La Grande, OR, USA, 1991. [Google Scholar]
  37. Fremont, J.C. Report of the Exploring Expedition to the Rocky Mountains in the Year 1842, and to Oregon and North California in the Years 1843–1844; Gales and Seaton, Printers: Washington, DC, USA, 1845; Available online: https://archive.org/download/mobot31753002784947/mobot31753002784947.pdf (accessed on 20 October 2020).
  38. Robbins, W.G.; Wolf, D.W. Landscape and the Intermontane Northwest: An Environmental History; US Department of Agriculture, Forest Service, Intermountain Research Station: Fort Collins, CO, USA, 1994. [Google Scholar]
  39. Munger, T.T. Western Yellow Pine in Oregon; US Department of Agriculture, Forest Service, Intermountain Research Station: Fort Collins, CO, USA, 1917. [Google Scholar]
  40. Shinn, D.A. Historical perspectives on range burning in the inland Pacific Northwest. Rangel. Ecol. Manag. J. Range Manag. Arch. 1980, 33, 415–423. [Google Scholar] [CrossRef]
  41. Kay, C.E. Aboriginal overkill. Hum. Nat. 1994, 5, 359–398. [Google Scholar] [CrossRef] [PubMed]
  42. Williams, G.W. Early fire use in Oregon. Fire Manag. 2000, 60, 13–20. [Google Scholar]
  43. Scharf, E.A. A statistical evaluation of the relative influences of climate, vegetation, and prehistoric human population on the charcoal record of Five Lakes, Washington (USA). Quat. Int. 2010, 215, 4–86. [Google Scholar] [CrossRef]
  44. Show, S.B.; Kotok, E.I. The Role of Fire in the California Pine Forests; US Department of Agriculture, Forest Service, Intermountain Research Station: Fort Collins, CO, USA, 1924. [Google Scholar]
  45. Office of Policy Analysis. Wildland Fire Management Program Benefit-Cost Analysis: A Review of Relevant Literature. Available online: https://edit.doi.gov/sites/doi.gov/files/migrated/ppa/upload/Wildland_fire_literature_review_060812FINAL.pdf (accessed on 2 February 2020).
  46. Long, J.W.; Tarnay, L.W.; North, M.P. Aligning smoke management with ecological and public health goals. J. For. 2018, 116, 76–86. [Google Scholar] [CrossRef]
  47. Johnston, J.D.; Dunn, C.J.; Vernon, M.J.; Bailey, J.D.; Morrissette, B.A.; Morici, K.E. Restoring historical forest conditions in a diverse inland Pacific Northwest landscape. Ecosphere 2018, 9, e02400. [Google Scholar] [CrossRef]
  48. Hanberry, B.B.; Jones-Farrand, D.T.; Kabrick, J.M. Historical open forest ecosystems in the Missouri Ozarks: Reconstruction and restoration targets. Ecol. Restor. 2014, 32, 407–416. [Google Scholar] [CrossRef]
  49. Williams, M.A.; Baker, W.L. Spatially extensive reconstructions show variable-severity fire and heterogeneous structure in historical western United States dry forests. Glob. Ecol. Biogeogr. 2012, 21, 1042–1052. [Google Scholar] [CrossRef]
  50. Baker, W.L. Implications of spatially extensive historical data from surveys for restoring dry forests of Oregon’s eastern Cascades. Ecosphere 2012, 3, 1–39. [Google Scholar] [CrossRef]
  51. Levine, C.R.; Cogbill, C.V.; Collins, B.M.; Larson, A.J.; Lutz, J.A.; North, M.P.; Restaino, C.M.; Safford, H.D.; Stephens, S.L.; Battles, J.J. Evaluating a new method for reconstructing forest conditions from General Land Office survey records. Ecol. Appl. 2017, 27, 1498–1513. [Google Scholar] [CrossRef] [PubMed]
  52. Hagmann, R.K.; Franklin, J.F.; Johnson, K.N. Historical conditions in mixed-conifer forests on the eastern slopes of the northern Oregon Cascade Range, USA. For. Ecol. Manag. 2014, 330, 158–170. [Google Scholar] [CrossRef]
  53. Heyerdahl, E.K.; Loehman, R.A.; Falk, D.A. A multi-century history of fire regimes along a transect of mixed-conifer forests in central Oregon, USA. Can. J. For. Res. 2019, 49, 76–86. [Google Scholar] [CrossRef]
  54. Foster, H.D. Report on the Silvics of the Wenaha Forest Reserve Washington and Oregon. Available online: https://www.fs.usda.gov/Internet/FSE_DOCUMENTS/fsbdev7_015540.pdf (accessed on 26 September 2020).
  55. Foster, H.D. Report on the Silvics of the Blue Mountains (E) National Forest, Oregon. Available online: https://www.fs.usda.gov/Internet/FSE_DOCUMENTS/fsbdev7_015620.pdf (accessed on 26 September 2020).
  56. Camp, A.; Oliver, C.; Hessburg, P.; Everett, R. Predicting late-successional fire refugia pre-dating European settlement in the Wenatchee Mountains. For. Ecol. Manag. 1997, 95, 63–77. [Google Scholar] [CrossRef]
  57. Hanberry, B.B.; Fraver, S.; He, H.S.; Yang, J.; Dey, D.C.; Palik, B.J. Spatial pattern corrections and sample sizes for forest density estimates of historical tree surveys. Landsc. Ecol. 2011, 26, 59–68. [Google Scholar] [CrossRef]
  58. Cogbill, C.V.; Thurman, A.L.; Williams, J.W.; Zhu, J.; Mladenoff, D.J.; Goring, S.J. A retrospective on the accuracy and precision of plotless forest density estimators in ecological studies. Ecosphere 2018, 9, e02187. [Google Scholar] [CrossRef] [Green Version]
  59. Hanberry, B.B.; Yang, J.; Kabrick, J.M.; He, H.S. Adjusting forest density estimates for surveyor bias in historical tree surveys. Am. Midl. Nat. 2012, 167, 285–306. [Google Scholar] [CrossRef]
  60. Powell, D.C. Using General Land Office Survey Notes to Characterize Historical Vegetation Conditions for the Umatilla National Forest; USDA Forest Service, Pacific Northwest Research Station: Corvallis, OR, USA, 2008. [Google Scholar]
  61. Hanberry, B.B.; Coursey, K.; Kush, J.S. Structure and composition of historical longleaf pine ecosystems in Mississippi, USA. Hum. Ecol. 2018, 46, 241–248. [Google Scholar] [CrossRef]
  62. Evans, J.S.; Oakleaf, J.; Cushman, S.A.; Theobald, D. An ArcGIS Toolbox for Surface Gradient and Geomorphometric Modeling, Version 2.0-0. Available online: http://evansmurphy.wix.com/evansspatial (accessed on 19 September 2020).
  63. PRISM Climate Group. 30-Year Normals. Available online: http://prism.oregonstate.edu (accessed on 20 September 2020).
  64. Fernández-Delgado, M.; Cernadas, E.; Barro, S.; Amorim, D. Do we need hundreds of classifiers to solve real world classification problems? J. Mach. Learn. Res. 2014, 15, 3133–3181. [Google Scholar]
  65. R Core Team. R: A Language and Environment for Statistical Computing; R Foundation for Statistical Computing: Vienna, Austria, 2020. [Google Scholar]
  66. Kuhn, M. Building Predictive Models in R Using the caret Package. J. Stat. Softw. 2008, 28, 1–26. [Google Scholar] [CrossRef] [Green Version]
  67. Hanberry, B.B.; He, H.S. Prevalence, statistical thresholds, and accuracy assessment for species distribution models. Web Ecol. 2013, 13, 13–19. [Google Scholar] [CrossRef]
  68. Christensen, G.A.; Dunham, P.; Powell, D.C.; Hiserote, B. Forest Resources of the Umatilla National Forest; US Department of Agriculture, Forest Service, Intermountain Research Station: Fort Collins, CO, USA, 2007. [Google Scholar]
  69. Overpeck, J.T.; Webb, T.I.; Prentice, I.C. Quantitative interpretation of fossil pollen spectra: Dissimilarity coefficients and the method of modern analogs. Quat. Res. 1985, 23, 87–108. [Google Scholar] [CrossRef]
  70. Hanberry, B.B. Compositional changes in selected forests of the western United States. Appl. Geogr. 2014, 52, 90–98. [Google Scholar] [CrossRef]
  71. Adams, D.L. The Northern Rocky Mountain Region. In Regional Silviculture of the United States; John Wiley: Hoboken, NJ, USA, 1980; pp. 341–389. [Google Scholar]
  72. Stout, D.L.; Sala, A. Xylem vulnerability to cavitation in Pseudotsuga menziesii and Pinus ponderosa from contrasting habitats. Tree Physiol. 2003, 23, 43–50. [Google Scholar] [CrossRef] [Green Version]
  73. Peter, D.; Shebitz, D. Historic anthropogenically maintained bear grass savannas of the southeastern Olympic Peninsula. Restor. Ecol. 2006, 14, 605–615. [Google Scholar] [CrossRef]
  74. Heyerdahl, E.K.; Miller, R.F.; Parsons, R.A. History of fire and Douglas-fir establishment in a savanna and sagebrush–grassland mosaic, southwestern Montana, USA. For. Ecol. Manag. 2006, 230, 107–118. [Google Scholar] [CrossRef]
  75. Heyerdahl, E.K.; Lertzman, K.; Wong, C.M. Mixed-severity fire regimes in dry forests of southern interior British Columbia, Canada. Can. J. For. Res. 2012, 42, 88–98. [Google Scholar] [CrossRef]
  76. NatureServe Explorer. Middle Rocky Mountain Montane Douglas-fir Forest and Woodland. Available online: https://explorer.natureserve.org/Search (accessed on 8 June 2020).
  77. Kent, W.H.B. The Proposed Wenaha Forest Reserve Washington and Oregon. Supervisor’s Office: U.S. Department of Agriculture, Bureau of Forestry. Available online: https://www.fs.usda.gov/Internet/FSE_DOCUMENTS/fsbdev7_015539.pdf (accessed on 20 October 2020).
  78. Stephens, S.L.; Martin, R.E.; Clinton, N.E. Prehistoric fire area and emissions from California’s forests, woodlands, shrublands, and grasslands. For. Ecol. Manag. 2007, 251, 205–216. [Google Scholar] [CrossRef]
  79. Odion, D.C.; Hanson, C.T.; Arsenault, A.; Baker, W.L.; DellaSala, D.A.; Hutto, R.L.; Klenner, W.; Moritz, M.A.; Sherriff, R.L.; Veblen, T.T.; et al. Examining historical and current mixed-severity fire regimes in ponderosa pine and mixed-conifer forests of western North America. PLoS ONE 2014, 9, e87852. [Google Scholar] [CrossRef] [Green Version]
  80. Hanson, C.T.; Sherriff, R.L.; Hutto, R.L.; DellaSala, D.A.; Veblen, T.T.; Baker, W.L. Setting the stage for mixed-and high-severity fire. In The Ecological Importance of Mixed-Severity Fires; DellaSala, D.A., Hanson, C.T., Eds.; Elsevier: Amsterdam, The Netherlands, 2015; pp. 3–22. [Google Scholar]
  81. Fulé, P.Z.; Swetnam, T.W.; Brown, P.M.; Falk, D.A.; Peterson, D.L.; Allen, C.D.; Aplet, G.H.; Battaglia, M.A.; Binkley, D.; Farris, C.; et al. Unsupported inferences of high-severity fire in historical dry forests of the western United States: Response to Williams and Baker. Glob. Ecol. Biogeogr. 2014, 23, 825–830. [Google Scholar] [CrossRef] [Green Version]
  82. Hagmann, R.K.; Franklin, J.F.; Johnson, K.N. Historical structure and composition of ponderosa pine and mixed-conifer forests in south-central Oregon. For. Ecol. Manag. 2013, 304, 492–504. [Google Scholar] [CrossRef] [Green Version]
  83. Odion, D.C.; Hanson, C.T.; Baker, W.L.; DellaSala, D.A.; Williams, M.A. Areas of agreement and disagreement regarding ponderosa pine and mixed conifer forest fire regimes: A dialogue with Stevens et al. PLoS ONE 2016, 11, e0154579. [Google Scholar] [CrossRef] [PubMed] [Green Version]
  84. Hagmann, R.K.; Stevens, J.T.; Lydersen, J.M.; Collins, B.M.; Battles, J.J.; Hessburg, P.F.; Levine, C.R.; Merschel, A.G.; Stephens, S.L.; Taylor, A.H.; et al. Improving the use of early timber inventories in reconstructing historical dry forests and fire in the western United States: Comment. Ecosphere 2018, 9, e02232. [Google Scholar] [CrossRef] [Green Version]
  85. Hanberry, B.B.; Palik, B.J.; He, H.S. Comparison of historical and current forest surveys for detection of homogenization and mesophication of Minnesota forests. Landsc. Ecol. 2012, 27, 1495–1512. [Google Scholar] [CrossRef]
  86. Hanberry, B.B. Trajectory from beech and oak forests to eastern broadleaf forests in Indiana, USA. Ecol. Process. 2019, 8, 3. [Google Scholar] [CrossRef] [Green Version]
  87. Hanberry, B.B.; Bragg, D.C.; Hutchinson, T.F. A reconceptualization of open oak and pine ecosystems of eastern North America using a forest structure spectrum. Ecosphere 2018, 9, e02431. [Google Scholar] [CrossRef] [Green Version]
  88. Downing, W.M.; Krawchuk, M.A.; Coop, J.D.; Meigs, G.W.; Haire, S.L.; Walker, R.B.; Whitman, E.; Chong, G.; Miller, C.; Tortorelli, C. How do plant communities differ between fire refugia and fire-generated early-seral vegetation? J. Veg. Sci. 2020, 31, 26–39. [Google Scholar] [CrossRef]
Figure 1. Area of General Land Office (GLO) surveys (gray) in the Umatilla National Forest, with the north unit in eastern Oregon and Washington and south units in eastern Oregon. Lighter gray indicates where soil surveys are missing.
Forests 11 01122 g001
Figure 2. Clustered distributions of identified lodgepole and ponderosa pine species compared to distribution of unidentified pine.
Forests 11 01122 g002
Figure 3. Predicted probabilities of pine presence by random forests (A) and extreme gradient boosting (B) and fir presence by random forests (C) and extreme gradient boosting (D).
Forests 11 01122 g003
Figure 4. Slope gradients of flat < 2 degrees, gentle slopes 2 to 20 degrees, and steep slopes > 20 degrees in the Umatilla National Forest.
Forests 11 01122 g004
Figure 5. Proposed mechanisms for generating alternative past and current forest ecosystem types.
Forests 11 01122 g005
Table 1. Composition of historical bearing and line trees and current composition from Field Sampled Vegetation (FSVeg) imputation and 1997 to 2005 surveys for the Umatilla National Forest (if percent ≥ 2 for any survey).
HistoricalBearingLineCurrentFSVeg1997 to 2005
SpeciesCountPercentCountPercentSpeciesPercentPercentScientific Name
ponderosa pine867743.0139053.79grand fir25.1127.71Abies grandis
Douglas-fir764637.919927.45Douglas-fir22.8819.84Pseudotsuga menziesii
western larch204410.138411.59ponderosa pine18.6815.56Pinus ponderosa
Engelmann spruce 8524.22243.31lodgepole pine16.0717.07Pinus contorta
lodgepole pine5192.5720.28Engelmann spruce7.576.13Picea engelmannii
true fir 1300.64162.21western larch5.036.74Larix occidentalis
subalpine fir2.625.02Abies lasiocarpa
Table 2. Importance of variables and relative importance for full models with soil variables (most influential 14 of the 19 variables) and reduced models without soil variables, and value of variables, for the random forests (rf) model to classify differences between fir and pine.
Full Model Fir, PineReduced Model Fir, PineFirPine
Accuracy 0.8097, Fir 0.849, Pine 0.760Accuracy 0.801, Fir 0.841, Pine 0.755ValueValue
precipitation100precipitation100963641
roughness55roughness3052952075
slope51slope1421.511.8
temperature43elevation913861355
elevation42dissection80.530.55
integrated moisture 40temperature66.66.9
dissection38integrated moisture 3218159
compound moisture 38compound moisture 06.77.2
available water28
soil depth27
sand26
organic26
cation exchange25
clay25
Table 3. Composition of historical bearing trees and current FSVeg imputation and 1997 to 2005 surveys for the north and south units of the Umatilla National Forest (if percent > 2 for any survey).
North Historical North CurrentFSVeg1997 to 2005
SpeciesCount PercentSpeciesPercentPercent
Douglas-fir547252.51grand fir38.9038.42
ponderosa pine286927.53Douglas-fir29.3925.20
western larch105510.12Engelmann spruce12.759.13
Engelmann spruce 6175.92ponderosa pine7.968.38
true fir1261.21western larch4.076.33
lodgepole pine1020.98subalpine fir3.767.67
lodgepole pine2.994.35
South Historical South CurrentFSVeg1997 to 2005
SpeciesCountPercentSpeciesPercentPercent
ponderosa pine580859.54ponderosa pine27.4821.93
Douglas-fir217422.29lodgepole pine26.8128.30
western larch98910.14Douglas-fir17.5515.17
lodgepole pine4174.28grand fir13.8018.29
Engelmann spruce2352.41western larch5.816.99
western juniper620.64western juniper3.483.03
true fir40.04Engelmann spruce3.313.43
subalpine fir1.682.71
Table 4. Structure (density in trees/ha unadjusted and adjusted for bias; DBH—diameter in cm; BA—basal area in m2/ha; stock—percent stocking) from historical surveys and current structure (density in trees/ha, BA = basal area in m2/ha) from 1997 to 2005 surveys for all of the Umatilla National Forest and north and south units.
Historical1997 to 2005
Density (Unadjusted)DensityLowHighDBHBALowHighStockLowHighDensityBA
Umatilla130.9164.5112.3184.439.927.818.931.138.926.543.6388.929.8
North97.3122.283.4137.042.322.315.225.031.521.535.3365.634.8
South167.9211.0144.0236.537.432.522.236.545.831.351.4411.924.8
Table 5. Structure (density in trees/ha unadjusted and adjusted) and percent fir and pine species by slope class for the Umatilla National Forest.
Density (Unadjusted)DensityLowHighDouglas-FirPonderosa PineGrand FirLodgepole Pine
Flat125.2157.3107.4176.422.558.30.52.6
Gentle slopes152.7191.9131.0215.129.248.30.63.5
Steep slopes95.9120.582.2135.155.831.20.90.9
Publisher’s Note: MDPI stays neutral with regard to jurisdictional claims in published maps and institutional affiliations.

