An Analysis of the Impact of Forest Policy on Rural Areas of Chile


Abstract
1. Introduction
2. Materials and Methods
2.1. Study Area
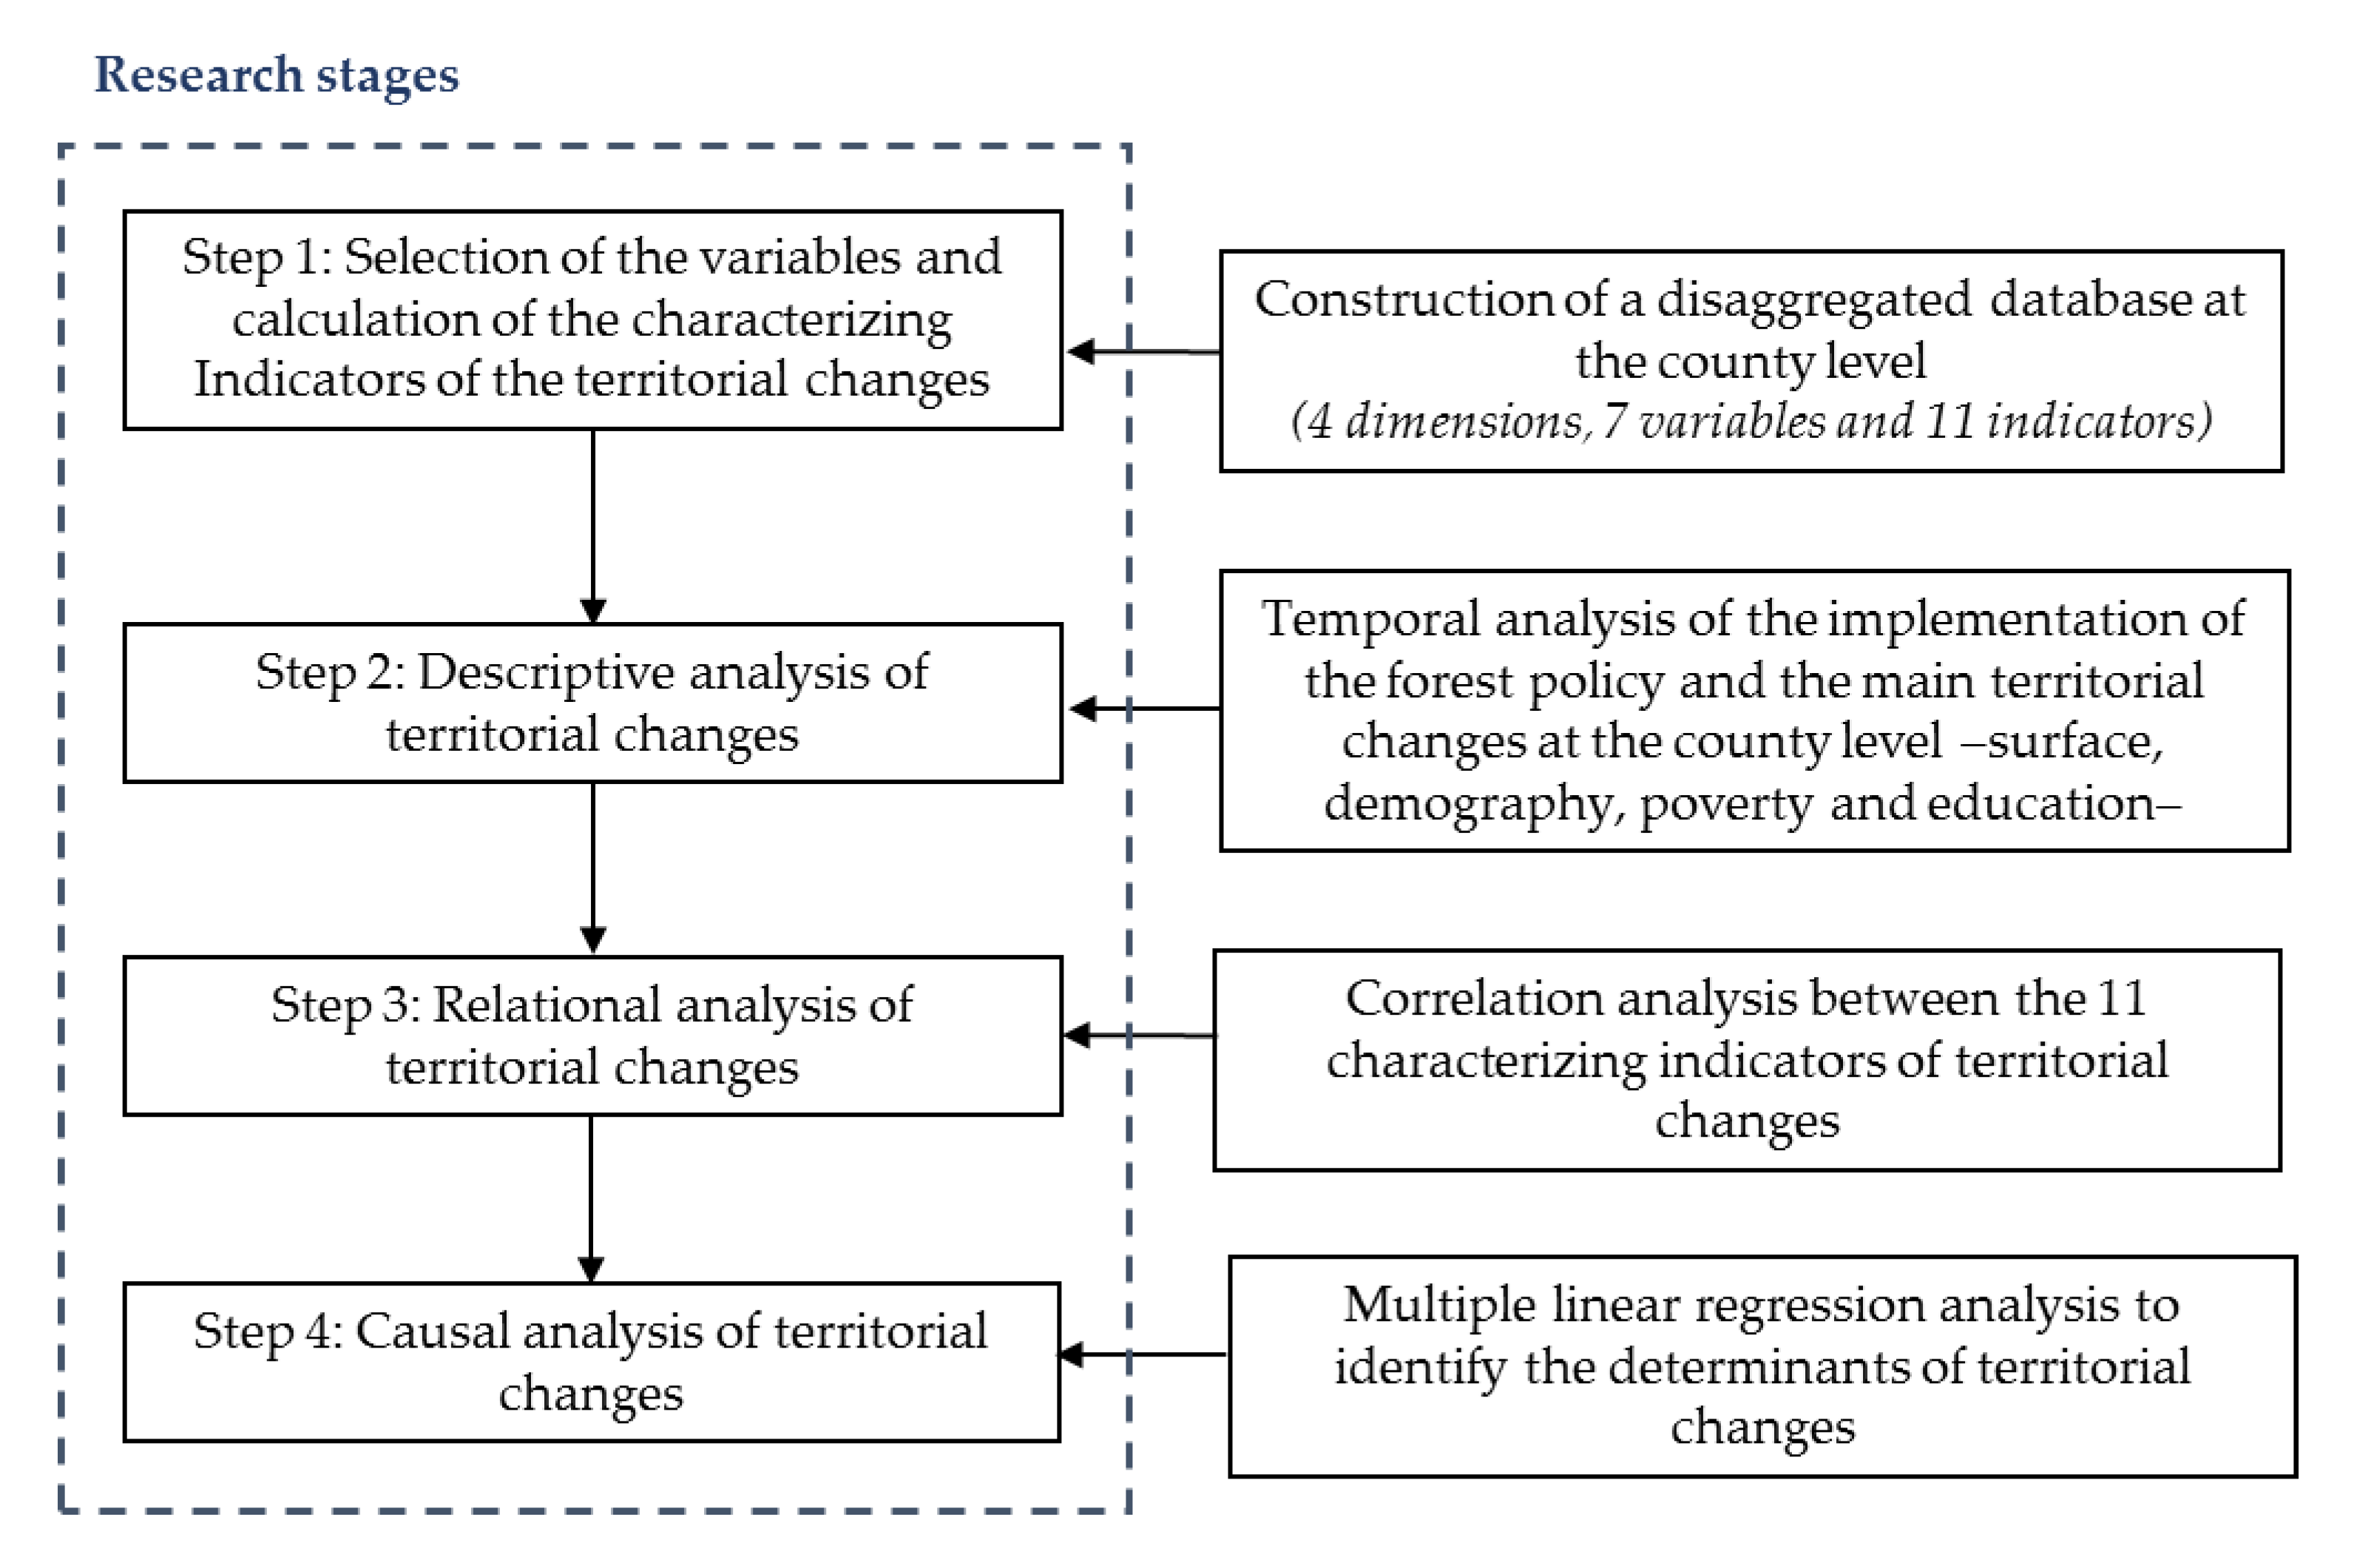
2.2. Research Methods and Phases of the Study
2.2.1. Selection of Variables and Indicators of Territorial Changes
2.2.2. Descriptive Analysis of Territorial Changes
2.2.3. Relational Analysis of Territorial Changes and Forest Policy
2.2.4. Causal Analysis Framework of Territorial Changes
3. Results
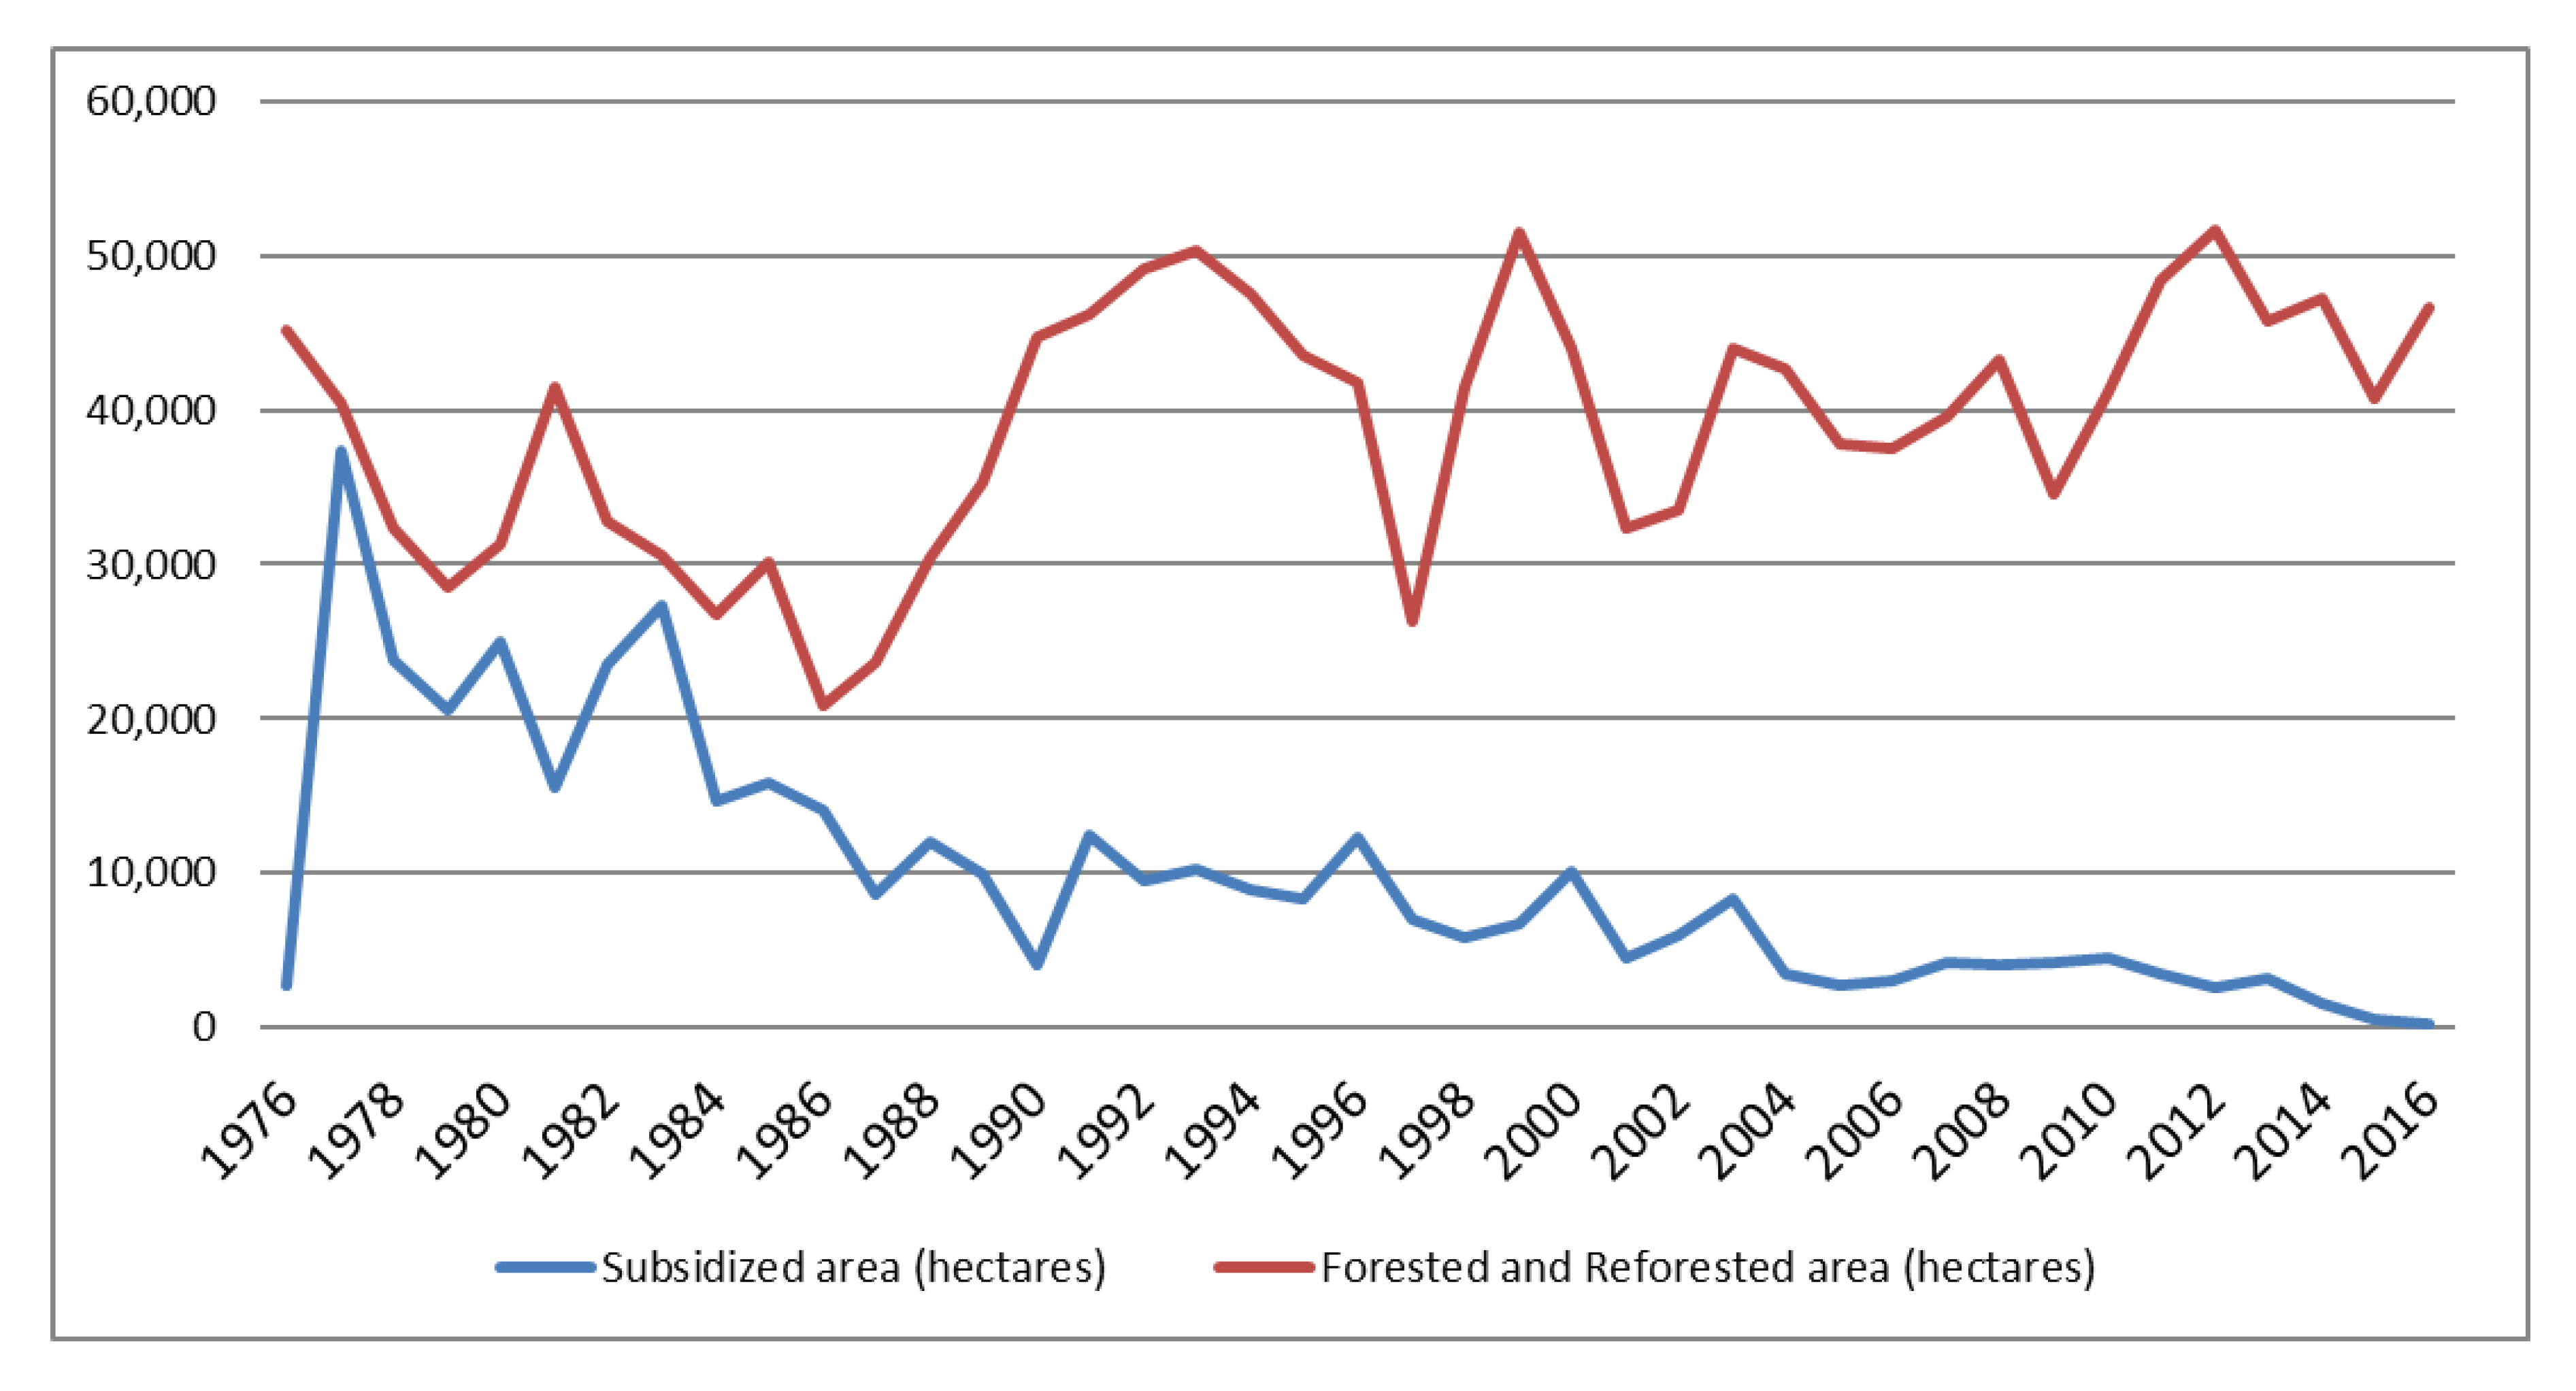
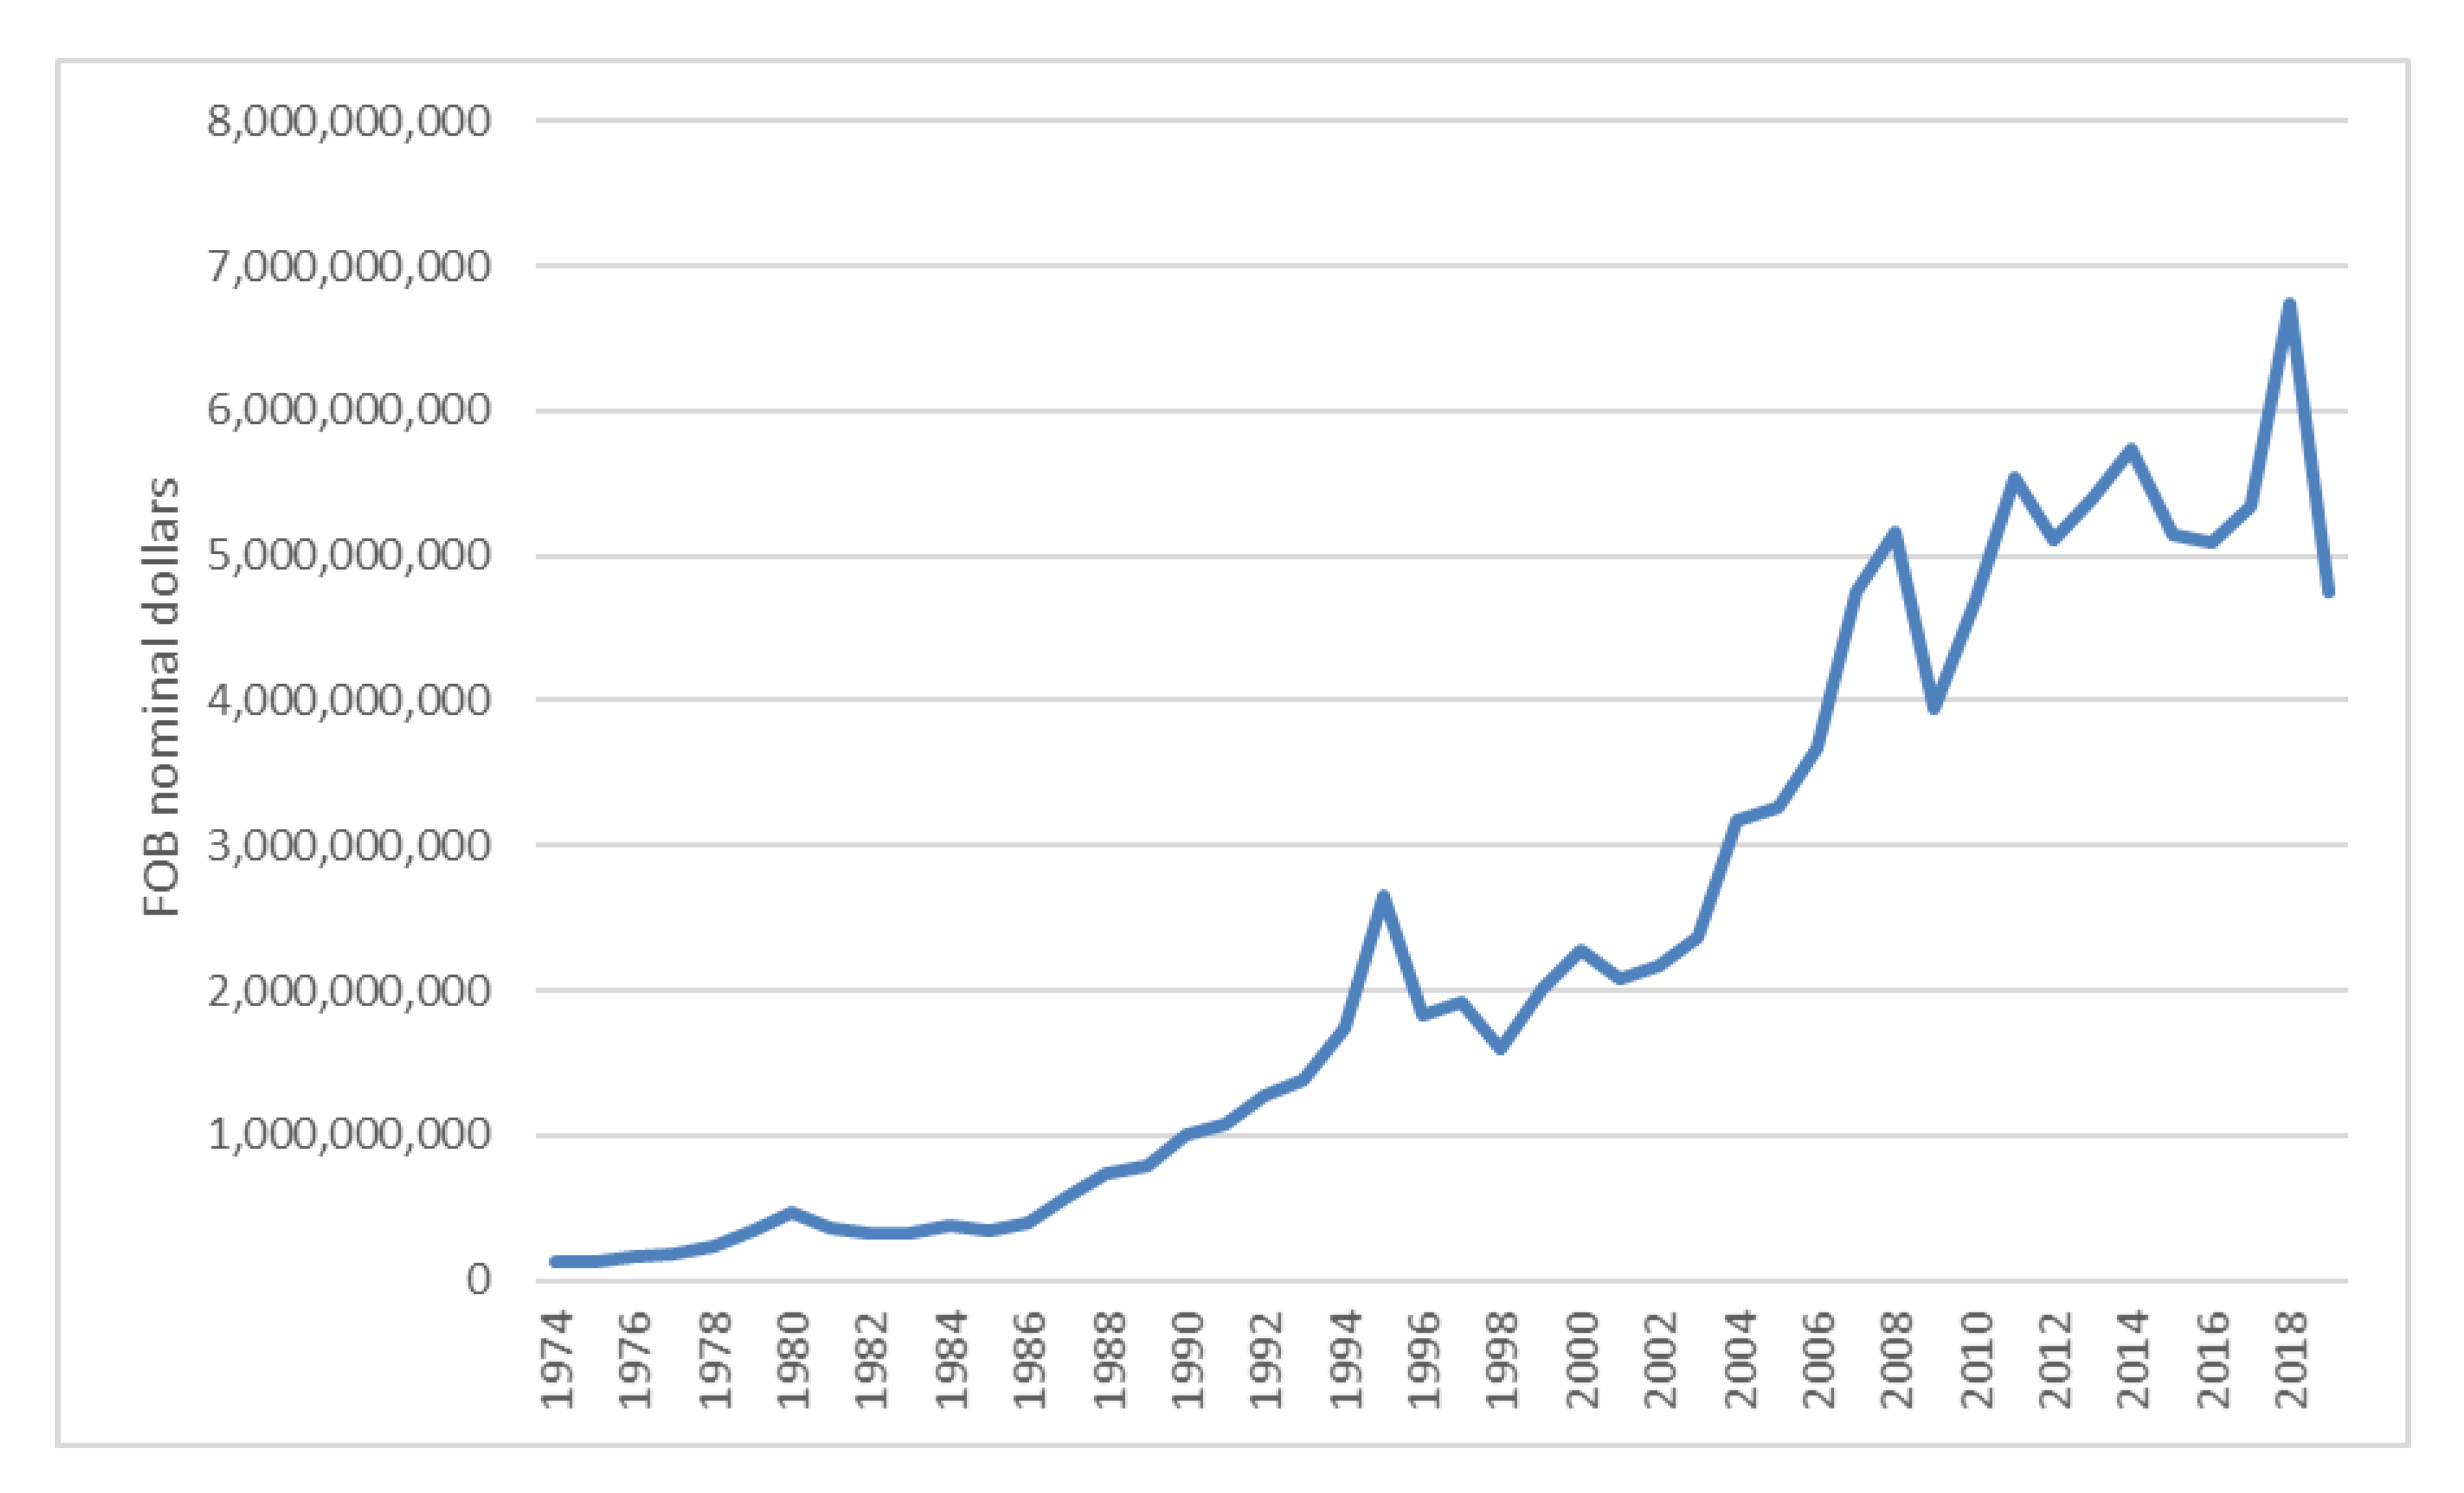
3.1. Implementation of the 1974 Forest Policy in the Study Area
3.2. Demographic, Socioeconomic, and Educational Changes in the Study Area
3.3. Relationship between the Territorial Changes Observed
- (1)
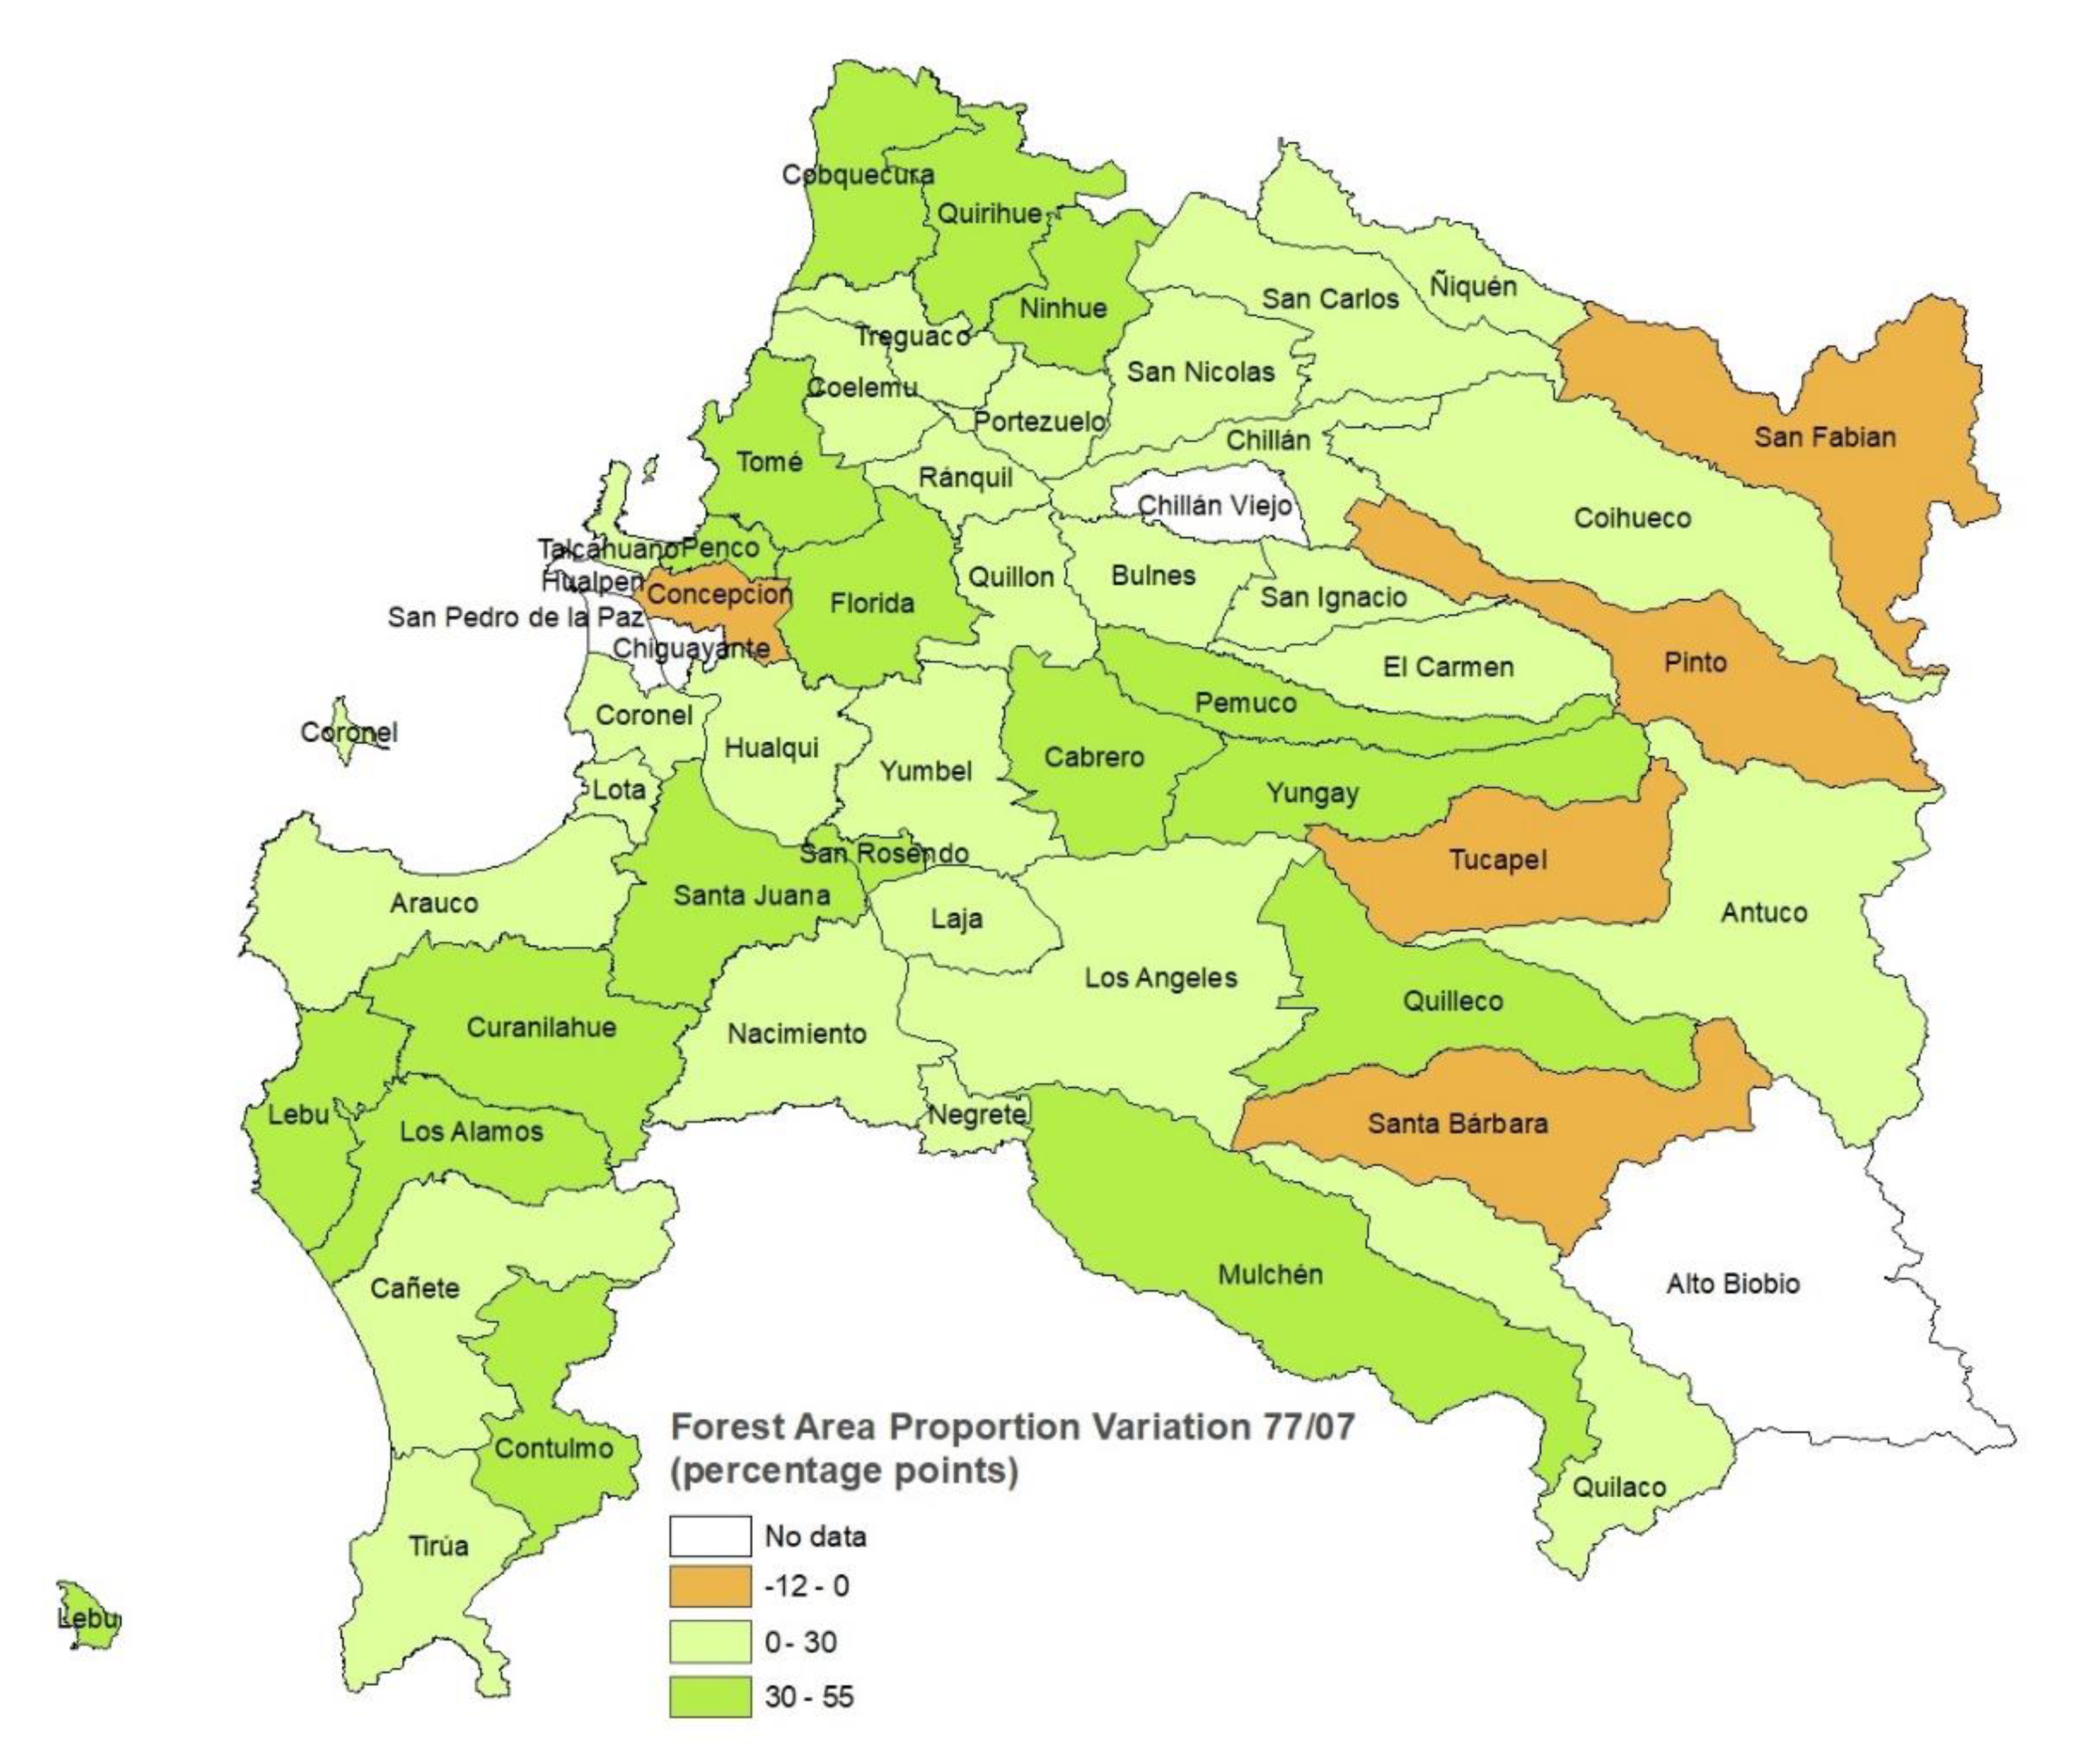
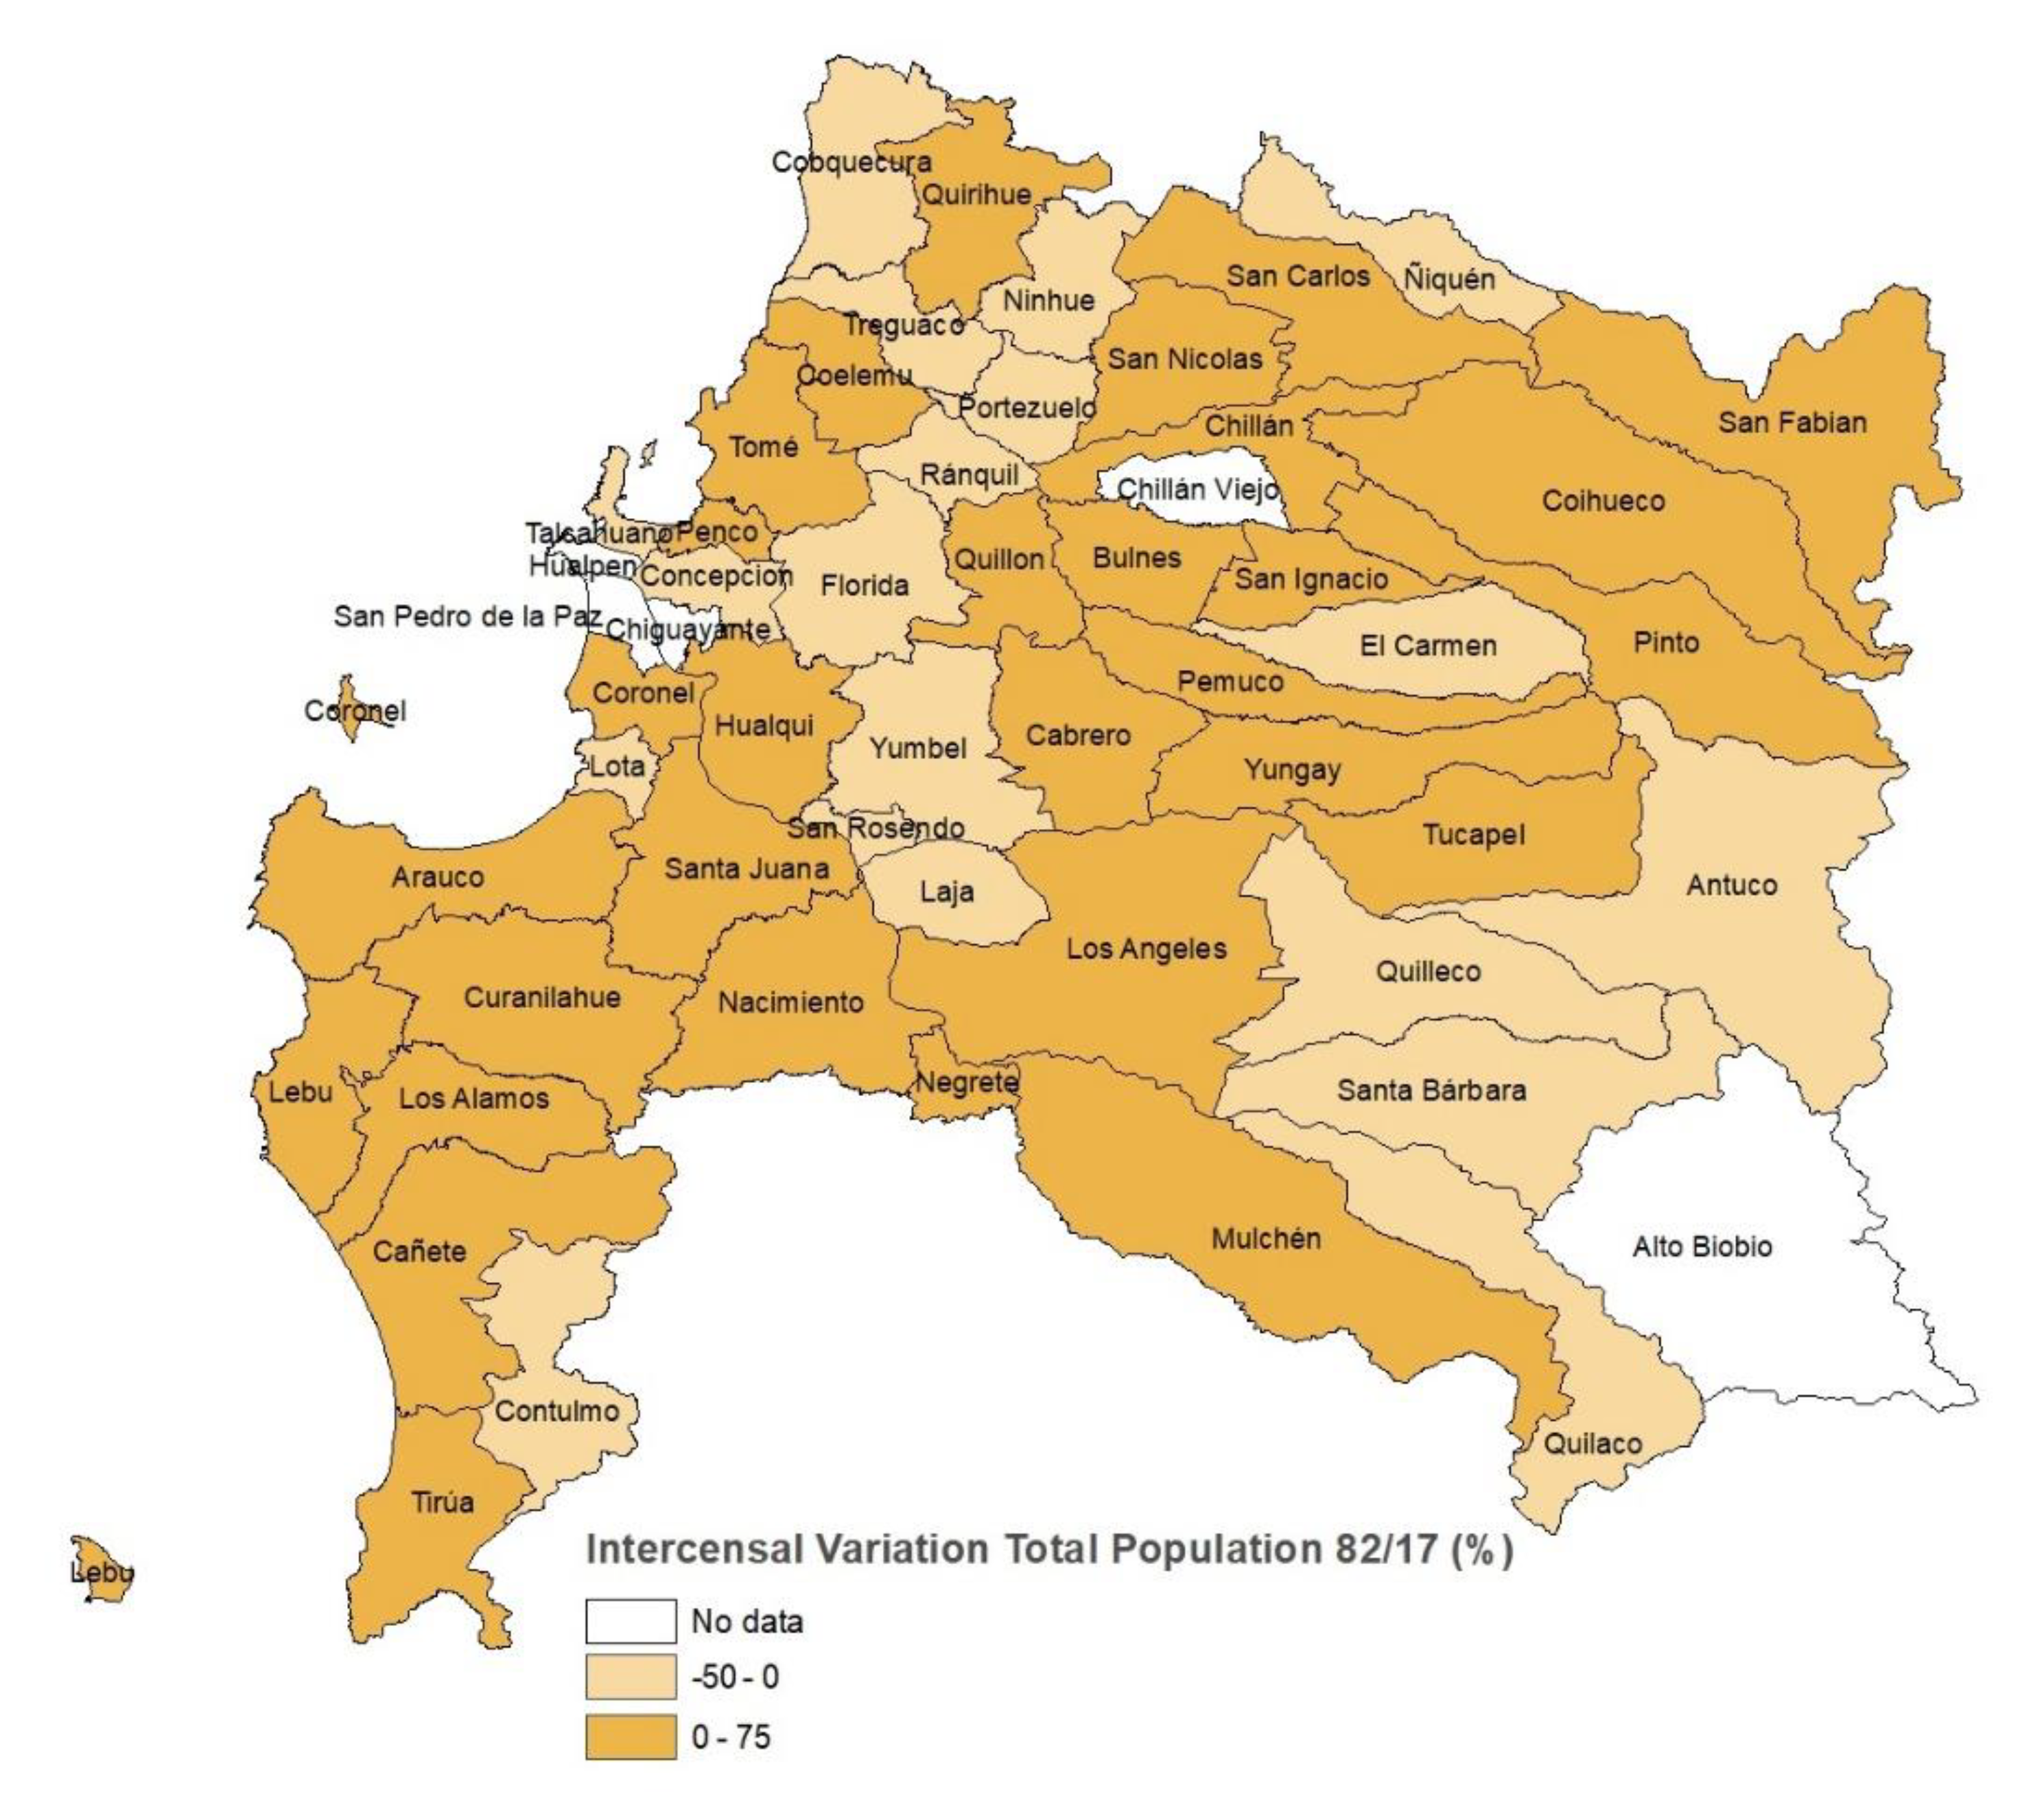
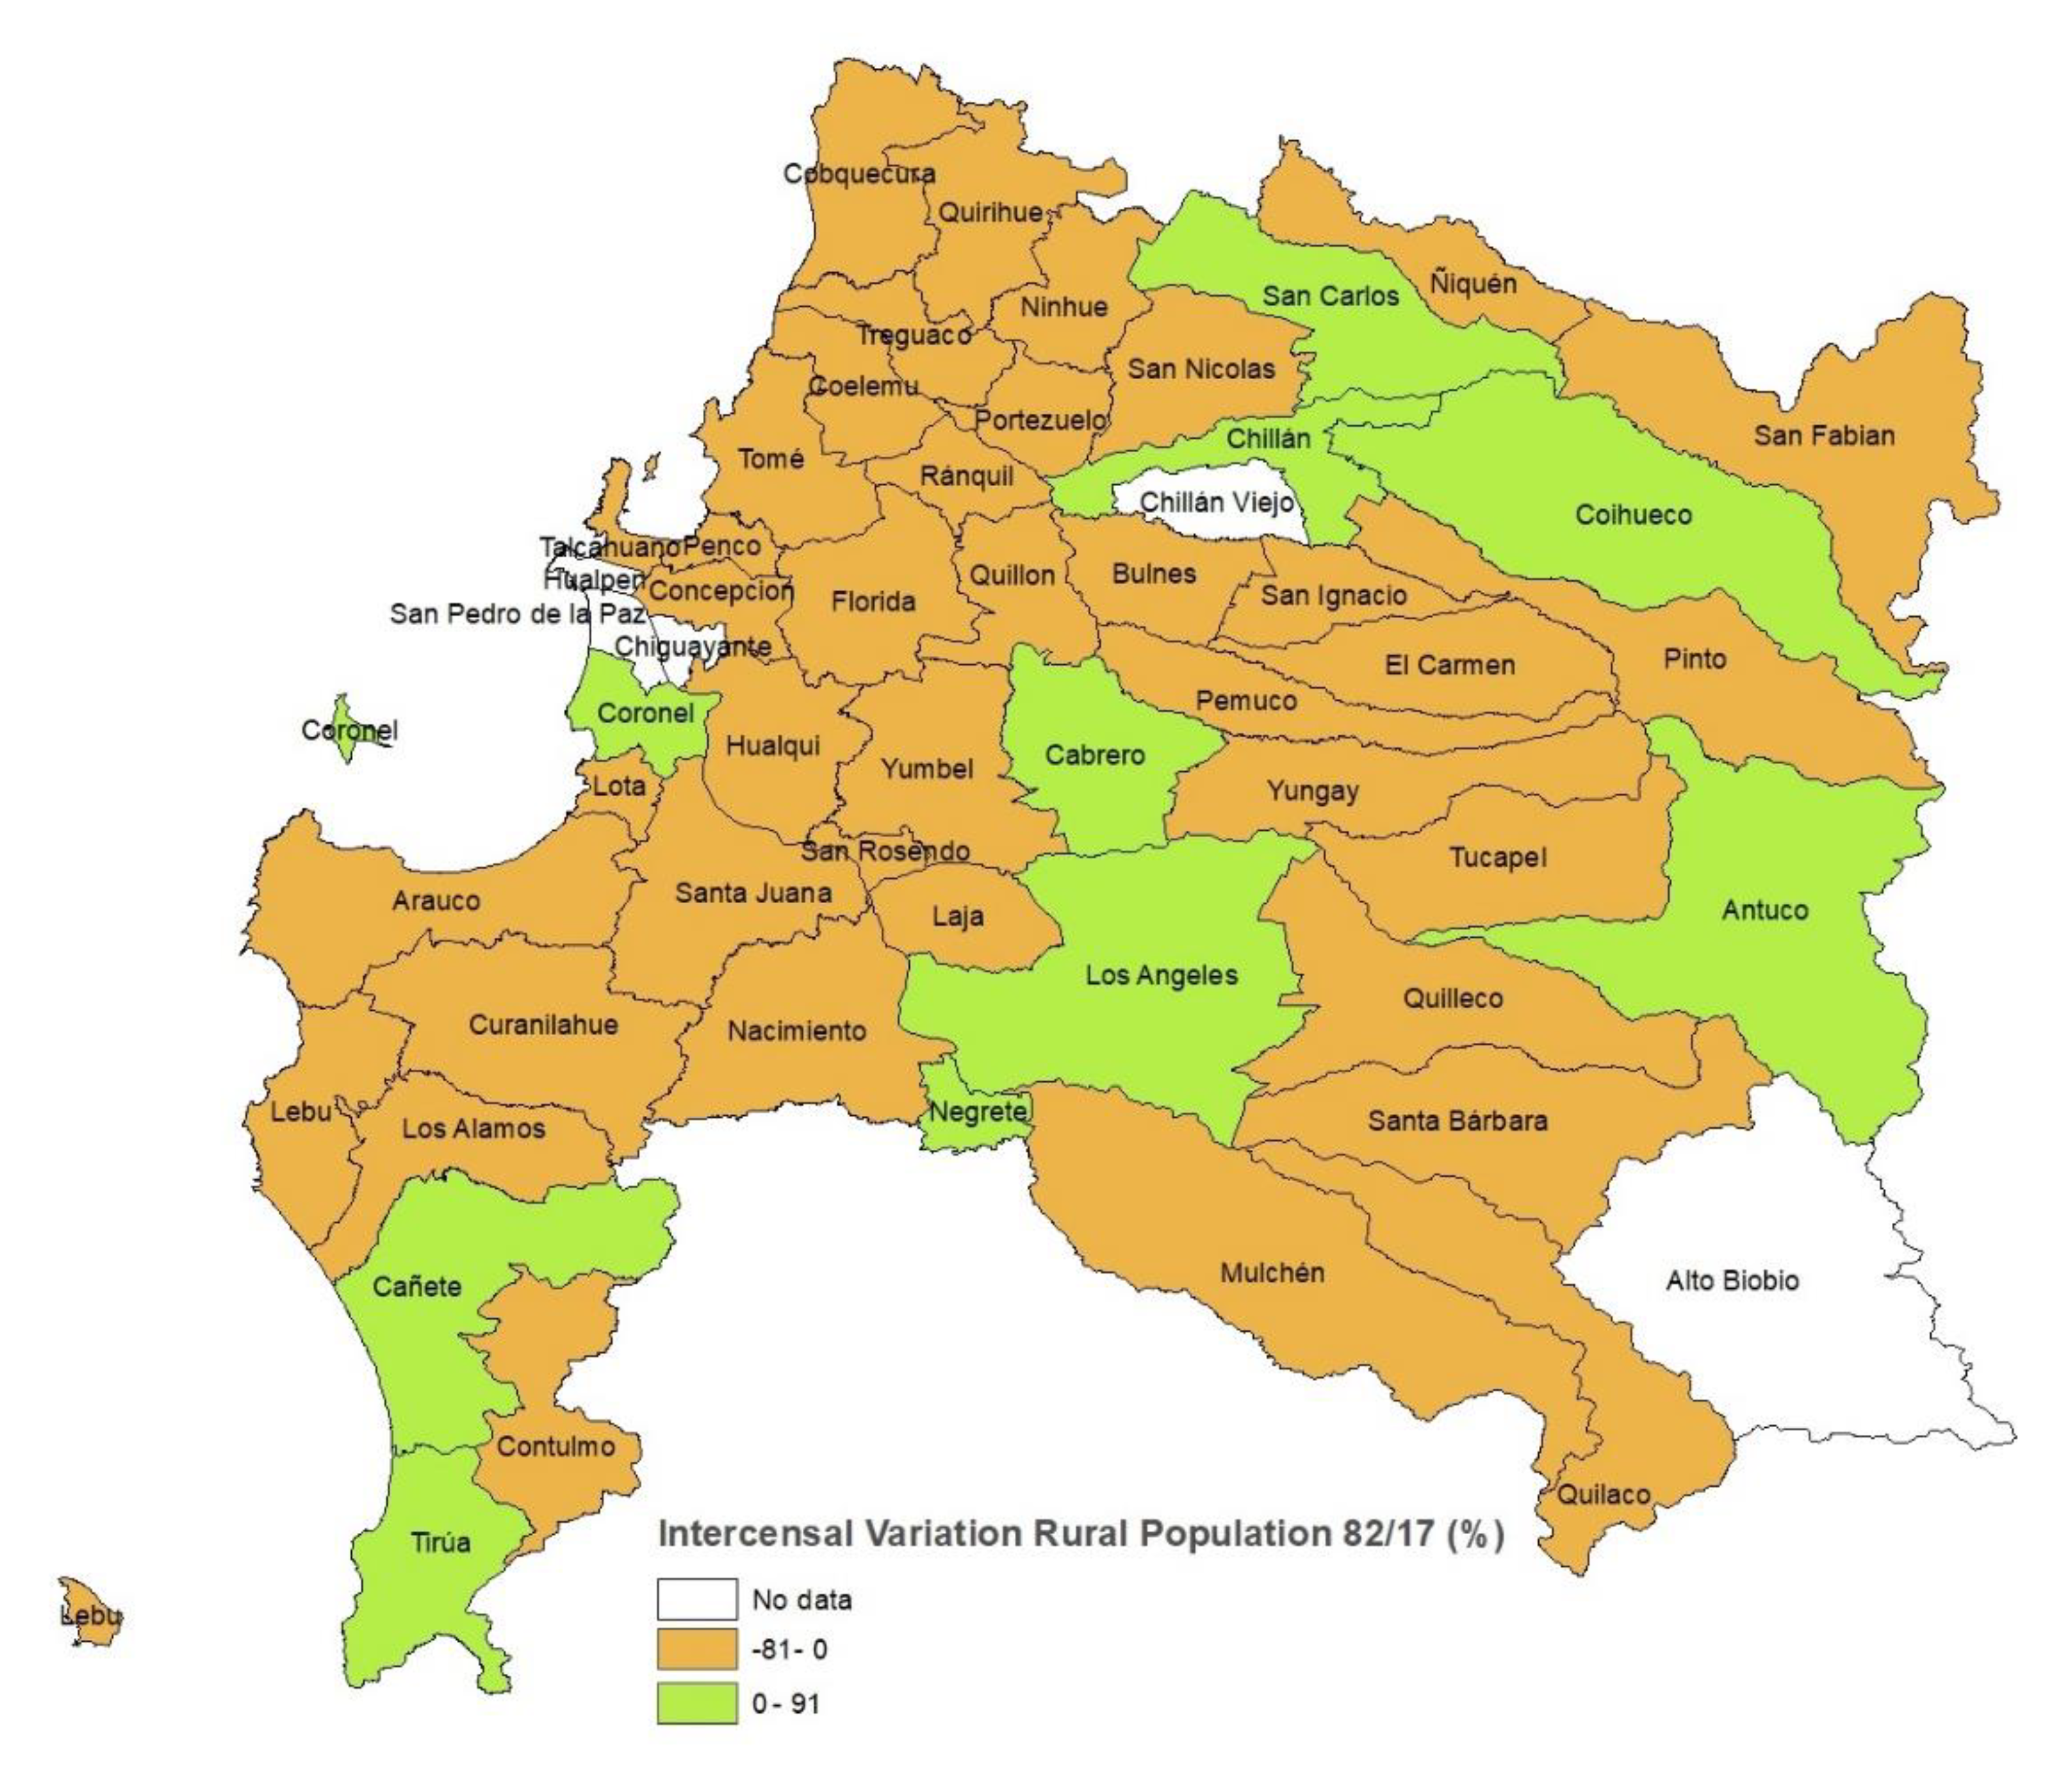
- The results show a significant and inverse correlation between the variation in rural population (VRP) and the variation in the proportion of forest area per county (VPFL). These results are consistent with the descriptive analysis conducted before, which showed an increase in the proportion of forest area and a decrease in rural population (Figure 4 and Figure 7). This relationship can be explained by the forest transition theory [81,82,83,84,85,86,87], which outlines that the economic development of a territory promotes afforestation and therefore rural-urban migration. In fact, Heilmayr et al. [88] would have identified it in Chile driven by the forestry policy analyzed in this study.
- (2)
- There is a positive and significant correlation between indicators related to the increase in poverty (VPR and VPG) and that related to the increase in rural population (VRP). This type of relationship has been previously described in other studies carried out in depressed territories, where the population finally migrates to escape poverty [89,90,91,92,93].
- (3)
- Demographic characteristics are correlated between them. The correlation index that is established between the variation in total population (VTP) and the variation in economically active population (VEAP) is particularly high. In addition, the indicator associated with the increase in aging population (VAI) shows negative correlations with the other two demographic indicators (VTP and VEAP). These results reveal that there is a demographic transition at both regional and country levels, characterized by a decrease in fertility and mortality rates, which results in a lower growth of the total and economically active population and an increase in aging population [72,94].
- (4)
- In terms of educational level, the results show that there is a significant correlation between the variation in elementary education (VEE) and demographic indicators. This correlation is positive in all the indicators, except for the variation in aging population (VAI). These results show that counties in which the proportion of population with elementary education decreases also decrease total (VTP), rural (VRP) and economically active (VEAP) population, but they present an increase in aging population (VAI).
- (5)
- The changes observed in high school education (VHSE) and higher education (VHE) are positively correlated with the variation in total population (VTP), variation in economically active population (VEAP), and also with indicators from other areas. In this sense, the variation in high school education (VHSE) has a positive and significant correlation with the indicators related to the increase in poverty level (VPR and VPG). Similarly, the variation in population with higher education (VHE) is positively correlated with the variation in forest land (VFL). However, these relationships need to interpreted cautiously since, as abovementioned, the trends observed for high school and higher education would be mediated by the political and structural changes of the Chilean educational system.
3.4. Determinants of Territorial Changes
4. Discussion
5. Conclusions
Author Contributions
Funding
Conflicts of Interest
References
- Yu, H.; Xie, W.; Yang, L.; Du, A.; Almeida, C.M.V.B.; Wang, Y. From payments for ecosystem services to eco-compensation: Conceptual change or paradigm shift? Sci. Total Environ. 2020, 700, 134627. [Google Scholar] [CrossRef] [PubMed]
- Brockerhoff, E.G.; Barbaro, L.; Castagneyrol, B.; Forrester, D.I.; Gardiner, B.; González-Olabarria, J.R.; Lyver, P.O.B.; Meurisse, N.; Oxbrough, A.; Taki, H.; et al. Forest biodiversity, ecosystem functioning and the provision of ecosystem services. Biodivers. Conserv. 2017, 26, 3005–3035. [Google Scholar] [CrossRef]
- Kopnina, H. Commodification of natural resources and forest ecosystem services: Examining implications for forest protection. Environ. Conserv. 2017, 44, 24–33. [Google Scholar] [CrossRef]
- García-Nieto, A.P.; García-Llorente, M.; Iniesta-Arandia, I.; Martín-López, B. Mapping forest ecosystem services: From providing units to beneficiaries. Ecosyst. Serv. 2013, 4, 126–138. [Google Scholar] [CrossRef]
- Mustapha, W.F.; Kirkerud, J.G.; Bolkesjø, T.F.; Trømborg, E. Large-scale forest-based biofuels production: Impacts on the Nordic energy sector. Energy Convers. Manag. 2019, 187, 93–102. [Google Scholar] [CrossRef]
- Jin, E.; Sutherland, J.W. An integrated sustainability model for a bioenergy system: Forest residues for electricity generation. Biomass Bioenergy 2018, 119, 10–21. [Google Scholar] [CrossRef]
- Nikodinoska, N.; Buonocore, E.; Paletto, A.; Franzese, P.P. Wood-based bioenergy value chain in mountain urban districts: An integrated environmental accounting framework. Appl. Energy 2017, 186, 197–210. [Google Scholar] [CrossRef]
- Palomo, I.; Dujardin, Y.; Midler, E.; Robin, M.; Sanz, M.J.; Pascual, U. Modeling trade-offs across carbon sequestration, biodiversity conservation, and equity in the distribution of global REDD+ funds. Proc. Natl. Acad. Sci. USA 2019, 116, 22645–22650. [Google Scholar] [CrossRef]
- Kim, D.; Kim, D.; Lee, D.-H.; Park, S.; Kim, S. Centralization of the Global REDD+ Financial Network and Implications under the New Climate Regime. Forests 2019, 10, 753. [Google Scholar] [CrossRef]
- Busch, J.; Strassburg, B.; Cattaneo, A.; Lubowski, R.; Bruner, A.; Rice, R.; Creed, A.; Ashton, R.; Boltz, F. Comparing climate and cost impacts of reference levels for reducing emissions from deforestation. Environ. Res. Lett. 2009, 4. [Google Scholar] [CrossRef]
- Sheppard, J.P.; Chamberlain, J.; Agúndez, D.; Bhattacharya, P.; Chirwa, P.W.; Gontcharov, A.; Sagona, W.C.J.; Shen, H.L.; Tadesse, W.; Mutke, S. Sustainable Forest Management Beyond the Timber-Oriented Status Quo: Transitioning to Co-production of Timber and Non-wood Forest Products—A Global Perspective. Curr. For. Rep. 2020, 26–40. [Google Scholar] [CrossRef]
- Calama Sainz, R.; Tome, M.; Sánchez-González, M.; Miina, J.; Spanos, K.; Palahi, M. Modelling Non-Wood Forest Products in Europe: A review. For. Syst. 2011, 3, 69. [Google Scholar] [CrossRef]
- Janse, G.; Ottitsch, A. Factors influencing the role of Non-Wood Forest Products and Services. For. Policy Econ. 2005, 7, 309–319. [Google Scholar] [CrossRef]
- Keča, L.J.; Keča, N.; Rekola, M. Value chains of Serbian non-wood forest products. Int. For. Rev. 2013, 15, 315–335. [Google Scholar] [CrossRef]
- Weiss, G.; Emery, M.R.; Corradini, G.; Živojinović, I. New values of non-wood forest products. Forests 2020, 11, 165. [Google Scholar] [CrossRef]
- Chiasson, G.; Angelstam, P.; Axelsson, R.; Doyon, F. Land Use Policy Towards collaborative forest planning in Canadian and Swedish hinterlands: Different institutional trajectories? Land Use Policy 2019, 83, 334–345. [Google Scholar] [CrossRef]
- Hoogstra-klein, M.A.; Brukas, V.; Wallin, I. Land Use Policy Multiple-use forestry as a boundary object: From a shared ideal to multiple realities. Land Use Policy 2017, 69, 247–258. [Google Scholar] [CrossRef]
- Sotirov, M.; Storch, S. Land Use Policy Resilience through policy integration in Europe? Domestic forest policy changes as response to absorb pressure to integrate biodiversity conservation, bioenergy use and climate protection in France, Germany, the Netherlands and Sweden. Land Use Policy 2018, 79, 977–989. [Google Scholar] [CrossRef]
- Chazdon, R.L. Beyond Deforestation: Restoring Degraded Lands. Communities 2008, 1458, 1458–1460. [Google Scholar] [CrossRef]
- Messier, C.; Bauhus, J.; Doyon, F.; Maure, F.; Sousa-Silva, R.; Nolet, P.; Mina, M.; Aquilué, N.; Fortin, M.J.; Puettmann, K. The functional complex network approach to foster forest resilience to global changes. For. Ecosyst. 2019, 6. [Google Scholar] [CrossRef]
- Van Holt, T.; Binford, M.W.; Portier, K.M.; Vergara, R. A stand of trees does not a forest make: Tree plantations and forest transitions. Land Use Policy 2016, 56, 147–157. [Google Scholar] [CrossRef]
- Rudel, T.K.; Meyfroidt, P.; Chazdon, R.; Bongers, F.; Sloan, S.; Grau, H.R.; Van Holt, T.; Schneider, L. Whither the forest transition? Climate change, policy responses, and redistributed forests in the twenty-first century. Ambio 2020, 49, 74–84. [Google Scholar] [CrossRef]
- Keenan, R.J.; Reams, G.A.; Achard, F.; de Freitas, J.V.; Grainger, A.; Lindquist, E. Dynamics of global forest area: Results from the FAO Global Forest Resources Assessment 2015. For. Ecol. Manag. 2015, 352, 9–20. [Google Scholar] [CrossRef]
- Ministerio de Hacienda. Evaluación de Impacto al Programa Bonificación Forestal DL 701 (Informe de Síntesis); Ministerio de Hacienda, Dirección de Presupuesto: Santiago, Chile, 2006; p. 15.
- Cabaña, C. Reseña Histórica de la Aplicación del DL 701, de 1974, Sobre Fomento Forestal; CORPORACION NACIONAL FORESTAL: Santiago, Chile, 2011. [Google Scholar]
- Ríos-Núñez, S. Reestructuración del sector agrario1 en chile 1975–2010: Entre el proteccionismo del estado y el modelo económico neoliberal. Rev. Econ. E Sociol. Rural 2013, 51, 515–533. [Google Scholar] [CrossRef]
- Portilla, B. La política Agrícola en Chile: Lecciones de Tres Décadas; Serie Desarrollo Productivo; Naciones Unidas CEPAL, Div. De Desarrollo Productivo y Empresarial, Unidad de Desarrollo Agrícola: Santiago, Chile, 2001; Volume 68, ISBN 9213215630. [Google Scholar]
- Oficina de Estudios y Politica Agraria (ODEPA). Agricultura Chilena, Reflexiones y Desafíos al 2030, 1st ed.; Oficina de Estudios y Politica Agraria (ODEPA): Santiago, Chile, 2017; ISBN 978-956-7244-30-0.
- Lacayo, R.; Morales, C. An Analysis of the Performance of Chilean Agricultural Exports (1994–2004). Interciencia 2007, 32, 296–302. [Google Scholar]
- Arnade, C.; Sparks, A. Chile’s agricultural diversification. Agric. Econ. 1993, 9, 1–13. [Google Scholar] [CrossRef]
- Kay, C. Chile’s neoliberal agrarian transformation and the peasantry. J. Agrar. Chang. 2002, 2, 464–501. [Google Scholar] [CrossRef]
- Murray, W.E. The neoliberal inheritance: Agrarian policy and rural differentiation in democratic Chile. Bull. Lat. Am. Res. 2002, 21, 425–441. [Google Scholar] [CrossRef]
- Gwynne, R.N. Globalisation, commodity chains and fruit exporting regions in Chile. Tijdschr. Voor Econ. Soc. Geogr. 1999, 90, 211–225. [Google Scholar] [CrossRef]
- Murray, W.E. Neo-feudalism in Latin America? Globalisation, agribusiness, and land re-concentration in Chile. J. Peasant Stud. 2006, 33, 646–677. [Google Scholar] [CrossRef]
- Rehner, J.; Baeza, S.A.; Barton, J.R. Chile’s resource-based export boom and its outcomes: Regional specialization, export stability and economic growth. Geoforum 2014, 56, 35–45. [Google Scholar] [CrossRef]
- Barton, J.R.; Murray, W.E. Grounding geographies of economic globalisation: Globalised spaces in chile’s non-traditional export sector, 1980–2005. Tijdschr. Voor Econ. Soc. Geogr. 2009, 100, 81–100. [Google Scholar] [CrossRef]
- Rossi, I. Desarrollo y competitividad del sector Forestal-Maderero. In Auge Export; Lecciones Y Desafíos Futuros; CIEPLAN: Santiago, Chile, 1995; pp. 1–27. [Google Scholar]
- Fiabane Salas, C. Temporada Agrícola; Primer Semestre; Oficina de Estudios y Políticas Públicas (ODEPA): Santiago, Chile, 1998; p. 16.
- Mardones, C.; Hernández, A. Análisis de subsidio al sector silvícola de la región del Biobío, Chile. Madera Bosques 2017, 23, 53–68. [Google Scholar] [CrossRef]
- Clapp, R.A. Waiting for the Forest Law: Resource-Led Development and Environmental Politics in Chile Author (s): Roger Alex Clapp Source: Latin American Research Review. The Latin American Studies Association. Lat. Am. Stud. Assoc. 2018, 33, 3–36. [Google Scholar]
- Clapp, R.A. Tree farming and forest conservation in chile: Do replacement forests leave any originals behind? Soc. Nat. Resour. 2001, 14, 341–356. [Google Scholar] [CrossRef]
- Nahuelhual, L.; Carmona, A.; Lara, A.; Echeverría, C.; González, M.E. Land-cover change to forest plantations: Proximate causes and implications for the landscape in south-central Chile. Landsc. Urban Plan. 2012, 107, 12–20. [Google Scholar] [CrossRef]
- Zamorano-Elgueta, C.; Rey Benayas, J.M.; Cayuela, L.; Hantson, S.; Armenteras, D. Native forest replacement by exotic plantations in southern Chile (1985-2011) and partial compensation by natural regeneration. For. Ecol. Manag. 2015, 345, 10–20. [Google Scholar] [CrossRef]
- Braun, A.C.; Troeger, D.; Garcia, R.; Aguayo, M.; Barra, R.; Vogt, J. Assessing the impact of plantation forestry on plant biodiversity: A comparison of sites in Central Chile and Chilean Patagonia. Glob. Ecol. Conserv. 2017, 10, 159–172. [Google Scholar] [CrossRef]
- Nahuelhual, L.; Carmona, A.; Aguayo, M.; Echeverria, C. Land use change and ecosystem services provision: A case study of recreation and ecotourism opportunities in southern Chile. Landsc. Ecol. 2014, 29, 329–344. [Google Scholar] [CrossRef]
- González-Hidalgo, M.; Zografos, C. How sovereignty claims and “negative” emotions influence the process of subject-making: Evidence from a case of conflict over tree plantations from Southern Chile. Geoforum 2017, 78, 61–73. [Google Scholar] [CrossRef]
- Torres-Salinas, R.; Azócar García, G.; Carrasco Henríquez, N.; Zambrano-bigiarini, M.; Costa, T.; Bolin, B. Forestry Development, Water Scarcity, and the Mapuche Protest for Environmental Justice in Chile. Ambiente Soc. 2016, 19, 121–144. [Google Scholar] [CrossRef]
- Díaz, G.I.; Nahuelhual, L.; Echeverría, C.; Marín, S. Drivers of land abandonment in Southern Chile and implications for landscape planning. Landsc. Urban Plan. 2011, 99, 207–217. [Google Scholar] [CrossRef]
- Briones, P.S.; Sepúlveda-Varas, A. Transiciones sistemáticas en cobertura y uso del suelo para sub-cuenca pre andina de alta intervención antrópica, Región de la Araucanía, Chile. Cienc. E Investig. Agrar. 2016, 43, 396–407. [Google Scholar] [CrossRef]
- Torres, R.; Azócar, G.; Rojas, J.; Montecinos, A.; Paredes, P. Vulnerability and resistance to neoliberal environmental changes: An assessment of agriculture and forestry in the Biobio region of Chile (1974–2014). Geoforum 2015, 60, 107–122. [Google Scholar] [CrossRef]
- Andersson, K.; Lawrence, D.; Zavaleta, J.; Guariguata, M.R. More Trees, More Poverty? The Socioeconomic Effects of Tree Plantations in Chile, 2001–2011. Environ. Manag. 2015, 57, 123–136. [Google Scholar] [CrossRef] [PubMed]
- Patterson, M.W. Dynamic equi fi nality: The case of south-central Chile’s evolving forest landscape. Appl. Geogr. 2011, 31, 641–649. [Google Scholar] [CrossRef]
- Izquierdo, A.E.; De Angelo, C.D.; Aide, T.M. Thirty Years of Human Demography and Land-Use Change in the Atlantic Forest of Misiones, Argentina: An Evaluation of the Forest Transition Model. Ecol. Soc. 2008, 13, 3. [Google Scholar] [CrossRef]
- Hussain, J.; Zhou, K.; Akbar, M.; Zafar, M.; Raza, G.; Ali, S.; Hussain, A.; Abbas, Q.; Khan, G. Dependence of rural livelihoods on forest resources in Naltar Valley, a dry temperate mountainous region, Pakistan. Glob. Ecol. Conserv. 2019, 20, e00765. [Google Scholar] [CrossRef]
- Meijaard, E.; Abram, N.K.; Wells, J.A.; Pellier, A.; Ancrenaz, M.; Gaveau, D.L.A.; Runting, R.K.; Mengersen, K. People’s Perceptions about the Importance of Forests on Borneo. PLoS ONE 2013, 8. [Google Scholar] [CrossRef]
- Pelyukh, O.; Paletto, A. Stakeholder Analysis to Support Secondary Norway Spruce (Picea abies (L.) Karst. Forest Conversion in the Ukrainian Carpathians. Acta Silv. Lign. Hung 2019, 15, 69–84. [Google Scholar] [CrossRef][Green Version]
- Sharp, E.A.; Spooner, P.G.; Millar, J.; Briggs, S.V. Can’t see the grass for the trees? Community values and perceptions of tree and shrub encroachment in south-eastern Australia. Landsc. Urban Plan. 2012, 104, 260–269. [Google Scholar] [CrossRef]
- Isoaho, K.; Janasik-Honkela, N.; Burgas Riera, D.; Peura, M.; Mönkkönen, M.; Toikka, A.; Hukkinen, J. Changing forest stakeholders’ perception of ecosystem services with linguistic nudging. Ecosyst. Serv. 2018, 40, 101028. [Google Scholar] [CrossRef]
- Cuni-Sanchez, A.; Ngute, A.S.K.; Sonké, B.; Sainge, M.N.; Burgess, N.D.; Klein, J.A.; Marchant, R. The importance of livelihood strategy and ethnicity in forest ecosystem services’ perceptions by local communities in north-western Cameroon. Ecosyst. Serv. 2019, 40, 101000. [Google Scholar] [CrossRef]
- Kreye, R. Adams Public Attitudes about Private Forest Management and Government Involvement in the Southeastern United States. Forests 2019, 10, 776. [Google Scholar] [CrossRef]
- Rudel, T.K. Tree farms: Driving forces and regional patterns in the global expansion of forest plantations. Land Use Policy 2009, 26, 545–550. [Google Scholar] [CrossRef]
- Adams, C.; Rodrigues, S.T.; Calmon, M.; Kumar, C. Impacts of large-scale forest restoration on socioeconomic status and local livelihoods: What we know and do not know. Biotropica 2016, 48, 731–744. [Google Scholar] [CrossRef]
- Frayer, J.; Sun, Z.; Müller, D.; Munroe, D.K.; Xu, J. Analyzing the drivers of tree planting in Yunnan, China, with Bayesian networks. Land Use Policy 2014, 36, 248–258. [Google Scholar] [CrossRef]
- Matteucci, S.D.; Totino, M.; Arístide, P. Ecological and social consequences of the Forest Transition Theory as applied to the Argentinean Great Chaco. Land Use Policy 2016, 51, 8–17. [Google Scholar] [CrossRef]
- Vergara Diaz, G.; Sandoval Vasquez, V.; Herrera Machuca, M.A. Análisis del Cambio Temporal y Espacial del Uso del Suelo en la Región Centro-Sur de Chile. Ciênc. Florest. 2018, 28, 1831–1844. [Google Scholar] [CrossRef]
- Barrera Pedraza, D. Celulosa Chilena: Avances y Perspectivas de su Comercio Exterior: Enero de 2018; Oficina de Estudios y Políticas Públicas (ODEPA): Santiago, Chile, 2018.
- Biblioteca Congreso Nacional de Chile. Sistema Integrado de Información Territorial Nuestro País—Regiones. Available online: https://www.bcn.cl/siit/nuestropais/regiones (accessed on 7 July 2020).
- Corporación Nacional Forestal Estadísticas Forestales. Available online: https://www.conaf.cl/nuestros-bosques/bosques-en-chile/estadisticas-forestales/ (accessed on 7 July 2020).
- CONAF Catastro del Uso del Suelo. Monitoreo y Actualización, Región del Biobío. Periodo 1998–2008; Corporación Nacional Forestal: Concepción, Chile, 2011. [Google Scholar]
- Echeverria, C.; Coomes, D.; Salas, J.; Rey-Benayas, J.M.; Lara, A.; Newton, A. Rapid deforestation and fragmentation of Chilean Temperate Forests. Biol. Conserv. 2006, 130, 481–494. [Google Scholar] [CrossRef]
- Aedo Gutierrez, V.; Cabaña Chavez, C. Plantaciones Forestales Efectuadas Durante el Año 2018; Corporación Nacional Forestal: Santiago, Chile, 2019. [Google Scholar]
- Apella, I.; Packard, T.; Jaubert, C.M. Zumaeta Retos Y Oportunidades Del Envejecimiento En Chile; Grupo del Banco Mundial: Santiago, Chile, 2019; pp. 1–214. [Google Scholar]
- Subsecretaria de Desarrollo Regional, Chile. Universidad de Concepción, Chile Línea Base, Consideraciones y Propuestas Técnicas para Determinar Pertinencia de Creación de Nueva Región de Ñuble; Subsecretaría de Desarrollo Regional: Santiago, Chile, 2014; p. 324.
- Nuñez Muñozo, C.; Gonzalez Niculcar, B.; Ascorra Costa, P.; Grech, S. Contar para Comprender: Cierre de Escuelas Rurales Municipales en Chile y sus Implicancias para las Comunidades. Educ. Soc. 2020, 41, e215922. [Google Scholar] [CrossRef]
- Gallego, F.; Rodriguez, C.; Sauma, E. Provisión de Educación en Zonas Rurales de Chile: Incentivos, Costos y Calidad. In Camino al Bicentenario: Propuestas para Chile; Pontificia Universidad Católica de Chile: Santiago, Chile, 2007; pp. 47–74. [Google Scholar]
- Alvarez Chuart, J.; Fuentealba Araya, T. Derechos en Acción: Cómo ha Cambiado la Infancia en Chile en 25 Años; Derechos en Acción; CIDENI Centro Iberoamericano de Derechos del Niño: Santiago, Chile, 2019; p. 56. [Google Scholar]
- Cariola, H.M.L.; Belleï, C.; Nuñez Prieto, I. Veinte Años de Políticas de Educación Media en Chile; Instituto Internacional de Planeamiento de la Educación (IIPE-UNESCO): Santiago, Chile, 2003. [Google Scholar]
- Arellano, J.P. La reforma educacional chilena. Rev. Cepal 2001, 73, 83–94. [Google Scholar] [CrossRef]
- Oficina Internacional de Educación UNESCO. La Educación Chilena en el Cambio de Siglo: Políticas, Resultados, Desafíos; UNESCO: Santiago, Chile, 2004. [Google Scholar]
- OCDE; Banco Mundial. La Educación Superior en Chile; Ministerio de Educación: Santiago, Chile, 2009; ISBN 978-9264054141. [Google Scholar]
- Mather, A.S. The forest transition. Area 1992, 24, 367–379. [Google Scholar] [CrossRef]
- Rudel, T.K.; Schneider, L.; Uriarte, M. Forest transitions: An introduction. Land Use Policy 2010, 27, 95–97. [Google Scholar] [CrossRef]
- Mather, A.S.; Needle, C.L. The forest transition: A theoretical basis. Area 1998, 30, 117–124. [Google Scholar] [CrossRef]
- Mather, A.S.; Fairbairn, J. From Floods to Reforestation: The Forest Transition in Switzerland. Environ. Hist Camb. 2000, 6, 399–421. [Google Scholar] [CrossRef]
- Mather, A.S. Forest transition theory and the reforesting of Scotland. Scott. Geogr. J. 2004, 120, 83–98. [Google Scholar] [CrossRef]
- Mather, A.S. Recent Asian forest transitions in relation to foresttransition theory. Int. For. Rev. 2007, 9, 491–502. [Google Scholar] [CrossRef]
- Barbier, E.B.; Burgess, J.C.; Grainger, A. The forest transition: Towards a more comprehensive theoretical framework. Land Use Policy 2010, 27, 98–107. [Google Scholar] [CrossRef]
- Heilmayr, R.; Echeverría, C.; Fuentes, R.; Lambin, E.F. A plantation-dominated forest transition in Chile. Appl. Geogr. 2016, 75, 71–82. [Google Scholar] [CrossRef]
- De Haan, A. Livelihoods and poverty: The role of migration—A critical review of the migration literature. J. Dev. Stud. 1999, 36, 1–47. [Google Scholar] [CrossRef]
- Tang, S. Determinants of migration and household member arrangement among poor rural households in China: The case of North Jiangsu. Popul. Space Place 2020, 26. [Google Scholar] [CrossRef]
- Milbourne, P.; Doheny, S. Older people and poverty in rural Britain: Material hardships, cultural denials and social inclusions. J. Rural Stud. 2012, 28, 389–397. [Google Scholar] [CrossRef]
- Pratomo, D.S. Can rural-urban migrants escape from poverty? Evidence from four indonesian cities. Econ. Sociol. 2018, 11, 173–183. [Google Scholar] [CrossRef] [PubMed]
- Wildayana, E.; Armanto, M.E.; Idrus, Z.; Radiatmoko, I.A.; Umar, S.A.; Syakina, B.; Nursittah, N.; Mubarika, M.; Oktavia, R.; Sari, E. Surviving Strategies of Rural Livelihoods in South Sumatra Farming System, Indonesia. E3s Web Conf. 2018, 68, 1–9. [Google Scholar] [CrossRef]
- Rodriguez Tapia, J.C.; Russo Namias, M.A.; Carrasco Gorman, M.P. Políticas públicas para una población que envejece: Panorama y propuestas para el sistema de salud chileno Políticas públicas para una población que envejece: Panorama y propuestas para el sistema de salud chileno. Temas Agenda Pública 2017, 12, 12. [Google Scholar]
- Aguilera, A.M.J. El envejecimiento de la población en aragón. Estud. Geogr. 1996, 57, 573–595. [Google Scholar] [CrossRef]
- Issahaku, P.A.; Neysmith, S. Policy implications of population ageing in West Africa. Int. J. Sociol. Soc. Policy 2013, 33, 186–202. [Google Scholar] [CrossRef]
- Joseph, A.E.; Phillips, D.R. Ageing in rural China: Impacts of increasing diversity in family and community resources. J. Cross-Cult. Gerontol. 1999, 14, 153–168. [Google Scholar] [CrossRef]
- Brabyn, L.; Jackson, N.O. A new look at population change and regional development in Aotearoa New Zealand. N. Z. Geogr. 2019, 75, 116–129. [Google Scholar] [CrossRef]
- Albala, C. El Envejecimiento De La Población Chilena Y Los Desafíos Para La Salud Y El Bienestar De Las Personas Mayores. Rev. Médica Clínica Las Condes 2020, 31, 7–12. [Google Scholar] [CrossRef]
- Díaz Rojas, C. Mujeres Rurales en Chile; Servicio Nacional de la Mujer: Santiago, Chile, 2005; p. 109.
- Gurruchaga, H.H. La Población Chilena: Dinámica demográfica, prospectiva y problemas. Tiempo Y Espac. 1994, 4, 8–36. [Google Scholar]
- Fawaz, Y.M.J. Expansión forestal en Nuble y reestructuración social y productiva a nivel local. Percepción de los actores 1. Tiempo Y Espac. 2013, 9–10, 53–73. [Google Scholar]
- Oyarzun Mendez, E.G. La economía rural en Chile: Entre la pobreza y el desarrollo. Estud. Econ. Apl. 2011, 29, 35–56. [Google Scholar] [CrossRef]
- Osuri, A.M.; Gopal, A.; Raman, T.R.S.; Defries, R.; Cook-Patton, S.C.; Naeem, S. Greater Stability of Carbon Capture in Species-Rich Natural Forests Compared to Species-Poor Plantations. Environ. Res. Lett. 2020, 15, 034011. [Google Scholar] [CrossRef]
- Baruch, Z.; Nozawa, S.; Johnson, E.; Yerena, E. Ecosystem dynamics and services of a paired Neotropical montane forest and pine plantation. Rev. Biol. Trop. 2019, 67, 24–35. [Google Scholar] [CrossRef]
- Miyamoto, M. Poverty reduction saves forests sustainably: Lessons for deforestation policies. World Dev. 2020, 127, 104746. [Google Scholar] [CrossRef]
- Oldekop, J.A.; Sims, K.R.E.; Karna, B.K.; Whittingham, M.J.; Agrawal, A. Reductions in deforestation and poverty from decentralized forest management in Nepal. Nat. Sustain. 2019, 2, 421–428. [Google Scholar] [CrossRef]
- Sathler, D.; Adamo, S.B.; Lima, E.E.C. Deforestation and local sustainable development in Brazilian Legal Amazonia: An exploratory analysis. Ecol. Soc. 2018, 23. [Google Scholar] [CrossRef]
- Sims, K.R.E.; Alix-Garcia, J.M. Parks versus PES: Evaluating direct and incentive-based land conservation in Mexico. J. Environ. Econ. Manag. 2017, 86, 8–28. [Google Scholar] [CrossRef]
- Tien, N.D.; Rañola, R.F.; Thuy, P.T. Potential impact of the REDD+ program on poverty reduction in Nghe an province, Vietnam. Forests 2017, 8, 376. [Google Scholar] [CrossRef]
- Tegegne, Y.T.; Lindner, M.; Fobissie, K.; Kanninen, M. Evolution of drivers of deforestation and forest degradation in the Congo Basin forests: Exploring possible policy options to address forest loss. Land Use Policy 2016, 51, 312–324. [Google Scholar] [CrossRef]
- Pirard, R.; Dal, L.; Warman, R. Do timber plantations contribute to forest conservation? Environ. Sci. Policy 2016, 57, 122–130. [Google Scholar] [CrossRef]
- Khaine, I.; Woo, S.Y. Study on the extent of support of current forest management to local people by comparing natural forests and plantation forests in Myanmar. For. Sci. Technol. 2014, 10, 172–177. [Google Scholar] [CrossRef][Green Version]
- Tyynelä, T.M. Social benefits of natural woodlands and eucalyptus woodlots in mukarakate, North Eastern Zimbabwe. For. Trees Livelihoods 2001, 11, 29–45. [Google Scholar] [CrossRef]
- Uribe, S.; Estades, F.; Radeloff, V.C. Pine plantations and five decades of land use change in central Chile. PLoS ONE 2020, 15, e0230193. [Google Scholar] [CrossRef]
- Little, C.; Lara, A.; McPhee, J.; Urrutia, R. Revealing the impact of forest exotic plantations on water yield in large scale watersheds in South-Central Chile. J. Hydrol. 2009, 374, 162–170. [Google Scholar] [CrossRef]
- León-Muñoz, J.; Echeverría, C.; Fuentes, R.; Aburto, F. How is the land use-cover changing in drinking water catchments in the coastal range of south-central Chile (35°–38.5° S)? Bosque (Valdivia) 2017, 38, 203–209. [Google Scholar] [CrossRef]
- Soto-Schönherr, S.; Iroumé, A. How much water do Chilean forests use? A review of interception losses in forest plot studies. Hydrol. Process. 2016, 30, 4674–4686. [Google Scholar] [CrossRef]


| Dimension | Variable | Indicator | Acronym | Definition |
|---|---|---|---|---|
| Productive | Forest land | Inter-census variation in forest land | VFL | Percentage variation of forest land between Census 1977 and Census 2007 |
| Inter-census variation in the proportion of forest land | VPFL | Variation in percentage point changes in forest land proportion between Census 1977 and Census 2007. The forest land proportion corresponds to the county’s forest land based on the total surveyed area. | ||
| Demographic | Total population | Inter-census variation in total population | VTP | Percentage variation in total population between Census 1982 and Census 2017 |
| Economically active population (EAP) | Inter-census variation in economically active population (EAP) | VEAP | Percentage variation in EAP between Census 1982 and Census 2017. The EAP corresponds to population aged 15 to 64. | |
| Rural population | Inter-census variation in rural population | VRP | Percentage variation in rural population between Census 1982 and Census 2017 | |
| Aged population | Inter-census variation in Aging Index | VAI | Percentage variation in Aging Index between Census 1982 and Census 2017. The Aging Index is the proportion of people older than 60 to 100 people younger than 15. | |
| Socio-economical | Poverty | Variation in poverty rate | VPR | Variation in percentage point changes in poverty rate between 1992 and 2013. The poverty rate is the percentage of poor people with respect to the total population in a given area. |
| Variation in poverty gap | VPG | Variation in percentage point changes in poverty gap between 1992 and 2013. Poverty gap measures the difference in percentage points between the county’s and the country’s poverty rate | ||
| Educational | Educational Level | Variation in Elementary Education | VEE | Percentage variation in population with Elementary Education between 1992 and 2017 |
| Variation in High School Education | VHSE | Percentage variation in population with High School Education between 1992 and 2017 | ||
| Variation in Higher Education | VHE | Percentage variation in population with Higher Education between 1992 and 2017 |
| Productive | Demographic | Socioeconomic | Educational | ||||||||
|---|---|---|---|---|---|---|---|---|---|---|---|
| VFL | VPFL | VTP | VRP | VEAP | VAI | VPR | VPG | VEE | VHSE | VHE | |
| VFL | 0.40 * | 0.46 ** | |||||||||
| VPFL | 0.40 * | −0.31 * | |||||||||
| VPT | 0.66 ** | 0.99 ** | −0.66 ** | 0.88 ** | 0.33 * | 0.37 * | |||||
| VRP | −0.31 * | 0.66 ** | 0.66 ** | 0.32 * | 0.37 * | 0.48 ** | |||||
| VEAP | 0.99 ** | 0.66 ** | −0.68 ** | 0.89 ** | 0.39 * | 0.40 * | |||||
| RAI | −0.66 ** | −0.68 ** | 0.17 * | −0.60 ** | |||||||
| VPR | 0.32 * | 0.95 ** | 0.35 * | ||||||||
| VPG | 0.37 * | 0.17 * | 0.95 ** | 0.40 * | |||||||
| VEE | 0.88 ** | 0.48 ** | 0.89 ** | −0.60 ** | 0.49 ** | 0.54 ** | |||||
| VHSE | 0.33 * | 0.39 * | 0.35 * | 0.40 * | 0.49 ** | 0.67 ** | |||||
| VHE | 0.46 ** | 0.37 * | 0.40 * | 0.54 ** | 0.67 ** | ||||||
| Dimension | Variables | Multiple Linear Regression Models Dependent Variables | ||
|---|---|---|---|---|
| VTP (1) | VTP (2) | VPR (3) | ||
| All the territory | Coastal Mountain Range | |||
| Standardized regression coefficients (B) | ||||
| Constant | 75.39 ** | 96.5 ** | −38.82 ** | |
| Productive | VPFL | −0.89 * | 0.99 ** | |
| Socioeconomic | VRP | 0.3 ** | 0.3 ** | |
| Demographic | VAI | −0.28 * | ||
| Educational | VEE | 1.78 ** | 2.47 ** | |
| Model diagnostics | ||||
| R2 adjusted | 0.88 | 0.86 | 0.62 | |
| F ** | 78.99 ** | 41.82 ** | 1.31 * | |
| N | 37 | 17 | 17 | |
Publisher’s Note: MDPI stays neutral with regard to jurisdictional claims in published maps and institutional affiliations. |
© 2020 by the authors. Licensee MDPI, Basel, Switzerland. This article is an open access article distributed under the terms and conditions of the Creative Commons Attribution (CC BY) license (http://creativecommons.org/licenses/by/4.0/).
Share and Cite
Cerda, R.; Gallardo-Cobos, R.; Sánchez-Zamora, P. An Analysis of the Impact of Forest Policy on Rural Areas of Chile. Forests 2020, 11, 1105. https://doi.org/10.3390/f11101105
Cerda R, Gallardo-Cobos R, Sánchez-Zamora P. An Analysis of the Impact of Forest Policy on Rural Areas of Chile. Forests. 2020; 11(10):1105. https://doi.org/10.3390/f11101105
Chicago/Turabian StyleCerda, Raúl, Rosa Gallardo-Cobos, and Pedro Sánchez-Zamora. 2020. "An Analysis of the Impact of Forest Policy on Rural Areas of Chile" Forests 11, no. 10: 1105. https://doi.org/10.3390/f11101105
APA StyleCerda, R., Gallardo-Cobos, R., & Sánchez-Zamora, P. (2020). An Analysis of the Impact of Forest Policy on Rural Areas of Chile. Forests, 11(10), 1105. https://doi.org/10.3390/f11101105