Abstract
Research Highlights: This study provides a comprehensive set of wood and pulping properties of Acacia crassicarpa A.Cunn. ex Benth. to assess variation and efficient sampling strategies for whole-tree level phenotyping. Background and Objectives: A. crassicarpa is an important tree species in Southeast Asia, with limited knowledge about its wood properties. The objective of this study was to characterize important wood properties and pulping performance of improved germplasm of the species. Furthermore, we investigated within-tree patterns of variation and evaluated the efficiency of phenotyping strategies. Materials and Methods: Second-generation progeny trials were studied, where forty 50-month-old trees were selected for destructive sampling and assessed for wood density, kraft pulp yield, α-cellulose, carbohydrate composition, and lignin content and composition (S/G ratio). We estimated the phenotypic correlations among traits determined within-tree longitudinal variation and its importance for whole-tree level phenotyping. Results: The mean whole-tree disc basic density was 481 kg/m3, and the screened kraft pulp yield was 53.8%. The reliabilities of each sampling position to predict whole-tree properties varied with different traits. For basic density, pulp yield, and glucose content, the ground-level sampling could reliably predict the whole-tree property. With near infrared reflectance spectroscopy predictions as an indirect measurement method for disc basic density, we verified reduced reliability values for breast height sampling but sufficiently correlated to allow accurate ranking and efficient selection of genotypes in a breeding program context. Conclusions: We demonstrated the quality of A. crassicarpa as a wood source for the pulping industry. The wood and pulping traits have high levels of phenotypic variation, and standing tree sampling strategies can be performed for both ranking and high-accuracy phenotyping purposes.
1. Introduction
Acacia crassicarpa A.Cunn. ex Benth. is a fast-growing tree species largely used as a wood source in Southeast Asia [1] where planted forests are supported by advancements in silviculture [2], genetic improvement by recurrent selection strategies, vegetative propagation, and, recently, use of molecular tools [3,4,5]. The primary use of the species’ wood is for pulp and paper production, where large vertically integrated companies in the region have hundreds of thousands of hectares of A. crassicarpa forests comprising a major component of their wood supply chain [6,7].
Targeting higher pulp production efficiency, one of the main breeding objectives is to improve the wood quality to optimize cellulose yield and chemical consumption during the pulping process. Furthermore, the pulp industry is evolving to expand the portfolio of products obtained from forest biomass beyond bleached kraft pulp, potentially including dissolving pulp, chemicals, fuels, and polymers, in alignment with sustainable wood supply and the biorefinery concept for waste-free processing of wood into value-added products [8,9,10,11].
Wood chemistry must be considered when evaluating pulping processes and product quality [12] and is, therefore, essential in ensuring that the breeding objectives are aligned with the long-term business strategy. To realize genetic gains in wood quality traits, understanding the extent of genetic control is fundamental to the choice of the breeding strategy(ies) to be implemented [13,14]. Furthermore, knowing how different wood properties are correlated is important, as this information can then establish selection traits that may be used to explain the majority of the variability of interest for a given product attribute. Finally, the larger the number of characters involved, the smaller the attainable gain from selection for each trait [15,16,17].
There is scarce literature dealing with phenotypic and genetic parameters of wood quality traits of A. crassicarpa. The first reports of its pulping and paper-making qualities were published in the early 1990s [18,19], where three native trees of unknown age showed an average basic density of 638 kg/m3 and screened kraft pulp yield of 47.2%. Following on, Laurila [20] ranked A. crassicarpa along with Acacia mangium Willd. and Gmelina arborea Roxb. as the most suitable species for pulp and paper in a study comparing eight species in a reforestation project in South Kalimantan (Indonesian portion of Borneo Island) for wood density, strength, fiber properties, lignin content, and extractives content. The basic density, compared at the same age, was higher than A. mangium and similar to Acacia auriculiformis A. Cunn. ex Benth. Provenance variation was evaluated by Shukor et al. [21] on four-year-old trees from six provenances that originated from Australia, Papua New Guinea, and Irian Jaya (Papua, the Indonesian portion of New Guinea Island). The authors showed significant differences in shrinkage, compression, and shear parallel to the grain, but none for specific gravity, or the flexural properties MOR (modulus of rupture) and MOE (modulus of elasticity). Yao et al. [22] evaluated four A. crassicarpa trees at varying ages, obtaining an average klason lignin content of 21.5%, surprisingly the highest value among the five Acacia species tested, suggesting a low lignin content for the genus.
For other relevant species of the Acacia genus, a collection of studies dealing with different wood properties supports an ample understanding of the phenotypic variation found in the genus, as shown for A. mangium [23,24,25,26,27], A. auriculiformis [28,29], and their interspecific hybrid [30,31,32,33,34,35,36]. Moreover, there is abundant literature dealing with wood quality traits for other important tree species commercially planted worldwide, contextualizing wood quality traits variation in a wider range of tree species, as shown for eucalypts [37,38,39,40,41,42,43], pines [44,45,46,47,48], and poplars [49,50,51]. Generally, wood quality traits show intermediate to strong genetic control, with greater genetic stability across environments than growth traits, with the tree’s phenotype providing a reliable indicator of its genetic merit, making wood quality traits amenable to genetic advancement through selection [52,53].
To accurately assess the wood properties of a tree, it is important to consider the inherent dimensional changes in wood properties that are unequal along the main bole of the tree, requiring destructive multi-spatial sampling for the accurate determination of whole-tree level phenotype [54,55,56,57,58,59,60,61,62,63,64,65,66]. On the other hand, the phenotyping procedure for important pulping traits is resource demanding. Thus, wood quality traits are expensive and time-consuming to measure, requiring laboratory facilities and technical expertise to process wood and assess the properties correctly. To overcome the challenge of characterizing a tree with a non-destructive, cost-effective, and faster procedure, wood technologists have developed indirect measurement methods [67,68] that inherently introduce a trade-off between accuracy and ease of measurement that depends on the trait and the objective of the characterization. Ultimately, the goal is to capture enough information to adequately quantify the mean and variability in a particular property, accounting for sampling and subsequent analysis costs.
In the context of a tree breeding program, breeders have been able to efficiently characterize families and clones for selection, balancing the loss in phenotyping accuracy, due to indirect measurements and single-position sampling, with replication. Usually, families and clones are ranked for a particular trait with an average value across multiple trees/ramets measured by a given indirect measurement method. Notably, near infrared reflectance spectroscopy (NIRS) models have been developed and successfully used to predict wood properties [69,70,71,72]. Despite the significant investments required for calibration of NIRS models, this technique is well-suited for ranking purposes and allows for the inclusion of wood quality traits in the selection criterion and provides the ability to estimate genetic parameters at the population level [73,74].
In this study we used 240, 50-month-old wood samples, representing six stem positions taken from 40 A. crassicarpa trees, to evaluate wood density, screened kraft pulp yield, α-cellulose, carbohydrate composition, and lignin content and composition (S/G ratio) to (1) assess variation in important wood and pulping properties of A. crassicarpa, (2) estimate phenotypic correlations among different wood quality and pulping traits, and (3) understand within-tree longitudinal patterns of variation and its importance for whole-tree level phenotyping. With this comprehensive set of wood and pulping property estimates, we aim to increase the amount of information available for this important tree species and better address efficient sampling procedures for different phenotyping objectives.
2. Materials and Methods
2.1. Field Trials
A. crassicarpa progeny trials established by the breeding program of Asia Pacific Resources International Limited—APRIL (www.aprilasia.com) were employed in this study. Two replicates of the same group of families in a common breeding zone were established in November of 2012 in hemic peat soil with an average bulk density of 0.22 g/cm3 at Pelalawan Regency, Riau Province, Indonesia. Each test consisted of 25 treatments in an eight replication randomized complete block design with ten trees per plot (two rows of five trees). The specimens consisted of open-pollinated families derived from a clonal breeding orchard with second-generation selections from Papua New Guinea provenance.
2.2. Wood Properties Measurements
2.2.1. Wood Sampling and Basic Density Determination
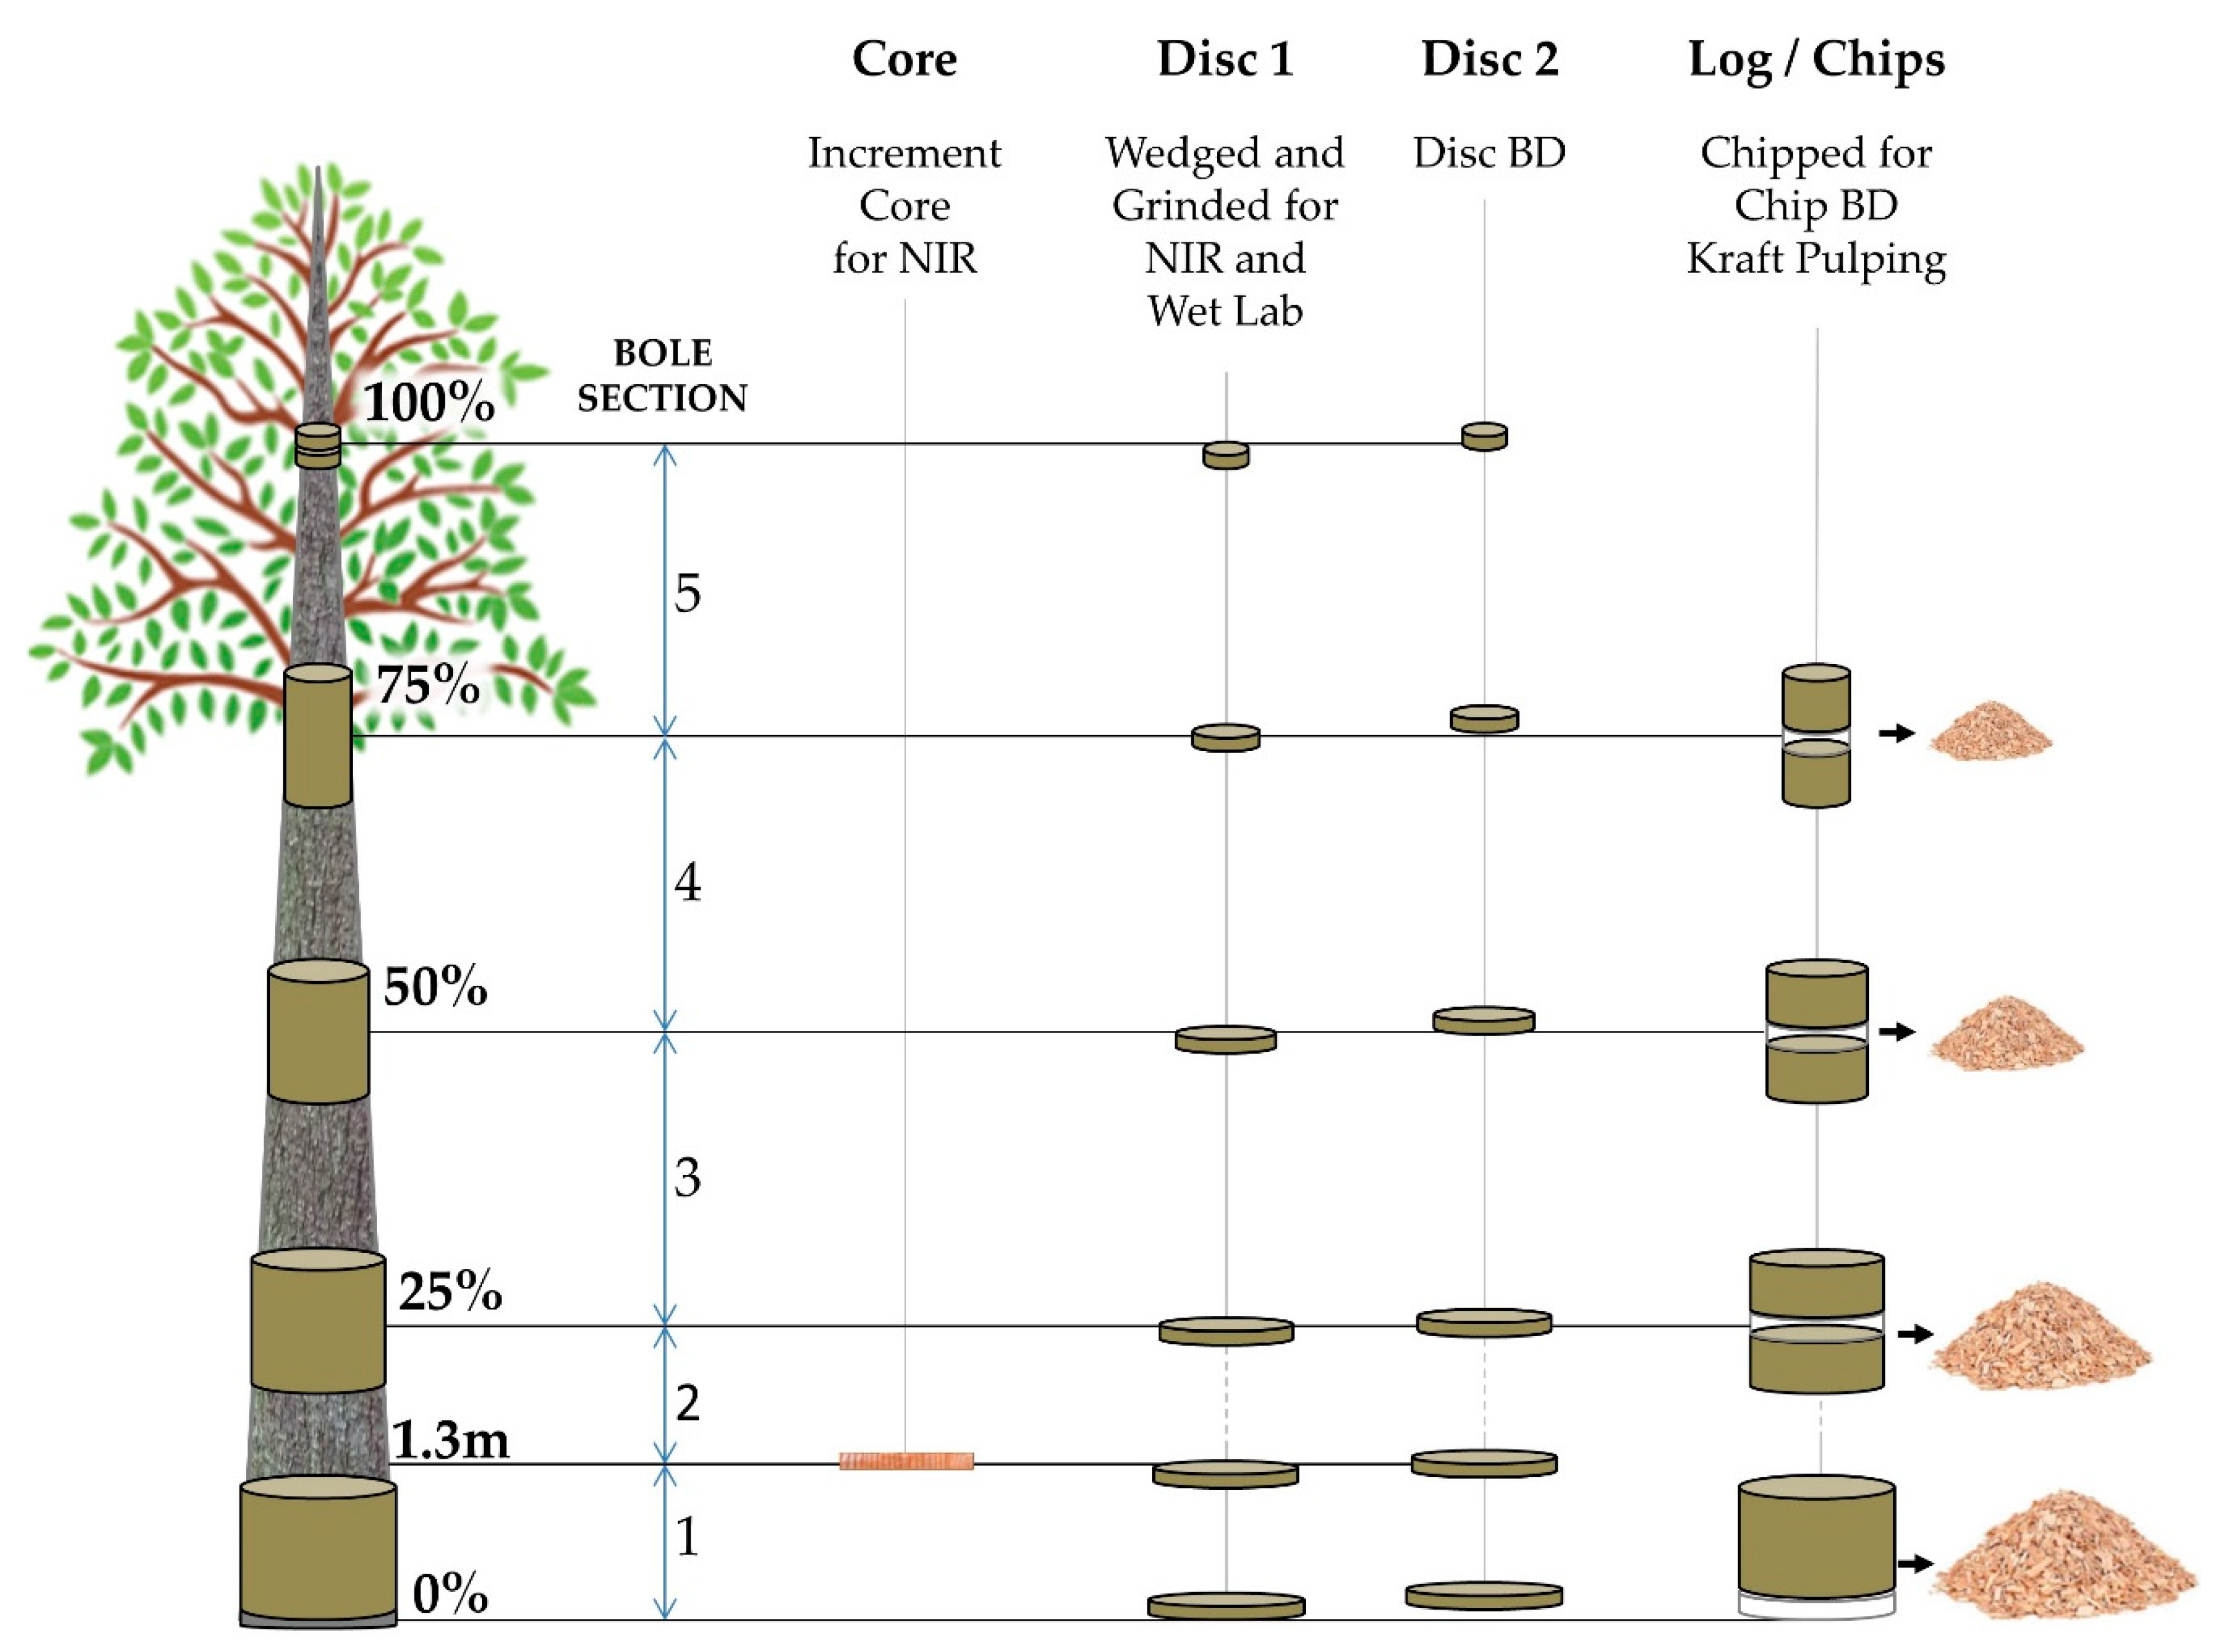
Utilizing the company’s NIRS model routinely used in the breeding program, all families were ranked at age three years for basic density, and four families covering the observed range in the trials were selected. Trees were field inspected for tree stem defects, diseases, and straightness, and ten trees of each one of the four families were then chosen for destructive wood sampling. The trees were felled, and commercial heights (HTcom) were determined from base to the point representing 4.5 cm diameter at the top. The bole positions corresponding to breast height (1.3 m), and 0%, 25%, 50%, 75%, and 100% of the commercial height were then marked; the over-bark diameter was recorded; and cores, discs, and logs were extracted (Figure 1) and transported to APRIL’s Wood Tech Laboratory.
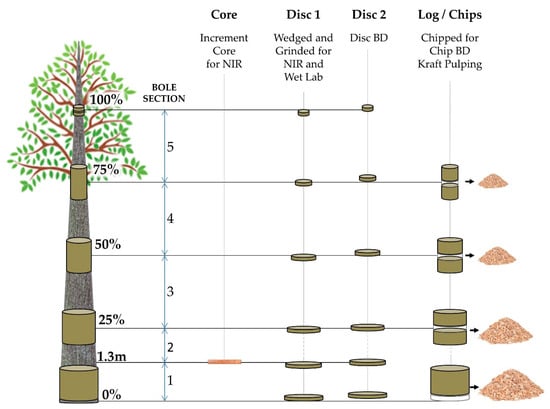
Figure 1.
Destructive sampling for direct measurements of wood properties and correspondent laboratory analyses performed at each position along the tree bole. The figure is a schematic and not to scale and is intended for illustration only.
At all positions, two discs (2.5 cm of thickness) were collected. From the first disc, wedges were ground to produce woodmeal following TAPPI T 257 [75] as source material for NIRS spectral collection and associated wet chemical analysis. The second disc was used to determine the disc basic density (DBD), measured in kg/m3, following TAPPI T 258 [76]. At positions representing 0%, 25%, 50%, and 75%, logs of 1.2 m length were produced, and from their central region, the two discs were extracted. The remaining billets from each log were chipped (FARMI CH 260 OEM) and screened following SCAN CM:40-01 standard [77] using a wood chip classifier (TMI 71-01 Chip Class) to provide chips for basic density (CBD) and screened kraft pulp yield (KPY) measurements. The CBD was measured following TAPPI 258 procedure [76]. In addition, samples representing whole-tree composition were prepared by combining volumes of chips from each position proportionally to its area, and composite chips basic density (CBDc) and composite screened kraft pulp yield (KPYc) were determined.
2.2.2. Wood Carbohydrates and Lignin
Five grams of wood meal was supplied to the University of British Columbia for wood chemical analysis, according to Hart et al. [78]. The sample representing the 100% position was not included in the sample set for wood chemical determination. The wood samples were then ground using a Wiley mill to pass through a 40 mesh screen and Soxhlet-extracted with hot acetone for 24 h, and then oven-dried at 105 °C for 24 h. Three milliliters of 72% (w/w) H2SO4 was pipetted into a test tube containing approximately 200 mg of dried material and was mixed for 30 s every 10 min. After two hours, the contents of the test tube were transferred to a serum bottle using 112 mL nanopure water. The serum bottles were then sealed and autoclaved at 121 °C for 60 min. After autoclaving, the contents of the bottles were allowed to cool, then vacuum filtered through a pre-weighed medium coarseness crucible (Pyrex, Corning, NY, USA), and 15 mL filtrate was collected for further analysis. The retentate was rinsed with 150 mL of deionized water to remove any residual sugars and acid. The crucibles containing the retentate were oven-dried at 105 °C for 24 h and then re-weighed to obtain the insoluble lignin content (INS) of the wood gravimetrically. A sample of the filtrate was analyzed for acid-soluble lignin (SOL) at 205 nm. The total lignin (LIG) (soluble and insoluble) is expressed as a proportion of the initial extractive free wood.
Approximately 0.9 mg of the solubilized filtrate and 0.1 mg of fucose (5 mg/mL) internal standard were mixed and filtered through a 0.45 µm nylon filter into a glass vial. The total carbohydrate content (arabinose, rhamnose, galactose, glucose, mannose, and xylose) was determined using an anion exchange high-performance liquid chromatograph (Dx-600; Dionex, Sunnyvale, CA, USA) equipped with an ion exchange PA1 column (Thermo-Fisher Scientific, Waltham, MA, USA), a pulsed amperometric detector with a gold electrode, and the AS50 autosampler (Dionex, Sunnyvale, CA, USA). The concentrations of arabinose (ARA), galactose (GAL), glucose (GLU), mannose (MAN), rhamnose (RHA), and xylose (XYL) were calculated in proportion to the initial extractive free wood and combined as total carbohydrate concentration.
2.2.3. Syringyl–Guaiacyl Ratio (S/G)
A 10 mg sample of oven-dried extract-free wood was used to determine the lignin monomer composition. One milliliter of a reaction mixture (8.75 mL dioxane, 250 µL BF3, and 1 mL ethanol) was added to a 6 mL reaction vial containing the dried material and purged with N2 gas before the lid was tightly sealed. Vials were placed in a heating block at 100 °C for 4 h with periodic (hourly) agitation. The vials were transferred to a −20 °C fridge for 5 min to halt the reaction. Then, 200 µL of internal standard (5 mg tetracosane/1 mL methylene chloride) and 300 µL 0.4 M NaHCO3 were added to the vial to bring the pH between 3 and 4. Next, 2 mL of nanopure water and 1 mL methylene chloride were added to the vial, which was then recapped, vortexed, and allowed to separate into two phases. One milliliter of the lower phase was drawn by pipette, filtered through anhydrous Na2SO4, and finally transferred directly into a 2 mL polypropylene safe-lock microfuge tube. The sample was evaporated to dryness in a Speedvac set to 45 °C and then resuspended in 700 µL of methylene chloride. Twenty microliters of resuspended sample was derivatized by combining it with 20 µL of pyridine and 100 µL of N,O-bis(trimethylsilyl) acetamide in a glass insert within an amber-glass vial. The vial was sealed and inverted to mix, and allowed to incubate for at least 2 h at 25 °C prior to analysis. Finally, 1 µL of solution was analyzed by gas chromatography with the Trace 1310 instrument (Thermo-Fisher Scientific, Waltham, MA, USA), equipped with an autosampler, splitless injector, FID (flame ionizing detector) and a TG-5MS capillary column (30 m × 0.32 mm × 0.25 µm), as per Robinson and Mansfield [79].
2.2.4. Alpha Cellulose
Alpha cellulose (αCEL) was determined according to Porth et al. [80], with minor modifications. In brief, the acetone-extracted wood was allowed to dry overnight at 50 °C, and 3.5 mL of solution A (60 mL glacial acetic acid + 1.3 g NaOH L−1) and 1.5 mL of 20% sodium chlorite solution (20 g NaClO2 in 80 mL distilled water) were added to exactly recorded amounts (~150 mg) of extract-free wood meal to initiate the chlorite delignification. The reaction tube was tightly sealed and then gently shaken at 60 °C for 14 h. The reaction was quenched by placing the tubes in an ice bath, and the reaction solution was then thoroughly removed by pipetting while not disturbing the settled reacted wood meal. This procedure was repeated using fresh aliquots of each reactant. Finally, the reacted wood meal was transferred to a pre-weighed coarse sintered crucible, and washed twice with 50 mL of 1% glacial acetic acid (under vacuum), followed by two washes with 10 mL acetone under vacuum, then dried at 50 °C overnight to obtained holocellulose yield. To obtain the alpha cellulose content of the woody material, alkaline extractions using two different sodium hydroxide extractions were performed sequentially to remove the hemicelluloses. Exact weights of ~100 mg of holocellulose were transferred to a small beaker and left at room temperature for 30 min to allow moisture equilibration. To this, 8 mL of 17.5% NaOH (from sodium hydroxide 50% w/w) was added, and the material was left to react for 30 min at 40 °C. Then, 8 mL of distilled water was added, and the material was stirred for 1 min and left to react for 29 min. The reaction solution was carefully removed, and the process was repeated with fresh reactants. After the second reaction, all retentate was filtered through a pre-weighed coarse sintered crucible by washing with distilled water (3 × 50 mL). Subsequently, the reaction was neutralized by soaking in 1.0 M acetic acid for 5 min. After additional washing with distilled water (3 × 50 mL), the material was dried at 50 °C overnight to obtain the alpha cellulose content gravimetrically.
2.2.5. Kraft Pulping
The screened wood chip samples of positions 0%, 25%, 50%, 75%, plus the whole-tree composite sample were measured for moisture content following TAPPI T 550 [81], and screened kraft pulp yield (KPY) was calculated using gravimetry. The cooking equipment used was a CRS autoclave with six 3 L rotating vessels, with every vessel carrying 350 bone-dry grams of chips and the liquor-to-wood ratio at 1:4. The batch digestors were controlled electronically by electric heating, and the cooks were carried out at 165 °C with a constant variable alkali charge of 15.5% to 19.5% EA as NaOH and fix sulfidity of 35%. Both parameters were chosen based on the kappa target 18 ± 1. The kappa number was determined by TAPPI T 236 [82]. Every result presented is an average of at least five cooks per sample at the same kappa number interval.
2.2.6. NIRS Modeling
A NIRS model was trained for basic density with 240 disc basic density (DBD) direct measurements, and their corresponding NIRS spectra generated by 32 scans averaged to produce a single reflectance spectrum for each sample. The equipment used was a “FOSS NIR XDS Rapid Content Analyser” measuring reflectance in solid samples at 660 NIRS wavelengths covering the range of 1100 to 2500 nm.
A data analysis pipeline, written in R, was used for model development in two separate phases: (1) transformations and outlier detection and (2) model training, cross-validation, and model selection [69,83]. The first phase of the program applies mathematical transformations to NIRS spectra to remove the scattering of diffuse reflections associated with sample particle size and to improve subsequent regression analyses. Scatter-correction methods and spectral derivatives were applied to the spectral data. Scatter-correction methods included multiplicative scatter correction (MSC), standard normal variate (SNV), and detrend (DT); spectral derivative methods included second-order polynomial, the second derivative of Savitzky–Golay smoothing with two different window sizes of 5 and 7 points (SG5 and SG7), and combination of transformation by pairs (SNV + SG, MSC + SG and DT + SG). For all observations on each spectral database, local outlier factors (LOFs) were calculated and used to identify outliers based on density and distance [84]. Individuals with LOF values greater than two were excluded from the analysis.
The second phase uses the outlier-free and transformed databases to develop NIRS prediction models between spectral data and DBD direct measurements. Partial least-squares regression (PLS) was implemented in R using the R-package “pls” [85], and model performance was evaluated using leave-one-out (LOO) cross-validation. Desirable models are those that maximize the cross-validation coefficient of determination (R2cv), minimize the standard error of cross-validation (RMSEPcv), and have a small number of latent variables (projection factors). Based on the criteria mentioned above, the best model was selected to predict the DBD at each position sampled.
2.3. Within-Tree Level Analyses
At the bole positions level, exploratory analysis was performed with the following descriptive statistics: the number of observations (N), mean, standard deviation (SD), coefficient of variation (CV), and box plots. Within-tree longitudinal variation patterns were estimated with simple linear regression models, fitted with the positions as regressors of the wood property along the bole. The predictor is the position, numerically expressed as the percentage of commercial height, and the response is the trait considered. Thus, the slope shows how the trait is varying for every 1% of the commercial height, from base to top. To transform it into an objective statistic, we multiplied the slope coefficient by 100 (Slope100) to express the total variation in the regression line, corresponding to the difference of fitted values at 0% and 100% of the commercial height. For all traits, the “Slope100” descriptive statistics were calculated with their statistical significance obtained via t-tests for the mean, minimum, and maximum. Shapiro–Wilk normality tests were also performed to determine if the slopes are normally distributed.
2.4. Whole-Tree Level Analyses
For each bole section, determined by the log in between the positions measured, we calculated the frustum volume and its mean wood property averaging the lower and upper measures weighted by their areas. The whole-tree phenotypes were then estimated as the average value of all bole sections weighted by their volumes. Pearson’s correlation () of all pairwise combinations of variables at the whole-tree level and t-tests with n−2 degrees of freedom for their significance were calculated.
The precision of reduced sets of sampling positions to predict the whole-tree phenotype—referred to as reliability in the remainder of this manuscript—was investigated by comparing simple linear regression models with positions taken singly, in pairwise and three-way combinations. For pairwise and three-way combinations, the predictor was the mean value of the corresponding positions. The reliability was assessed using both the model R2 and the non-parametric Spearman’s rank correlation coefficient (). The effect of indirect measurements was explored considering the NIRS DBD predictions at each position. Similarly, as described above for the direct measurements of DBD, the reliability and between combinations of positions were calculated and compared with the whole-tree value.
All statistical analyses were done using the R software environment version 3.6.2 [86].
3. Results
3.1. Within-Tree Level Wood Properties
The average commercial height was 17.88 m, and the volumetric proportions of each bole section are presented in Table 1. The descriptive statistics at the position level are shown in Table A1 of Appendix A. The box plots express the longitudinal variation at the population level. For each trait, the variation was fairly constant across positions, with similar coefficients of variation.

Table 1.
Average tree bole sections volumes and their proportion of the total volume.
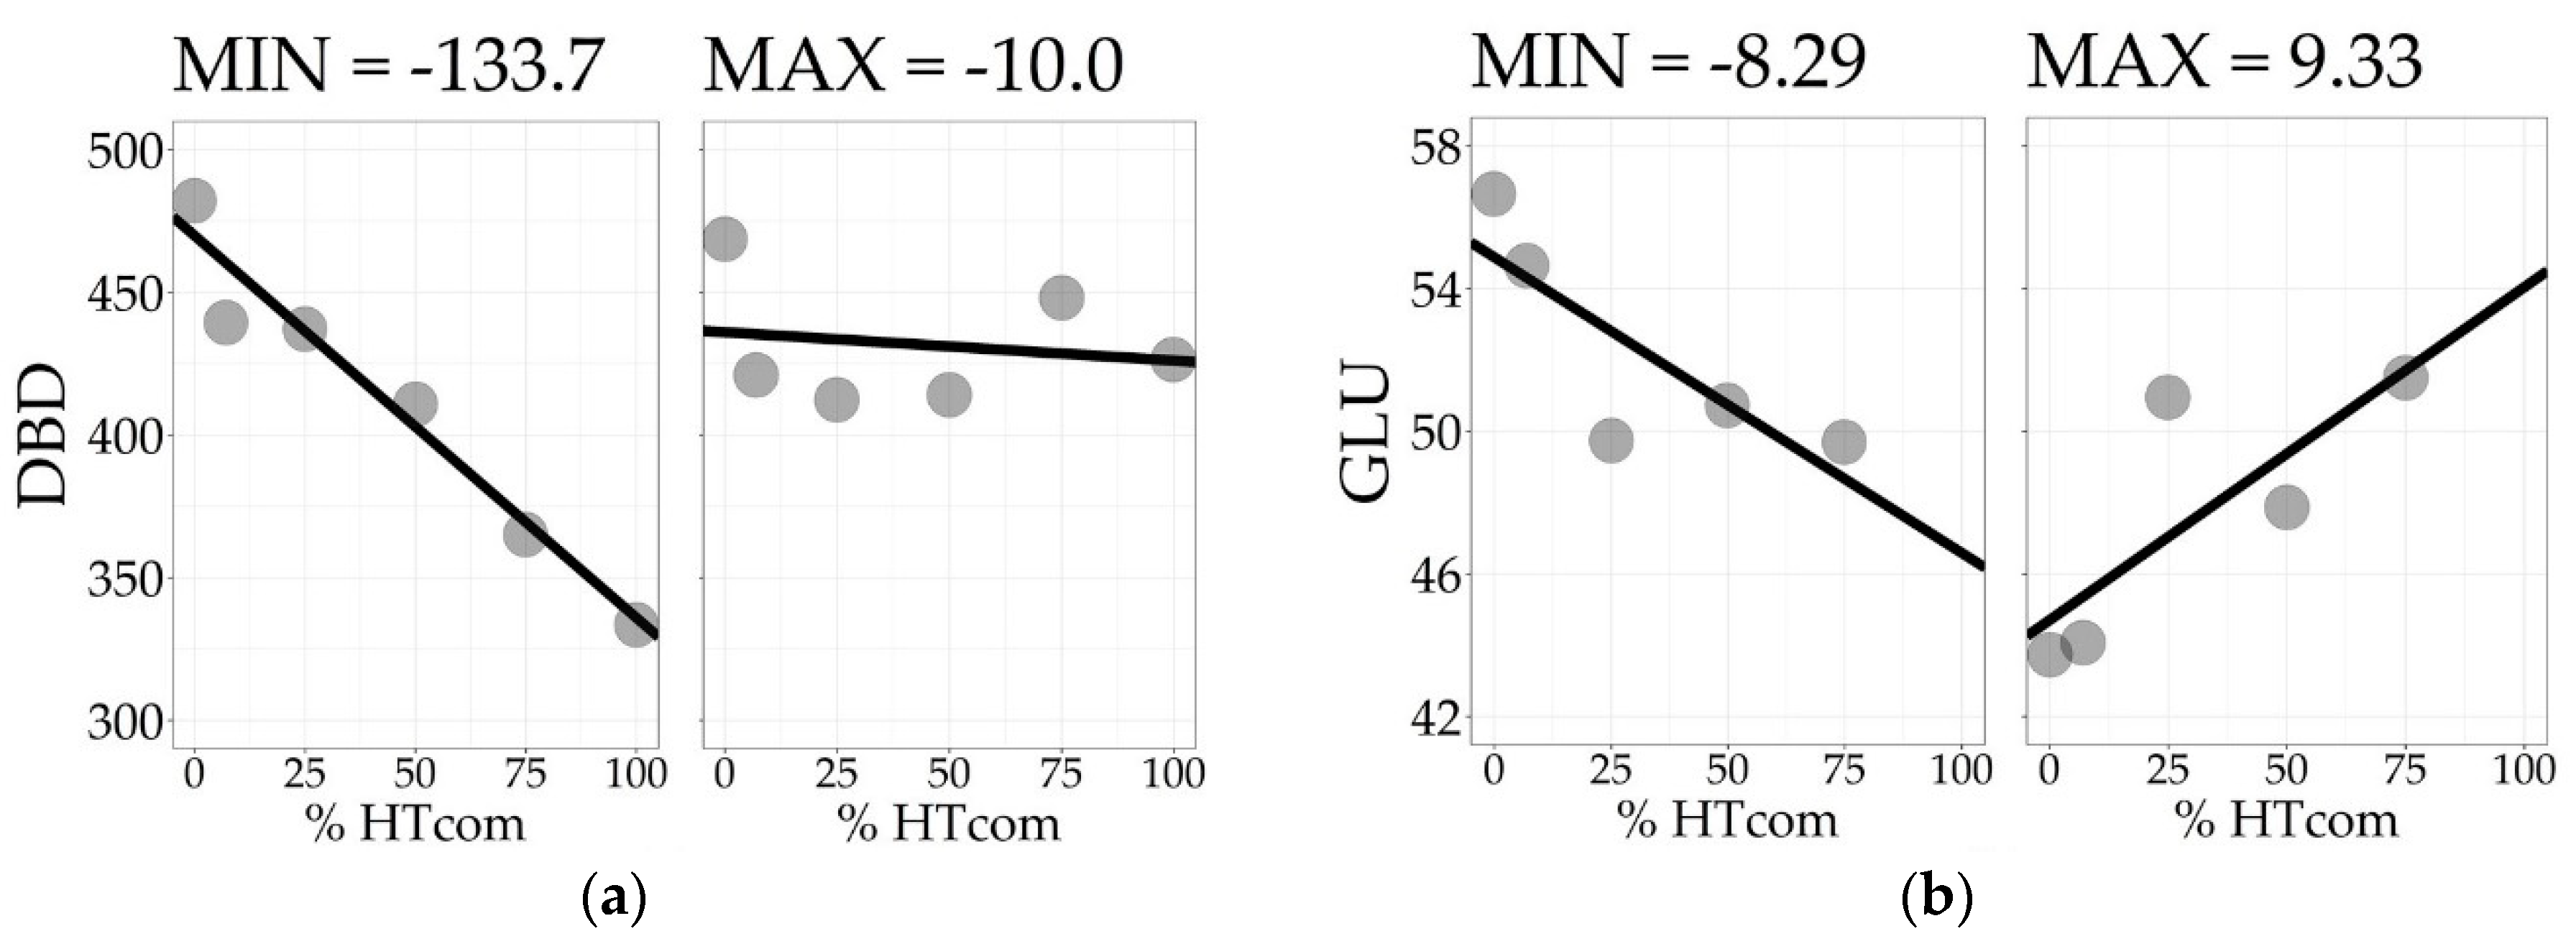
To assess within-tree longitudinal patterns of variation, the positions must be considered as a group of measurements taken on the same specimen. The slope of a simple linear regression model, fitted with the positions as regressors of the wood property along the bole, reflects the tree’s linear longitudinal pattern of variation. The Slope100 descriptive statistics for all traits are presented in Table 2. For DBD, the average tree showed a decreasing density with −68.2 kg/m3 difference from bottom to top. All trees showed a decreasing trend for DBD, although at varying rates. The trees with the minimum and maximum Slope100 values of DBD are presented in Figure 2a. Similar patterns were found for CBD, LIG, and INS. The screened kraft pulp yield (KPY) had Slope100 with the opposite pattern, with a mean of 3.25%, varying from −0.22% to 8.06%, showing that all trees have an increasing trend with varying positive Slope100 values. The traits GLU, XYL, MAN, and SOL have positive means, but with Slope100 ranging from negative to positive values, indicating signal reversions when comparing different trees. The trees with the minimum and maximum slope100 values of GLU are presented in Figure 2b. For αCEL, ARA, GAL, RHA, and S/G, the signal reversion was also present, but with the average tree showing no longitudinal variation with Slope100 mean equals zero. For all traits, the Slope100 was normally distributed with Shapiro–Wilk’s normality test p-values > 0.05.

Table 2.
Slope100 descriptive statistics for diameter (DIA), disc basic density (DBD), chips basic density (CBD), screened kraft pulp yield (KPY), alpha cellulose (αCEL), glucose (GLU), arabinose (ARA), galactose (GAL), rhamnose (RHA), xylose (XYL), mannose (MAN), total lignin (LIG), insoluble lignin (INS), acid-soluble lignin (SOL), and syringyl–guaiacyl ratio (S/G).
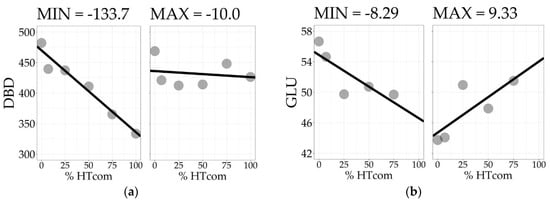
Figure 2.
Longitudinal pattern of variation of the trees with the minimum and maximum Slope100 for disc basic density (a) and glucose content (b).
3.2. Whole-Tree Level Wood Properties
The whole-tree level statistics for all traits are presented in Table 3. For the growth traits, the mean total height was 21.3 m, and the mean diameter at breast height was 18.2 cm. The mean total tree volume was 0.257 m3. The basic density mean values were 481.7 kg/m3 for disc basic density, 467.3 kg/m3 for chips basic density, and 474.8 kg/m3 for composite chips basic density. As expected, the range for basic density was wide, on the order of 157.5 kg/m3. The mean screened kraft pulp yield was 53.8%, and the same value was observed for the composite KPY, both with a 7% range. The mean alpha cellulose content was 44.4%, with an 8.4% range. The two major carbohydrates were glucose, with mean 50.4% and 5.6% range, and xylose, with mean 13.8% and 2.4% range. The contents of the minor carbohydrates mannose, galactose, arabinose, and rhamnose were 1.31%, 0.62%, 0.26%, and 0.23%, respectively. Mean total lignin was 29.35%, with a range of 4.4%, whereas insoluble lignin was 27%, and acid-soluble lignin was 2.35%. The mean lignin monomers syringil–guaiacyl ratio was 1.67, with a range of 0.3.

Table 3.
Descriptive statistics of total height (HT), diameter at breast height (DBH), tree volume (VOL), and whole-tree level disc basic density (DBD), chips basic density (CBD), composite chips basic density (CBDc), screened kraft pulp yield (KPY), composite screened kraft pulp yield (KPYc), alpha cellulose (αCEL), glucose (GLU), arabinose (ARA), galactose (GAL), rhamnose (RHA), xylose (XYL), mannose (MAN), total lignin (LIG), insoluble lignin (INS), acid-soluble lignin (SOL), and syringyl–guaiacyl ratio (S/G).
The Pearson’s correlation matrix is presented in Table A2 of Appendix A, with elements below diagonal corresponding to the correlations at the whole-tree level. For wood density, very high positive relationships (>0.9) were apparent between disc basic density, chips basic density, and the composite CBD, indicating that regardless of the measurement method, similar estimates were obtained at the whole-tree level. Similarly, the KPY and the KPYc have a 0.93 correlation, showing strong evidence that the chips composite may be a resource-wise sampling strategy, especially for expensive phenotyping traits, such as pulp yield. Wood basic density was positively correlated with pulp yield, alpha cellulose, arabinose, galactose, and rhamnose, and it was negatively correlated with mannose and soluble lignin. Alpha cellulose content was strongly associated with glucose (0.70), and both traits negatively correlated with lignin content (−0.48 and −0.60, respectively). Regarding correlations among carbohydrates, arabinose, galactose, and rhamnose were positively correlated among themselves. Galactose was related to density, to all other sugars, and lignin. Xylose was not associated with any other trait than galactose.
The correlation between total lignin and insoluble lignin was 97%, demonstrating that the insoluble lignin is the major component driving the complete lignin response. Total lignin was negatively associated with glucose, alpha cellulose, and pulp yield, showing consistency among the data, with the antagonistic relationship expected between lignin and pulp yield-related traits. The lignin monomer ratio (syringil–guaiacyl) was significantly correlated only with the carbohydrate mannose.
3.2.1. Whole-Tree Properties Prediction
The results of the bole positions reductionist analyses for whole-tree property prediction are presented in Table 4 for the selected traits KPY, DBD, GLU, XYL, and INS.

Table 4.
Reliabilities of simple linear regression models with different sets of positions to predict whole-tree level properties for screened kraft pulp yield (KPY), disc basic density (DBD), glucose (GLU), xylose (XYL), and insoluble lignin (INS).
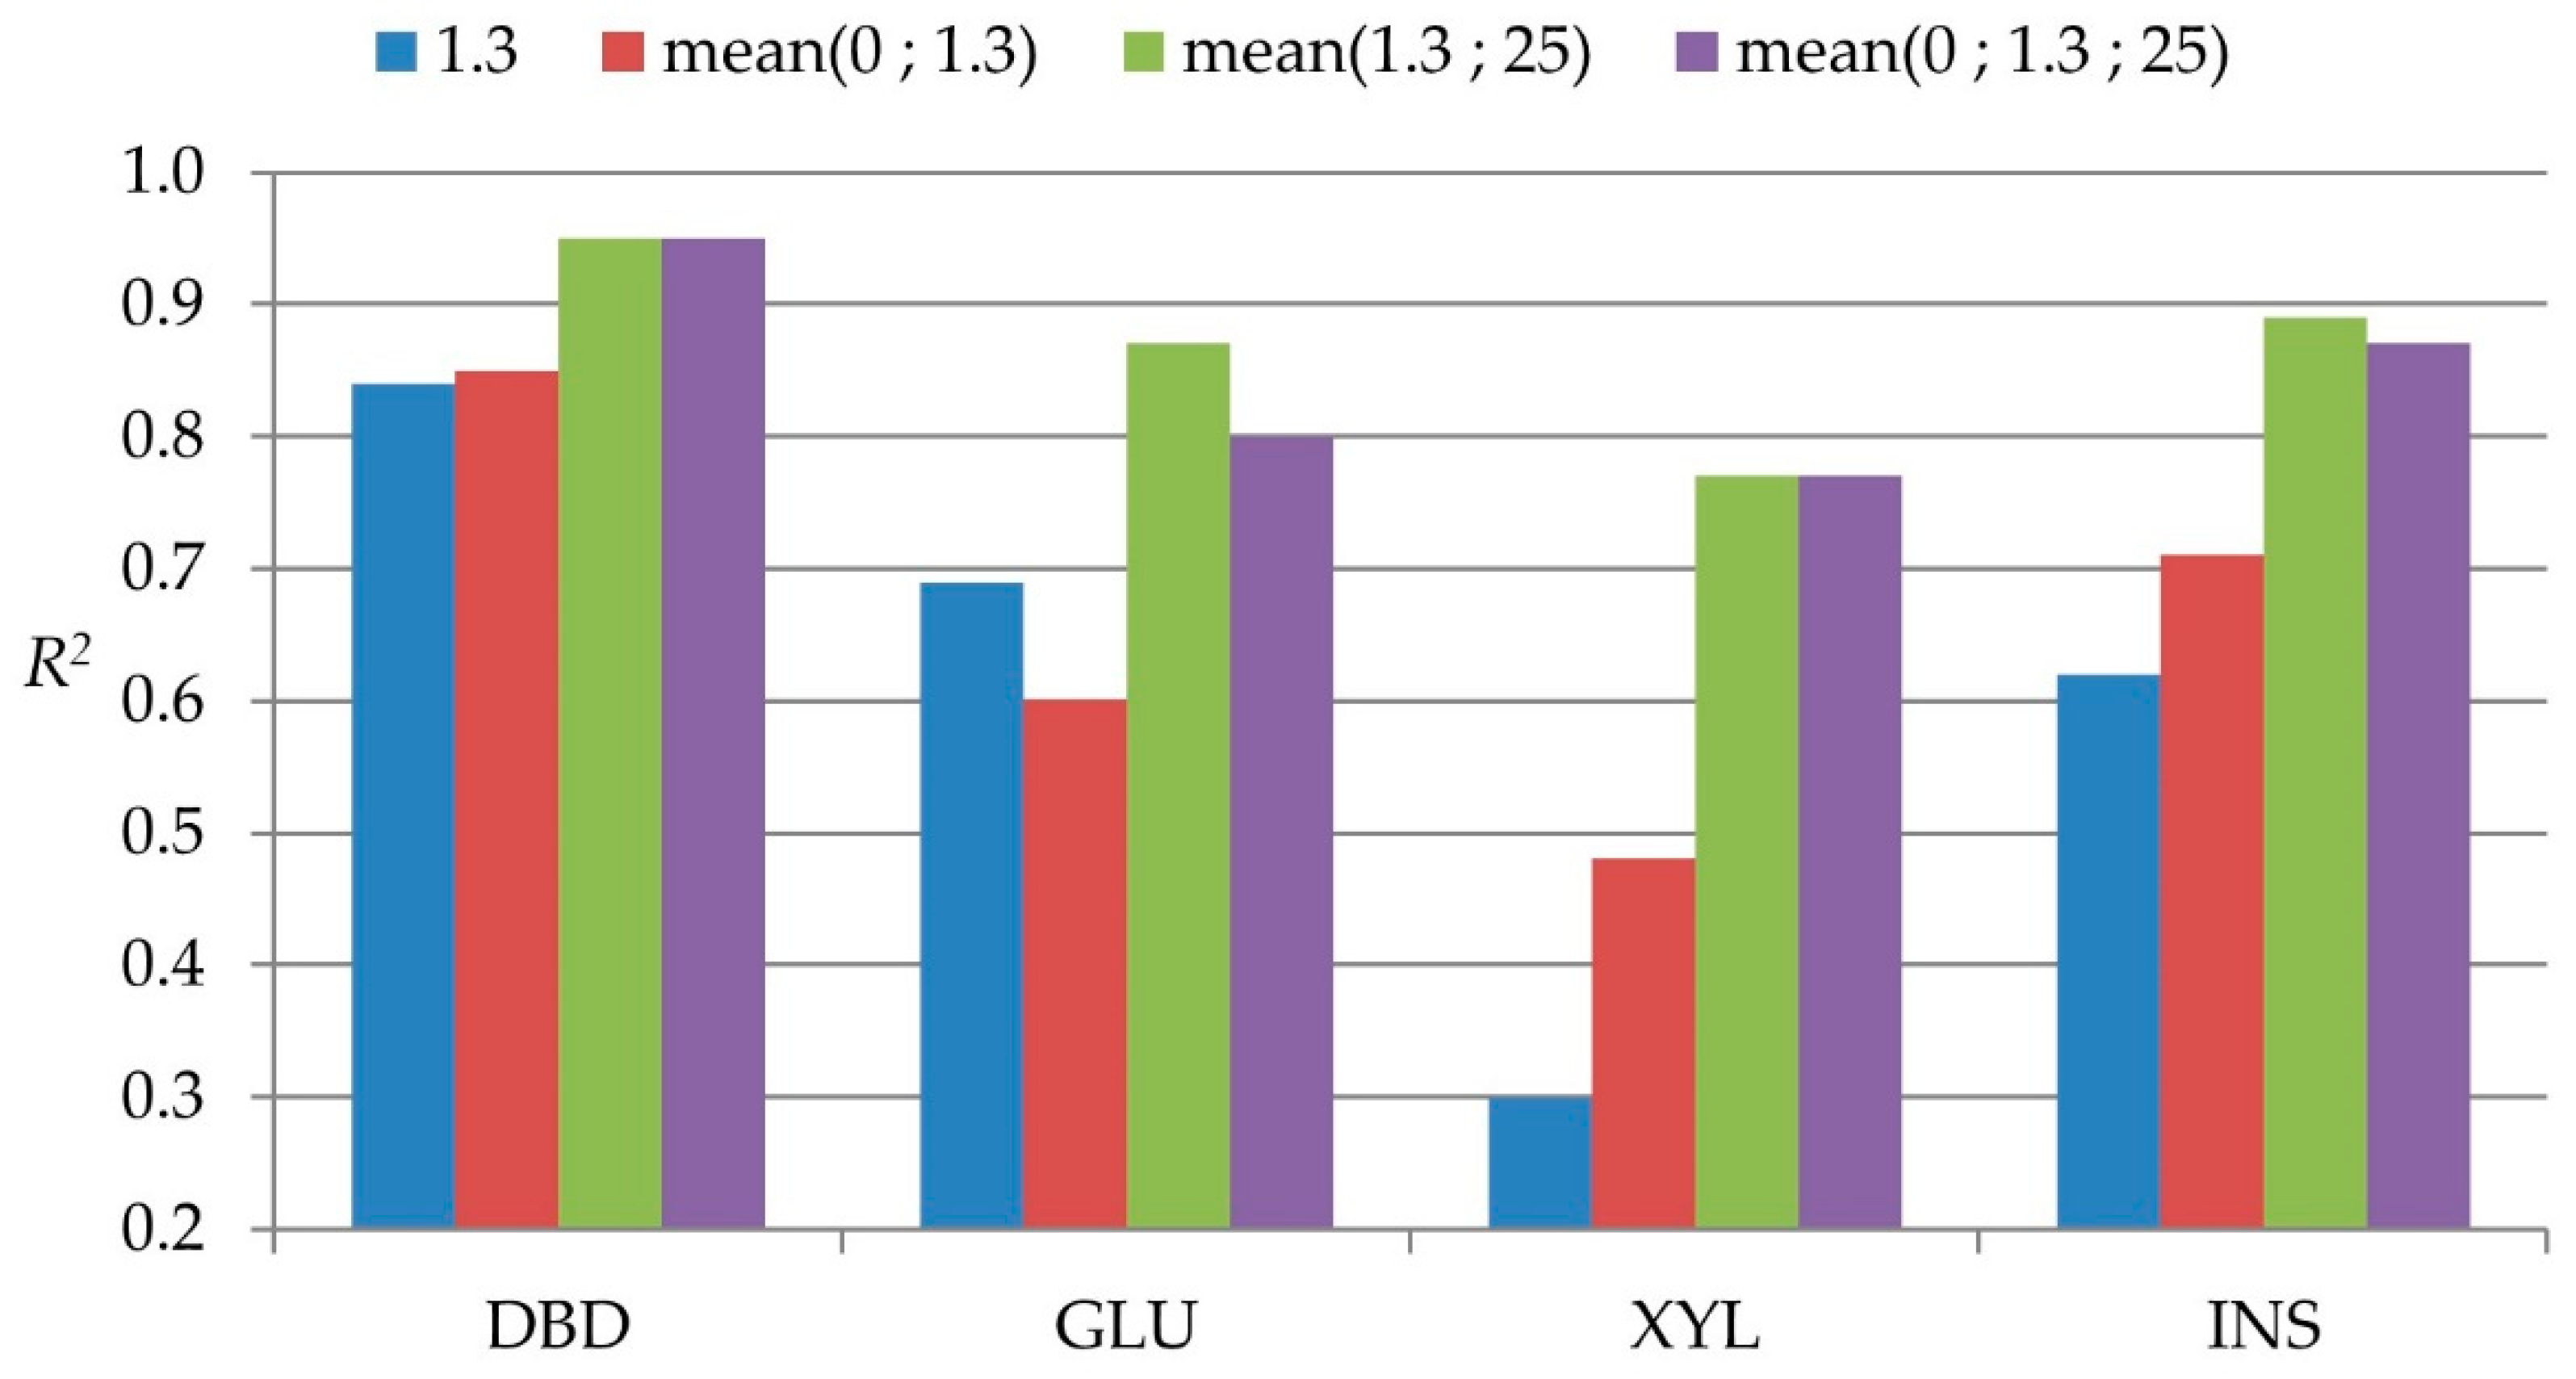
In general, when comparing single positions, samples at breast height and 25% were the most reliable to predict the whole-tree value. However, pairwise and three-way combinations of positions increased the correlations. For KPY, the position 25% alone showed reliability of 0.94, and rank correlations of 0.97 to predict whole-tree values, with marginal gains when adding more positions. For DBD, the 1.3 m and 25% alone showed ≈ 0.84, and when their mean value was used, it increased to 0.95. For the carbohydrates and insoluble lignin content, single sampling positions had less power to predict whole-tree properties. For glucose, 1.3 m was the best single position with = 0.69. When the mean value of 1.3 m and 25% was used, it increased to 0.87, with = 0.93. Adding the 50% as a 3rd position practically yielded a perfect correlation with the whole-tree value. For xylose, an important component of hemicellulose, a single sampling at 25% commercial height could moderately predict whole-tree with = 0.67. The mean value of 1.3 m and 25% was 0.77. Insoluble lignin showed a similar trend, and the 25% position alone had = 0.76 and = 0.84. For higher precision, the mean value of 1.3 m and 25% could raise the to 0.89.
From a practical point of view, the positions that could eventually be sampled in standing trees are 0%, 1.3 m, and 25%, even though the sampling at 25% position may require some additional effort. The reliability comparisons of different possible practical sampling strategies with standing trees are presented in Figure 3. For DBD, the reliability of sampling at breast height position alone was above 0.8 and marginally improved with more positions sampled. For the other traits, the addition of the 25% significantly improved the correlations, indicating its importance to have higher precision in predicting whole-tree properties. With any further positions being considered, no substantial improvement was observed.
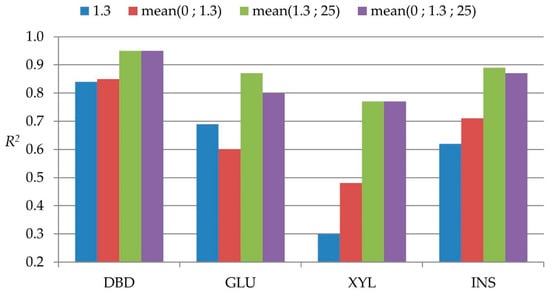
Figure 3.
Bar plot with reliabilities of different possible practical standing tree sampling strategies.
3.2.2. Whole-Tree Properties Prediction with NIRS Models
To examine the effect of indirect NIRS measurements on whole-tree property prediction, a NIRS prediction model was calibrated for disc basic density. The best model proved to be one where a Savitzky–Golay mathematical smoothing function was applied with a window size of seven points (SG7) and 12 factors, resulting in a calibration R2c = 0.82, and the highest leave-one-out (LOO) cross-validation R2cv = 0.75. The root mean standard error of prediction was RMSEPcv = 22.3. This model was thereafter used for the DBD predictions with results presented in Table 5.

Table 5.
Reliabilities of simple linear regression models with different sets of positions obtained by the NIRS model (DBDnir) to predict whole-tree level disc basic density.
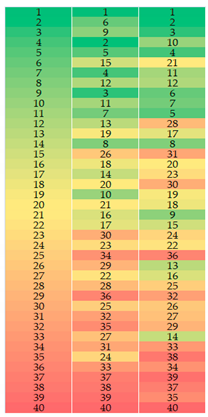
The reliabilities with the NIRS predictions were lower than direct measurements, and the maximum efficacy obtained with all positions was = 0.94. At the breast height position (1.3 m), the effect of the indirect measurement on the whole-tree prediction was a 0.12 reduction in the reliability and a 0.11 reduction in the Spearman’s rank correlation. With the mean value of pairs of positions, the best combination was 1.3 m and 50%, generating an = 0.89 and = 0.92, followed by 1.3 m and 25%, which resulted in = 0.83 and = 0.88. Reliability and ranking correlation above 0.90 were only obtained with the mean value of the three-way combination of positions 1.3 m, 25%, and 50%. The rankings obtained at whole-tree level (DBDWT), breast height with direct measurements (DBD1.3), and breast height with NIRS predictions (NIR1.3) are presented in Table 5.
4. Discussion
Despite the extensive use of A. crassicarpa in tropical forestry, information about the magnitude and variation of its wood properties and pulping traits is limited. In this study, a comprehensive set of wood and pulping properties estimates provided for a thorough investigation of a collection of wood properties. We destructively sampled 40 trees at multiple positions to assess the longitudinal patterns of variation in traits and to determine whole-tree property estimates. At the population level, basic density and lignin content showed a decreasing pattern along the bole from bottom to top, in contrast with carbohydrates, pulp yield, and S/G ratio, which showed a more stable longitudinal pattern. However, at the individual tree level, we verified a range of longitudinal patterns following a normal distribution for all traits, estimated by the Slope100 statistic. For basic density and insoluble lignin, the Slope100 varied only with negative values, indicating that, at the population mean and for all individual trees, there is a decreasing trend from the base to the top of the bole for these traits. This result is consistent with the longitudinal variation pattern for basic density reported for A. mangium [24] and contrary to Eucalyptus nitens [66], which showed an increasing longitudinal pattern for basic density. For kraft screened pulp yield, all individual tree Slope100 values were larger than zero, indicating a consistent increasing longitudinal pattern. For the carbohydrates and S/G ratio, Slope100 varied from negative to positive values, even though the population mean longitudinal variation suggests a stable pattern with similar values across positions.
At the whole-tree level, A. crassicarpa can be described as a tree species with medium-high wood density (DBD = 481 kg/m3), high pulp yield (KPY = 0.538), and medium lignin content (LIG = 0.294). The basic density and lignin values found in this study are consistent with the results reported for the species by Laurila [20] and Shukor et al. [21]. When comparing with other important Acacia species, A. crassicarpa (AC) showed higher basic density than A. mangium (AM), similar basic density to A. mangium x A. auriculiformis hybrid (AMxAA), and lower basic density than A. auriculiformis (AA) [27,32,33,35]; the pulp yield was higher than AM [23]; the alpha cellulose was similar to AM and AMxAA, and significantly higher than AA [35]; lignin values were lower than AM, AA, and AMxAA reported by Yahya et al. [35], but similar to AMxAA reported by Rafaedah et al. [32]. Comparing AC with eucalypts, comparable values in lignin and cellulose contents were found for urograndis hybrids at similar age [38,40], and kraft pulp yield in the same ranges was reported for E. globulus [14,38,39,40] at ages ranging from 10–16 years and higher wood density. Regarding the S/G ratio, the low mean with a narrow range (1.5–1.8) found for AC in our study is somewhat different from typical S/G ranges reported for eucalyptus species and hybrids [40,41,42].
The phenotypic correlations among wood quality traits found in this study are, in general, similar to results reported for other woody species [38,39,42,47]. Kraft pulp yield was correlated with alpha cellulose, glucose, and galactose, and negatively correlated with insoluble lignin. The S/G ratio was only significantly correlated with mannose, a minor carbohydrate, indicating that for the A. crassicarpa germplasm studied, the S/G ratio did not greatly influence the pulp yield or its related traits. Basic density was positively correlated with pulp yield, alpha cellulose, arabinose, galactose, rhamnose, and mannose, showing its interdependency with cellulose contents in the xylem cell wall. This significant, positive basic density correlation with pulp yield is not typically seen in eucalypts, with no correlation or lower values reported [38,39,42].
The reliability to predict the whole-tree property varied for different traits. For kraft pulp yield, the single-position sampling at 25% was very reliable and should be preferred for direct measurement sampling. At the basal positions, less reliable estimates were found, but still with high ranking correlations with the whole-tree value. For basic density, sampling at breast height and 25% were the best single positions and could explain 84% and 85% of the whole-tree variation, respectively, with a 0.91 rank correlation. For glucose and insoluble lignin, the two chemical traits with the largest impact on pulp yield, the reliability of single positions was lower than for wood density. For xylose, the second most abundant hemicellulose component, the single positions reliabilities were even lower. These results resemble reports for E. globulus and E. nitens, with reliabilities of breast height sampling for basic density of 0.82 and 0.89, respectively, higher than 0.60 found for cellulose content [64,66]. In hybrid poplars, Schimleck et al. [49] found reliability of 0.65 for increment core cellulose content at breast height. For all traits, with two data points collected along the bole, the reliabilities were improved. The line traced with two estimates obtained at different positions in the bole allows for a crude sense of the individual tree level longitudinal variation pattern, and a more reliable estimate of the whole-tree property can be established. Looking for a practical multi-position sampling strategy, we evaluated the reliabilities of mean values of combinations of positions because it allows predicting the whole-tree value without a statistical model by simply averaging the values obtained at each position considered. With the mean of 1.3 m (breast height) and 25%, the reliabilities were significantly improved, with ranking correlations above 0.90. The addition of subsequent positions marginally increased the statistics.
Several indirect measurement methods were developed for a range of physical, mechanical, and chemical wood properties in a collection of woody species [68]. Regardless of the method, its efficiency depends on the correlation between predictions and the actual phenotype, typically expressed by the regression model R2. We have chosen NIRS models for disc basic density to quantify the effect of indirect measurements in whole-tree wood properties prediction because we have selected trees to maximize the DBD range, and it has the largest data set comprising 240 direct measurements/NIRS spectra data pairs, thus satisfying two important requirements for calibrating good NIRS models: sample size and variability for the trait [70,73,74]. Working with A. mangium, Karlinasari et al. [26] generated NIRS models for α-cellulose and hemicelluloses with good calibration R2 ≈ 0.80, different of lignin and extractives content with poor quality and lower R2 of 0.41 and 0.54, respectively. Hodge et al. [69] developed global NIRS models for five eucalyptus species and found higher cross-validation R2 for lignin-related traits, with lignin, insoluble lignin, and syringyl–guaiacyl ratio R2 of 0.95, 0.96, and 0.86, respectively. The global models for sugar content were slightly inferior, with R2cv of 0.74 for glucose, 0.89 for xylose, and from 0.72 to 0.91 for the minor sugars.
In our study, the selected disc basic density NIRS model had calibration R2 of 0.82 and cross-validation R2cv of 0.75, values in the typical range of good NIRS models reported for wood properties. The predictions with this model slightly reduced the reliability for all sampling positions scenarios. In our disc basic density case, starting with reliable breast height sampling, the precision of the indirect measurement did not greatly affect the overall whole-tree estimate. From a practical point, with the 0.80 ranking correlation obtained with NIRS sampling at breast height, tree breeders would still efficiently select the best-ranked genotypes. If the purpose of the phenotyping requires even more precise estimates of the individual whole-tree level, then multiple positions sampling may be necessary. The mean value of the positions 1.3 m (breast height) and 25%, still executable in standing trees, could predict the whole-tree value with higher reliability and ranking correlation. For a near-perfect prediction, three-position sampling with NIRS at positions 1.3 m, 25%, and 50% showed reliability and ranking correlation above 0.90, at the expense of felling the tree for the measurements. Generally, the overall precision was proportional to the product of the reliability of the positions set considered and the Pearson correlation between the NIRS prediction and the actual phenotype, i.e., the square root of the indirect method model R2. Aiming for high accuracy whole-tree phenotyping, the two statistics must be considered. Sampling a tree with a precise indirect method in a single position with low reliability will inaccurately predict the whole-tree property; similarly, sampling a tree in a single position with high reliability using an imprecise indirect method will also provide inaccurate predictions of the whole-tree property.
5. Conclusions
The wood and pulping properties estimates obtained in the present study, with second-generation A. crassicarpa trees, show that the specie has wood suitable for efficient pulp production, with lignin contents, carbohydrates contents, and kraft pulp yields in the range of the hardwoods commercially planted around the world. The within-tree longitudinal pattern of variation was described as a normally distributed numerical trait—the “Slope100”—and for basic density and insoluble lignin content, a consistent decreasing trend from the base to top of the bole was shown. In contrast, for the carbohydrates, soluble lignin, and S/G ratio, no consistent pattern was observed. The reliability of sets of positions taken singly or combined to predict the whole-tree phenotype varied along with the different traits, and for pulp yield, basic density, glucose content, and lignin content, reliable ground-level direct measurement sampling was found, with very high ranking correlations. With a NIRS prediction model of basic density with observed cross-validation R2cv = 0.75, a 0.12 reduction in the reliability of breast height sampling was verified, but still with a 0.80 Spearman ranking correlation, which could efficiently rank the trees for selection in a breeding program. Multiple-position sampling can be performed together with indirect measurements to achieve a near-perfect whole-tree property estimate. A strategy of sampling standing trees at breast height and 25% of the commercial height, and using the mean value of those positions will bring a high degree of accuracy to individual whole-tree level phenotyping.
Author Contributions
Conceptualization, G.S.M.; methodology, G.S.M., M.Y.; validation, G.S.M., R.A., G.R.H., J.J.A., A.P., F.U., S.D.M.; formal analysis, G.S.M.; investigation, G.S.M., G.R.H., J.J.A.; resources, S., M.Y., R.A., A.P., F.U., S.D.M.; data curation, G.S.M., S.; writing—original draft preparation, G.S.M.; writing—review and editing, G.S.M., M.Y., A.P., R.A., G.R.H., J.J.A., S.D.M. All authors have read and agreed to the published version of the manuscript.
Funding
This research was funded by the R&D Department of APRIL.
Acknowledgments
We thank our colleagues from APRIL Valerie Grzeskowiak and Gefri Indra Hutabarat for help with the data organizing and valuable comments on the results. Thanks also to Camcore for supporting the graduate study and this research at North Carolina State University.
Conflicts of Interest
The authors declare no conflict of interest.
Appendix A

Table A1.
Descriptive statistics mean, standard deviation (SD), coefficient of variation (CV), and box plots of the 40 trees selected for the destructive sampling by position for diameter, disc basic density (DBD), chips basic density (CBD), screened kraft pulp yield (KPY), alpha cellulose (αCEL), glucose (GLU), arabinose (ARA), galactose (GAL), rhamnose (RHA), xylose (XYL), mannose (MAN), total lignin (LIG), insoluble lignin (INS), acid-soluble lignin (SOL), and syringyl–guaiacyl ratio (S/G).
| Variable | Position | N | Mean | SD | CV | Mean Longitudinal Variation |
|---|---|---|---|---|---|---|
| Diameter (cm) | 0% | 40 | 20.9 | 2.8 | 13.5 | 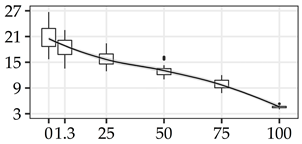 |
| 1.3 m | 40 | 18.2 | 2.2 | 11.8 | ||
| 25% | 40 | 15.9 | 1.7 | 10.8 | ||
| 50% | 40 | 13.1 | 1.3 | 10.0 | ||
| 75% | 40 | 9.9 | 1.1 | 11.4 | ||
| 100% | 40 | 4.5 | 0.3 | 5.6 | ||
| DBD (kg/m3) | 0% | 40 | 527.9 | 31.5 | 6.0 | 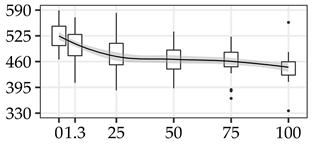 |
| 1.3 m | 40 | 499.8 | 39.8 | 8.0 | ||
| 25% | 40 | 475.0 | 43.8 | 9.2 | ||
| 50% | 40 | 466.6 | 36.6 | 7.8 | ||
| 75% | 40 | 462.8 | 32.2 | 7.0 | ||
| 100% | 40 | 445.1 | 32.8 | 7.4 | ||
| CBD (kg/m3) | 0% | 40 | 498.4 | 32.9 | 6.6 | 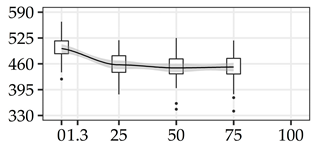 |
| 1.3 m | 0 | |||||
| 25% | 40 | 457.4 | 31.6 | 6.9 | ||
| 50% | 40 | 449.7 | 36.0 | 8.0 | ||
| 75% | 40 | 451.8 | 36.4 | 8.1 | ||
| 100% | 0 | |||||
| KPY (%) | 0% | 40 | 52.4 | 1.8 | 3.4 | 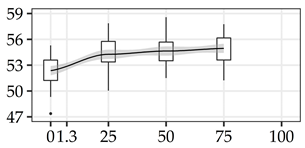 |
| 1.3 m | 0 | |||||
| 25% | 40 | 54.3 | 1.8 | 3.4 | ||
| 50% | 40 | 54.6 | 1.6 | 2.9 | ||
| 75% | 40 | 54.9 | 1.6 | 2.9 | ||
| 100% | 0 | |||||
| αCEL (%) | 0% | 40 | 44.0 | 3.0 | 6.8 | 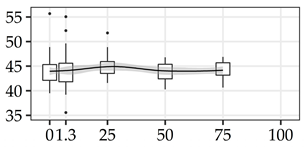 |
| 1.3 m | 40 | 44.1 | 3.5 | 8.0 | ||
| 25% | 40 | 44.9 | 2.2 | 4.8 | ||
| 50% | 40 | 44.0 | 1.8 | 4.0 | ||
| 75% | 40 | 44.2 | 1.7 | 3.9 | ||
| 100% | 0 | |||||
| GLU (%) | 0% | 40 | 49.5 | 2.5 | 5.0 | 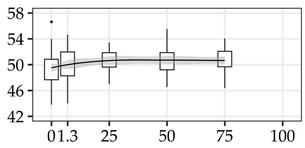 |
| 1.3 m | 40 | 50.0 | 2.4 | 4.9 | ||
| 25% | 40 | 50.6 | 1.7 | 3.4 | ||
| 50% | 40 | 50.7 | 2.0 | 4.0 | ||
| 75% | 40 | 50.6 | 1.8 | 3.5 | ||
| 100% | 0 | |||||
| ARA (%) | 0% | 40 | 0.29 | 0.04 | 12.8 | 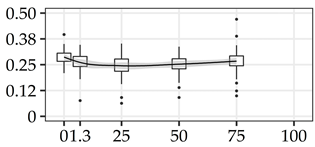 |
| 1.3 m | 40 | 0.26 | 0.05 | 18.0 | ||
| 25% | 40 | 0.24 | 0.06 | 23.0 | ||
| 50% | 40 | 0.25 | 0.05 | 19.4 | ||
| 75% | 40 | 0.27 | 0.06 | 23.7 | ||
| 100% | 0 | |||||
| GAL (%) | 0% | 40 | 0.63 | 0.14 | 22.1 | 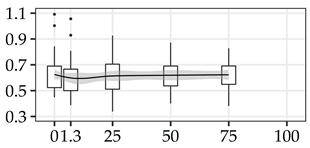 |
| 1.3 m | 40 | 0.60 | 0.15 | 24.8 | ||
| 25% | 40 | 0.61 | 0.12 | 20.1 | ||
| 50% | 40 | 0.62 | 0.11 | 18.2 | ||
| 75% | 40 | 0.62 | 0.10 | 16.0 | ||
| 100% | 0 | |||||
| RHA (%) | 0% | 40 | 0.26 | 0.06 | 22.5 | 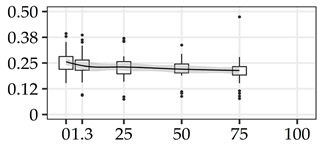 |
| 1.3 m | 40 | 0.24 | 0.06 | 25.6 | ||
| 25% | 40 | 0.23 | 0.07 | 28.9 | ||
| 50% | 40 | 0.22 | 0.05 | 21.6 | ||
| 75% | 40 | 0.21 | 0.06 | 30.1 | ||
| 100% | 0 | |||||
| XYL (%) | 0% | 40 | 13.8 | 0.9 | 6.4 | 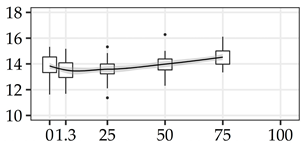 |
| 1.3 m | 40 | 13.5 | 0.8 | 6.0 | ||
| 25% | 40 | 13.6 | 0.8 | 5.8 | ||
| 50% | 40 | 14.0 | 0.7 | 5.1 | ||
| 75% | 40 | 14.5 | 0.6 | 4.5 | ||
| 100% | 0 | |||||
| MAN (%) | 0% | 40 | 1.16 | 0.37 | 32.2 | 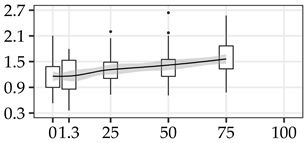 |
| 1.3 m | 40 | 1.16 | 0.38 | 32.8 | ||
| 25% | 40 | 1.31 | 0.32 | 24.1 | ||
| 50% | 40 | 1.42 | 0.37 | 26.5 | ||
| 75% | 40 | 1.56 | 0.40 | 25.8 | ||
| 100% | 0 | |||||
| LIG (%) | 0% | 40 | 30.7 | 1.6 | 5.1 | 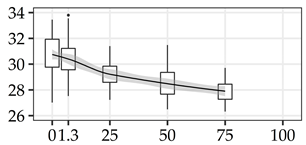 |
| 1.3 m | 40 | 30.4 | 1.5 | 5.0 | ||
| 25% | 40 | 29.2 | 1.1 | 3.7 | ||
| 50% | 40 | 28.5 | 1.2 | 4.1 | ||
| 75% | 40 | 27.9 | 0.8 | 3.0 | ||
| 100% | 0 | |||||
| INS (%) | 0% | 40 | 28.6 | 1.5 | 5.2 | 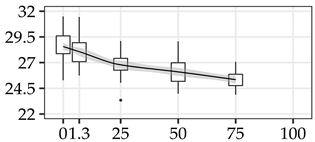 |
| 1.3 m | 40 | 28.1 | 1.5 | 5.2 | ||
| 25% | 40 | 26.8 | 1.2 | 4.5 | ||
| 50% | 40 | 26.1 | 1.2 | 4.5 | ||
| 75% | 40 | 25.3 | 0.8 | 3.3 | ||
| 100% | 0 | |||||
| SOL (%) | 0% | 40 | 2.18 | 0.26 | 12.1 | 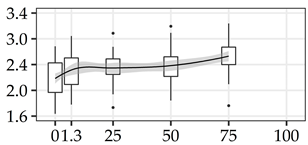 |
| 1.3 m | 40 | 2.34 | 0.30 | 12.6 | ||
| 25% | 40 | 2.35 | 0.22 | 9.5 | ||
| 50% | 40 | 2.38 | 0.25 | 10.4 | ||
| 75% | 40 | 2.53 | 0.28 | 10.9 | ||
| 100% | 0 | |||||
| S/G | 0% | 40 | 1.61 | 0.09 | 5.5 | 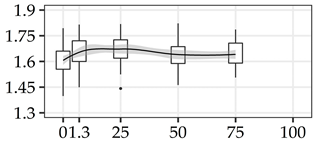 |
| 1.3 m | 40 | 1.65 | 0.09 | 5.4 | ||
| 25% | 40 | 1.67 | 0.08 | 5.1 | ||
| 50% | 40 | 1.65 | 0.09 | 5.7 | ||
| 75% | 40 | 1.64 | 0.07 | 4.5 | ||
| 100% | 0 |

Table A2.
Whole-tree level phenotypic correlation matrix between the wood property traits disc basic density (DBD), chips basic density (CBD), composite chips basic density (CBDc), screened kraft pulp yield (KPY), composite screened kraft pulp yield (KPYc), alpha cellulose (αCEL), glucose (GLU), arabinose (ARA), galactose (GAL), rhamnose (RHA), xylose (XYL), mannose (MAN), total lignin (LIG), insoluble lignin (INS), acid-soluble lignin (SOL), and syringyl–guaiacyl ratio (S/G).
| DBD | CBD | CBDc | KPY | KPYc | αCEL | GLU | ARA | GAL | RHA | XYL | MAN | LIG | INS | SOL | |
|---|---|---|---|---|---|---|---|---|---|---|---|---|---|---|---|
| CBD | 0.92 ** | ||||||||||||||
| CBDc | 0.91 ** | 0.96 ** | |||||||||||||
| KPY | 0.52 ** | 0.43 ** | 0.36 * | ||||||||||||
| KPYc | 0.47 ** | 0.36 * | 0.30 | 0.93 ** | |||||||||||
| αCEL | 0.44 ** | 0.35 * | 0.29 | 0.36 * | 0.35 * | ||||||||||
| GLU | 0.28 | 0.18 | 0.10 | 0.49 ** | 0.48 ** | 0.70 ** | |||||||||
| ARA | 0.47 ** | 0.45 ** | 0.42 ** | 0.08 | 0.07 | 0.30 | 0.09 | ||||||||
| GAL | 0.59 ** | 0.49 ** | 0.44 ** | 0.43 ** | 0.37 * | 0.44 ** | 0.37 * | 0.68 ** | |||||||
| RHA | 0.50 ** | 0.47 ** | 0.42 ** | 0.16 | 0.13 | 0.40 * | 0.16 | 0.88 ** | 0.68 ** | ||||||
| XYL | −0.10 | −0.17 | −0.12 | −0.21 | −0.17 | 0.02 | 0.06 | −0.30 | −0.37 * | −0.27 | |||||
| MAN | −0.37 * | −0.49 ** | −0.40 * | −0.24 | −0.11 | 0.02 | 0.13 | −0.17 | −0.31 * | −0.02 | 0.24 | ||||
| LIG | −0.21 | −0.09 | −0.10 | −0.46 ** | −0.49 ** | −0.48 ** | −0.60 ** | −0.02 | −0.43 ** | −0.15 | 0.10 | −0.15 | |||
| INS | −0.20 | −0.09 | −0.07 | −0.47 ** | −0.50 ** | −0.41 ** | −0.55 ** | 0.06 | −0.35 * | −0.08 | 0.08 | −0.12 | 0.97 ** | ||
| SOL | −0.41 ** | −0.30 | −0.40 * | −0.20 | −0.20 | −0.28 | −0.24 | −0.39 * | −0.58 ** | −0.35 * | 0.05 | −0.03 | 0.31 | 0.13 | |
| S/G | 0.16 | 0.17 | 0.09 | 0.18 | 0.06 | −0.05 | −0.09 | 0.03 | 0.11 | −0.01 | 0.13 | −0.44 ** | −0.10 | −0.14 | 0.18 |
** significant at 0.01; * significant at 0.05; All other values not significant with p-value > 0.05.
References
- Nambiar, E.K.S.; Harwood, C.E. Productivity of acacia and eucalypt plantations in Southeast Asia. 1. Bio-physical determinants of production: Opportunities and challenges. Int. For. Rev. 2014, 16, 225–248. [Google Scholar] [CrossRef]
- Mendham, D.S.; White, D.A. A review of nutrient, water and organic matter dynamics of tropical acacias on mineral soils for improved management in Southeast Asia. Aust. For. 2019, 82, 45–56. [Google Scholar] [CrossRef]
- Nirsatmanto, A.; Sunarti, S. Genetics and Breeding of Tropical Acacias for Forest Products: Acacia mangium, A. auriculiformis and A. crassicarpa. In Advances in Plant Breeding Strategies: Industrial and Food Crops; Al-Khayri, J., Jain, S., Eds.; Springer: Cham, Switzerland, 2019; Volume 6, pp. 3–28. [Google Scholar]
- Harwood, C.E.; Hardiyanto, E.B.; Wong, C.Y. Genetic improvement of tropical acacias: Achievements and challenges. South. For. A J. For. Sci. 2015, 77, 11–18. [Google Scholar] [CrossRef]
- McKinnon, G.E.; Larcombe, M.J.; Griffin, A.R.; Vaillancourt, R.E. Development of microsatellites using next-generation sequencing for Acacia crassicarpa. J. Trop. For. Sci. 2018, 30, 252–258. [Google Scholar]
- Nambiar, E.K.S.; Harwood, C.E.; Mendham, D.S. Paths to sustainable wood supply to the pulp and paper industry in Indonesia after diseases have forced a change of species from acacia to eucalypts. Aust. For. 2018, 81, 148–161. [Google Scholar] [CrossRef]
- Griffin, A.R.; Midgley, S.J.; Bush, D.; Cunningham, P.J.; Rinaudo, A.T. Global uses of Australian acacias–Recent trends and future prospects. Dive. Dist. 2011, 17, 837–847. [Google Scholar] [CrossRef]
- Kumar, H.; Christopher, L.P. Recent trends and developments in dissolving pulp production and application. Cellulose 2017, 24, 2347–2365. [Google Scholar] [CrossRef]
- Lundberg, V.; Bood, J.; Nilsson, L.; Axelsson, E.; Berntsson, T.; Svensson, E. Converting a kraft pulp mill into a multi-product biorefinery: Techno-economic analysis of a case mill. Clean Technol. Environ. 2014, 16, 1411–1422. [Google Scholar] [CrossRef]
- Marinova, M.; Mateos-Espejel, E.; Paris, J. From kraft mills to forest biorefinery: An energy and water perspective II. Case study. Cell Chem. Technol. 2010, 44, 21–26. [Google Scholar]
- Marinova, M.; Mateos-Espejel, E.; Jemaa, N.; Paris, J. Addressing the increased energy demand of a kraft mill biorefinery: The hemicellulose extraction case. Chem. Eng. Res. Des. 2009, 87, 1269–1275. [Google Scholar] [CrossRef]
- Schmidt, E.A. A practical model relating kraft pulping costs to hardwood chemical properties and morphology. Appita J. 2005, 58, 218–224. [Google Scholar]
- White, T.L. A conceptual framework for tree improvement programs. New For. 1987, 1, 325–342. [Google Scholar] [CrossRef]
- Borralho, N.M.G.; Cotterill, P.P.; Kanowski, P.J. Breeding objectives for pulp production of Eucalyptus globulus under different industrial cost structures. Can. J. For. Res. 1993, 23, 648–656. [Google Scholar] [CrossRef]
- Chen, C.; Duan, C.; Li, J.; Liu, Y.; Ma, X.; Zheng, L.; Stavik, J.; Ni, Y. Cellulose (dissolving pulp) manufacturing processes and properties: A mini-review. Bioresources 2016, 11, 5553–5564. [Google Scholar]
- Rezende, G.D.S.P.; Resende, M.D.V.; Assis, T.F. Eucalyptus Breeding for Clonal Forestry. In Fenning Challenges and Opportunities for the World’s Forests in the 21st Century; Fenning, T., Ed.; Springer: Dordrecht, The Netherlands, 2014; Forestry Sciences; Volume 81, pp. 393–424. [Google Scholar]
- Greaves, B.L.; Borralho, N.M.G.; Raymond, C.A. Breeding objective for plantation eucalypts grown for production of kraft pulp. For. Sci. 1997, 43, 465–472. [Google Scholar]
- Clark, N.B.; Balodis, V.; Fang, G.; Wang, J. Pulping properties of tropical acacias. In Advances in Tropical Acacia Research, Proceedings of An International Workshop, Bangkok, Thailand, 11–15 February 1991; Turnbull, J.W., Ed.; Proceedings no. 35.; ACIAR (Australian Centre for International Agriculture Research): Canberra, Australia, 1991; pp. 138–144. [Google Scholar]
- Clark, N.B.; Balodis, V.; Fang, G.; Wang, J. Pulping potential of acacias. In Australian Tree Species Research in China, Proceedings of an International Workshop, Zhangzhou, China, 2–5 November 1992; Brown, A.G., Ed.; Proceedings no. 48.; ACIAR (Australian Centre for International Agriculture Research): Canberra, Australia, 1994; pp. 196–202. [Google Scholar]
- Laurila, R. Wood properties and utilization potential of eight fast-growing tropical plantation tree species. J. Trop. For. Prod. 1995, 1, 209–221. [Google Scholar]
- Shukor, N.A.A.; Nang, A.N.; Awang, K. Selected wood properties of Acacia auriculiformis and A. crassicarpa provenances in Malaysia. In Recent Developments in Acacia Planting, Proceedings of an International Workshop, Hanoi, Vietnam, 27–30 October 1997; Turnbull, J.W., Crompton, H.R., Eds.; Proceedings no. 82.; ACIAR (Australian Centre for International Agriculture Research): Canberra, Australia, 1998; pp. 155–160. [Google Scholar]
- Yao, S.; Wu, G.; Xing, M.; Zhou, S.; Pu, J. Determination of lignin content in Acacia spp. using near-infrared reflectance spectroscopy. Bioresources 2010, 5, 556–562. [Google Scholar]
- Griffin, A.R.; Twayi, H.; Braunstein, R.; Downes, G.M.; Son, D.H.; Harwood, C.E. A comparison of fibre and pulp properties of diploid and tetraploid Acacia mangium grown in Vietnam. Appita J. 2014, 67, 43–49. [Google Scholar]
- Chowdhury, M.Q.; Shams, M.I.; Alam, M. Effects of age and height variation on physical properties of mangium (Acacia mangium Willd.) wood. Aust. For. 2005, 68, 17–19. [Google Scholar] [CrossRef]
- Nugroho, W.D.; Marsoem, S.N.; Yasue, K.; Fujiwara, T.; Nakajima, T.; Hayakawa, M.; Nakaba, S.; Yamagishi, Y.; Jin, H.O.; Kubo, T.; et al. Radial variations in the anatomical characteristics and density of the wood of Acacia mangium of five different provenances in Indonesia. J. Wood Sci. 2012, 58, 185–194. [Google Scholar] [CrossRef]
- Karlinasari, L.; Sabed, M.; Wistara, I.N.J.; Purwanto, Y.A. Near infrared (NIR) spectroscopy for estimating the chemical composition of (Acacia mangium Willd.) wood. J. Indi. Acad. Wood Sci. 2014, 11, 162–167. [Google Scholar] [CrossRef]
- Moya, R.; Muñoz, F. Physical and mechanical properties of eight fast-growing plantation species in Costa Rica. J. Trop. For. Sci. 2010, 22, 317–328. [Google Scholar]
- Chowdhury, M.Q.; Ishiguri, F.; Iizuka, K.; Hiraiwa, T.; Matsumoto, K.; Takashima, Y.; Yokota, S.; Yoshizawa, N. Wood property variation in Acacia auriculiformis growing in Bangladesh. Wood Fiber Sci. 2009, 41, 359–365. [Google Scholar]
- Tonouéwa, J.M.F.M.; Langbour, P.; Biaou, S.S.H.; Assèdé, E.S.P.; Guibal, D.; Kouchade, C.A.; Kounouhéwa, B.B. Anatomical and physico-mechanical properties of Acacia auriculiformis wood in relation to age and soil in Benin, West Africa. Euro. J. Wood Wood Prod. 2020, 78, 745–756. [Google Scholar] [CrossRef]
- Dinh Kha, L.; Harwood, C.E.; Kien, N.D.; Baltunis, B.S.; Dinh Hai, N.; Thinh, H.H. Growth and wood basic density of acacia hybrid clones at three locations in Vietnam. New For. 2012, 43, 13–29. [Google Scholar] [CrossRef]
- Rokeya, U.K.; Hossain, M.A.; Ali, R.A.; Paul, S.P. Physical and mechanical properties of (Acacia auriculiformis × A. mangium) hybrid acacia. J. Bangladesh Acad. Sci. 2010, 34, 181–187. [Google Scholar] [CrossRef]
- Rafeadah, R.; Rahim, S. Chemical and physical properties of juvenile acacia hybrid and Azadiracta Excelsa. J. Inst. Wood Sci. 2007, 17, 290–294. [Google Scholar] [CrossRef]
- Jusoh, I.; Zaharin, F.A.; Adam, N.S. Wood quality of Acacia hybrid and second-generation Acacia mangium. Bioresources 2014, 9, 150–160. [Google Scholar] [CrossRef]
- Barry, K.M.; Mihara, R.; Davies, N.W.; Mitsunaga, T.; Mohammed, C.L. Polyphenols in Acacia mangium and Acacia auriculiformis heartwood with reference to heart rot susceptibility. J. Wood Sci. 2005, 51, 615–621. [Google Scholar] [CrossRef]
- Yahya, R.; Sugiyama, J.; Silsia, D.; Gril, J. Some anatomical features of an Acacia hybrid, A. mangium and A. auriculiformis grown in Indonesia with regard to pulp yield and paper strength. J. Trop. For. Sci. 2010, 22, 343–351. [Google Scholar]
- Bakri, M.K.B.; Jayamani, E.; Hamdan, S.; Rahman, R.; Kakar, A. Potential of Borneo acacia wood in fully biodegradable bio-composites’ commercial production and application. Polym. Bull. 2018, 75, 5333–5354. [Google Scholar] [CrossRef]
- Bouvet, J.; Ekomono, C.G.M.; Brendel, O.; Laclau, J.; Bouillet, J.; Epron, D. Selecting for water use efficiency, wood chemical traits and biomass with genomic selection in a Eucalyptus breeding program. For. Ecol. Manag. 2020, 465, 1–10. [Google Scholar] [CrossRef]
- Nickolas, H.; Williams, D.; Downes, G.; Tilyard, P.; Harrison, P.A.; Vaillancourt, R.E.; Potts, B. Genetic correlations among pulpwood and solid-wood selection traits in Eucalyptus globulus. New For. 2020, 51, 137–158. [Google Scholar] [CrossRef]
- Stackpole, D.J.; Vaillancourt, R.E.; Alves, A.; Rodrigues, J.; Potts, B.M. Genetic variation in the chemical components of Eucalyptus globulus wood. G3 Genes Genomes Genet. 2011, 1, 151–159. [Google Scholar]
- Del-Río, J.C.; Gutiérrez, A.; Hernando, M.; Landín, P.; Romero, J.; Martínez, A.T. Determining the influence of eucalypt lignin composition in paper pulp yield using Py-GC/MS. J. Anal. Appl. Pyrol. 2005, 74, 110–115. [Google Scholar] [CrossRef]
- Ohra-aho, T.; Gomes, F.J.B.; Colodette, J.L.; Tamminen, T. S/G ratio and lignin structure among Eucalyptus hybrids determined by Py-GC/MS and nitrobenzene oxidation. J. Anal. Appl. Pyro. 2013, 101, 166–171. [Google Scholar] [CrossRef]
- De Lima, B.M.; Cappa, E.P.; Silva-Junior, O.B.; Garcia, C.; Mansfield, S.D.; Grattapaglia, D. Quantitative genetic parameters for growth and wood properties in Eucalyptus “urograndis” hybrid using near-infrared phenotyping and genome-wide SNP-based relationships. PLoS ONE 2019, 14, e0218747. [Google Scholar] [CrossRef]
- Raymond, C.A. Genetics of Eucalyptus wood properties. Ann. For. Sci. 2002, 59, 525–531. [Google Scholar] [CrossRef]
- Atwood, R.A.; White, T.L.; Huber, D.A. Genetic parameters and gains for growth and wood properties in Florida source loblolly pine in the southeastern United States. Can. J. For. Res. 2002, 32, 1025–1038. [Google Scholar] [CrossRef]
- Sykes, R.W.; Isik, F.; Li, B.; Kadla, J.; Chang, H.-M. Genetic variation of juvenile wood properties in a loblolly pine progeny test. TAPPI J. 2003, 2, 3–8. [Google Scholar]
- Neale, D.B.; Mitchell, M.S.; Brown, G.R. Molecular dissection of the quantitative inheritance of wood property traits in loblolly pine. Ann. For. Sci. 2002, 59, 595–605. [Google Scholar] [CrossRef]
- Li, Y.; Ding, X.; Jiang, J.; Luan, Q. Inheritance and correlation analysis of pulpwood properties, wood density, and growth traits of slash pine. Forests 2020, 11, 493. [Google Scholar] [CrossRef]
- Fundová, I. Quantitative Genetics of Wood Quality Traits in Scots Pine. Ph.D. Thesis, Swedish University of Agricultural Sciences, Umeå, Sweden, 2020. [Google Scholar]
- Schimleck, L.R.; Payne, P.; Wearne, R.H. Determination of important pulp properties of hybrid poplar by near infrared spectroscopy. Wood Fiber Sci. 2005, 37, 462–471. [Google Scholar]
- Jin, J.; Zhao, X.; Liu, H.; Wang, S.; Song, Z.; Ma, X.; Li, K. Preliminary study on genetic variation of growth traits and wood properties and superior clones selection of Populus ussuriensis Kom. iForest-Biog. For. 2019, 12, 459–466. [Google Scholar] [CrossRef]
- Niemczyk, M.; Przybysz, P.; Przybysz, K.; Kaliszewski, A.; Wojda, T.; Liesebach, M. Productivity, growth patterns, and cellulosic pulp properties of hybrid aspen clones. Forests 2019, 10, 450. [Google Scholar] [CrossRef]
- Cornelius, J. Heritabilities and additive genetic coefficients of variation in forest trees. Can. J. For. Res. 1994, 24, 372–379. [Google Scholar] [CrossRef]
- Zobel, B.J.; Talbert, J. Applied Forest Tree Improvement; John Wiley & Sons: New York, NY, USA, 1984; pp. 375–413. [Google Scholar]
- Zobel, B.J.; van Buijtenen, J.P. Wood Variation: Its Causes and Control; Springer: Berlin/Heidelberg, Germany; New York, NY, USA, 1989. [Google Scholar]
- Barnett, J.R.; Jeronimidis, G. Wood Quality and Its Biological Basis, 1st ed.; Blackwell Publishing Ltd.: Oxford, UK, 2003. [Google Scholar]
- Plomion, C.; Leprovost, G.; Stokes, A. Wood formation in trees. Plant Physiol. 2001, 127, 1513–1523. [Google Scholar] [CrossRef]
- Von Arx, G.; Crivellaro, A.; Prendin, A.L.; Čufar, K.; Carrer, M. Quantitative Wood Anatomy—Practical Guidelines. Front. Plant. Sci. 2016, 7, 781. [Google Scholar] [CrossRef]
- Katz, J.L.; Spencer, P.; Wang, W.; Misra, A.; Marangos, O.; Friis, L. On the anisotropic elastic properties of woods. J. Mater. Sci. 2008, 43, 139–145. [Google Scholar] [CrossRef]
- Jones, P.D.; Schimleck, L.R.; Daniels, R.F.; Clark, A., III; Purnell, R.C. Comparison of Pinus taeda L. whole-tree wood property calibrations using diffuse reflectance near infrared spectra obtained using a variety of sampling options. Wood Sci. Technol. 2008, 42, 385–400. [Google Scholar] [CrossRef]
- Schimleck, L.R.; Rezende, G.D.S.P.; Demuner, B.J.; Downes, G.M. Estimation of whole-tree wood quality traits using near infrared spectra from increment cores. Appita J. 2006, 59, 231. [Google Scholar]
- Ohshima, J.; Yokota, S.; Yoshizawa, N.; Ona, T. Examination of within-tree variations and the heights representing whole-tree values of derived wood properties for quasi-non-destructive breeding of Eucalyptus camaldulensis and Eucalyptus globulus as quality pulpwood. J. Wood Sci. 2005, 51, 102–111. [Google Scholar] [CrossRef]
- Igartúa, D.V.; Monteoliva, S.E.; Monterubbianesi, M.G.; Villegas, M.S. Basic density and fibre length at breast height of Eucalyptus globulus ssp. globulus for parameter prediction of the whole tree. IAWA J. 2003, 24, 173–184. [Google Scholar] [CrossRef]
- Ona, T.; Sonoda, T.; Ito, K.; Shibata, M.; Tamai, Y.; Kojima, Y.; Ohshima, J.; Yokota, S.; Yoshizawa, N. Investigation of relationships between cell and pulp properties in Eucalyptus by examination of within-tree property variations. Wood Sci. Technol. 2001, 35, 229–243. [Google Scholar] [CrossRef]
- Raymond, C.A.; Muneri, A. Non-destructive sampling of Eucalyptus globulus and E. nitens for wood properties. I. Basic Density. Wood Sci. Technol. 2001, 35, 27–39. [Google Scholar] [CrossRef]
- Raymond, C.A.; Schimleck, L.R.; Muneri, A.; Michell, A.J. Non-destructive sampling of Eucalyptus globulus and E. nitens for wood properties. III. Predicted pulp yield using near infrared reflectance analysis. Wood Sci. Technol. 2001, 35, 203–215. [Google Scholar] [CrossRef]
- Kube, P.; Raymond, C.A. Prediction of whole-tree basic density and pulp yield using wood core samples in Eucalyptus nitens. Appita J. 2002, 55, 43–48. [Google Scholar]
- Gao, S.; Wang, X.; Wiemann, M.C.; Brashaw, B.K.; Ross, R.J.; Wang, L. A critical analysis of methods for rapid and non-destructive determination of wood density in standing trees. Ann. For. Sci. 2017, 74, 27. [Google Scholar] [CrossRef]
- Schimleck, L.; Dahlen, J.; Apiolaza, L.A.; Downes, G.; Emms, G.; Evans, R.; Moore, J.; Pâques, L.; Van den Bulcke, J.; Wang, X. Non-destructive evaluation techniques and what they tell us about wood property variation. Forests 2019, 10, 728. [Google Scholar] [CrossRef]
- Hodge, G.R.; Acosta, J.J.; Unda, F.; Woodbridge, W.C.; Mansfield, S.D. Global near infrared spectroscopy models to predict wood chemical properties of Eucalyptus. J. Near Inf. Spectrosc. 2018, 26, 117–132. [Google Scholar] [CrossRef]
- Meder, R.; Trung, T.; Schimleck, L.R. Seeing the wood in the trees: Unleashing the secrets of wood via near infrared spectroscopy. J. Near Inf. Spectrosc. 2010, 18, v–vii. [Google Scholar] [CrossRef]
- Schimleck, L.R.; Kube, P.D.; Raymond, C.A.; Michell, A.J.; French, J. Estimation of whole-tree kraft pulp yield of Eucalyptus nitens using near-infrared spectra collected from increment cores. Can. J. For. Res. 2005, 35, 2797–2805. [Google Scholar] [CrossRef]
- Schimleck, L.R.; Kube, P.D.; Raymond, C.A. Genetic improvement of kraft pulp yield in Eucalyptus nitens using cellulose content determined by near infrared spectroscopy. Can. J. For. Res. 2004, 34, 2363–2370. [Google Scholar] [CrossRef]
- Schimleck, L.R. Near infrared spectroscopy: A rapid, non-destructive method for measuring wood properties, and its application to tree breeding. N. Zeal. J. For. Sci. 2008, 38, 14–35. [Google Scholar]
- Downes, G.M.; Hudson, I.L.; Raymond, C.A.; Dean, G.H.; Michell, A.J.; Schimleck, L.R.; Evans, R.; Muneri, A. Sampling Plantation Eucalypts for Wood and Fibre Properties; CSIRO: Canberra, Australia, 1997; p. 114.
- TAPPI-Technical Association of the Pulp and Paper Industry. TAPPI Test Methods T 257 cm-02: Sampling and Preparing Wood for Analysis; Tappi Technology Park: Atlanta, GA, USA, 2002. [Google Scholar]
- TAPPI-Technical Association of the Pulp and Paper Industry. TAPPI Test Methods T 258 om-16: Basic Density and Moisture Content of Pulpwood; Tappi Technology Park: Atlanta, GA, USA, 2016. [Google Scholar]
- Scandinavian Pulp and Paper Board Testing Committee. Woodchips for Pulp Production, Size Distribution, SCAN-CM 40:01; Scandinavian Pulp, Paper and Board Testing Committee: Stockholm, Sweden, 2001. [Google Scholar]
- Hart, J.F.; de Araujo, F.; Thomas, B.R.; Mansfield, S.D. Wood quality and growth characterization across intra- and inter-Specific hybrid aspen clones. Forests 2013, 4, 786–807. [Google Scholar] [CrossRef]
- Robinson, A.R.; Mansfield, S.D. Rapid analysis of poplar lignin monomer composition by a streamlined thioacidolysis procedure and near-infrared reflectance-based prediction modeling. Plant J. 2009, 58, 706–714. [Google Scholar] [CrossRef]
- Porth, I.; Klápště, J.; Skyba, O.; Lai, B.S.K.; Geraldes, A.; Muchero, W.; Tuskan, G.A.; Douglas, C.J.; El-Kassaby, Y.A.; Mansfield, S.D. Populus trichocarpa cell wall chemistry and ultrastructure trait variation, genetic control, and genetic correlations. New Phytol. 2013, 197, 777–790. [Google Scholar] [CrossRef]
- TAPPI-Technical Association of the Pulp and Paper Industry. TAPPI Test Methods T 550 om-08: Determination of Equilibrium Moisture in Pulp, Paper and Paperboard for Chemical Analysis; Tappi Technology Park: Atlanta, GA, USA, 2008. [Google Scholar]
- TAPPI-Technical Association of the Pulp and Paper Industry. TAPPI Test Methods T 236 om-99: Kappa Number of Pulp; Tappi Technology Park: Atlanta, GA, USA, 1999. [Google Scholar]
- Acosta, J.J.; Castillo, M.S.; Hodge, G.R. Comparison of benchtop and handheld near infrared spectroscopy devices to determine forage nutritive value. Crop. Sci. 2020. [Google Scholar] [CrossRef]
- Breunig, M.; Hans-Peter, K.; Raymond, T.; Sander, J. LOF: Identifying density-based local outliers. ACM Sigmod Rec. 2000, 29, 93–104. [Google Scholar] [CrossRef]
- Mevik, B.H.; Wehrens, R.; Liland, K.H. PLS: Partial Least Squares and Principal Component Regression; R Package Version 2.4–3; R Foundation for Statistical Computing: Vienna, Austria, 2018. [Google Scholar]
- R Core Team. R: A Language and Environment for Statistical Computing; R Foundation for Statistical Computing: Vienna, Austria, 2018; Available online: https://www.R-project.org/ (accessed on 24 June 2020).
© 2020 by the authors. Licensee MDPI, Basel, Switzerland. This article is an open access article distributed under the terms and conditions of the Creative Commons Attribution (CC BY) license (http://creativecommons.org/licenses/by/4.0/).

