Latitudinal Diversity Gradients and Rapoport Effects in Chinese Endemic Woody Seed Plants

 ,
,  ,
, 
Abstract
1. Introduction
2. Materials and Methods
2.1. Species Range Size and Richness of Chinese Endemic Woody Seed Plants
2.2. Data Analysis
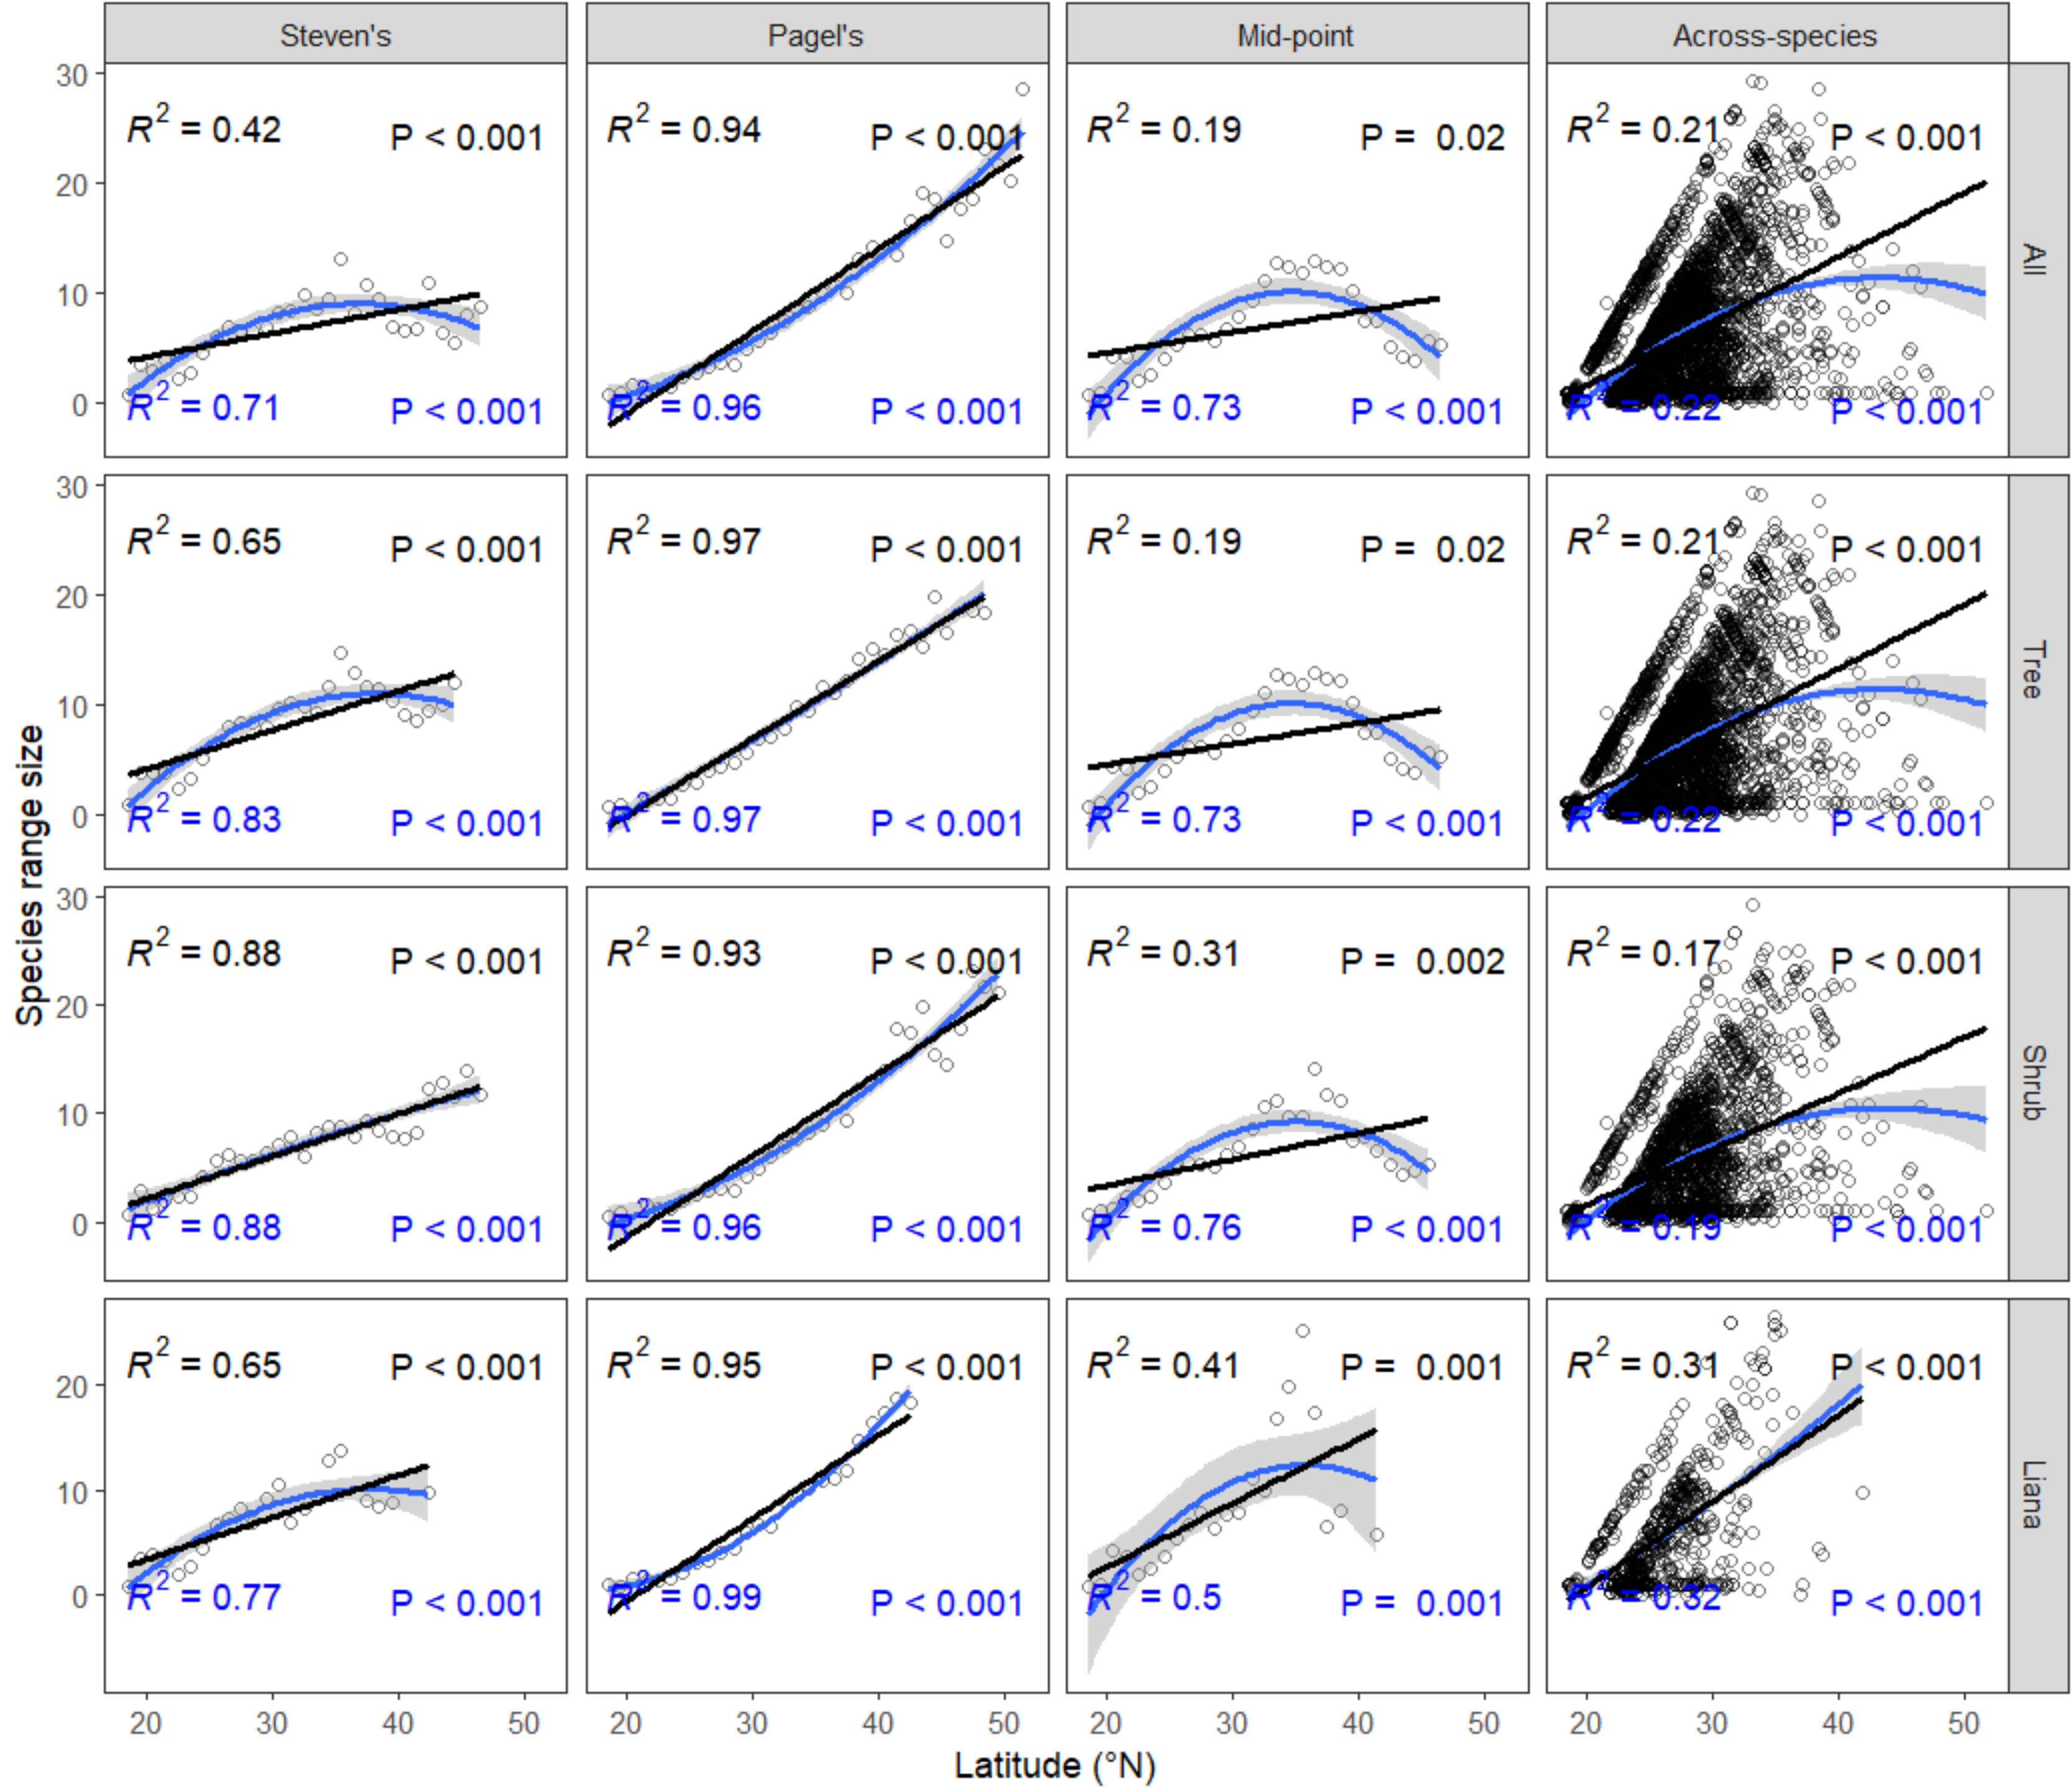
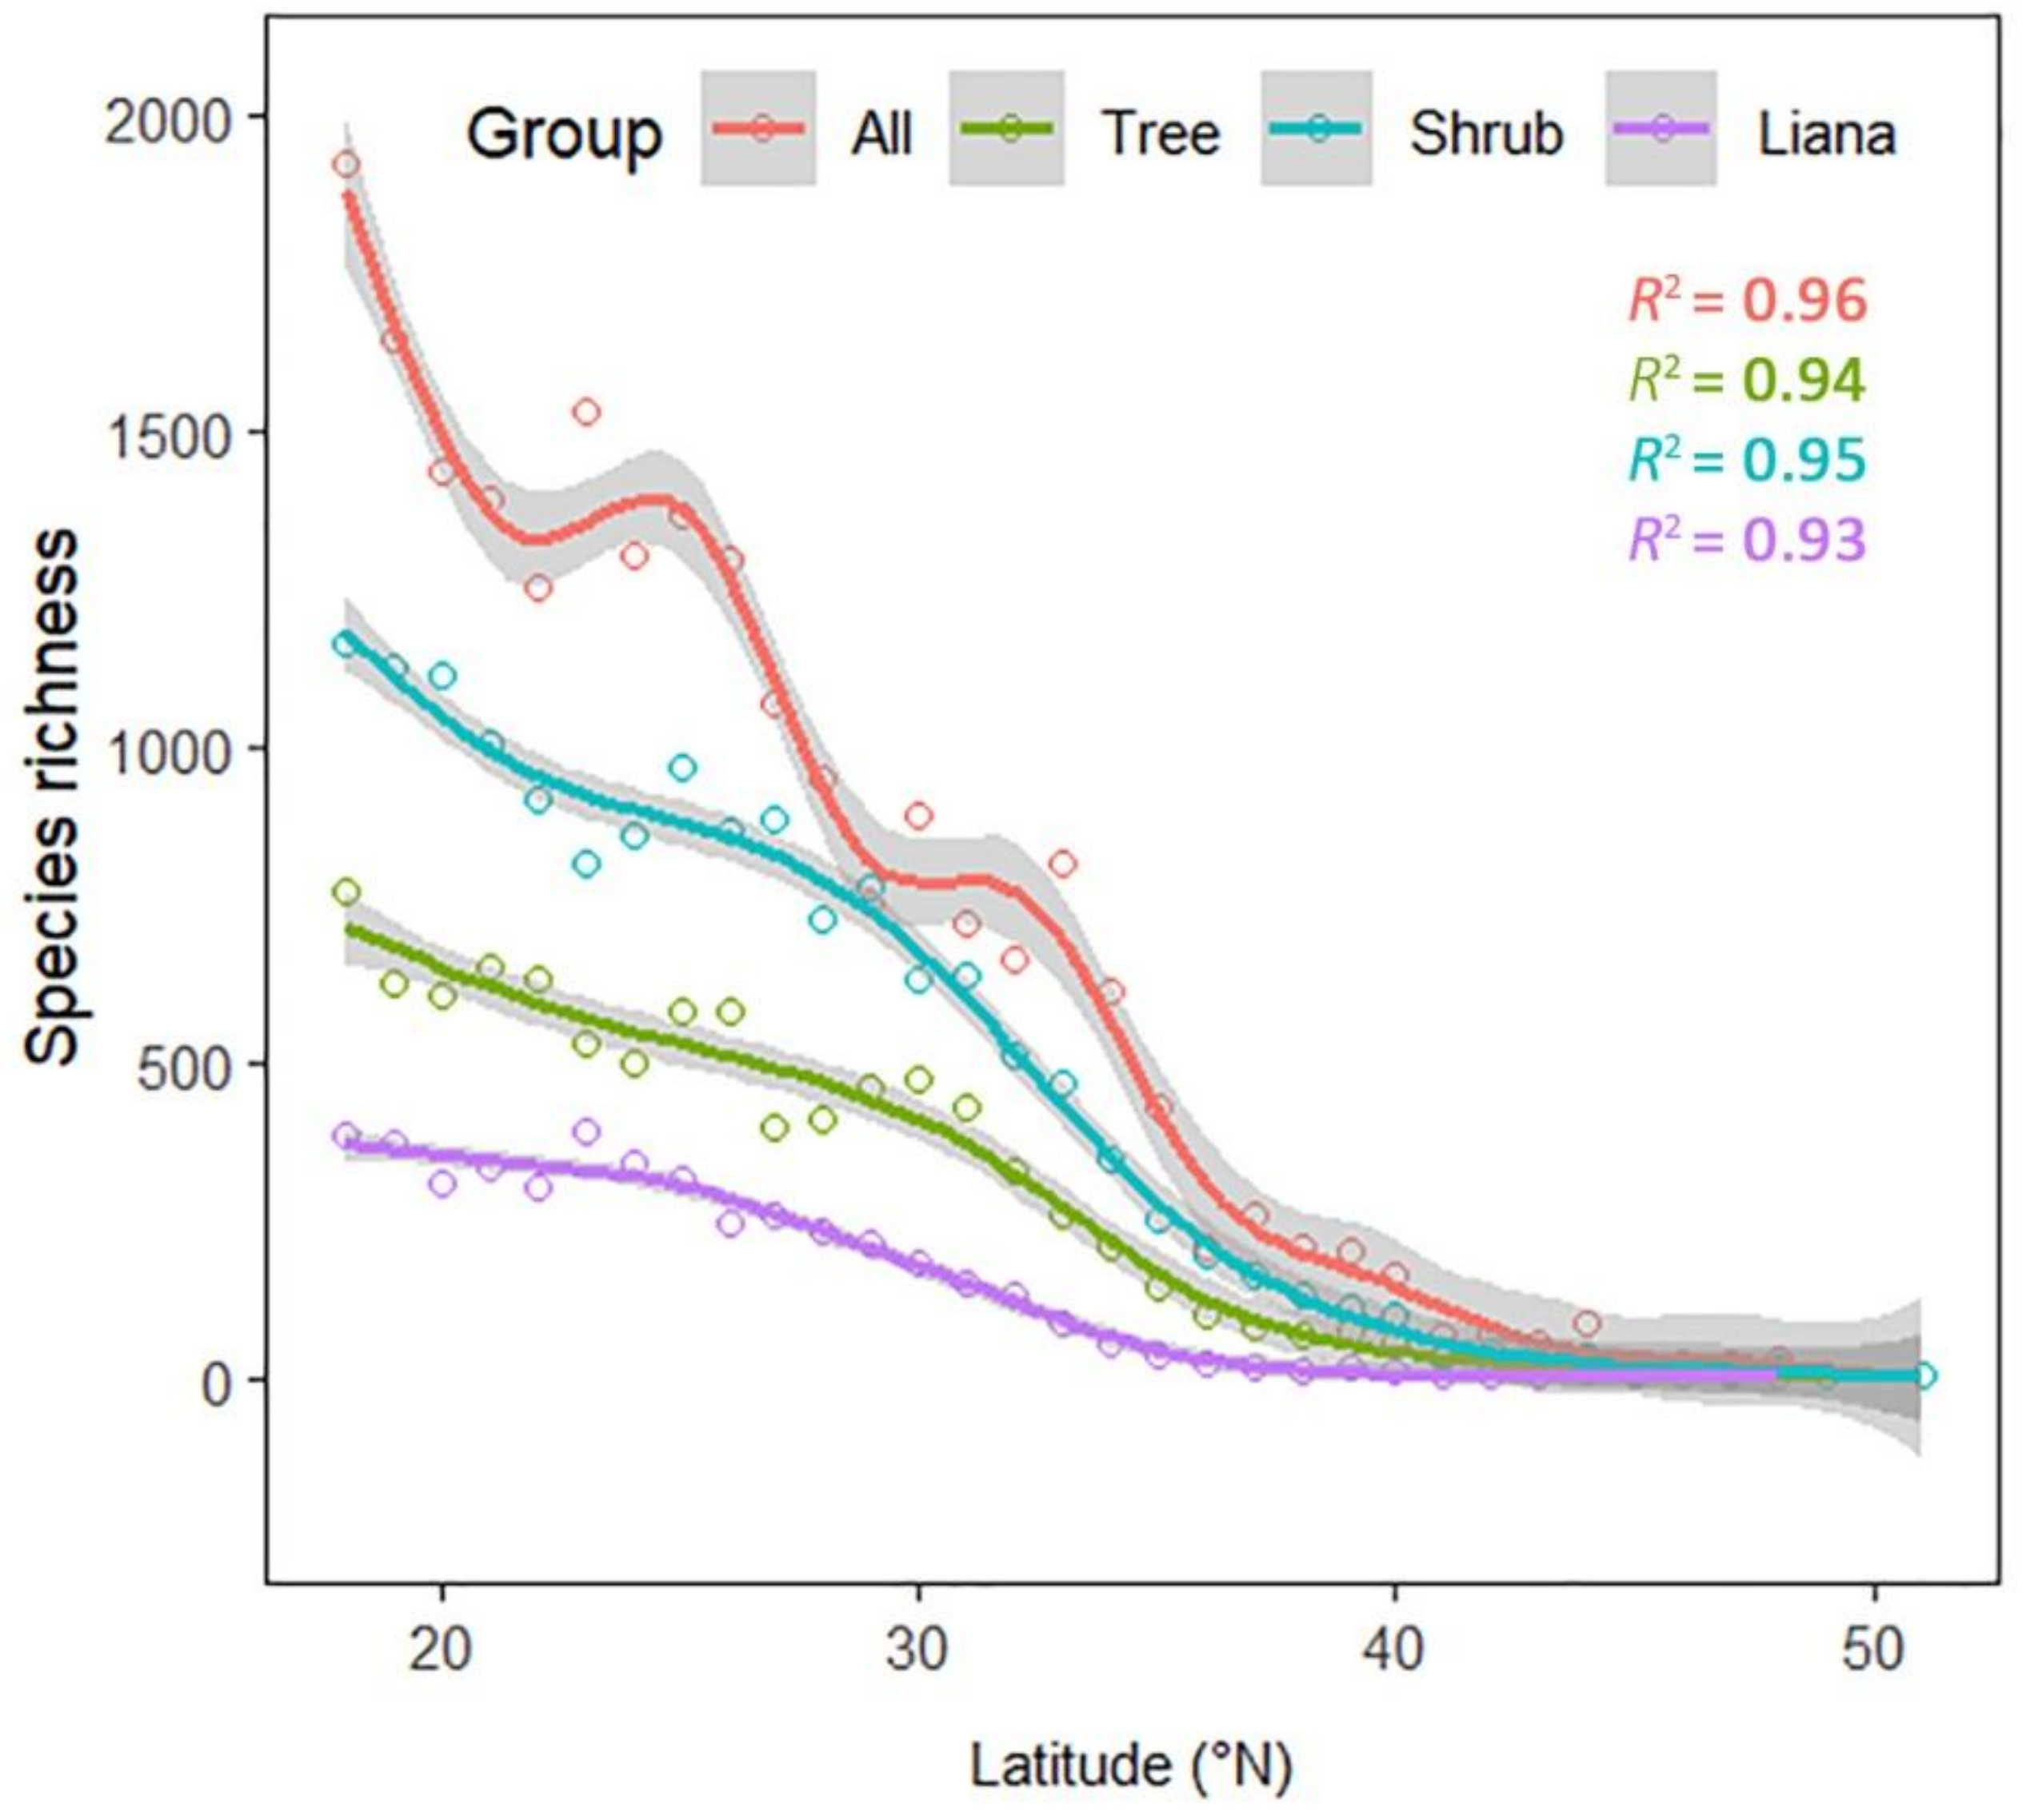
3. Results
4. Discussion
5. Conclusions
Supplementary Materials
Author Contributions
Funding
Acknowledgments
Conflicts of Interest
References
- Peña, R.; Schleuning, M.; Donoso, I.; Rodríguez-Pérez, J.; Dalerum, F.; García, D. Biodiversity components mediate the response to forest loss and the effect on ecological processes of plant–frugivore assemblages. Funct. Ecol. 2020. [Google Scholar] [CrossRef]
- Zuo, Y.; Kurenshchikov, D.K.; Yu, J.; Zou, Y.; Wang, Y.; Wang, Y.; Shi, J. Microsatellite and morphological analyses reveal unexpected diversity in Lymantria dispar in China. Forests 2019, 10, 1100. [Google Scholar] [CrossRef]
- Myers, N.; Mittermeier, R.A.; Mittermeier, C.G.; Fonseca, G.A.B.D.; Kent, J. Biodiversity hotspot for conservation priorities. Nature 2000, 403, 853–858. [Google Scholar] [CrossRef] [PubMed]
- Alahuhta, J.; Antikainen, H.; Hjort, J.; Helm, A.; Heino, J. Current climate overrides historical effects on species richness and range size of freshwater plants in Europe and north America. J. Ecol. 2020, 108. [Google Scholar] [CrossRef]
- Cardillo, M.; Dinnage, R.; Mcalister, W. The relationship between environmental niche breadth and geographic range size across plant species. J. Biogeogr. 2019, 46. [Google Scholar] [CrossRef]
- Silveira, F.A.O.; Negreiros, D.; Barbosa, N.P.U.; Buisson, E.; Carmo, F.F.; Carstensen, D.W.; Conceição, A.A.; Cornelissen, T.G.; Echternacht, L.; Fernandes, G.W.; et al. Ecology and evolution of plant diversity in the endangered campo rupestre: A neglected conservation priority. Plant Soil 2016, 403, 129–152. [Google Scholar] [CrossRef]
- De Albuquerque, F.S.; Castrodíez, P.; Rueda, M.; Hawkins, B.A.; Rodríguez, M.Á. Relationships of climate, residence time, and biogeographical origin with the range sizes and species richness patterns of exotic plants in great Britain. Plant Ecol. 2011, 212, 1901. [Google Scholar] [CrossRef]
- Cadotte, M.W.; Davies, T.J.; Regetz, J.; Kembel, S.W.; Cleland, E.; Oakley, T.H. Phylogenetic diversity metrics for ecological communities: Integrating species richness, abundance and evolutionary history. Ecol. Lett. 2010, 13, 96–105. [Google Scholar] [CrossRef]
- Wu, L.; Sun, Q.; Desmeth, P.; Sugawara, H.; Xu, Z.; Mccluskey, K.; Smith, D.; Alexander, V.; Lima, N.; Ohkuma, M. World data centre for microorganisms: An information infrastructure to explore and utilize preserved microbial strains worldwide. Nucleic Acids Res. 2017, 45, D611. [Google Scholar] [CrossRef]
- Fahimipour, A.K.; Kardish, M.R.; Lang, J.M.; Green, J.L.; Eisen, J.A.; Stachowicz, J.J. Global-scale structure of the Eelgrass microbiome. Appl. Environ. Microbiol. 2017, 83. [Google Scholar] [CrossRef]
- Alberti, M.; Correa, C.; Marzluff, J.M.; Hendry, A.P.; Palkovacs, E.P.; Gotanda, K.M.; Hunt, V.M.; Apgar, T.M.; Zhou, Y. Global urban signatures of phenotypic change in animal and plant populations. Proc. Natl. Acad. Sci. USA 2017, 114, 8951. [Google Scholar] [CrossRef] [PubMed]
- Enquist, B.; Feng, X.; Boyle, B.; Maitner, B.; Newman, E.; Jørgensen, P.; Roehrdanz, P.; Thiers, B.; Burger, J.; Corlett, R.; et al. The commonness of rarity: Global and future distribution of rarity across land plants. Sci. Adv. 2019, 5, eaaz0414. [Google Scholar] [CrossRef] [PubMed]
- Fordham, D.A.; Akçakaya, H.R.; Araújo, M.B.; Elith, J.; Keith, D.A.; Pearson, R.; Auld, T.D.; Mellin, C.; Morgan, J.W.; Regan, T.J. Plant extinction risk under climate change: Are forecast range shifts alone a good indicator of species vulnerability to global warming? Glob. Chang. Biol. 2012, 18, 1357–1371. [Google Scholar] [CrossRef]
- Huang, J.H.; Ma, K.P.; Chen, B. Diversity and Geographical Distribution of Endemic Seed Plants in China; Higher Education Press: Beijing, China, 2014. [Google Scholar]
- Xu, W.; Svenning, J.C.; Chen, G.; Chen, B.; Huang, J.; Ma, K. Plant geographical range size and climate stability in China: Growth form matters. Glob. Ecol. Biogeogr. 2018, 27, 506–517. [Google Scholar] [CrossRef]
- Pimm, S.L.; Jenkins, C.N.; Abell, R.; Brooks, T.M.; Gittleman, J.L.; Joppa, L.N.; Raven, P.H.; Roberts, C.M.; Sexton, J.O. The biodiversity of species and their rates of extinction, distribution, and protection. Science 2014, 344, 1246752. [Google Scholar] [CrossRef]
- Stevens, G.C. The latitudinal gradient in geographical range: How so many species coexist in the tropics. Am. Nat. 1989, 133, 240–256. [Google Scholar] [CrossRef]
- Treurnicht, M.; Pagel, J.; Esler, K.J.; Schutte-Vlok, A.L.; Nottebrock, H.; Kraaij, T.; Rebelo, A.G.; Schurr, F.M. Environmental drivers of demographic variation across the global geographical range of 26 plant species. J. Ecol. 2016, 104, 331–342. [Google Scholar] [CrossRef]
- Rapoport, E.H. Areografía: Estrategias Geográficas de Las Especies; Fondo de Cultura Económica: Mexico City, Mexico, 1975. [Google Scholar]
- Stevens, G.C. The elevational gradient in altitudinal range: An extension of Rapoport’s latitudinal rule to altitude. Am. Nat. 1992, 140, 893. [Google Scholar] [CrossRef]
- Böhm, M.; Kemp, R.; Williams, R.; Davidson, A.D.; Garcia, A.; Mcmillan, K.M.; Bramhall, H.R.; Collen, B. Rapoport’s rule and determinants of species range size in snakes. Divers. Distrib. 2017, 23, 1472–1481. [Google Scholar] [CrossRef]
- Dyer, E.E.; Redding, D.W.; Cassey, P.; Collen, B.; Blackburn, T.M. Evidence for Rapoport’s rule and latitudinal patterns in the global distribution and diversity of alien bird species. J. Biogeogr. 2020, 47, 1362–1372. [Google Scholar] [CrossRef]
- Price, F.P.W. Biogeographical gradients in galling species richness. Oecologia 1988, 76, 161–167. [Google Scholar] [CrossRef]
- Rohde, K. Latitudinal gradients in species diversity: The search for the primary cause. Oikos 1992, 65, 514–527. [Google Scholar] [CrossRef]
- Rohde, K. Rapoport’s rule is a local phenomenon and cannot explain latitudinal gradients in species diversity. Biodivers. Lett. 1996, 3, 10–13. [Google Scholar] [CrossRef]
- Ding, T.; Yuan, H.; Geng, S.; Koh, C.N.; Lee, P.F. Macro-scale bird species richness patterns of the east Asian mainland and islands: Energy, area and isolation. J. Biogeogr. 2006, 33, 683–693. [Google Scholar] [CrossRef]
- Bernhard, H. Latitudinal and altitudinal diversity patterns and Rapoport effects in north-west European land snails and their causes. Biol. J. Linn. Soc. 2006, 87, 309–323. [Google Scholar] [CrossRef]
- Pintor, A.F.V.; Schwarzkopf, L.; Krockenberger, A.K. Rapoport’s rule: Do climatic variability gradients shape range extent? Ecol. Monogr. 2016, 85, 643–659. [Google Scholar] [CrossRef]
- Huang, J.; Huang, J.; Liu, C.; Zhang, J.; Lu, X.; Ma, K. Diversity hotspots and conservation gaps for the Chinese endemic seed flora. Biol. Conserv. 2016, 198, 104–112. [Google Scholar] [CrossRef]
- Ying, J.; Chen, M. Chinese Botanical Geography; Shanghai Science and Technology Press: Shanghai, China, 2011. [Google Scholar]
- Liu, X.; Ma, K. Plant functional traits-concepts, applications and future directions. Sci. Sin. Vitae 2015, 45, 325–339. [Google Scholar] [CrossRef]
- Zuo, J.; Fu, D. Advance on endemics in floristics—Concept, type, origination and studied significance. J. Hunan Environ. Biol. Polytech. 2003, 9, 11–20. [Google Scholar] [CrossRef]
- Huang, J.; Chen, B.; Liu, C.; Lai, J.; Zhang, J.; Ma, K. Identifying hotspots of endemic woody seed plant diversity in China. Divers. Distrib. 2012, 18, 673–688. [Google Scholar] [CrossRef]
- Pagel, M.D.; May, R.M.; Collie, A.R. Ecological aspects of the geographical distribution and diversity of mammalian species. Am. Nat. 1991, 137, 791–815. [Google Scholar] [CrossRef]
- Rohde, K.; Heap, M.; Heap, D. Rapoport’s rule does not apply to marine teleosts and cannot explain latitudinal gradients in species richness. Am. Nat. 1993, 142, 1–16. [Google Scholar] [CrossRef]
- Letcher, A.J.; Harvey, P.H. Variation in geographical range size among mammals of the Palearctic. Am. Nat. 1994, 144, 30–42. [Google Scholar] [CrossRef]
- Wood, S.N. Stable and efficient multiple smoothing parameter estimation for generalized additive models. J. Am. Stat. Assoc. 2004, 99, 673–686. [Google Scholar] [CrossRef]
- R Core Team. R: A Language and Environment for Statistical Computing; R Foundation for Statistical Computing: Vienna, Austria, 2019. [Google Scholar]
- Luo, Z.; Tang, S.; Li, C.; Chen, J.; Fang, H.; Jiang, Z. Do Rapoport’s rule, mid-domain effect or environmental factors predict latitudinal range size patterns of terrestrial mammals in China? PLoS ONE 2011, 6, e27975. [Google Scholar] [CrossRef]
- Roy, K.; Jablonski, D.; Valentine, J.W. Eastern Pacific molluscan provinces and latitudinal diversity gradient: No evidence for “Rapoport’s rule”. Proc. Natl. Acad. Sci. USA 1994, 91, 8871–8874. [Google Scholar] [CrossRef]
- Cardillo, M. The life-history basis of latitudinal diversity gradients: How do species traits vary from the poles to the equator? J. Anim. Ecol. 2002, 71, 79–87. [Google Scholar] [CrossRef]
- Tomasovych, A.; Kennedy, J.D.; Betzner, T.J.; Kuehnle, N.B.; Edie, S.; Kim, S.; Supriya, K.; White, A.E.; Rahbek, C.; Huang, S. Unifying latitudinal gradients in range size and richness across marine and terrestrial systems. Proc. Biol. Sci. 2016, 283, 20153027. [Google Scholar] [CrossRef]
- Hewitt, G. The genetic legacy of the quaternary ice ages. Nature 2000, 405, 907. [Google Scholar] [CrossRef]
- Addo-Fordjour, P.; Anning, A.K.; Larbi, J.A.; Akyeampong, S. Liana species richness, abundance and relationship with trees in the Bobiri forest reserve, Ghana: Impact of management systems. For. Ecol. Manag. 2009, 257, 1822–1828. [Google Scholar] [CrossRef]
- Van Der Heijden, G.M.F.; Phillips, O.L. Environmental effects on neotropical liana species richness. J. Biogeogr. 2009, 36, 1561–1572. [Google Scholar] [CrossRef]
- Norris, K.; Terry, A.; Hansford, J.P.; Turvey, S.T. Biodiversity conservation and the earth system: Mind the gap. Trends Ecol. Evol. 2020. [Google Scholar] [CrossRef] [PubMed]
- Peñuelas, J.; Sardans, J.; Filella, I.; Estiarte, M.; Llusià, J.; Ogaya, R.; Carnicer, J.; Bartrons, M.; Rivas-Ubach, A.; Grau, O.; et al. Impacts of global change on Mediterranean forests and their services. Forests 2017, 8, 463. [Google Scholar] [CrossRef]
- Urza, A.K.; Weisberg, P.J.; Chambers, J.C.; Sullivan, B.W. Shrub facilitation of tree establishment varies with ontogenetic stage across environmental gradients. New Phytol. 2019, 223, 1795–1808. [Google Scholar] [CrossRef] [PubMed]
- Stein, A.; Gerstner, K.; Kreft, H. Environmental heterogeneity as a universal driver of species richness across taxa, biomes and spatial scales. Ecol. Lett. 2014, 17, 866–880. [Google Scholar] [CrossRef]
- Li, J.; Liu, G.; Lu, Q.; Zhang, Y.; Li, G.; Du, S. Future climate change will have a positive effect on Populus davidiana in China. Forests 2019, 10, 1120. [Google Scholar] [CrossRef]


© 2020 by the authors. Licensee MDPI, Basel, Switzerland. This article is an open access article distributed under the terms and conditions of the Creative Commons Attribution (CC BY) license (http://creativecommons.org/licenses/by/4.0/).
Share and Cite
Liu, H.; Yu, R.; Huang, J.; Liu, Y.; Zang, R.; Guo, Z.; Ding, Y.; Lu, X.; Li, Q.; Chen, H.Y.H. Latitudinal Diversity Gradients and Rapoport Effects in Chinese Endemic Woody Seed Plants. Forests 2020, 11, 1029. https://doi.org/10.3390/f11101029
Liu H, Yu R, Huang J, Liu Y, Zang R, Guo Z, Ding Y, Lu X, Li Q, Chen HYH. Latitudinal Diversity Gradients and Rapoport Effects in Chinese Endemic Woody Seed Plants. Forests. 2020; 11(10):1029. https://doi.org/10.3390/f11101029
Chicago/Turabian StyleLiu, Hua, Ruoyun Yu, Jihong Huang, Yibo Liu, Runguo Zang, Zhongjun Guo, Yi Ding, Xinghui Lu, Qian Li, and Han Y. H. Chen. 2020. "Latitudinal Diversity Gradients and Rapoport Effects in Chinese Endemic Woody Seed Plants" Forests 11, no. 10: 1029. https://doi.org/10.3390/f11101029
APA StyleLiu, H., Yu, R., Huang, J., Liu, Y., Zang, R., Guo, Z., Ding, Y., Lu, X., Li, Q., & Chen, H. Y. H. (2020). Latitudinal Diversity Gradients and Rapoport Effects in Chinese Endemic Woody Seed Plants. Forests, 11(10), 1029. https://doi.org/10.3390/f11101029