Article

Emission of Volatile Organic Compounds from Heartwood and Sapwood of Selected Coniferous Species

1
Environmental Protection and Wood Chemistry Department, Łukasiewicz Research Network-Wood Technology Institute, Winiarska 1, 60-654 Poznań, Poland
2
Department of Furniture Design, Faculty of Wood Technology, Poznan University of Life Sciences, Wojska Polskiego 38/42, 60-627 Poznań, Poland
3
Department of Wood Science, Faculty of Wood Technology, Poznan University of Life Sciences, Wojska Polskiego 38/42, 60-627 Poznań, Poland
*
Author to whom correspondence should be addressed.
Forests 2020, 11(1), 92; https://doi.org/10.3390/f11010092
Submission received: 22 November 2019 / Revised: 7 January 2020 / Accepted: 7 January 2020 / Published: 11 January 2020
(This article belongs to the Section Forest Ecophysiology and Biology)

Abstract

:
The qualitative and quantitative composition of volatile organic compounds (VOC) emitted from furnishings from solid wood and all kinds of wood derivative materials depends on many factors, of which the most important is the wood species. The intraspecies and interspecies differences in VOC emission result from the differences in the chemical composition and anatomical structure of heartwood and sapwood of different species. VOC composition analysis was performed separately for heartwood and sapwood of Scots pine (Pinus sylvestris L.), Norway spruce (Picea abies (L.) Karst.) and European larch (Larix decidua Mill.) trees. The studies were conducted in a glass climatic chamber of 0.025 m3, equipped with a system for the monitoring and control of climatic conditions. Samples of air for analyses were collected after 3, 7, 14 and 28 days of exposure. The results provided evidence for interspecies and intraspecies differences in the qualitative and quantitative compositions of VOC. The concentration of total VOC (TVOC) released from heartwood of Scots pine was higher than that released from sapwood. For European larch and Norway spruce, the opposite relations were observed. The VOC emission from Scots pine heartwood was about 17 times higher than the emission from European larch and Norway spruce heartwood. The differences in TVOC emitted from the sapwood of samples from different species were smaller. For each of the species, the highest percentage contribution to TVOC was made by terpenes. The second highest percentage contribution in TVOC was made by compounds containing a carbonyl group, mainly aldehydes, while aromatic compounds made the third highest contribution.

1. Introduction

Indoor air contains a broad spectrum of various pollutants, which have a significant influence on the comfort and health of people staying indoors [1,2,3,4,5]. The low quality of indoor air is due to, inter alia, the emissions of volatile organic compounds (VOC) from wooden elements of indoor furnishings [6,7,8,9,10,11,12,13]. These compounds account for 60% of all substances polluting the atmosphere and 73% of all compounds mentioned in the Toxic Release Inventory [14,15,16].
Wood is a basic material for the production of furniture, floors, stairs and many other elements of furnishing. It can be used in the form of solid wood or various types of wood-based boards. The quality and quantity composition of VOC released from wood products depends on many factors, but wood species is the deciding one [17]. The interspecies diversity of VOC emission is a result of the differences in the chemical composition and the anatomy of softwood and hardwood species [18,19,20]. Some softwood species contain resin ducts, where significant amounts of natural resin, which is the source of VOC (e.g., terpenes), are produced [21,22,23,24]. The interspecies as well as the intraspecies diversity of VOC emission also results from the presence of heartwood in some species. In the group of softwood species, there are species with colored and uncolored heartwood, while in the group of hardwood species, there are both heartwood species and non-heartwood species. In the process of heartwood formation, the matter of living parenchymal cells undergoes biochemical changes, and cell walls are saturated with newly formed chemical compounds called heartwood substances. These are resin substances, tannins, dyes, etc., which also fill in the gaps between fibrils and the inside of adjacent dead cells [19,25,26]. The extraneous components and heartwood substances are the main source of VOC emission from wood; however, their qualitative–quantitative composition differs within the heartwood and sapwood zones. The fresh wood is characterized by a richness of volatile compounds, whereas, after only first dry cycle, wood emits a more restricted group of compounds [27,28].
Tests of VOC emission from wood and composite wood materials are most often based on a comparison of the qualitative–quantitative composition of air sampled from the test chambers after various times of sample exposure [29,30,31,32,33]. The subject literature is more abundant in studies devoted to the research of VOC emission from composite wood materials than those concerning emission from solid wood, which is a “base” raw material intended for further processing. It is difficult to estimate the quantity of VOC emission from wood-based panels due to the diversity of VOC originating from different wood species, which can be the raw material for the production of wood-based boards [34,35,36,37,38]. Baumann et al. [31,35] observed a close interrelation between the quantity of VOC emission from wood-based panels (particleboards and medium-density fiberboards (MDFs)) and the wood species used for their production and the type of wood-based materials. Similar observations were made by Makowski and Ohlmeyer [39], who studied the influence of different wood species on VOC emission from oriented strand boards (OSB) [40,41,42]. A significant change in the emission of volatile organic compounds was observed in the case of thermally modified solid wood compared to unmodified wood [43,44,45,46]. The quantitative composition of VOC emissions also depends on the geographical region from which the trees originated [47,48]. The research of Larsen et al. [49] suggests that emissions from Scots pine (Pinus sylvestris L.) originating from different regions of Finland and Sweden were dominated either by terpenes or aldehydes, depending on the place of harvesting. Similar observations were made by Manninen et al. [44] in a study which suggested that Scots pine wood originating from the south of Finland emitted more of one of the terpenes (3-carene) and several times lower amounts of alcohols compared to pine from the southeast.
The results of the above-mentioned studies indicate that there is a need for research on the interspecies diversity of the volume of VOC emissions from fresh wood. As far as the authors are concerned, the subject literature lacks data regarding the quality–quantity composition of VOC emitted from the heartwood and sapwood zones determined on the cross-section of trees originating from the same geographical region. In this experiment, the VOC emission of Scots pine, Norway spruce and European larch wood are measured. This will be of great guiding significance when choosing species of wood for the production of wood-based boards, the furniture industry and the production of many elements of interior furnishings.

2. Materials and Methods

The material used for testing was wood from the Norway spruce (Picea abies (L.) Karst.), Scots pine (Pinus sylvestris L.) and European larch (Larix decidua Mill.). The tests were carried out on wood from the class of dominant trees at an age of 104–106 years, from a stand growing in a habitat of mixed fresh forest. The stand was located in the forest division of Łopuchówko, a commune of Murowana Goślina (in Poland; 52°26′ N; 16°43′ E). Three trees from each species of the class of dominant trees were chosen for the investigations. Next, approximately 5 cm thick test discs were cut out at the diameter at breast height, wrapped in aluminum foil and delivered to the test laboratory, and kept refrigerated (2–4 °C) until measurements. Afterwards, the test samples were cut from these discs, from the sapwood and heartwood part of the cross-section. The dimensions of the samples were selected so that the total surface area of the cross-section planes exposed in a test chamber was 0.025 m2 (test chamber loading factor 1 m2/m3). The assumption was that only the emission of volatile organic compounds from the cross section would be determined; therefore, the other surfaces (radial and tangential) of the samples were sealed with aluminum-coated adhesive tape (3M ™ Aluminum Foil Tape 425 St Paul, MN, USA), in order to avoid edge effects. The fresh wood moisture content before the emission test started ranged between 40% and 60%. All determinations of VOC emission from the tested materials were performed by the chamber method according to ISO 16000-6 [50] and ISO 16000-9 [51]. The glass test chamber with a volume of 0.025 m3 was equipped with suitable accessories such as inlet and outlet ports for airflow and an inlet port for temperature/humidity measurements. The chamber was placed in an air-conditioned room with a steady temperature of 24 °C. All experiments were carried out under the following conditions: temperature: 23 ± 2 °C, relative humidity: 45 ± 5%, air exchange rate: 1 h−1.
The samples of wood remained inside the chamber for the whole duration of the testing periods of 28 days. Air chamber samples were collected after 3, 7, 14 and 28 days with glass sorbent tubes. Tenax TA tubes (L × R = 89 mm × 3.2 mm; Perkin Elmer, Inc. Waltham, MA, USA) were packed with combination of Tenax TA and Carbopack X (with 200 mg fillers; Supelco/Sigma-Aldrich, Bellefonte, PA, USA). Tubes were conditioned at 260 °C for 5 h and exposed to the flow of helium at 15 mL min−1 before they were used in the experiment. The analysis was carried out using the gas chromatography/mass spectrometry (GC/MS) system (Thermoquest Finnigan Austin, TX, USA) coupled with a thermal desorption unit (Master TD made by DANI Instruments SpA, Monza, ITALY), according to ISO 16000-6 under the following conditions: injector temperature and adsorption trap: 280 °C; analysis of the temperature profile: first kept at 35 °C for 4 min, then increased by 5 °C/min to 140 °C and then further increased by 12 °C/min to 240 °C and held at this temperature for 3 min; type of carrier gas: helium at 99.996% purity; flow rate: 1 cm3/min; temperature of the emission source: 220 °C; electron ionization: 70 eV; range of mass analyzed: 35–550 amu; scanning frequency: 1 s; chromatographic column: RTX-VMS (30 m × 2.5 mm × 1.4 µm). Air from the chamber was taken with a portable pump FLEC AIR PUMP 1001 (Markes International Ltd., Llantrisant, UK). The sampling flow rate was set at 100 mL min−1. Two liters of air were collected during 20 min of sampling. Immediately after a collection of the chemical compounds adsorbed on traps, they were thermally desorbed on-line into the chromatographic column.
The content of volatile organic compounds was expressed as TVOC sum on the basis of chromatographic standard calibration curves and due toluene equivalents. The target compounds were identified using the National Institute of Standard Technology Mass Spectral (NIST MS) library and an in-house database of the GC retention times for the compounds. The concentration of selected individual VOCs was calculated based on standard curves. Other compounds emitted from wood were quantified by the response factor of toluene and expressed as toluene equivalents (TE). The results were analyzed by a single-factor analysis of variance (ANOVA) using the program STATISTICA 13.0 PL. Tests were carried out for a significance level of p < 0.05.

3. Results and Discussion

During the exposure of the samples in a test chamber, the VOC emissions differed in terms of quantity and quality between the studied species and also within them (depending on the cross-section zone). The concentrations of volatile organic compounds emitted from heartwood and sapwood part of Scots pine, European larch and Norway spruce wood after 3 and 28 days of exposure of samples are presented in Table 1.
Altogether 25 individual volatile compounds were identified in the collected air samples. Only 11 of them were found in the VOC emission from heartwood and 12 from sapwood of Norway spruce wood, while 14 and 13 compounds were found in the VOC emission from the heartwood and sapwood of European larch wood, respectively. The largest number of volatile compounds was identified in Scots pine wood (18 from heartwood and 21 from sapwood).
The TVOC concentration after the first 3 days of exposure in the chamber was at a level of 12,975 µg/m3 in the case of Scots pine heartwood and 1582 µg/m3 in the case of sapwood; thus, there was a greater than eight-fold difference in the emission volumes between the two zones (Figure 1a). After 28 days, TVOC concentration decreased to 3656 µg/m3 for the heartwood part and to 631 µg/m3 for the sapwood part, and the ratio of concentrations remained high (almost 6:1). Like Scots pine, European larch has colored heartwood, but the results of TVOC concentrations obtained for the determined zones of the cross-section were opposite to those of Scots pine. European larch wood was characterized by a higher VOC emission from the sapwood zone of the cross-section than from the heartwood zone (Figure 1b). On day 3 of exposure of the samples in the test chamber, the values of TVOC concentrations were at a level of 1348 µg/m3 for sapwood and 833 µg/m3 for heartwood, while on day 28, these values were 633 µg/m3 and 238 µg/m3, respectively. Therefore, one may observe that the differential of TVOC emission volumes, expressed as a relation of concentrations obtained from both zones of the cross-section, was smaller than in the case of Scots pine; i.e., the concentrations differed 1.6-fold after 3 days and 2.6-fold after 28 days. On the other hand, Norway spruce is a species with uncolored heartwood, yet, like European larch, it was characterized by higher VOC emissions from sapwood compared to heartwood (Figure 1c). On day 3 of exposure of the samples in the test chamber, the TVOC concentration was 2.5 times higher for sapwood than for heartwood and equaled 1746 µg/m3 and 686 µg/m3, respectively. After 28 days, the differential between TVOC concentrations obtained for the two zones of the Norway spruce cross-section was almost identical to that observed at the beginning of the test; i.e., the concentrations differed 2.3-fold. These interrelations are described by the regression equations y = a ln(x) + b, where the coefficient of determination (R2) for the analyzed species ranged from R2 = 0.808 to R2 = 0.983.
Roffael [28] also indicated that in pine wood, the emissions of terpenes from the heartwood zone of the trunk are several times higher than those from the sapwood zone, while in Norway spruce wood, the emissions from these zones of the cross-section are the opposite. Higher emissions of VOC from Norway spruce sapwood, compared to heartwood, were also observed by Steckel et al. [52]. After 3 days of exposure, the emissions differed four-fold, and after 28 days, they differed 2.6 fold; however, these emission levels were much lower than those observed in the present study, probably owing to the fact that we analyzed TVOC from fresh wood, while the cited authors, in their study, used wood which had been convectively dried in a dryer.
On comparing the values of TVOC concentrations obtained only for the heartwood zone of individual species, it was observed that the highest VOC emission was characteristic of Scots pine wood. Irrespective of the exposure time, the VOC emission from the zone of the Scots pine cross-section was approximately 17 times higher compared to European larch and Norway spruce. On the other hand, VOC emissions from the heartwood of European larch and Norway spruce were similar in terms of quantity, because for those species, the quotient of their TVOC concentrations decreased from 1.2 (day 3) to 1.1 (day 28) over successive exposure periods.
No such large differential between TVOC values obtained for Scots pine and the other species was observed in the case of sapwood zones. After 3 days of exposure, the highest concentration of TVOC was observed for Norway spruce sapwood (1746 µg/m3), and this was 1.1 times higher than that observed for Scots pine and 1.3 times higher than for European larch. In successive periods of exposure, VOC emissions from the sapwood of the studied species did not differ significantly between each other in terms of quantity. After day 28, the TVOC concentration for the sapwood of Scots pine and European larch was only 1.2 times higher than that for Norway spruce. Although the dynamics of TVOC concentration decrease changed by various degrees for the studied species during exposure, the relative final values after 28 days of exposure were similar. For samples obtained from heartwood, the average TVOC concentration decrease was approximately 70% (from 67% for Norway spruce to 72% for Scots pine and European larch) in relation to the concentration observed on day 3 of exposure. For the sapwood zone, the TVOC concentration decreased by 53% for European larch, 60% for Scots pine, and 70% for Norway spruce over the compared exposure time.
Hyttinen et al. [37] demonstrated slightly smaller drops in TVOC concentrations for Scots pine and Norway spruce in the case of samples taken directly from the normal manufacturing process (before thermal modification). The samples were characterized by a TVOC concentration at a level of 2000 µg/m2 × h for Scots pine and 550 µg/m2 × h for Norway spruce (after 3 days), which then decreased approximately by 50% and 60%, respectively, after 28 days of exposure. The studies of Dix et al. [53] and Roffael [28] encourage similar observations.
The performed ANOVA suggests that, for the studied species, the differences between TVOC concentrations in individual exposure periods were statistically significant for the heartwood zones and insignificant for sapwood. The value of the calculated test statistic F was 23.3887 for heartwood and 0.2676 for sapwood, while the critical value was F(3;8;0.05) = 4.0662 (Table 2).
The interspecies differences in TVOC concentrations observed for heartwood were confirmed by the results of the performed ANOVA, which suggest that the differences in the concentrations were statistically significant for heartwood and insignificant for sapwood, because the value of the test statistic F equaled 15.9292 for heartwood and 0.0011 for sapwood (Figure 2). The calculated critical value was F(2;9;0.05) = 4.2565.
The identified VOCs were divided into monoterpenes, compounds with carbonyl group (aldehydes and ketones), aromatic and aliphatic compounds, and alcohols (Table 3, Table 4 and Table 5). Values in Table 3, Table 4 and Table 5 were averages of three replicates.
For each of the species, the highest percentage contribution to TVOC was made by terpenes, which are a dominant group of compounds emitted from softwood trees. The source of monoterpenes is the considerable amount of natural resin found in the studied species, which are resiniferous. Softwood contains terpenes from mono to tetraterpenes—except sesquiterpenes, which are rare [18,32,54]. Terpenes are the source of primary emission, as those compounds are emitted directly from wood [55]. Other VOCs, such as aldehydes, are formed as a result of the oxidation of unsaturated fatty acids; e.g., hexanal, which is the main product of linoleic acid oxidation [22,28,56]. The interspecies comparison of the concentrations of terpenes emitted from the heartwood zone throughout the studied periods suggests that they reflect TVOC concentrations for individual species. Terpenes accounted for the highest percentage of TVOC, which was on average approximately 99% for Scots pine heartwood, approximately 64% for European larch heartwood, and approximately 81% for Norway spruce heartwood, throughout the 28 day exposure period. According to Manninen et al. [44], the emissions of terpenes from Scots pine originating from Finland, irrespective of geographical region, ranged from 77% to 66% of TVOC (Scots pine from the south and the southeast).
The emission of terpenes from Scots pine heartwood was approximately 20 times higher compared to the emission from the heartwood of European larch and Norway spruce. On the other hand, the quantities of terpene emission from the two latter species were very similar: the ratio of concentrations was 1.3:1. For the sapwood zone, the percentage of terpenes within the TVOC of a given species was slightly different than in the case of heartwood. The lowest percentage was observed for Scots pine—i.e., 55% of TVOC—while the values for European larch and Norway spruce were similar—i.e., 83% and 88% of TVOC, respectively. Analyses of the sapwood zone of the cross-section revealed that the highest emissions of terpenes were observed for Norway spruce wood during the first days of exposure (1539 µg/m3 after day 3). These emissions were as little as 1.3 times higher than those observed for European larch (1171 µg/m3) and 1.8 times higher than those observed for Scots pine (875 µg/m3). Although the analyzed emissions decreased after 28 days, the interspecies differential of terpene concentrations remained insignificant, ranging from 1.2- to 1.5-fold. According to Strömvall and Petersson [57] Scots pine emits many times more terpenes compared to Norway spruce; however, these authors considered the emission from the entire cross-section of the trunk of both species. The division of the cross-section into the heartwood and sapwood zones, which was employed in this study, helped prove that the above-mentioned relationship is only true for heartwood.
The high emission of terpenes from softwood species was also reported by Risholm-Sundman et al. [17] and McDonaldson et al. [58], Englund and Nussbaum [45] and Jensen et al. [10].
On analyzing the difference in the quantity of terpene emission from the heartwood and sapwood zones, the authors observed that, after 3 days of exposure in the chamber, the terpene emission from the heartwood zone of Scots pine wood was almost 15 times higher than that from the sapwood zone; i.e., the emissions equaled 12,776 µg/m3 and 875 µg/m3, respectively. Throughout 28 days, the emissions decreased, but the ratio of concentrations of terpenes emitted from the two zones in the chamber air remained high; i.e., around 10:1. Terpene emission from European larch wood was nothing like that in the case of Scots pine, because the terpene emissions of the sapwood zone were higher than those of the heartwood zone. For example, after 3 days of exposure, the terpene concentration in the chamber reached 1171 µg/m3 for sapwood and 648 µg/m3 for heartwood, while after 28 days, the concentrations were 552 µg/m3 and 160 µg/m3, respectively. The differential of terpene emission quantity between the determined zones of the cross-section was lower than that for Scots pine, because after 3 days it was 1.8-fold and after 28 days it was 3.5-fold.
As in the case of European larch, higher terpene concentrations in the chamber air were observed during the tests of a Norway spruce sapwood sample. After 3 days, the terpene concentration was 1539 µg/m3, while for a heartwood sample it was three times lower (497 µg/m3). On successive days, until the end of the test (i.e., the 28th day), the ratio of concentrations of terpenes emitted from the two zones of the cross-section remained at a similar level; i.e., it was approximately two times higher for sapwood compared to heartwood. Similar values of concentrations of terpenes emitted from Norway spruce heartwood and sapwood after 3, 7, 14 and 28 days of exposure were observed by Steckel et al. [52]. After 3 days, terpene emission was approximately 2129 µg/m3 from Norway spruce sapwood and approximately 567 µg/m3 from heartwood, while only after 28 days did the emissions decrease to a level of approximately 524 µg/m3 and 219 µg/m3, respectively, for sapwood and heartwood.
In the subject literature, VOC emission from softwood is characterized primarily based on the concentration of monoterpenes and aldehydes; i.e., the compounds with the highest share within TVOC for this species group [10,18,59,60]. This study confirmed that the second identified group of compounds with a high percentage share within TVOC was composed of compounds with a carbonyl group, primarily aldehydes (Table 3, Table 4 and Table 5). In the case of Scots pine, sapwood was characterized by a higher emission of carbonyl compounds than that characteristic of heartwood. The percentage share of carbonyl compounds within TVOC (after 28 days) was 32% for the sapwood zone, and as low as 0.6% for the heartwood zone, while the difference between the concentrations of these two compounds emitted from both zones increased as time went on. On day 3 of the test, the emission level from the sapwood zone was three times higher (300 µg/m3 and 100 µg/m3) and on day 28 it was even 10 times higher (204 µg/m3 and 21 µg/m3) compared to that observed for the heartwood zone. According to Englund [61], the emission of compounds with a carbonyl group from Scots pine sapwood may be from 3 to 25 times higher compared to the emission of these compounds from heartwood. The analysis of the reduction dynamics of the emission of compounds with carbonyl group suggests that, throughout the exposure period, these emissions decreased by 79% for heartwood and 32% for sapwood.
In the case of European larch wood, more aldehydes were emitted from heartwood than from sapwood during the first days of exposure—i.e., 139 µg/m3 and 101 µg/m3, respectively—however, as time went on, those proportions reversed, starting from day 14. On day 7, an approximately 80% increase in the concentration of the analyzed compounds was observed for both heartwood and sapwood compared to the concentrations recorded on day 3. Starting from day 7 of exposure, the concentrations of these compounds in the chamber air decreased. On day 28 of exposure, the emission of carbonyl compounds decreased by 62% for heartwood and 33% for sapwood compared to day 3 of exposure.
On the other hand, in the case of Norway spruce, the concentrations of compounds with a carbonyl group were very similar for heartwood and sapwood and equaled approximately 90 µg/m3 during the first days of exposure in the chamber. After 28 days, the concentrations of these compounds in the chamber air decreased 23-fold for the heartwood zone and 2.5-fold for the sapwood zone. Despite some increase in the emission of carbonyl compounds from heartwood observed on day 14 compared to day 7, on the last day of exposure, the total decrease in concentration was 96% for the heartwood zone and 61% for the sapwood zone compared to the concentration values of day 3. In the case of Norway spruce, carbonyl compounds accounted for 1.8% of TVOC for heartwood and 6.6 % of TVOC for sapwood after 28 days of exposure.
In the evaluation of the interspecies differences in the concentration of compounds with a carbonyl group emitted from the heartwood zone, the highest values were observed for European larch, irrespective of the exposure time. For this species, the highest concentration of these compounds in the chamber air was observed after 7 days and equaled 248 µg/m3. After 21 days, the concentration dropped, and on day 28, it was 20% of the maximum value. Likewise, the final concentration (21 µg/m3) for Scots pine wood was 20% of the maximum value observed on day 3.
On analyzing the sapwood zone, it was found that Scots pine was characterized by the highest emission of compounds with a carbonyl group; i.e., from approximately 200 to 300 µg/m3, irrespective of the exposure time. During the exposure of a larch sapwood sample, concentrations of the tested compounds in the chamber ranged from 68 to 182 µg/m3, while in the case of Norway spruce, concentrations ranged from 35 to 89 µg/m3 during the exposure of samples. Concentrations of the analyzed compounds emitted from the sapwood of Scots pine and Norway spruce decreased regularly throughout the entire test period, and in the case of European larch, some increase in emission (up to 182 µg/m3) was observed on day 7 compared to day 3 (101 µg/m3).
On analyzing the reduction of emission of compounds with a carbonyl group from the heartwood of the studied species, it was found that, on day 28 of exposure of the samples in the chamber, the greatest drop in emission (i.e., of approximately 96%) was observed for Norway spruce wood; there was a smaller decrease for Scots pine wood (79%), and European larch wood showed the smallest decrease (62%) compared to the emission observed on day 3. As regards the sapwood zone of the studied species, the greatest drop in the emission of compounds with a carbonyl group (i.e., of approximately 60%) was observed in the analogical period for Norway spruce wood, while for the other two species the observed drop was smaller, at approximately 32%.
Among the compounds with a carbonyl group emitted from the studied species, aldehydes were the dominant group in terms of concentration volumes. According to literature sources, the presence of aldehydes in the chamber air during the tests of VOC emission from softwood species is a result of oxidation of unsaturated fatty acids, i.e., oleic acid, linoleic acid and linolenic acid [17,22,43,62,63,64]. According to Makowski and Ohlmeyer [32], in Scots pine wood, aldehydes are formed through the autoxidation of free unsaturated fatty acids contained in that species (mainly linoleic and oleic acid). These authors, on the basis of the phenomenon of unsaturated fatty acid oxidation, proved that aldehyde emissions might increase at first and then decrease as time goes on.
Aromatic compounds were another identified group of VOC, and more specifically the third in terms of the percentage share within TVOC (Table 3, Table 4 and Table 5). Scots pine emitted aromatic compounds throughout the entire test period, while emissions from the sapwood sample were more than two times higher compared to that from heartwood. On day 3, the concentrations of these compounds were 177 µg/m3 and 81 µg/m3, respectively, and on day 28 they were 40 µg/m3 and 19 µg/m3, respectively. Aromatic compounds emitted from the sapwood sample throughout the entire exposure time also constituted a considerably greater percentage share within TVOC of Scots pine; i.e., on average, approximately 11% compared to those emitted from heartwood, whose share was only 0.6%.
As regards European larch, the heartwood was characterized by a higher emission of aromatic compounds than the sapwood. Although on day 3 of exposure the amounts of compounds emitted from both zones of the cross-section were very similar (36 µg/m3 and 32 µg/m3), on successive days the difference in concentrations of the analyzed compounds emitted from the determined zones of the cross-section in the chamber air started to fluctuate, varying from 39 µg/m3 (day 7) to 1 µg/m3 (day 14). Throughout the entire period of exposure of the samples in the chamber, this group of compounds accounted for approximately 9% of TVOC for heartwood and 2.5% of TVOC for sapwood.
The most significant differences in the quantity of aromatic compound emissions from the heartwood and the sapwood zones were characteristic of Norway spruce wood. The emission from the sapwood zone was on average from 1.7 (day 14) to 5.2 (day 28) times higher compared to the volume of emission from heartwood. The average percentage share of aromatic compounds within TVOC was 4.7% for sapwood and 3.2% for heartwood.
On comparing aromatic compound emissions only from the heartwood zone of the studied softwood species, the highest concentrations of these compounds in the chamber air, especially during the first days of exposure, were observed for Scots pine wood (81 µg/m3 after 3 days). On days 7 and 14, these concentrations approximated the results obtained for larch at the same time (approximately 70 µg/m3 and 35 µg/m3). The much lower emissions of aromatic compounds were characteristic of spruce wood throughout the entire test period. These emissions were at an average level of 19 µg/m3 (from day 3 to day 14), and at the end of exposure, the concentration of aromatic compounds in the chamber dropped 70% to a value of 5 µg/m3.
On analyzing the levels of aromatic compound emissions from the sapwood zone of Scots pine, European larch and Norway spruce, the highest emissions were found to be characteristic of Scots pine, which was analogous with the case of heartwood. For the sapwood zone of the cross-section, the interspecies differentiation of discussed concentrations decreased slightly throughout the entire test period. After 28 days, the concentration of aromatic compounds in the chamber air was 40 µg/m3 (for Scots pine), which was four times higher compared to European larch (10 µg/m3) and 1.5 times higher than for Norway spruce (26 µg/m3). The other identified groups of compounds were aliphatic compounds and alcohols, which constituted a very insignificant percentage of TVOC.

4. Conclusions

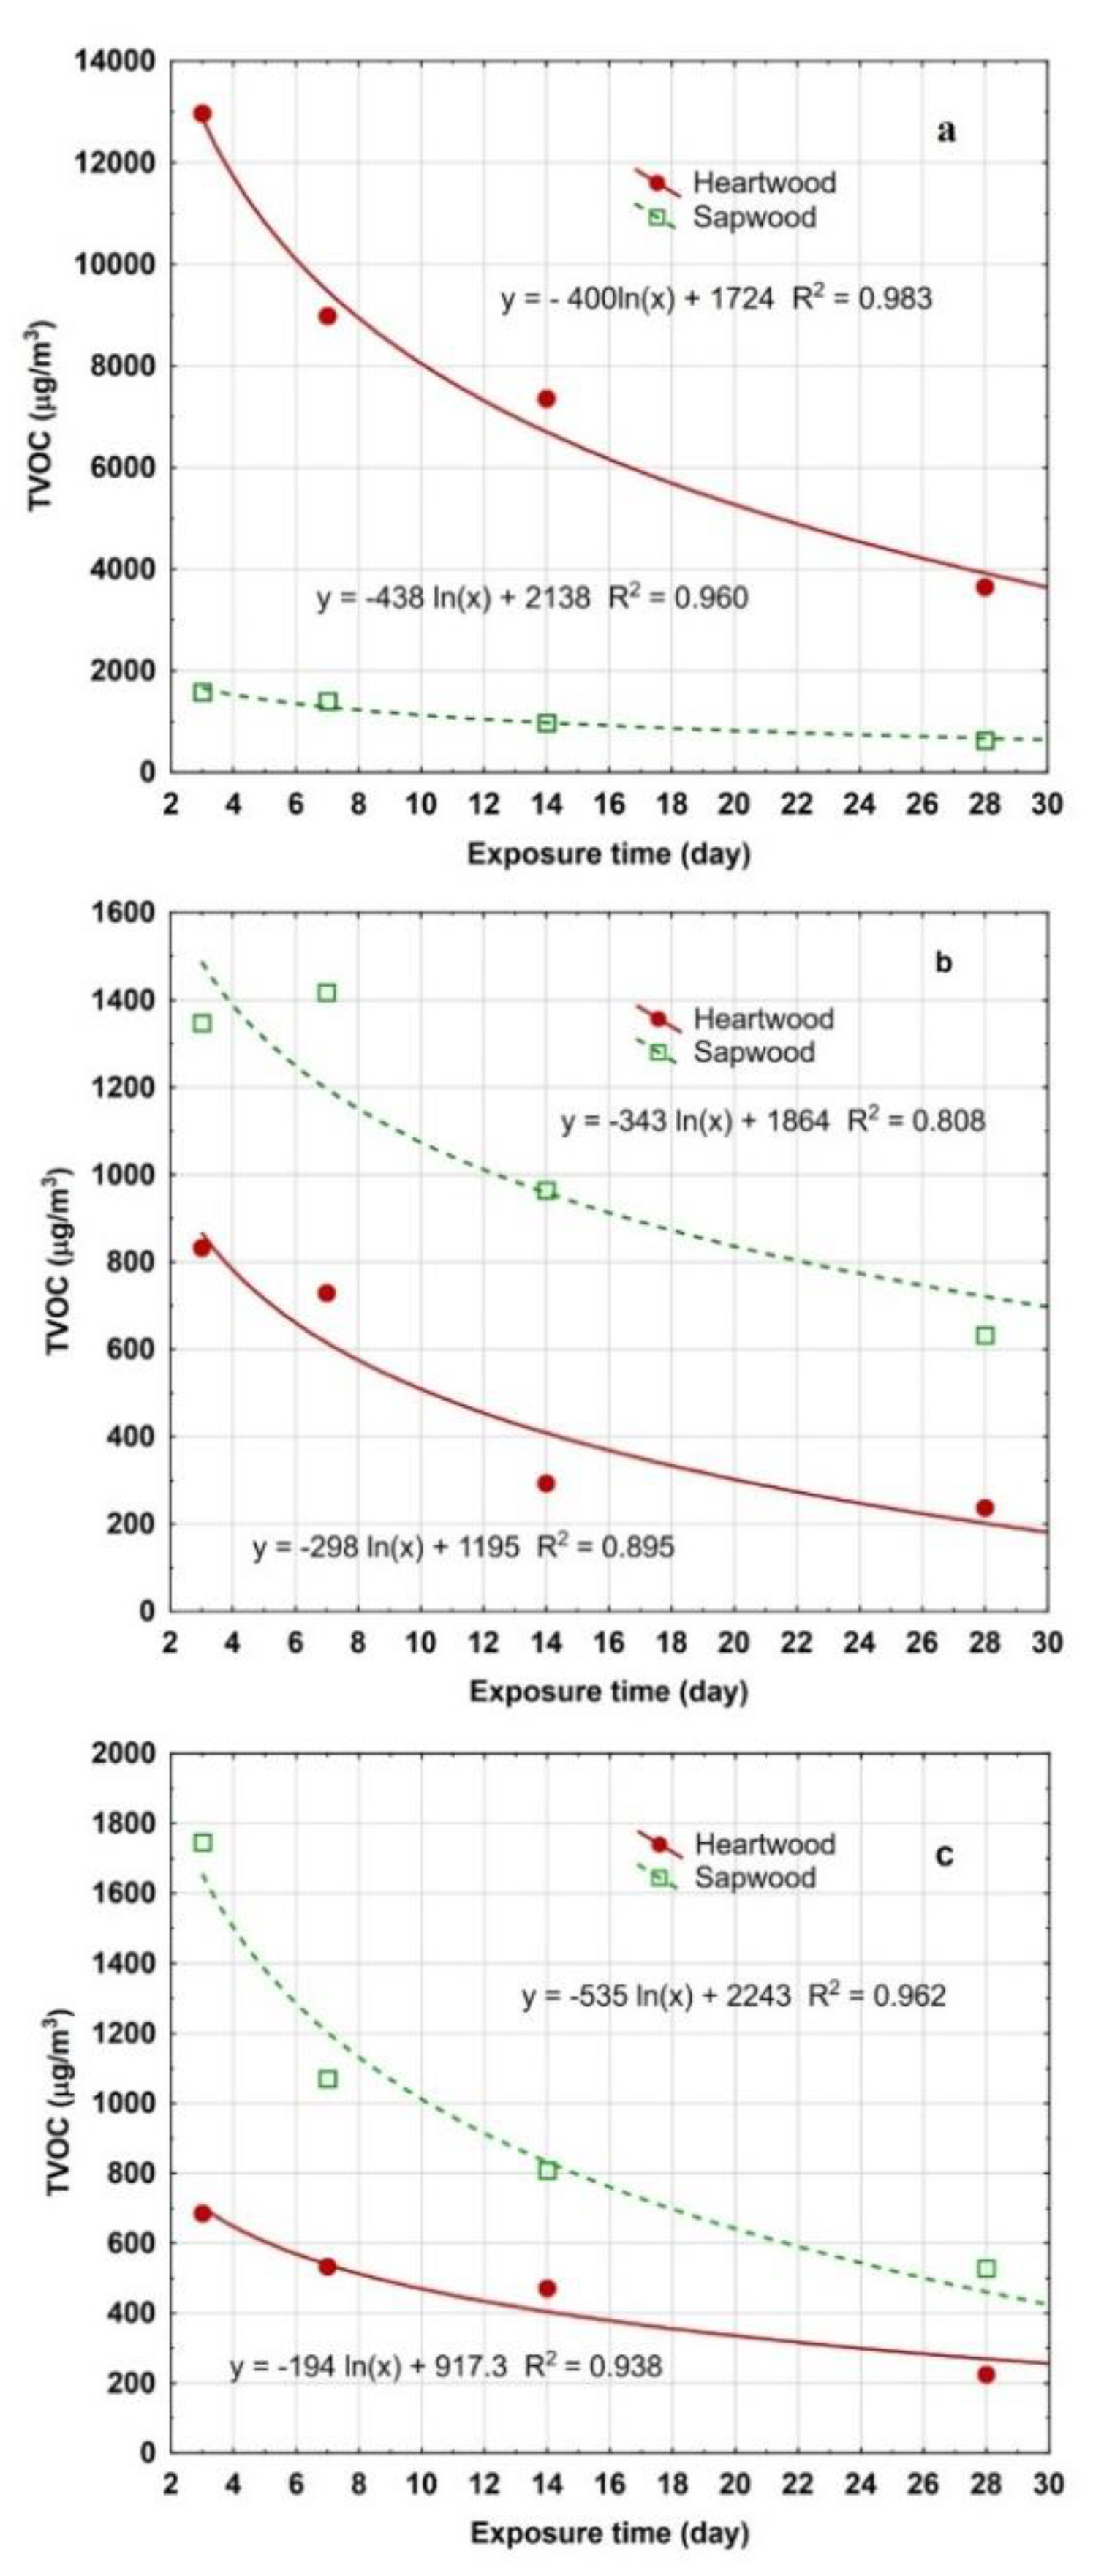
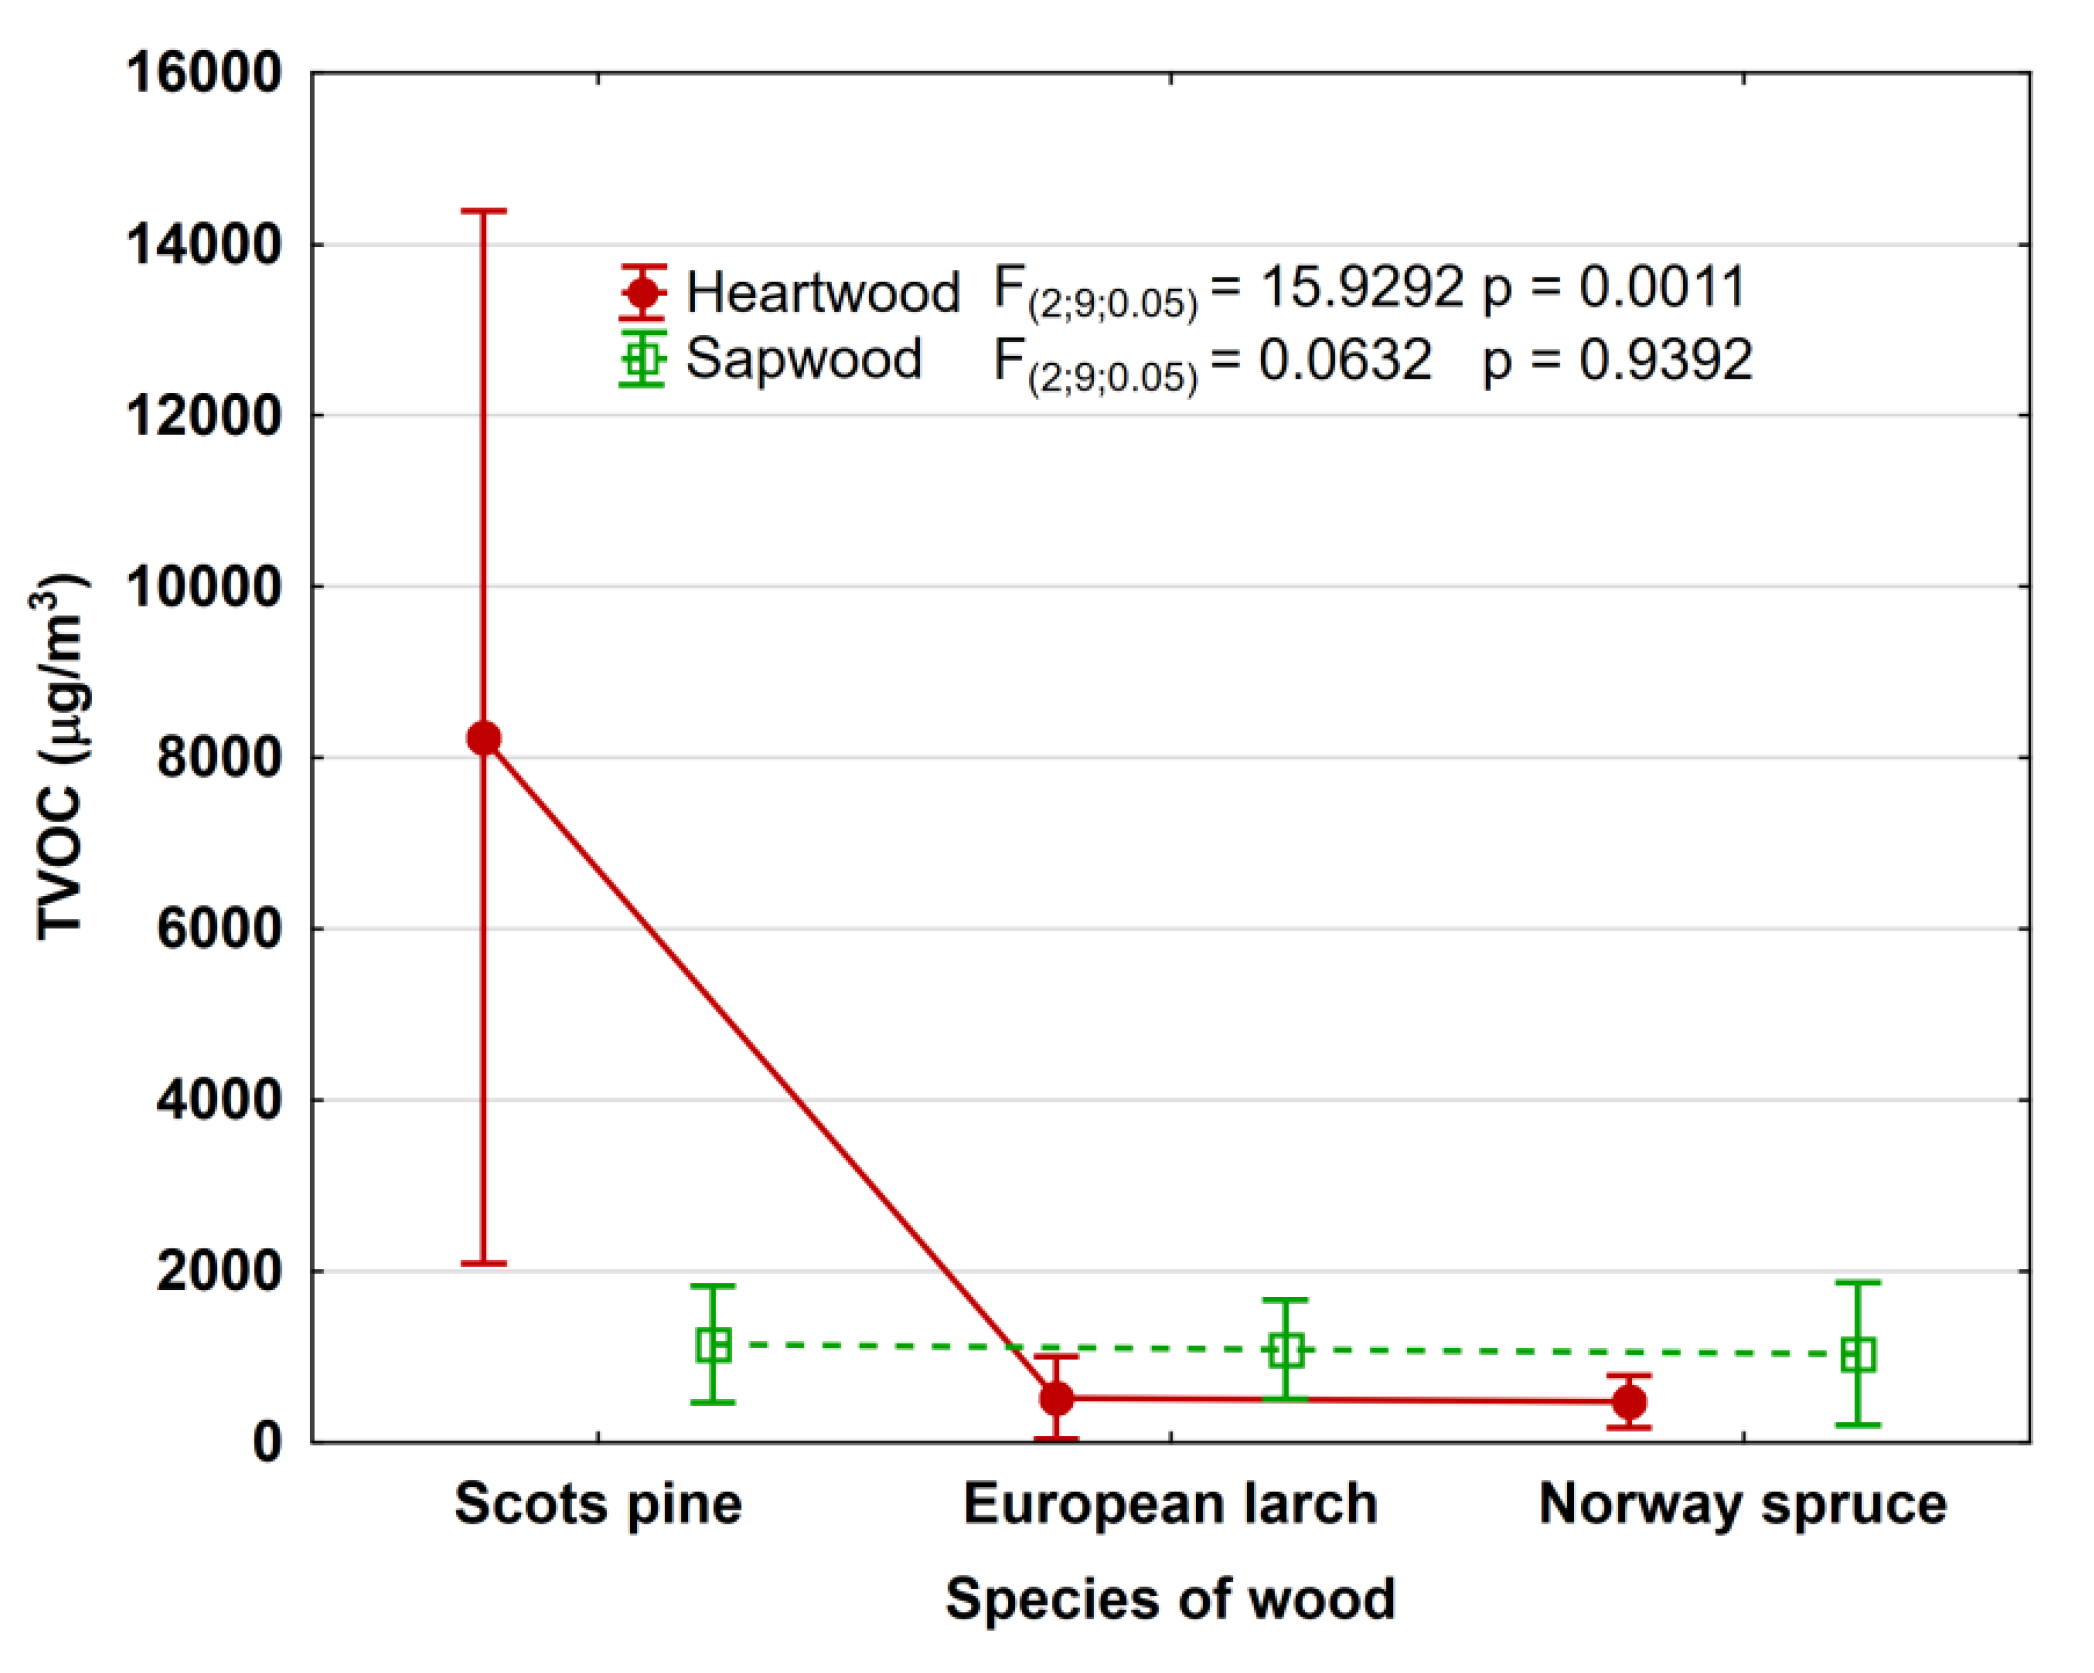
  • The effect of the wood species and the occurrence of heartwood and sapwood in the cross-section area on the amount of TVOC emission were evidenced. Irrespective of the time of sample exposition in the chamber, higher TVOC emission was observed for the pine wood than for larch and spruce wood.
  • For each tree species studied, the TVOC emission decreased with increasing sample exposure time in the chamber, and this relation could be described by a logarithmic function with a high coefficient of determination (R2 = 0.808–0.983).
  • In the pine wood, the heartwood emission of TVOC was about seven times higher than sapwood emission. The difference was almost at the same level for the entire time of exposition. For the larch and spruce wood, the VOC emission was higher from the sapwood than heartwood. The ratio of these emissions was 2.2.
  • A comparison of TVOC emission concentrations from the heartwood zones of the samples from the species studied has shown that the concentration was about 17 times higher for the pine wood than for larch and spruce. The differences of TVOC emission concentrations from the sapwood zone of the species were much smaller.
  • In the TVOC emission from each species, terpenes comprised the greatest contributing factor. The second most abundant group of compounds emitted was made of those containing the carbonyl group—mostly aldehydes—while the third most abundant group was aromatic compounds.

Author Contributions

Conceptualization, E.F.; Formal analysis, M.C. and B.F.; Investigation, M.C.; Supervision, E.F.; Visualization, B.F.; Writing—original draft, M.C. and B.F.; Writing—review and editing, M.C., B.F. and E.F. All authors have read and agreed to the published version of the manuscript.

Funding

The paper was partially financed within the framework of Ministry of Science and Higher Education programme “Regional Initiative of Excellence” in years 2019–2022, Project No. 005/RID/2018/19.

Conflicts of Interest

The authors declare no conflict of interest.

References

  1. Mitchell, C.S.; Zhang, J.J.; Sigsgaard, T.; Jantunen, M.; Lioy, P.J.; Samson, R.; Karol, M.H. Current state of the science: Health effects and indoor environmental quality. Environ. Health Perspect. 2007, 115, 958–964. [Google Scholar] [CrossRef] [PubMed] [Green Version]
  2. Schneider, P.; Gebefügi, I.; Richter, K.; Wölke, G.; Schneille, J.; Wichmann, H.-E.; Heinrich, J. Indoor and outdoor BTX levels in German cities. Sci. Total Environ. 2001, 267, 41–51. [Google Scholar] [CrossRef]
  3. Cohen, Y. Volatile organic compounds in the environment: A multimedia perspective. In Volatile Organic Compounds in the Environment; ASTM STP 1261; Wang, W., Schnoor, J., Doi, J., Eds.; American Society for Testing and Materials: West Conshohocken, PA, USA, 1996; pp. 7–32. [Google Scholar]
  4. Daisey, J.M.; Angell, W.J.; Apte, M.G. Indoor air quality, ventilation and health symptoms in schools: An analysis of existing information. Indoor Air 2003, 13, 53–64. [Google Scholar] [CrossRef] [PubMed]
  5. Ilgen, E.; Levsen, K.; Angerer, J.; Schneider, P.; Heinrich, J.; Wichmann, H.-E. Aromatic hydrocarbons in the atmospheric environment—Part II: Univariate and multivariate analysis and case studies of indoor concentrations. Atmos. Environ. 2001, 35, 1253–1264. [Google Scholar] [CrossRef]
  6. Cao, T.; Shen, J.; Wang, O.; Li, H.; Xu, C.; Dong, H. Characteristics of VOCs Released from Plywood in Airtight Environments. Forests 2019, 10, 709. [Google Scholar] [CrossRef] [Green Version]
  7. Gminski, R.; Marutzky, R.; Kevekordes, S.; Fuhrmann, F.; Bürger, W.; Hauschke, D.; Ebner, W.; Mersch-Sundermann, V. Sensory irritations and pulmonary effects in human volunteers following short-term exposure to pinewood emissions. J. Wood Sci. 2011, 57, 436–445. [Google Scholar] [CrossRef]
  8. Gminski, R.; Marutzky, R.; Kevekordes, S.; Fuhrmann, F.; Bürger, W.; Hauschke, D.; Ebner, W.; Mersch-Sundermann, V. Chemosensory irritations and pulmonary effects of acute exposure to emissions from oriented strand board. Hum. Exp. Toxicol. 2011, 30, 1204–1221. [Google Scholar] [CrossRef]
  9. He, Z.; Zhang, Y.; Wei, W. Formaldehyde and VOC emissions at different manufacturing stages of wood-based panels. Build. Environ. 2012, 47, 197–204. [Google Scholar] [CrossRef]
  10. Jensen, L.K.; Larsen, A.; Mølhave, L.; Hansen, M.K.; Knudsen, B. Health evaluation of volatile organic compound (VOC) emissions from wood and wood-based materials. Arch. Environ. Health 2001, 56, 419–432. [Google Scholar] [CrossRef]
  11. Kirkeskov, L.; Witterseh, T.; Funch, L.W.; Kristiansen, E.; Mølhave, L.; Hansen, M.K.; Knudsen, B.B. Health evaluation of volatile organic compound (VOC) emission from exotic wood products. Indoor Air 2009, 19, 45–57. [Google Scholar] [CrossRef]
  12. Plaisance, H.; Vignau-Laulhere, J.; Mocho, P.; Sauvat, N.; Raulin, K.; Desauziers, V. Volatile organic compounds concentrations during the construction process in newly-built timber-frame houses: Source identification and emission kinetics. Environ. Sci. Process. Impacts 2017, 5, 696–710. [Google Scholar] [CrossRef] [PubMed]
  13. Jiang, C.; Li, D.; Zhang, P.; Li, J.; Wang, J.; Yu, J. Formaldehyde and volatile organic compound (VOC) emissions from particleboard: Identification of odorous compounds and effects of heat treatment. J. Build. Environ. 2017, 117, 118–126. [Google Scholar] [CrossRef]
  14. Toxics Release Inventory Chemical List. Available online: www.epa.gov (accessed on 3 July 2019).
  15. World Health Organisation. Indoor Air Quality: Organic Pollutants; EURO Reports and Studies No. 111; World Health Organization: Geneva, Switzerland, 1989; pp. 2–39. [Google Scholar]
  16. World Health Organization Regional Office for Europe, World Health Organization. WHO Guidelines for Indoor Air Quality: Selected Pollutants; World Health Organization Regional Office for Europe, World Health Organization: Copenhagen, Denmark, 2010. [Google Scholar]
  17. Risholm-Sundman, M.; Lundgren, M.; Vestin, E.; Herder, P. Emission of acetic acid and other volatile organic compounds from different species of solid wood. Holz Roh Werkst. 1998, 56, 125–129. [Google Scholar] [CrossRef]
  18. Fengel, D.; Wegener, G. Wood: Chemistry, Ultrastructure, Reactions; Kessel Verlag: Remagen, Germany, 2003. [Google Scholar]
  19. Hejnowicz, Z. Anatomy and Histogenesis of Vascular Plants, 3rd ed.; Polish Scientific Publisher Warsaw (PWN): Warszawa, Poland, 2018. (In Polish) [Google Scholar]
  20. Taiti, C.; Costa, C.; Guidi Nissim, W.; Bibbiani, S.; Azzarello, E.; Masi, E.; Pandolfi, C.; Pallottino, F.; Menesatti, P.; Mancuso, S. Assessing VOC emission by different wood cores using the PTR-ToF-MS technology. Wood Sci. Technol. 2017, 51, 273–295. [Google Scholar] [CrossRef]
  21. Back, E.L. Pattern of parenchyma and canal resin composition in softwoods and hardwoods. J. Wood Sci. 2002, 48, 167–170. [Google Scholar] [CrossRef]
  22. Back, E.L.; Allen, L.H. Pitch Control, Wood Resin and Deresination; TAPPI Press: Atlanta, GA, USA, 2000. [Google Scholar]
  23. Czajka, M.; Fabisiak, E. The radial variation of the density of occurrence of vertical resin canals in selected coniferous species. Ann. WULS For. Wood Technol. 2016, 94, 109–116. [Google Scholar]
  24. Fabisiak, E.; Czajka, M. The effect of annual ring width on density of axial resin canals in pine wood (Pinus sylvestris L.). Ann. WULS For. Wood Technol. 2011, 74, 40–45. [Google Scholar]
  25. Song, K.; Yin, Y.; Salmén, L.; Xiao, F.; Jiang, X. Changes in the properties of wood cell walls during the transformation from sapwood to heartwood. J. Mater. Sci. 2014, 49, 1734–1742. [Google Scholar] [CrossRef]
  26. Bergström, B. Chemical and structural changes during heartwood formation in Pinus sylvestris. Forestry 2003, 76, 45–53. [Google Scholar] [CrossRef]
  27. Sassoli, M.; Taiti, C.; Guidi Nissim, W.; Costa, C.; Mancuso, S.; Menesatti, P.; Fioravanti, M. Characterization of VOC emission profile of different wood species during moisture cycles. iForest 2017, 10, 576–584. [Google Scholar] [CrossRef] [Green Version]
  28. Roffael, E. Volatile organic compounds and formaldehyde in nature, wood and wood based panels. Holz Roh Werkst. 2006, 64, 144–149. [Google Scholar] [CrossRef]
  29. Steckel, V.; Ohlmeyer, M. Comparison of rapid testing systems for determining VOC emissions from wood products with the chamber method. In Proceedings of the 9th Pacific Rim Bio-Based Composites Symposium, Rotorua, New Zealand, 6–8 November 2008. [Google Scholar]
  30. Wilke, O.; Wiegner, K.; Scheffer, H.; Brödner, D.; Kalus, S. Determination of the emissions of volatile organic compounds from oriented strand boards and evaluation by the German AgBB scheme. Indoor Built Environ. 2014, 23, 1050–1054. [Google Scholar] [CrossRef]
  31. Baumann, M.G.D.; Batterman, S.; Zhang, G.Z. Terpene emissions from particleboard and medium-density fiberboard products. For. Prod. J. 1999, 49, 49–56. [Google Scholar]
  32. Makowski, M.; Ohlmeyer, M. Comparison of a small and a large environmental test chamber for measuring VOC emission from OSB made of Scots pine (Pinus sylvestris L.). Holz Roh Werkst. 2006, 64, 469–472. [Google Scholar] [CrossRef]
  33. Lin, C.C.; Yu, K.P.; Zhao, P.; Lee, G.W.M. Evaluation of impact factors on VOC emissions and concentrations from wooden flooring based on chamber tests. Build. Environ. 2009, 44, 525–533. [Google Scholar] [CrossRef]
  34. Adamová, T.; Headecký, J.; Prajer, M. VOC Emissions from Spruce Strands and Hemp Shive: In Search for a Low Emission Raw Material for Bio-Based Construction Materials. Materials 2019, 12, 2026. [Google Scholar] [CrossRef] [Green Version]
  35. Baumann, M.G.D.; Lorenz, L.F.; Batterman, S.A.; Zhang, G.Z. Aldehyde emissions from particleboard and medium density fiberboard products. For. Prod. J. 2000, 50, 75–82. [Google Scholar]
  36. Guo, H.; Murray, F.; Lee, S.-C. Emissions of total volatile organic compounds from pressed wood products in an environmental chamber. Build. Environ. 2002, 37, 1117–1126. [Google Scholar] [CrossRef]
  37. Hyttinen, M.; Masalin-Weijo, M.; Kalliokoski, P.; Pasanen, P. Comparison of VOC emissions between air-dried and heat-treated Norway spruce (Picea abies), Scots pine (Pinus sylvestris) and European aspen (Populus tremula) wood. Atmos. Environ. 2010, 44, 5028–5033. [Google Scholar] [CrossRef]
  38. Lee, Y.K.; Kim, H.J. The effect of temperature on VOCs and carbonyl compounds emission from wooden flooring by thermal extractor test method. Build. Environ. 2012, 53, 95–99. [Google Scholar] [CrossRef]
  39. Makowski, M.; Ohlmeyer, M. Influences of hot pressing temperature and surface structure on VOC emissions from OSB made of Scots pine. Holzforschung 2006, 60, 533–538. [Google Scholar] [CrossRef]
  40. Ohlmeyer, M. Parameters influencing the emissions of volatile organic compounds from OSB. In Proceedings of the 9th Pacific Rim Bio-Based Composites Symposium, Rotorua, New Zealand, 6–8 November 2008. [Google Scholar]
  41. Makowski, M.; Ohlmeyer, M. Impact of drying temperature and pressing time factor on VOC emissions from OSB made of Scots pine. Holzforschung 2006, 60, 417–422. [Google Scholar] [CrossRef]
  42. Ohlmeyer, M.; Makowski, M.; Fried, H.; Hasch, J.; Schoeler, M. Influence of panel thickness on the release of volatile organic compounds from OSB made of Pinus sylvestris L. For. Prod. J. 2008, 58, 65–70. [Google Scholar]
  43. Peters, J.; Fischer, K.; Fischer, S. Characterization of emissions from thermally modified wood and their reduction by chemical treatment. BioRes 2008, 3, 491–502. [Google Scholar]
  44. Manninen, A.M.; Pasanen, P.; Holopainen, J.K. Comparing the VOC emissions between air-dried and heat-treated Scots pine wood. Atmos. Environ. 2002, 36, 1763–1768. [Google Scholar] [CrossRef]
  45. Englund, F.; Nussbaum, R.M. Monoterpenes in Scots pine and Norway spruce and their emission during kiln drying. Holzforschung 2000, 54, 449–456. [Google Scholar] [CrossRef]
  46. Arshadi, M.; Geladi, P.; Gref, R.; Fjällström, P. Emission of volatile aldehydes and ketones from wood pellets under controlled conditions. Ann. Occup. Hyg. 2009, 53, 797–805. [Google Scholar] [CrossRef]
  47. Hiltunen, R.; Juvonen, S.; Tigerstedt, P.M.A. Geographical variation in some monoterpenes in Scots pine (Pinus sylvestris L.) in Finland. Farm. Aikak. 1975, 84, 73–82. [Google Scholar]
  48. Nerg, A.; Kainulainen, P.; Vuorinen, M.; Hanso, M.; Holopainen, J.K.; Kurkela, T. Seasonal and geographical variation of terpenes, resin acids and total phenolics in nursery grown Scots pine (Pinus sylvestris L.). New Phytol. 1994, 128, 703–713. [Google Scholar] [CrossRef]
  49. Larsen, A.; Frost, L.; Funch, L.W. Emission of Volatile Organic Compounds from Wood and Wood-Based Materials; Working Report No. 15; Danish Technological Institute: Taastrup, Denmark, 2000. [Google Scholar]
  50. ISO 16000-9. Indoor Air—Part 9: Determination Emission of Volatile Organic Compounds from Building Products and Furnishing-Emission Test Chamber Method; ISO: Geneva, Switzerland, 2009. [Google Scholar]
  51. ISO 16000-6. Indoor Air—Part 6: Determination of Volatile Organic Compounds in Indoor and Test Chamber Air by Active Sampling on Tenax TA Sorbent, Thermal Desorption and Gas Chromatography Using MS/FID; ISO: Geneva, Switzerland, 2011. [Google Scholar]
  52. Steckel, V.; Welling, J.; Ohlmeyer, M. Emissions of volatile organic compounds from convection dried Norway spruce timber. In Proceedings of the Future of Quality Control for Wood & Wood Products’, The Final Conference of COST Action E53, Edinburgh, UK, 4–7 May 2010; Available online: http://timberdry.net/downloads/EDG-Workshop-Edinburgh/Edinburgh-Presentation/15.pdf (accessed on 3 July 2019).
  53. Dix, B.; Roffael, E.; Schneider, T. Abgabe von Flüchtigen Verbindungen (Volatile Organic Compounds VOC) von Strands, Hergestellt Aus Kern und Splintholz der Kiefer; WKI Kurzbericht short report 6/2004; Wilhelm-Klauditz-Institut: Holzforschung, Germany, 2004. [Google Scholar]
  54. Granström, K.M. Emissions of sesquiterpenes from spruce sawdust during drying. Eur. J. Wood Prod. 2009, 267, 343–350. [Google Scholar] [CrossRef]
  55. McGraw, G.W.; Hemingway, R.W.; Ingram, L.L.; Canady, C.S.; McGraw, W.B. Thermal degradation of terpenes: Camphene, Δ3-carene, limonene, and α-terpinene. Environ. Sci. Technol. 1999, 33, 4029–4033. [Google Scholar] [CrossRef]
  56. Chan, H.W.S. Autoxidation of Unsaturated Lipids; Academic Press: London, UK, 1987. [Google Scholar]
  57. Strömvall, A.M.; Petersson, G. Monoterpenes emitted to air from industrial barking of Scandinavian conifers. Environ. Pollut. 1993, 79, 215–218. [Google Scholar] [CrossRef] [Green Version]
  58. McDonald, A.G.; Dare, P.H.; Gifford, J.S.; Steward, D.; Riley, S. Assessment of air emissions from industrial kiln-drying of Pinus radiata wood. Holz Roh Werkst. 2002, 60, 181–190. [Google Scholar] [CrossRef]
  59. Sjöström, E. Wood Chemistry: Fundamentals and Applications; New York Academic Press: New York, NY, USA, 1993. [Google Scholar]
  60. Gminski, R.; Tang, T.; Mersch-Sundermann, V. Cytotoxicity and genotoxicity in human lung epithelial A549 cells caused by airborne volatile organic compounds emitted from pine wood and oriented strand boards. Toxicol. Lett. 2010, 196, 33–41. [Google Scholar] [CrossRef] [PubMed]
  61. Englund, F. Emission of Volatile Organic Compounds (VOC) from Wood; Report 1999 01001; Swedish Institute for Wood Technology Research Trätek: Stockholm, Sweden, 1999. [Google Scholar]
  62. Svedberg, U.R.; Högberg, H.E.; Högberg, J.; Galle, B. Emission of hexanal and carbon monoxide from storage of wood pellets, a potential occupational and domestic health hazard. Ann. Occup. Hyg. 2004, 48, 339–349. [Google Scholar] [CrossRef] [PubMed] [Green Version]
  63. Arshadi, M.; Gref, P. Emission of volatile organic compounds from softwood pellets during storage. For. Prod. J. 2005, 55, 132–135. [Google Scholar]
  64. Nielsen, N.P.K.; Nørgaard, L.; Strobel, B.W.; Felby, C. Effect of storage on extractives from particle surfaces of softwood and hardwood raw materials for wood pellets. Eur. J. Wood Prod. 2009, 67, 19–26. [Google Scholar] [CrossRef]
Figure 1. Total volatile organic compound (TVOC) concentration for heartwood and sapwood of (a) Scots pine (Pinus sylvestris L.); (b) European larch (Larix decidua Mill.) and (c) Norway spruce (Picea abies (L.) Karst.) after 3, 7, 14 and 28 days of exposure in the test chamber.
Forests 11 00092 g001
Figure 2. Mean boundary of TVOC concentrations for the heartwood and sapwood of the studied species. Vertical bars denote a confidence interval of 95%.
Forests 11 00092 g002
Table 1. Concentrations of volatile organic compounds emitted from heartwood and sapwood part of Scots pine, European larch and Norway spruce wood after 3 and 28 days of exposure of samples (values before a slash represent heartwood, while those after a slash represent sapwood).
CompoundsConcentration in the Air Chamber (µg/m3)
Exposure Time (Day)
Scots PineEuropean LarchNorway Spruce
328328328
Pentanal−/29−/18
Toluene36/387/6−/9
Hexanal33/774/15245/468/24−/53−/17
m/p-Xylene22/8012/2527/2317/1018/155/<1
1-Pentanol *14/39<1/<1
2-Propanol *−/11
o-Xylene23/20<1/<19/−8/−−/70−/26
Terpinolene40/−8/−
α-Pinene11448/6493459/294515/1025126/509345/1084119/320
Camphene198/1623/1012/9<1/615/−<1/−
3-Ethyltoluene *−/39−/9
β-Pinene54/4513/1521/544/14−/317−/74
1-Decane *−/60−/1517/−3/−
1-Propene *−/37−/3−/17
3-Carene951/134108/4076/6117/1695/8763/45
Benzaldehyde2/16<1/67/37/311/2<1/1
D-Limonene85/315/<124/2213/742/5130/19
Octanal16/231/719/95/521/−<1/−
2-Ethylhexanol *−/16−/334/161/3
n-Undecane *1/61<1/527/17<1/6
Acetophenone1/1061/1110/519/8−/8−/5
Nonanal19/344/1229/97/1061/264/12
n-Dodecane *−/28−/510/−<1/−
Decanal30/4411/1629/−7/−
n-Tetradecane2/5<1/<1
* expressed as toluene equivalents; values in the table are averages of three replicates (n = 3).
Table 2. Analysis of variation (ANOVA) for TVOC concentrations obtained for the heartwood and sapwood of the studied species in the same exposure periods.
Source of VariationSSBdfMSBSSEdfMSEFp
Exposure TimeHeartwood
1,605,0743535,025183,003822,87523.38870.0003 s
Sapwood
18,696,33536,232,112186,258,993823,282,3740.26760.8469 ns
SSB—sum squares between groups; MSB—mean squares between groups; SSE—sum squares within groups; MSE—mean squares within groups; df—degrees of freedom; F—value of test function; p—level of significance; s significant differences at level of p < 0.05; ns not significant differences.
Table 3. Concentration of volatile organic compounds emitted from heartwood and sapwood part of Scots pine wood (Pinus sylvestris L.) after 3, 7, 14, 21 and 28 days of exposure of samples (values in brackets represent sapwood).
Organic CompoundsExposure time (Day)
371428
µg/m3%µg/m3%µg/m3%µg/m3%
Terpenes12776 (875)98.5 (55.3)8864 (874)98.7 (62.0)7291 (479)99.1 (48.9)3616 (359)98.9 (57.0)
Compounds with a carbonyl group101 (300)0.8 (19.0)36 (255)0.4 (18.2)26 (225)0.4 (23.0)21 (204)0.6 (32.3)
Other compounds:
Aromatic hydrocarbons81 (177)0.6 (11.2)73 (161)0.8 (11.5)35 (156)0.5 (16.0)19 (40)0.5 (6.3)
Aliphatic hydrocarbons3 (191)- (12.1)- (102)- (7.3)1 (120)- (12.1)- (28)- (4.4)
Alcohols14 (39)0.1 (2.4)9 (12)0.1 (0.9)4 (-)0.1 (-)- (-)- (-)
Table 4. Concentration of volatile organic compounds emitted from heartwood and sapwood part of European larch wood (Larix decidua Mill.) after 3, 7, 14, 21 and 28 days of exposure of samples (values in brackets represent sapwood).
Organic CompoundsExposure Time (Day)
371428
µg/m3%µg/m3%µg/m3%µg/m3%
Terpenes648 (1171)77.8 (86.9)391 (1140)53.6 (80.4)173 (766)58.8 (79.4)160 (552)67.2 (87.2)
Compounds with a carbonyl group139 (101)16.7 (7.5)248 (182)34.0 (12.8)85 (131)28.9 (13.6)53 (68)22.3 (10.7)
Other compounds:
Aromatic hydrocarbons36 (32)4.3 (2.4)70 (31)9.6 (2.2)34 (35)11.6 (3.6)25 (10)10.5 (1.6)
Aliphatic hydrocarbons10 (17)1.2 (1.3)20 (16)2.7 (1.1)2 (12)0.7 (1.2)- (-)- (-)
Alcohols- (27)- (2.0)- (49)- (3.5)- (21)- (2.2)- (3)- (0.5)
Table 5. Concentration of volatile organic compounds emitted from heartwood and sapwood part of Norway spruce wood (Picea abies (L.) Karst.) after 3, 7, 14, 21 and 28 days of exposure of samples (values in brackets represent sapwood).
Organic CompoundsExposure Time (Day)
371428
µg/m3%µg/m3%µg/m3%µg/m3%
Terpenes497 (1539)72.4 (88.1)427 (948)80.0 (88.6)356 (719)75.6 (89.0)212 (458)94.2 (86.7)
Compounds with a carbonyl group93 (89)13.6 (5.1)33 (58)6.2 (5.4)54 (41)11.5 (5.1)4 (35)1.8 (6.6)
Other compounds:
Aromatic hydrocarbons18 (85)2.6 (4.9)18 (49)3.4 (4.6)21 (35)4.5 (4.3)5 (26)2.2 (4.9)
Aliphatic hydrocarbons44 (17)6.4 (1.0)40 (7)7.5 (0.7)22 (8)4.7 (1.0)3 (6)1.3 (1.1)
Alcohols34 (16)5.0 (0.9)16 (8)3.0 (0.7)18 (5)3.8 (0.6)1 (3)0.4 (0.6)

