1. Introduction
Models for estimating a stem taper enable one to estimate stem volume, thus being useful in both the assessment of the economic value of timber production and forest conservation management [
1]. According to the IPCC methodology, merchantable timber volume is used to convert the growing stock of forest stands into the amounts of biomass and carbon accumulated in trees [
2], with the help of either biomass conversion and expansion factor (BCEF) or biomass expansion factor (BEF). Such conversion requires accurate and unbiased systematic errors as well as methods for timber volume determination. Taper models, which allow the estimation of tree shape and wood assortment volume are also one of the most important types of practical information used in the forest management and timber industry [
3]. Therefore, the accurate determination of the shape of a tree stem and the tree volume is crucial for forest research and practice.
Generally, stem taper can be described by either a set of linear models, describing diameters at different relative tree heights or by nonlinear models describing the whole stem profile [
4]. The linear models are less biased in tree diameter estimation, however these models suffer from a serious disadvantage: they do not enable one to estimate a stem diameter at any height [
5,
6]. Nonlinear models, such as segmented taper equations [
7,
8,
9,
10,
11], or variable-exponent taper equations [
12,
13,
14,
15,
16,
17,
18] overcome this problem—but not without a cost [
19].
A comparison of linear and nonlinear models should take into account their robustness to assumptions, in particular the one of data homogeneity. Nonlinear models are more sensitive to such phenomena as outlier values, stochastic noise in the variables, anomalies in sample randomness, and measurement errors, which all can increase systematic errors. Among the nonlinear heuristic models used for stem profile modeling, variable-exponent taper equations are considered the best [
13,
19].
The shape of a tree stem is genetically determined, but it also depends on various factors, such as the site conditions, climate, the height of the crown base, and age. Therefore, it also varies among trees of the same species [
20]. Socha [
21] showed that a pine stand’s density affects the shape of the upper part of the stems. A good fit of a model largely results from the independent variables used. For example, Murhaiwe [
22] showed that including a crown ratio variable in a variable-exponent taper equation [
13] helped improve the model’s fit for shore pine but not for common aspen. Thus, many taper equations are specific for a given species, stands of a particular age, or a particular site conditions. What is more, trees of irregular shapes often are excluded during data preprocessing. While among most coniferous species, trees of irregular shape are rare, among deciduous species and other species with high plasticity in morphology they can be quite frequent. Removing them might limit the sample to regularly—shaped trees, and so the usefulness of such models would only be limited to such trees—such models, thus, should not be used for irregular trees [
23]. If such irregulars constitute a significant part of the population—a likely scenario in the case of deciduous trees—then such models are not useful. Assessment of stem taper models for mentioned cases is usually based on results of unbiased estimates [
4]. Nonetheless, a model’s precision of prediction does not always correspond to its universality, an important aspect in practice.
One of universal approach that includes both—unbiased estimates and precise estimation of a stem diameter at a particular stem height, can be artificial neural networks (ANNs). The literature have shown examples indicating that in this context ANNs give better results than do mathematical and statistical methods [
24,
25]. The most popular among multilayer perceptron (MLP), ANNs with three layers can theoretically be considered universal approximators [
26].
Since ANNs can learn, they do not require one to have the full a priori knowledge of a system studied: Thus, they enable one to build models without the prior formulation of statistical hypotheses [
27]. They can also work with data that are noisy and low quality [
28,
29,
30]; the latter aspect—paradoxically—can even improve the network’s learning capacity and the generalization of its results. ANNs can model complex, multivariate nonlinear relationships, often difficult to represent with known mathematical functions. For example, [
31] applied ANNs to analyze a tree diameter distribution, and sigmoid activation functions they implemented in the ANN led to a better fit to bimodal distributions than that of the Weibull function.
ANNs have also been widely used in forest management, including the estimation of tree height, diameter, and volume [
27,
32].Various types of networks have been used to meet these aims, including radial basis functions (RBF) [
33] and, the most frequent ones, one- or two-layer perceptron MLP [
34,
35,
36,
37]. Conceptually, the models used in these works differed not only in architecture, but also in data input and model evaluation. According to Kozak and Smith [
38], the evaluation of taper models should include evaluating the precision of both diameter and volume prediction as well as the universality of predicting stem shape for various species. From the point of view of forestry practice, such a model should also work with various independent variables and be simple to implement.
Most ANN models for stem taper approximation focus on only one species [
36,
37]. Models focused on many species incorporate species information as a parameter [
35]. Often, the information about species is a part of an equation or a direct input value [
34].
A regression approach to model stem taper was used by Kilkki, Varmola [
39]. The authors considered three models: single-equation, simultaneous-equation, and multi-equation. The first two lead to a single equation while the last one to a system of regression equations. In such a system, equations are related to each other. Socha and Kulej [
20] introduced a parallel-equation model, in which all regression equations are independent of each other. They examined different selections of independent variables and only used a set of 20 equations (with only ten cross-sections) to describe a stem taper shape. Moreover, this solution works with just one species.
In the paper, we propose two new solutions for modeling tree taper: (i) an expert model based on an artificial neural network model and (ii) a statistical model built using a regression tree. The solutions aim to provide tools for calculating stem profile and tree volume with high efficiency and low bias. The results of tree taper modelling using models (i) and (ii) were compared with a well-known and frequently used in forest research variable-exponent taper model developed by Kozak [
14,
19]. An outcome of all these models give a stem profile, which is then integrated along tree height, giving tree volume. For the models, we will use training data for eight tree species, with high vertical resolution of 0.01 of normalized tree height. The trees in the data set vary in terms of age and site conditions in which they grow.
We compare three solutions for modeling tree taper (two new models and a reference solution): (i) an machine learning model based on an artificial neural network model, (ii) a statistical model built using a regression tree, and (iii) variable exponent taper equation by Kozak (2004) recommended in [
19,
40].
The specific aims of this study were:
- (1)
to compare the modelling techniques with respect to their performance to estimate stem profile and tree volume;
- (2)
to rank the modelling techniques according to predictive performance for various tree species;
- (3)
to find a modelling technique that combines estimating of stem taper shape for many tree species into one model.
2. Data and data Preprocessing
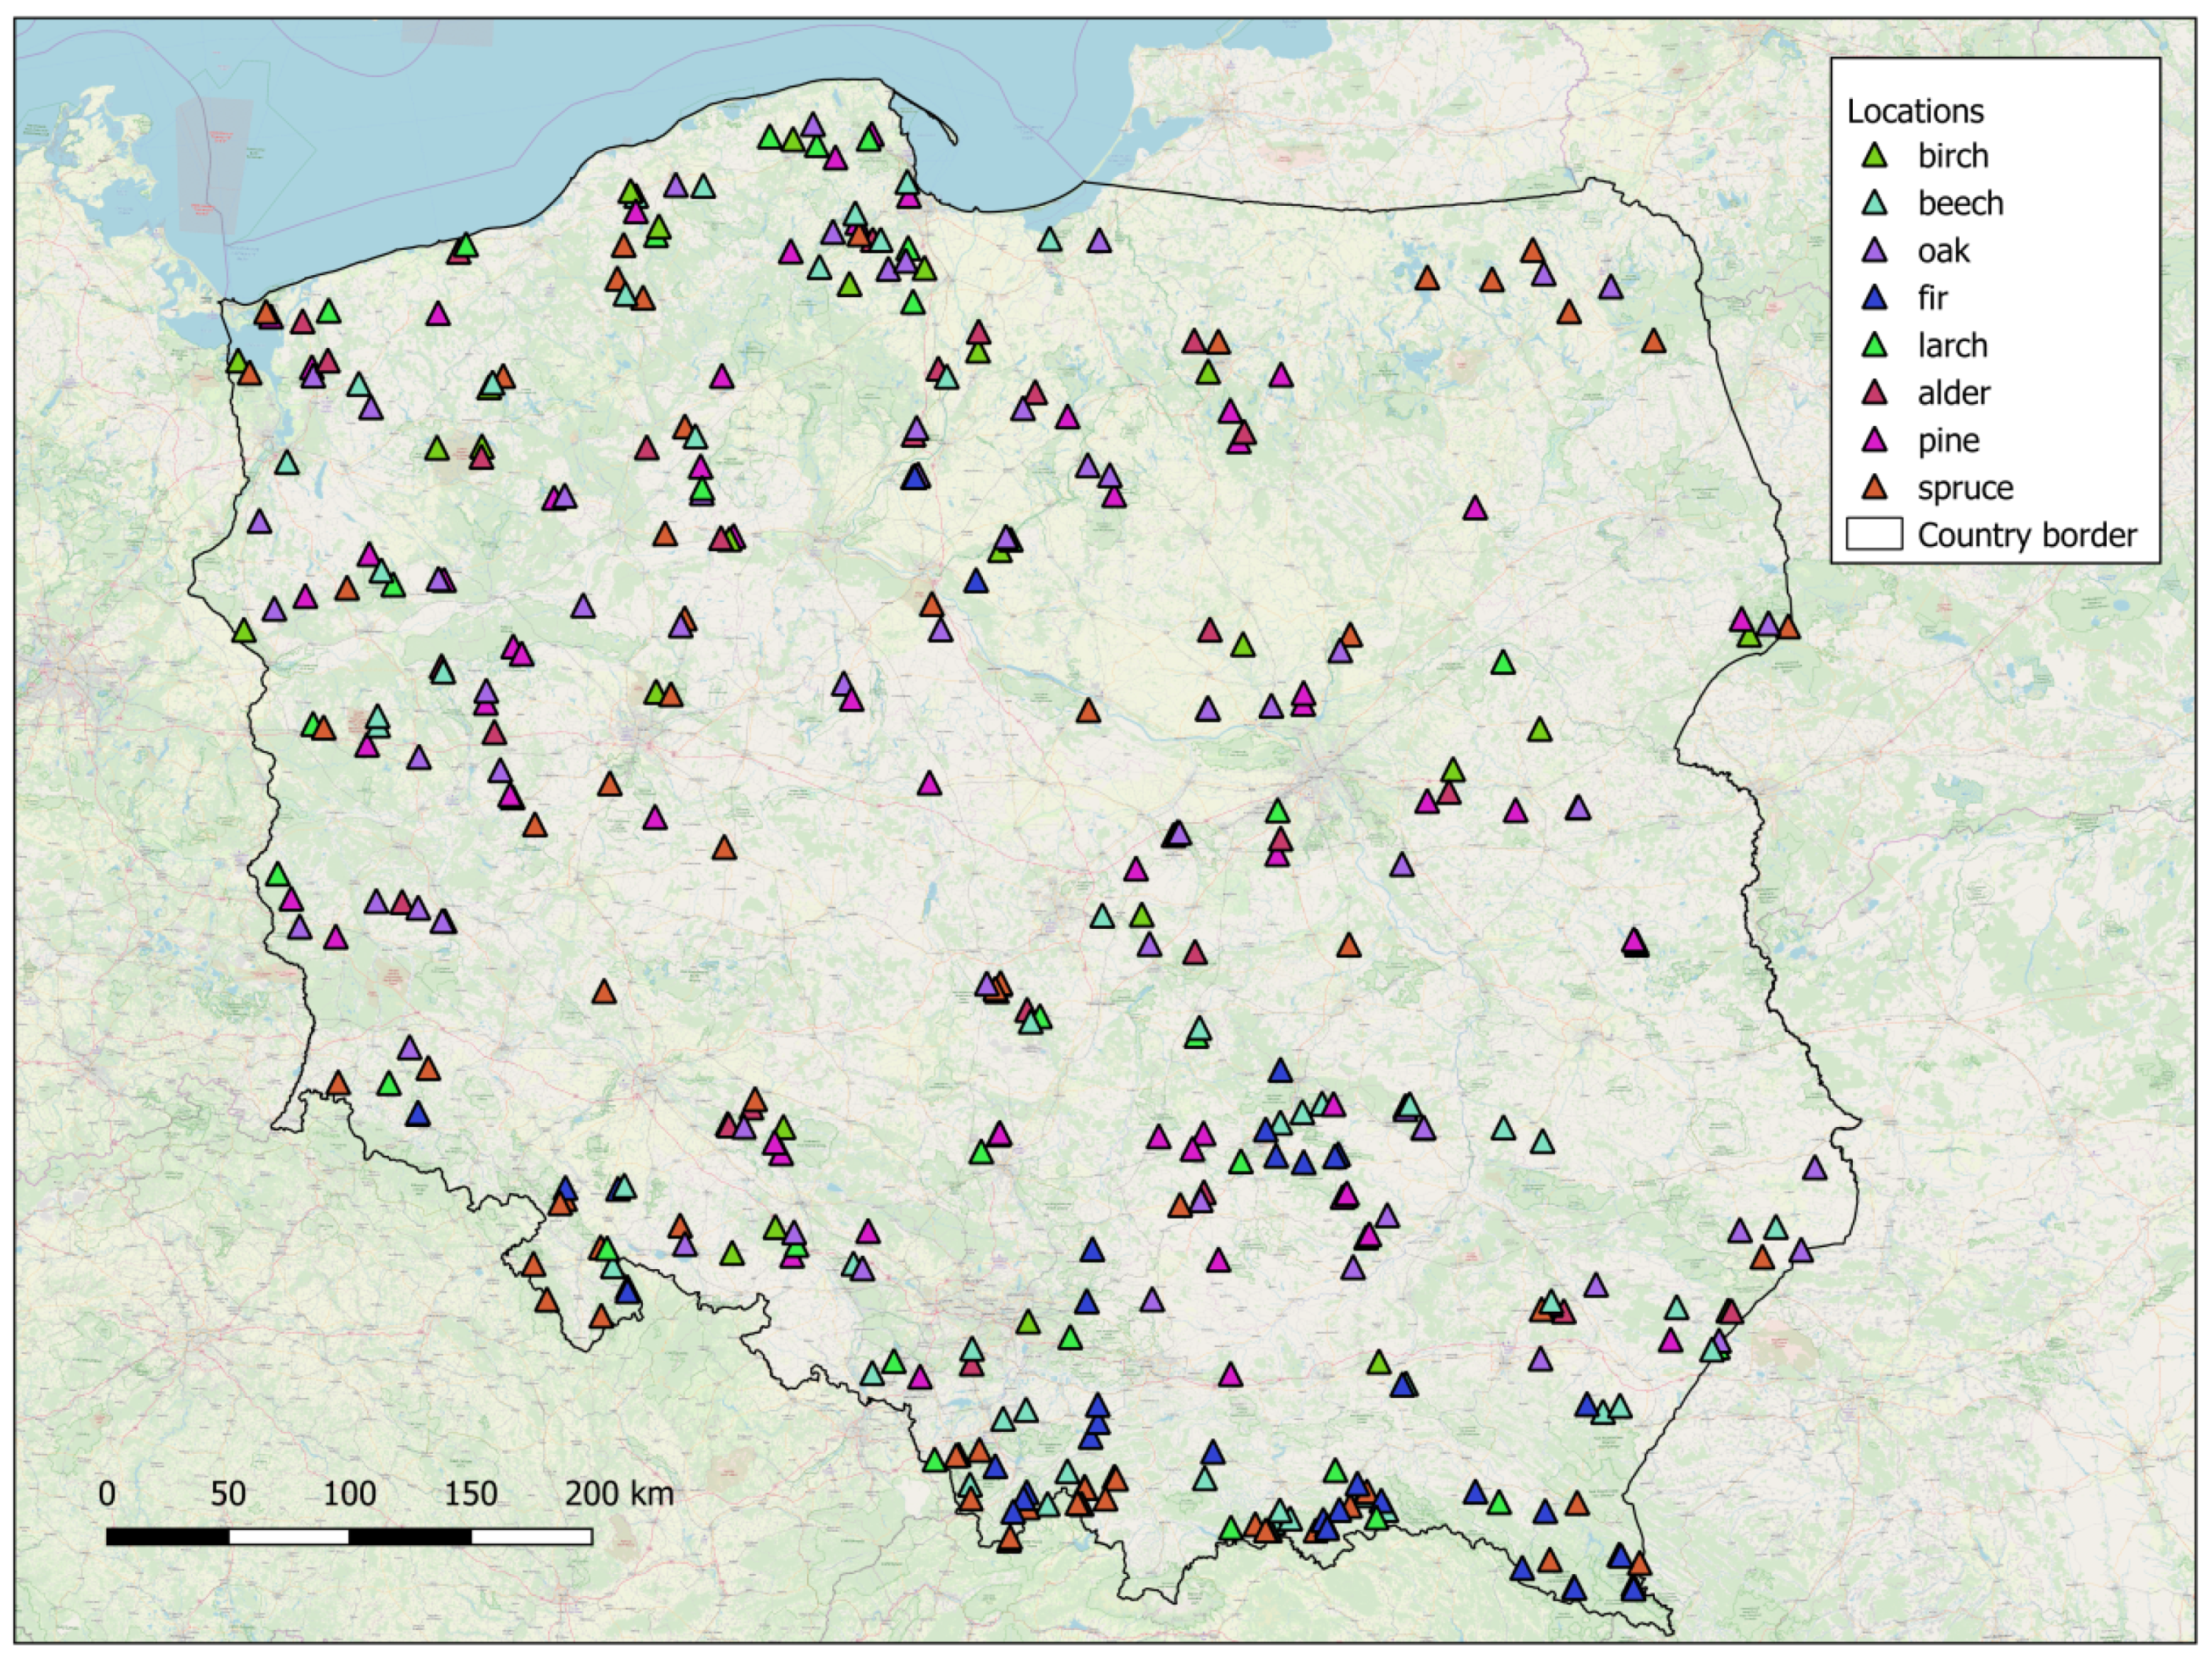
Cross-sectional measurements of the outside-bark diameter were collected in 357 stands, distributed throughout Poland and representing the whole range of site conditions and age of the tree species analyzed (
Figure 1). In each stand, a sample plot with at least 100 trees was established. After their diameters had been measured, the trees were divided into eight size classes of equal sizes (i.e., consisting of the same number of trees). In the next step, from each class one tree with average diameter and height was selected and felled for cross-sectional measurements; thus, eight trees representing were measured in each stand. Altogether, a total of 2856 trees representing eight major forest-forming tree species in Poland were collected, including 504 Scots pines (
Pinus sylvestris L.), 458 Norway spruces (
Picea abies (L.) H. Karst), 262 European larches (
Larix decidua Mill.), 219 silver firs (
Abies alba Mill.), 479 common oaks (
Quercus robur L.), 430 common beeches (
Fagus sylvatica L.), 270 black alders (
Alnus glutinosa Gaertn.), and 234 silver birches (
Betula pendula Roth.).
The diameter measurements were taken directly with a caliper at the following heights: 0.0, 0.5, 1.3, and 2.0 m, and then every 1 m to the top. The diameter at breast height (dbh) ranged from 0.30 to 79.20 cm and their height (h) from 1.35 to 42.05 m (
Table 1). Additionally, total tree height and height up to 7 cm of stem diameter were measured. For final analysis, we selected data from trees with a diameter at breast height larger than 7 cm.
The dataset was preprocessed to provide input for a model’s calibration. The height of each tree was normalized to a range from 0 to 1, and stem diameter was interpolated every 0.01 of normalized height. Interpolations were necessary in the case of regression model, in which particular equations describe tree diameters at given relative heights. We used piecewise cubic Hermite polynomials [
41] to obtain interpolated values.
3. Methods
3.1. Models
Our model works as an expert system. It consists of three modules: for controlling data-flow, for summarizing output, and for calculating tree volume; each species has its own dedicated model (see
Figure 2A,C).
STE and ANN models have similar structures (
Figure 2A,C). The input data contain information about a tree species, based on which the species selector sends parameters to the internal modeling module, calibrated for this species. Next, the output of the internal model is integrated by the volume calculator to obtain a stem taper volume. In the REG model’s case (
Figure 2B), input data are sent to a set of regression equations, calibrated for the specific species. Based on the results of these regressions, a stem taper shape is built. Finally, like in STE and ANN models, the output is integrated to obtain a stem volume.
3.2. Methods Used in Models
We compared following methods for approximating a stem shape: a taper equation, a regression set model, and a feed-forward neural network. As a reference, we calibrated a variable exponent taper equation introduced by Kozak [
14].
Kozak introduced a variable exponent equation in the following form
where:
,
,
,
.
In this notation, dbh means diameter at breast height in cm, H is total tree height, and is a stem diameter in cm at relative height.
To calibrate this model, we transformed it with logarithmic transformation and calculated the coefficients with the least squares method [
14].
A regression set model consists of two components: a decision rule and a set of regressions. The decision rule takes into account the normalized height. The normalized height is ranging from 0 to 1. Next, the rule selects a proper regression model for this normalized height. Since stem taper is approximated with the resolution of 0.01, our set of regressions contains 100 regression equations.
Each equation has the following form:
where:
d—stem diameter in cm,
D—diameter at breast height in cm, and
H—total tree height in meters.
As a result, we obtained a set of 100 vectors in the form [, , ] that describes a stem taper shape.
The third method—an artificial neural network model (ANN)—was implemented as a multilayer perceptron network [
42]. It contains four layers: an input layer of 4 neurons, two hidden layers of 5 and 17 neurons, and an output layer of 101 neurons. Each neuron was activated with a sigmoid function. To each hidden layer, we added a bias neuron. Each network layer was connected to the next layer only. The network was trained with a simple backpropagation algorithm [
42]. The training set was presented to the network 5000 times (5000 epochs). The number of epochs were set to 5000 to avoid network’s overfitting. The number of hidden layers was selected to speed up learning process.
As a network input, the following parameters were used: diameter at breast height in cm multiplied by 0.005 for scaling purposes, total tree height in meters multiplied by 0.01 (H), H’/H (where H’ is a height up to 7 cm of stem diameter), and p (p = 1.3/H). The network’s output provides expected diameters at 101 (from 0 to 1 with a 0.01 step) normalized heights. The output stem diameter values were multiplied by 0.005 in the training set.
Unlike Nunes and Görgens [
34], we did not force ANN to recognize a tree species, but we assumed that the models should be calibrated for each tree species separately. Thus, we built an ANN model for each species, an approach that leads to a more straightforward and better-trained network.
To calibrate/train each model, we divided using random selection of cases the data set into two sets: a training set (60% of the data) and a testing set (40%).
Table 2 presents the distribution of trees between the training and testing sets for all the species studied.
The training sets were used to calibrate all three models while the testing sets for the assessment of the stem taper models, based on the following model statistics:
root mean squared error, ,
mean error/bias,
model efficiency, ,
where —interpolated measurements at height i, —modeled value at height i, —average modeled value at height i.
For the model evaluation criteria a ranking was made on a relative scale to compare the modeling techniques without separation into species. Moreover, we calculated stem volumes V, integrating the stem taper shapes along the tree heights. The values of RMSE, EF and bias in diameter and volume estimation for all three models were assumed in blocks. Inside each block, they were ranked by assigned numbers from 1 to 3 (1 for the best and 3 for the worst result). Each block contained information about RMSE, EF and bias for single species so the ranks have been added to give general information for all eight species. The sum of ranks for each model was used to assess the quality of the model.
4. Results
4.1. Diameter Estimates
A mean bias in diameter of all the three models for all the species ranged from −0.0178 to −0.0838. For most species, the model mean errors did not differ from zero (p < 0.05), with the only exceptions of beech and alder: For the former, all the three models for beech were significantly biased, and for the latter, the ANN model was.
The most efficient technique for diameter estimation was ANN (its mean EF was 0.9777). This model was most efficient for larch and pine. For larch, EF for ANN was 0.9887, for Kozak’s model 0.9846, and for REG 0.9878. For pine, EF for ANN was 0.9865, for Kozak’s model 0.9859, and for REG 0.9825. ANN was the least efficient for beech, with EF of 0.9643; the other models were even less efficient, with EF 0.9640 for REG and 0.9590 for Kozak’s model.
ANN was also the most stable taper equation in terms of RMSE, except for alder (
Table 3). For this species, REG’s RMSE was 1.4277 while ANN’s and Kozak’s were higher (1.5848 and 1.5522, respectively).
To check the models, we plotted their residuals of diameter predictions versus diameter (d) (
Figure 3,
Figure 4 and
Figure 5). The plots showed that for all the models, the errors symmetrically distributed around zero. Kozak’s taper equation model, however, showed the tendency for higher errors in the bottom and middle parts of the stems. For most species (beech, spruce, alder, larch, fir, and pine), the REG model showed errors in the lower part of the stem.
We ranked the validation results (
Table 4), and the most precise technique for diameter estimation was ANN, followed by REG and Kozak’s model taper equation.
4.2. Stem Volume Estimates
Model validation for the stem volume prediction showed similar results to those for the diameter. ANN had the lowest mean RMSE over the species (0.1457), but its RMSE for beech was the highest among the three models (0.2817).
ANN was the best model for birch, fir, larch, and spruce. For oak, ANN was better than the REG model but worse than Kozak’s. Kozak’s model was the most accurate and efficient for pine and oak. For alder, however, REG had the lowest RMSE (0.0796), the lowest RSME among all the models and all the species.
Mean error ranged from −0.0551 (for the ANN model for beech) to 0.0051 (for the REG model for alder).
In summary, for stem volume estimation, the best model was ANN, but—unlike for diameter estimation—Kozak’s model was better than the REG one (
Table 3).
4.3. The Models Ranking
To compare models as a complex expert systems without division to the particular tree species we applied ranking method. The sum of ranks for all evaluation criteria was on a [8–24] scale, which means that the best model obtained the lowest values and the worst model obtained the highest values (
Table 4). Ranks have been calculated for the estimation of d and V separately.
For prediction d, the range of variability is very high. It covers almost all possible variability range and takes from 9 to 24. For RMSE, the ANN model obtained almost the lowest possible rank value—9, which indicates that it obtained the lowest error of all three models for almost all tree species—both coniferous and deciduous. Similarly, the ANN model obtained a value close to the minimum for EF—10. The worst ranks for prediction d were assigned to Kozak (2004) model for RMSE and EF. RMSE and EF rank values indicates that, the ANN model was significantly better than Kozak (2004) and REG models.
For prediction V, the range of rank’s variability is smaller than for prediction d. It covers variability from 15 to 18. For RMSE and EF, the ANN model obtained the best rank value—15. The worst ranks for prediction V were assigned to REG model for RMSE and EF. For ME, Kozak (2004) and REG turned out to be better than the ANN model. The ranks for prediction V assigned for Kozak (2004) and REG model was 15 in this case. The ANN model was slightly worse and obtained the rank—18.
5. Discussion
Choosing the best model describing the shape of a tree stem is a difficult task, especially when the choice is based on criteria related to a model’s prediction quality and utility. A model’s usefulness can be defined in various ways, but it is usually closely related to the purpose of the modeling [
5]. For the models presented, the main aim was to select a model with the highest quality of predictions diameters and total volume calculated based on them as well as universality in terms of obtaining forecasts for different tree species and stands of various ages. In current studies on this subject that include the use of ANN, this last condition has seldom been kept. For example, Soares, Flores, Cabacinha, Carrijo, Veiga [
36,
37], using neural networks, applied the recursively series prediction method, which helped them limit the number of input variables to three. They developed this model, however, for one species, for trees of the same age obtained from clonal genetic material. In turn, Reis’ et al. [
35] model was not verified in terms of the accuracy of tree volume’s estimation, and network input data based on plenty of previously prepared variables (e.g., competition index, forest class, etc.). In our opinion, such an approach limited the usefulness of the model. The model used by Nunes and Görgens [
34] included as many as 72 deciduous tree species, classified, however, into three types and used as a qualitative variable. Due to the number of the species and the diversity of stem shapes in different sites, the information on the origin of a tree was crucial for the model. In studies by Castaño-Santamaría, Crecente-Campo, Fernández-Martínez, Barrio-Anta, Obeso [
43], who predicted tree height based on their diameter in tree stands of various ages, neural networks gave worse results than did other methods, likely resulting from the instability in the learning process.
In terms of RMSE, our analyses indicate that artificial neural networks allowed for the most precise determination of a stem shape for all the species studied except for alder, for which the REG model was better. In terms of estimating tree volume, ANNs were the best for coniferous species and among deciduous ones only for birch (Betula pendula). The latter result may have to do with irregular morphological forms of deciduous species [
23], whose shape is difficult to describe using a single function. However, the results obtained using neural networks were close enough to those obtained using the regression and Kozak (2004) models to suppose that they can improve, for example, after increasing the number of learning epochs or the size of the training set. Slightly higher errors were observed for regression models (REG) than for ANNs (except for alder). For both methods (ANN and REG), no systematic errors were found in the determination of diameters at different heights of a stem.
In terms of total volume estimation, Kozak’s model proved to be the best for oak and pine. Attempts to describe stem shape using the Kozak taper-equation model resulted in obtaining systematic errors for some sections of the stem, especially in its lower and middle parts. Similar results were obtained by Rojo and Perales [
19]: Using Kozak’s taper-equation model to describe stem shape, they showed overestimation for bottom parts of the stem, which, according to the authors, may result from a lack of data for larger and/or older trees, whose stems have more neiloidal shapes in their lower parts. Other authors reported similar effects related to the occurrence of systematic errors when a single function was used to describestem curves: For example, in Li and Weiskittel [
4], the Kozak model, being compared to other models based on one function, gave errors in the upper and middle parts of stems for red spruce. In the aforementioned studies, the Kozak model predicted better than to other models did for red spruce and white pine. In the study by Rojo and Prales [
19], the Akaike criteria also indicated the Kozak model as the best choice for maritime pine in Galicia. We obtained similar results in our research in terms of the RMSE error only in terms of the determination of total volume for pine (
Pinus sylvestris L.). At first sight the overall performance of all models seems to be similar. Although, the summarizing ranks (
Table 4) in terms of RMSE and EF show that the ANN model was the best for prediction both diameter and volume. The other two models (Kozak 2004 and REG) had lowest bias. High rank for bias of ANN model was caused by result for Alder.
6. Conclusions
It can be concluded that by creating stem shape models according to the recommendations by MacFarlane and Weiskittel [
23], that is, avoiding exclusion criteria for irregularly shaped trees and for various species and different age stands, the neural networks model gave the most precise results in terms of diameter prediction.This model’s predominance was also visible in the prediction of tree volume for all coniferous species and birch. The REG model was estimated with smaller systematic errors, but its disadvantage is that it does not guarantee to well represent a monotonic convergent shape of a tree, because the individual regression equations are independent of each other. Like the Kozak model (2004), the REG model cannot be improved, which means that the class of the function describing a stem diameter for a given height does not change. Despite these inconveniences and its simplicity, the REG model works well, especially for describing stem volume.
The neural model allows one to estimate a stem diameter at any height with high precision—just like the linear model—but its additional advantage is the possibility to improve it, for example, by increasing the training set, better matching the structure of the model to the shape topology of the species, changing the non-linear transition function, or changing the learning parameters. The analyses thus indicate that ANNs are a universal tool for constructing models of a stem shape and volume. They allow the construction of models with a very good fit to empirical data and without systematic errors at any part of the stem, at the same time allowing the determination of a diameter at any height of the tree. ANNs can therefore be used to build local models of a stem shape and volume, used in forest practice for forest inventory. In our opinion, further research should focus on optimizing the performance of ANN models.


