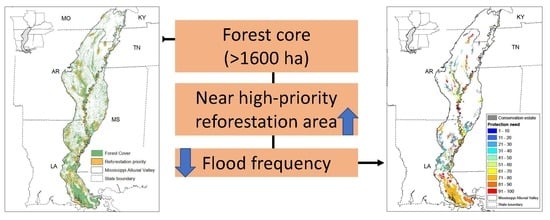
Conservation–Protection of Forests for Wildlife in the Mississippi Alluvial Valley
Abstract
:1. Introduction
2. Materials and Methods
2.1. Study Area
2.2. Data Sources
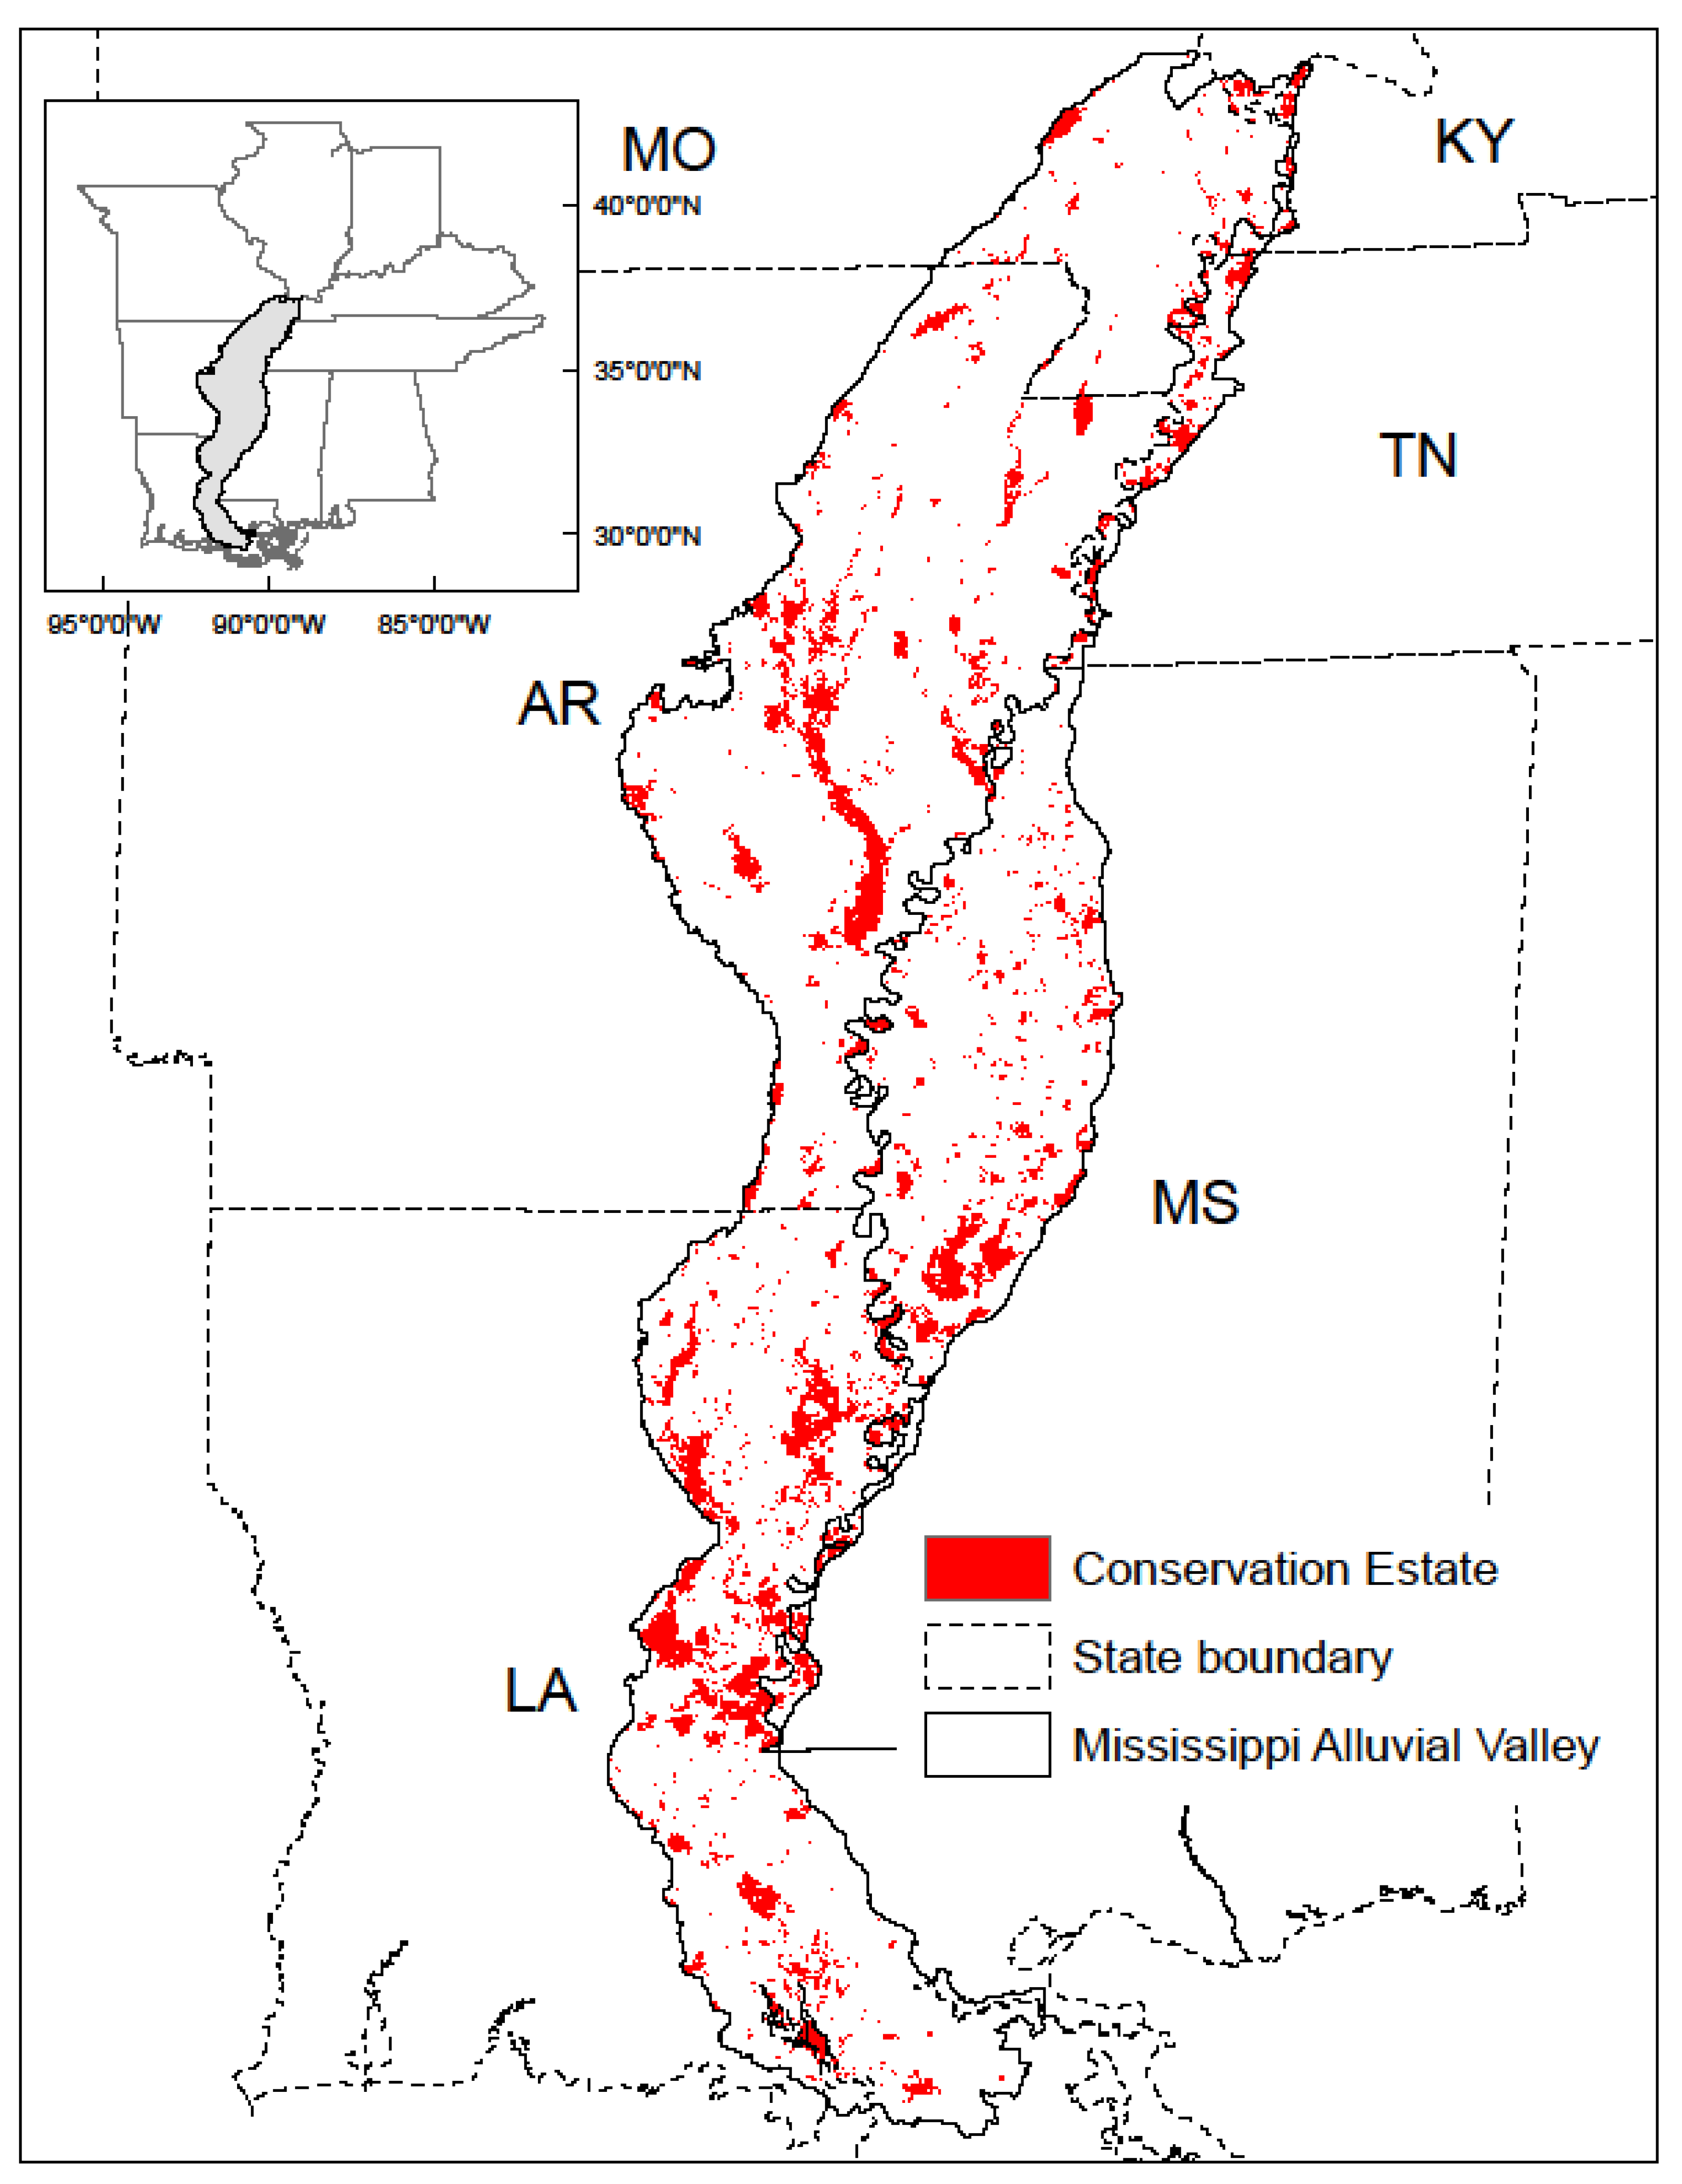
- Protected Areas Database of the United States 2.0, 2018: From the U.S. Geological Survey Gap Analysis Project, this database included public and non-profit lands and waters. Most were public lands owned in fee title, but the database also contained long-term easements, leases, agreements, and congressional (e.g., Wilderness Area), executive (e.g., National Monument), and administrative (e.g., Area of Critical Environmental Concern) designations as documented in agency management plans (https://doi.org/10.5066/P955KPLE).
- National Conservation Easement Data, 2018: A public–private partnership database of locations for more than 150,000 conservation easements and land trusts throughout the United States (https://www.conservationeasement.us/).
- Ducks Unlimited Conservation Easements, 2017: Locations for lands under conservation easement with Ducks Unlimited, Inc., a non-governmental conservation organization (https://gisweb.ducks.org/arcgis/rest/services/LMVJV_Parcel/Parcel_Private/MapServer/1).
- Wetlands Reserve Program, 2016: Location information for lands under federal conservation easements with the U.S. Department of Agriculture. These conservation easements included the Wetland Reserve Program, Wetland Reserve Enhancement Program, and Wetland Reserve Enhancement Partnership. These data are not publicly accessible.
- State Wildlife Management Areas, 2015: A Lower Mississippi Valley Joint Venture compiled database of locations for state-owned or managed wildlife conservation areas as provided by the conservation agencies of their state partners (https://gisweb.ducks.org/arcgis/rest/services/SRO/WildlifeManagementArea/MapServer/0)
- National Wildlife Refuge System, 2015: Locations of existing U.S. Fish and Wildlife Service and National Wildlife Refuges as well as designated “areas of interest” for potential future acquisition by the National Wildlife Refuge system (https://gis.fws.gov/arcgis/rest/services/FWSCadastral_Internet/MapServer/2).
- The Nature Conservancy, Louisiana Lands, 2018: Locations of lands owned or managed by the non-governmental conservation organization, The Nature Conservancy in Louisiana. These data are not publicly accessible.
2.3. Forest Patches
2.4. Conservation–Protection
2.5. Location
2.6. Hydrology
3. Results
4. Discussion
5. Conclusions
Supplementary Materials
Author Contributions
Funding
Acknowledgments
Conflicts of Interest
Disclaimer
References
- Rudis, V.A.; Birdsey, R.A. Forest Resource Trends and Current Conditions in the Lower Mississippi Valley; U.S. Department of Agriculture Forest Service, Southern Forest Experiment: New Orleans, LA, USA, 1986.
- Twedt, D.J.; Loesch, C.R. Forest Area and Distribution in the Mississippi Alluvial Valley: Implications for Breeding Bird Conservation. J. Biogeogr. 1999, 26, 1215–1224. [Google Scholar] [CrossRef]
- Mitchell, M.; Wilson, R.R.; Twedt, D.J.; Mini, A.; James, J.D. Object-based forest classification to facilitate landscape-scale conservation in the Mississippi Alluvial Valley. Remote Sens. Appl. Soc. Environ. 2016, 4, 55–60. [Google Scholar] [CrossRef]
- Pashley, D.N.; Barrow, W.C. Effects of land use practices on neotropical migratory birds in bottomland hardwood forests. In Status and Management of Neotropical Migratory Birds; Finch, D.M., Stangel, P.W., Eds.; U.S. Department of Agriculture Forest Service, Rocky Mountain Forest and Range Experiment Station: Fort Collins, CO, USA, 1993; pp. 315–320. [Google Scholar]
- Twedt, D.J.; Pashley, D.; Hunter, W.C.; Mueller, A.J.; Brown, C.; Ford, R.P. Partners in Flight Bird Conservation Plan for the Mississippi Alluvial Valley (Physiographic Area # 05). 1999. Available online: https://www.lmvjv.org/landbird-plans (accessed on 26 December 2019).
- Twedt, D.J.; Uihlein, W.B., III; Elliott, A.B. A spatially explicit decision support model for restoration of forest bird habitat. Conserv. Biol. 2006, 20, 100–110. [Google Scholar] [CrossRef]
- Watson, J.E.M.; Darling, E.S.; Venter, O.; Maron, M.; Walston, J.; Possingham, H.P.; Dudley, N.; Hockings, M.; Barnes, M.; Brooks, T.M. Bolder science needed now for Protected Areas. Conserv. Biol. 2016, 30, 243–248. [Google Scholar] [CrossRef]
- Convention on Biological Diversity. COP 10 Decision X/2: Strategic Plan for Biodiversity 2011–2020; Secretariat of the Convention on Biological Diversity: Nagoya, Japan, 2010; Available online: http://www.cbd.int/decision/cop/?id=12268 (accessed on 26 December 2019).
- Chapman, S.S.; Kleiss, B.A.; Omernik, J.M.; Foti, T.L.; Murray, E.O. Ecoregions of the Mississippi Alluvial Plain; Map Scale 1:1,150,000; U.S. Geological Survey: Reston, VA, USA, 2004. Available online: http://ecologicalregions.info/htm/map_eco.htm (accessed on 26 December 2019).
- Oswalt, S.N. Forest Resources of the Lower Mississippi Alluvial Valley; U.S. Department of Agriculture Forest Service, Southern Research Station: Asheville, NC, USA, 2013; p. 29.
- Remo, J.W.F.; Ickes, B.S.; Ryherd, J.K.; Guida, R.J.; Therrell, M.D. Assessing the impacts of dams and levees on the hydrologic record of the Middle and Lower Mississippi River, USA. Geomorphology 2018, 313, 88–100. [Google Scholar] [CrossRef]
- Keim, R.F.; Chambers, J.L.; Hughes, M.S.; Nyman, J.A.; Miller, C.A.; Amos, J.B.; Conner, W.H.; Day, J.W., Jr.; Faulkner, S.P.; Gardiner, E.S.; et al. Ecological consequences of changing hydrological conditions in wetland forests of coastal Louisiana. In Coastal Environment and Water Quality; Xu, Y.J., Singh, V.P., Eds.; Challenges in Coastal Hydrology and Water Quality, Water Resource Publications: Highlands Ranch, CO, USA, 2006; pp. 383–395. [Google Scholar]
- Gee, H.K.W. The Effect of Hydrologic Modifications on Floodplain Forest Tree Recruitment and Growth. Ph.D. Thesis, Louisiana State University, Baton Rouge, LA, USA, 2012; p. 140. [Google Scholar]
- King, S.L.; Keim, R.F. Hydrologic modifications challenge bottomland hardwood forest management. J. For. 2019, 117, 504–514. [Google Scholar] [CrossRef]
- Allen, Y. Landscape scale assessment of floodplain inundation frequency using Landsat imagery. River Res. Appl. 2016, 32, 1609–1620. [Google Scholar] [CrossRef]
- Mitchell, M.; Twedt, D.J.; Wilson, R.R.; Elliott, A.B.; James, J.D. MAV Forest Breeding Bird Decision Support Model–Update 2015; Lower Mississippi Valley Joint Venture: Jackson, MS, USA, 2015; p. 7. Available online: https://www.lmvjv.org/s/LMVJV_FBBDSM_2015_Summary.pdf (accessed on 26 December 2019).
- Chalfoun, A.D.; Thompson, F.R.; Ratnaswamy, M.J. Nest predators and fragmentation: A review and meta-analysis. Conserv. Biol. 2002, 16, 306–318. [Google Scholar] [CrossRef]
- Fletcher, R.J. Multiple edge effects and their implications in fragmented landscapes. J. Anim. Ecol. 2005, 74, 342–352. [Google Scholar] [CrossRef]
- Mueller, A.J.; Twedt, D.J.; Loesch, C.R. Development of management objectives for breeding birds in the Mississippi Alluvial Valley. In Strategies for Bird Conservation: The Partners in Flight Planning Process; David, R.B., Pashley, N., Cooper, R., Niles, L., Eds.; Cornell Lab of Ornithology: Ithaca, NY, USA, 1999; Available online: http://birds.cornell.edu/pifcapemay/mueller.htm (accessed on 26 December 2019).
- Saracco, J.F.; Collazo, J.A. Predation on artificial nests along three edge types in a North Carolina bottomland hardwood forest. Wilson Bull. 1999, 111, 541–549. [Google Scholar]
- Thompson, F.R.; Robinson, S.K.; Donovan, T.M.; Whitehead, D.R.; Faaborg, J. Biogeographic, landscape, and local factors affecting cowbird abundance and host parasitism levels. In Ecology and Management of Cowbirds and Their Hosts: Studies in the Conservation of North American Passerine Birds; Smith, J.N.M., Cook, T.L., Rothstein, S.I., Robinson, S.K., Sealy, S.G., Eds.; University of Texas Press: Austin, TX, USA, 2000; pp. 186–219. [Google Scholar]
- Joppa, L.; Pfaff, A. Reassessing the forest impacts of protection. Ann. N. Y. Acad. Sci. 2010, 1185, 135–149. [Google Scholar] [CrossRef] [PubMed]
- Saura, S.; Bastin, L.; Battistella, L.; Mandrici, A.; Dubois, G. Protected areas in the world’s ecoregions: How well connected are they? Ecol. Indic. 2017, 76, 144–158. [Google Scholar] [CrossRef] [PubMed]
- Davidson, M.; Murphy, S.M.; Ribbeck, K.; Kimmel, F.; Duguay, J. Louisiana Black Bear Management Plan; Louisiana Department of Wildlife and Fisheries: Baton Rouge, LA, USA, 2015; p. 74. Available online: http://www.wlf.louisiana.gov/louisiana-black-bear-management-plan (accessed on 26 December 2019).
- Bingham, H.; Fitzsimons, J.A.; Redford, K.H.; Mitchell, B.A.; Bezuary-Creel, J.; Cumming, T.L. Privately protected areas: Advances and challenges in guidance, policy and documentation. Parks 2017, 23, 13–28. [Google Scholar] [CrossRef]
- Mitchell, B.A.; Stolton, S.; Bezaury-Creel, J.; Bingham, H.C.; Cumming, T.L.; Dudley, N.; Fitzsimons, J.A.; Malleret-King, D.; Redford, K.H.; Solano, P. Guidelines for privately protected areas. In Best Practice Protected Area Guidelines Series No. 29; International Union for Conservation of Nature and Natural Resources: Gland, Switzerland, 2018. [Google Scholar] [CrossRef]
- Allen, Y.C. Landscape Scale Assessment of Floodplain Inundation Frequency in the GCPO; U.S. Geological Survey Data Release; U.S. Geological Survey: Reston, WV, USA, 2015. Available online: https://www.sciencebase.gov/catalog/item/5614315be4b0ba4884c610ae (accessed on 26 December 2019).
- Elliott, A.B.; Mini, A.E.; McKnight, S.K.; Twedt, D.J. Forests in the Mississippi Alluvial Valley Lacking Sufficient Conservation Protection; U.S. Geological Survey Data Release; U.S. Geological Survey: Reston, WV, USA, 2019. [CrossRef]
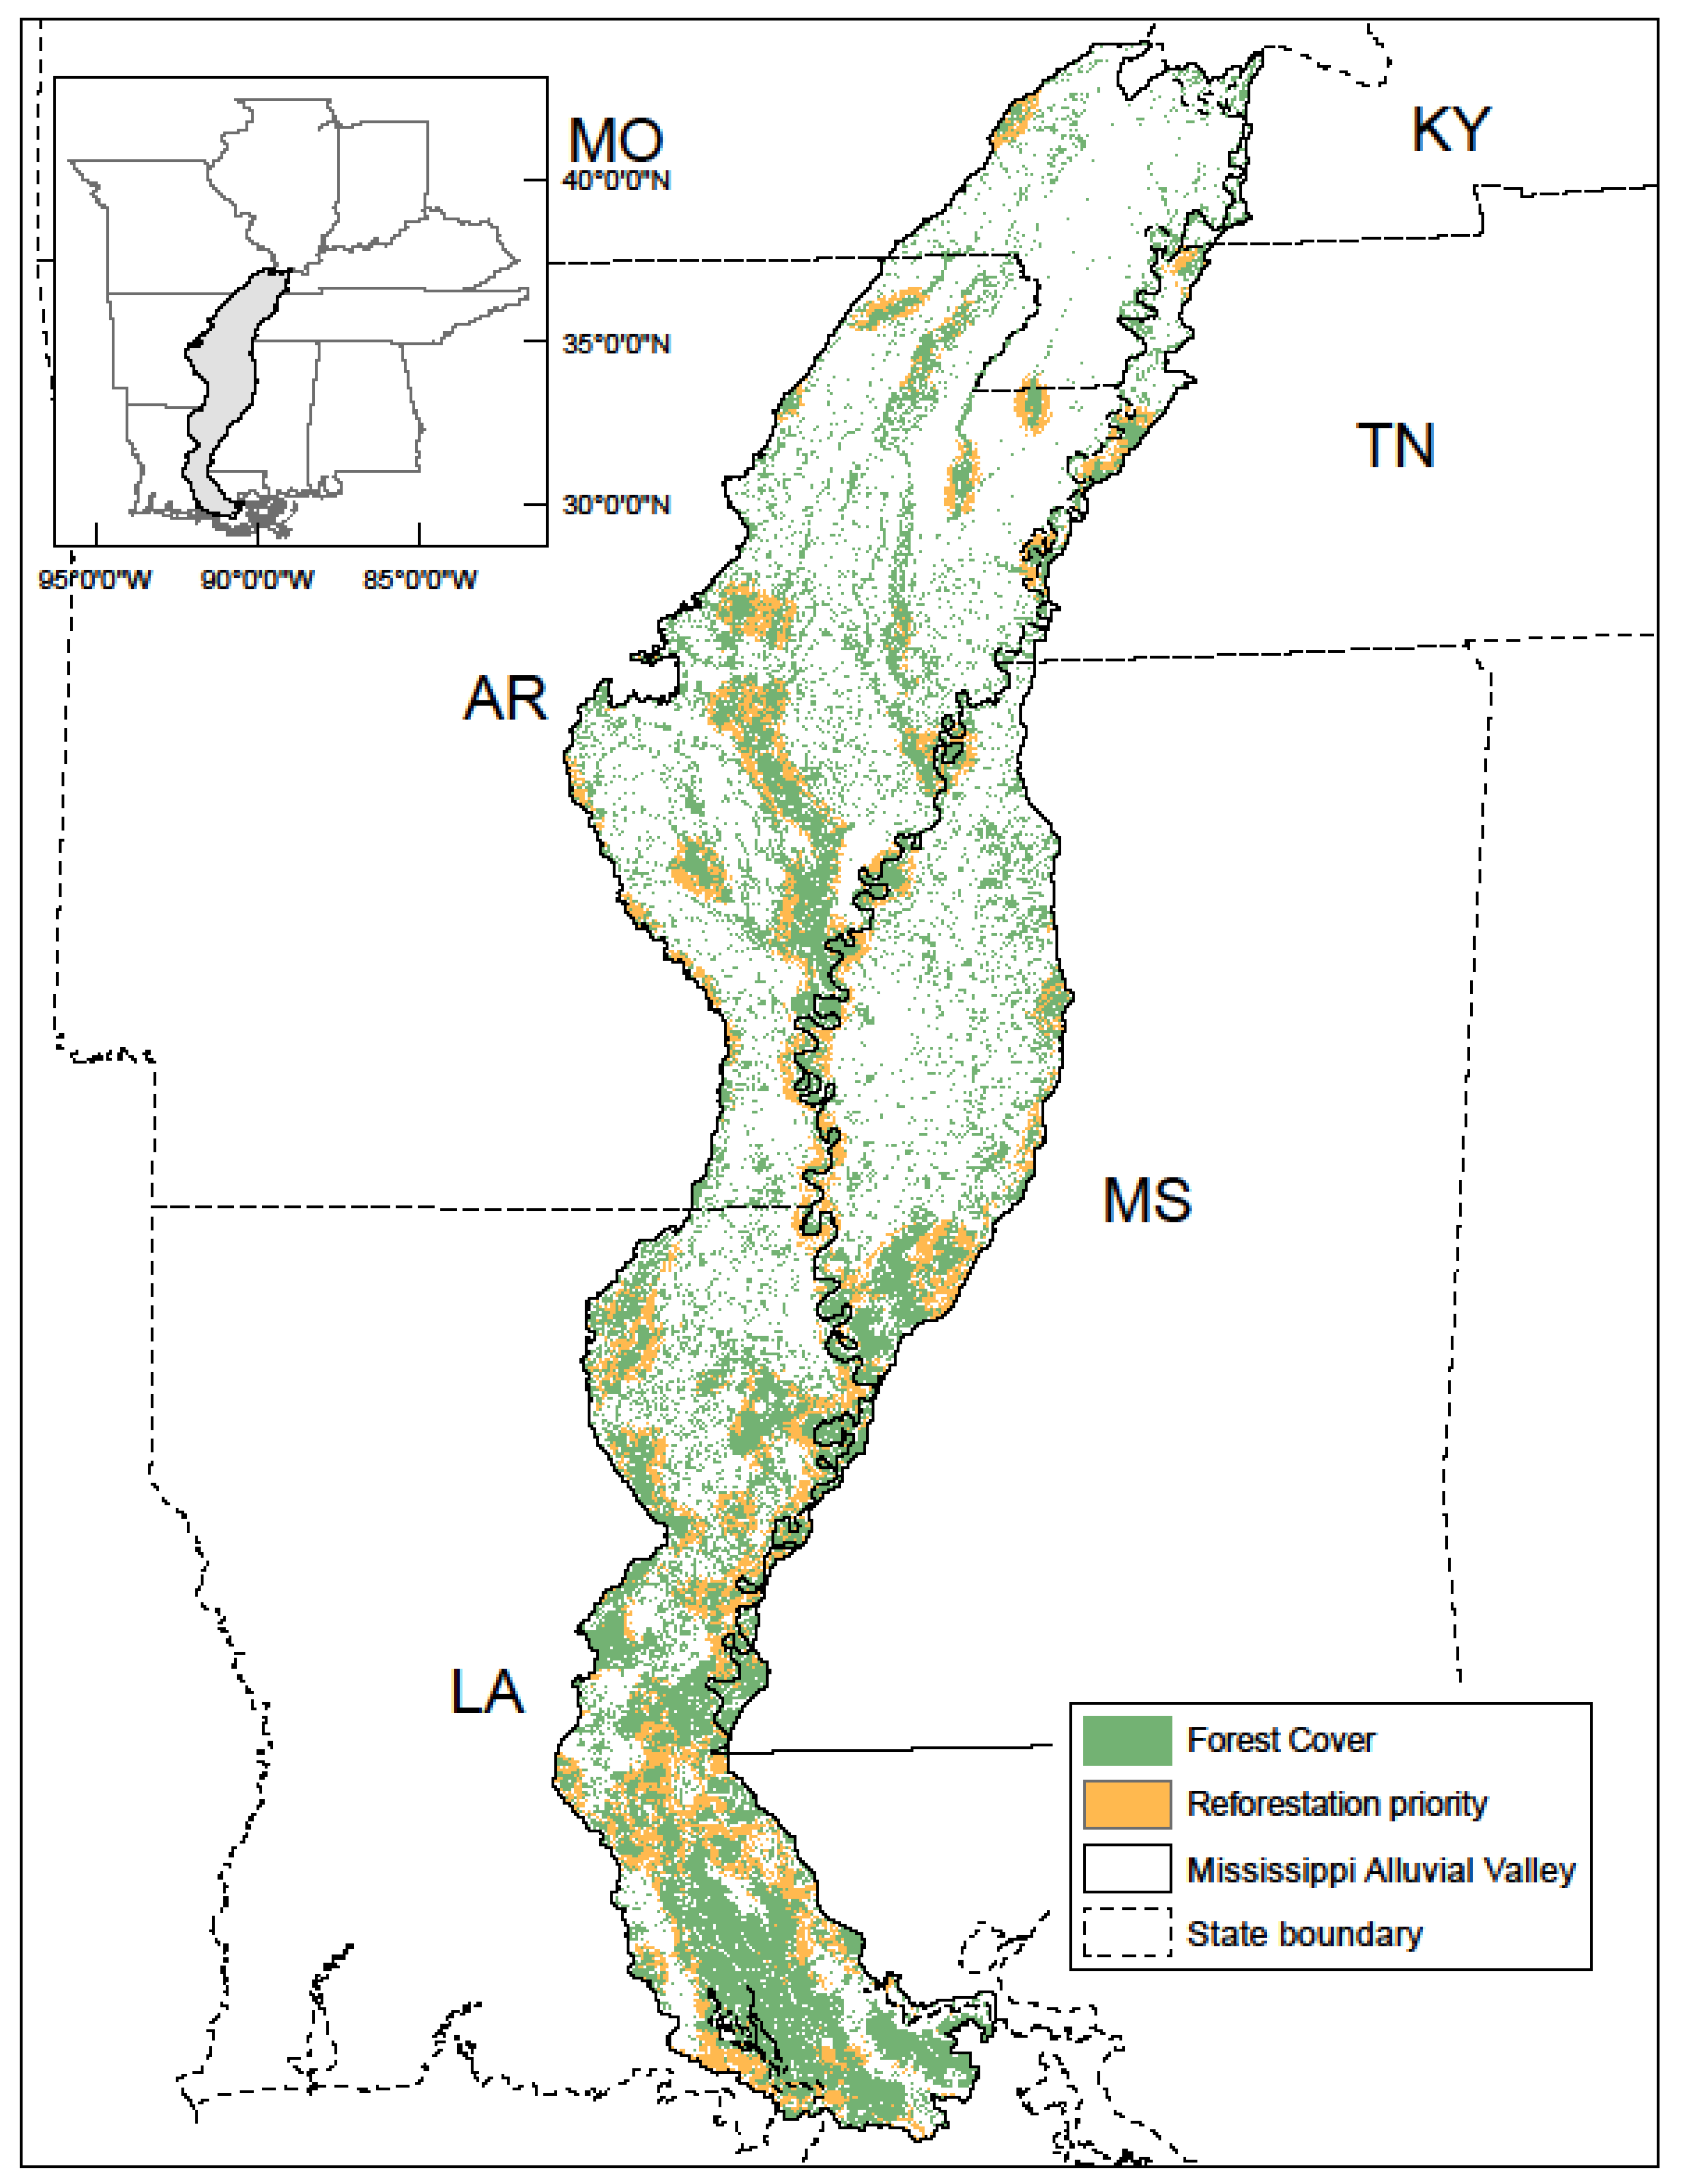
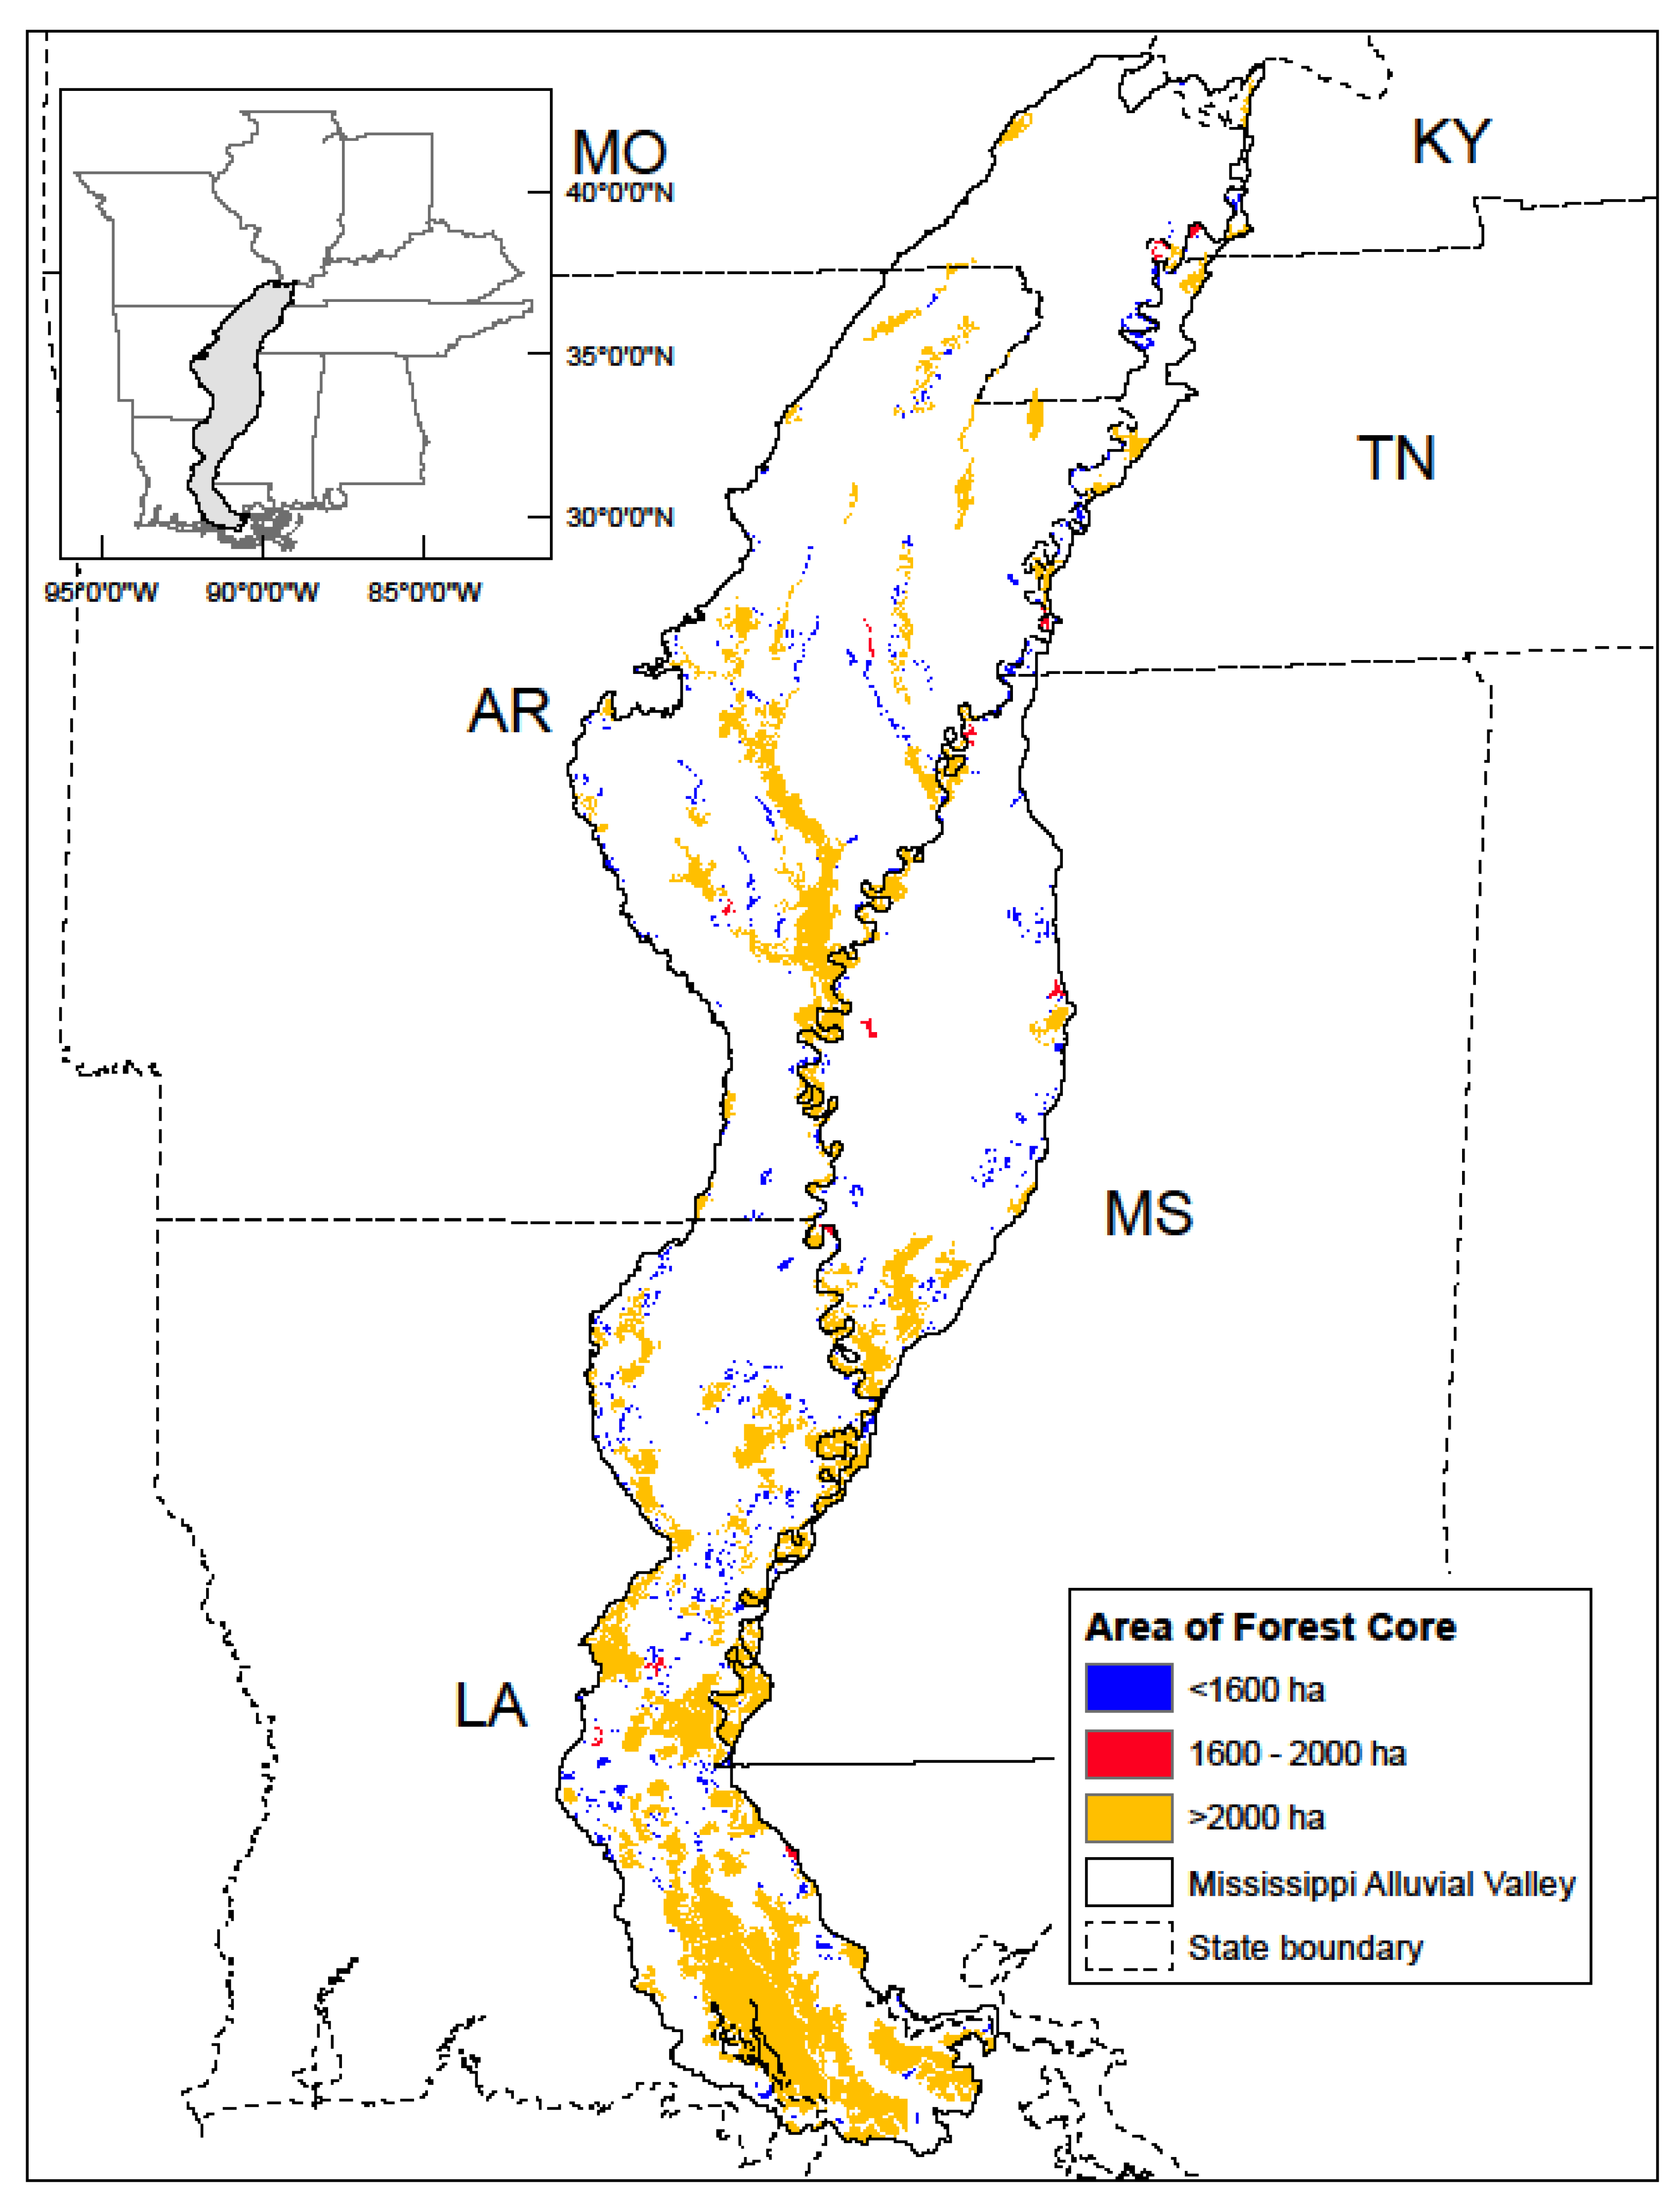
| Area (ha) | Percent of Original Core Area Conservation–Protection Value | Reforestation Zone Addition | Hydrology Addition |
|---|---|---|---|
| ≥2000 | 100% | 40% | 20% of dryness coefficient |
| 1600–2000 | 50% | 20% | 20% of dryness coefficient |
| <1600 | 0% | 20% | 20% of dryness coefficient |
| Conservation–Protection Need | Total Area (ha) | Area (ha) in Conservation Estate | Proportion of Area in Conservation Estate | Cumulative Area (ha) to Provide Complete Conservation–Protection (From Most in Need) |
|---|---|---|---|---|
| 2 | 371 | 311 | 0.84 | 1,323,272 |
| 3 | 160 | 136 | 0.85 | 1,323,212 |
| 4 | 15,465 | 14,072 | 0.91 | 1,323,188 |
| 6 | 10,106 | 9404 | 0.93 | 1,321,795 |
| 7 | 5838 | 5596 | 0.96 | 1,321,093 |
| 8 | 1011 | 953 | 0.94 | 1,320,851 |
| 9 | 14,693 | 12,529 | 0.85 | 1,320,793 |
| 10 | 7962 | 6769 | 0.85 | 1,318,629 |
| 11 | 3094 | 2057 | 0.66 | 1,317,436 |
| 12 | 8628 | 5585 | 0.65 | 1,316,399 |
| 13 | 535 | 454 | 0.85 | 1,313,356 |
| 14 | 12,758 | 8750 | 0.69 | 1,313,275 |
| 15 | 12,480 | 6789 | 0.54 | 1,309,267 |
| 16 | 8820 | 6071 | 0.69 | 1,303,576 |
| 18 | 22,296 | 14,965 | 0.67 | 1,300,827 |
| 19 | 87,473 | 8542 | 0.10 | 1,293,496 |
| 20 | 13,482 | 9525 | 0.71 | 1,214,565 |
| 21 | 3693 | 2316 | 0.63 | 1,210,608 |
| 22 | 11,732 | 8201 | 0.70 | 1,209,231 |
| 24 | 47,806 | 39,724 | 0.83 | 1,205,700 |
| 25 | 5302 | 4448 | 0.84 | 1,197,618 |
| 26 | 17,206 | 10,723 | 0.62 | 1,196,764 |
| 27 | 13,019 | 9855 | 0.76 | 1,190,281 |
| 30 | 4013 | 3083 | 0.77 | 1,187,117 |
| 31 | 18,136 | 12,754 | 0.70 | 1,186,187 |
| 32 | 8274 | 5511 | 0.67 | 1,180,805 |
| 33 | 10,425 | 6993 | 0.67 | 1,178,042 |
| 34 | 1682 | 833 | 0.50 | 1,174,610 |
| 35 | 31,466 | 19,432 | 0.62 | 1,173,761 |
| 36 | 58,741 | 41,255 | 0.70 | 1,161,727 |
| 37 | 96,216 | 66,954 | 0.70 | 1,144,241 |
| 39 | 8771 | 5819 | 0.66 | 1,114,979 |
| 41 | 5200 | 2379 | 0.46 | 1,112,027 |
| 43 | 82,826 | 49,515 | 0.60 | 1,109,206 |
| 44 | 22,468 | 12,558 | 0.56 | 1,075,895 |
| 45 | 5391 | 2455 | 0.46 | 1,065,985 |
| 46 | 14,053 | 8578 | 0.61 | 1,063,049 |
| 48 | 1447 | 117 | 0.08 | 1,057,574 |
| 49 | 5471 | 1 | 0.00 | 1,056,244 |
| 50 | 34,401 | 17,404 | 0.51 | 1,050,774 |
| 51 | 191,264 | 97,227 | 0.51 | 1,033,777 |
| 52 | 4484 | 1333 | 0.30 | 939,740 |
| 53 | 6467 | 2815 | 0.44 | 936,589 |
| 54 | 1824 | 5 | 0.00 | 932,937 |
| 56 | 41,907 | 17,458 | 0.42 | 931,118 |
| 58 | 6333 | 2330 | 0.37 | 906,669 |
| 60 | 9265 | 2859 | 0.31 | 902,666 |
| 61 | 12,571 | 4879 | 0.39 | 896,260 |
| 62 | 9355 | 428 | 0.05 | 888,568 |
| 63 | 34,378 | 13,383 | 0.39 | 879,641 |
| 64 | 19,885 | 6786 | 0.34 | 858,646 |
| 65 | 5251 | 1995 | 0.38 | 845,547 |
| 66 | 3038 | 887 | 0.29 | 842,291 |
| 68 | 54,873 | 16,071 | 0.29 | 840,140 |
| 69 | 1859 | 574 | 0.31 | 801,338 |
| 70 | 2308 | 665 | 0.29 | 800,053 |
| 71 | 2341 | 692 | 0.30 | 798,410 |
| 74 | 50,496 | 11,598 | 0.23 | 796,761 |
| 75 | 15,667 | 3548 | 0.23 | 757,863 |
| 77 | 15,841 | 3106 | 0.20 | 745,744 |
| 80 | 456,125 | 69,700 | 0.15 | 733,009 |
| 82 | 5031 | 868 | 0.17 | 346,584 |
| 84 | 8256 | 793 | 0.10 | 342,421 |
| 85 | 15,084 | 1822 | 0.12 | 334,958 |
| 86 | 90,798 | 693 | 0.01 | 321,696 |
| 87 | 1559 | 73 | 0.05 | 231,591 |
| 88 | 25,155 | 1852 | 0.07 | 230,105 |
| 89 | 18,785 | 384 | 0.02 | 206,802 |
| 90 | 41,379 | 5281 | 0.13 | 188,401 |
| 91 | 22,839 | 804 | 0.04 | 152,303 |
| 92 | 9867 | 134 | 0.01 | 130,268 |
| 93 | 34,567 | 906 | 0.03 | 120,535 |
| 94 | 61,553 | 0 | 0.00 | 86,874 |
| 95 | 4170 | 164 | 0.04 | 25,321 |
| 97 | 13,472 | 445 | 0.03 | 21,315 |
| 100 | 8297 | 9 | 0.00 | 8288 |
| Total | 2,039,255 | 715,983 |
© 2020 by the authors. Licensee MDPI, Basel, Switzerland. This article is an open access article distributed under the terms and conditions of the Creative Commons Attribution (CC BY) license (http://creativecommons.org/licenses/by/4.0/).
Share and Cite
Elliott, A.B.; Mini, A.E.; McKnight, S.K.; Twedt, D.J. Conservation–Protection of Forests for Wildlife in the Mississippi Alluvial Valley. Forests 2020, 11, 75. https://doi.org/10.3390/f11010075
Elliott AB, Mini AE, McKnight SK, Twedt DJ. Conservation–Protection of Forests for Wildlife in the Mississippi Alluvial Valley. Forests. 2020; 11(1):75. https://doi.org/10.3390/f11010075
Chicago/Turabian StyleElliott, A. Blaine, Anne E. Mini, S. Keith McKnight, and Daniel J. Twedt. 2020. "Conservation–Protection of Forests for Wildlife in the Mississippi Alluvial Valley" Forests 11, no. 1: 75. https://doi.org/10.3390/f11010075
APA StyleElliott, A. B., Mini, A. E., McKnight, S. K., & Twedt, D. J. (2020). Conservation–Protection of Forests for Wildlife in the Mississippi Alluvial Valley. Forests, 11(1), 75. https://doi.org/10.3390/f11010075


