Abstract
For several decades, there has been growing interest in highly diversified forests as a result of their management using the so-called uneven-aged silviculture. Such management and forests resulting from its application fulfil the purpose of forest ecosystem protection without significant limitation of the other forest functions and services. The usefulness of such silvicultural system depends largely on the species composition of the stand. In Poland, this system has been used primarily in silver fir (Abies alba Mill.)-dominated forests with an admixture of other shade-tolerant tree species and rather small admixture of light-demanding species. In our study, we analyzed the structure of fir-dominated uneven-aged forest consisting of a certain mix of eight tree species with different light-requirements, in which uneven-aged silviculture was performed for over two decades. The analysis of stand structure concerned three aspects of the forest structure: species diversity, spatial pattern of tree distribution, and tree size diversity. On the basis of three stand inventories, we captured the mid-term dynamics of the stand structure under moderate human pressure conditions. The results showed that the stand was characterized by high growing stock, with stable growth over the entire period. The silver fir was the dominant tree species, but the Scots pine and pedunculate oak also played an important role. However, the silver fir was abundant in the ingrowth class, whereas the pine and oak were absent or very rare in this stand strata. Noteworthy is the increasing importance of the European hornbeam, which is particularly evident in the ingrowth class; its abundance was twice that of the silver fir. The results clearly demonstrated that within 24 years, the share of light-demanding tree species in the forest clearly decreased, while that of shade-tolerant species clearly increased. Structural parameters showed a moderate tree-size diversity, despite the high species richness of the forest. This was mainly the result of selection cuttings, which clearly decreased tree-size variability after the second period of study. However, selection cuttings did not favor regeneration establishment, especially that of light-demanding tree species, whose role in the stand is assumed to be only minor in the future. The relatively high level of volume growth indicated that cutting intensity may be increased. More intense selection cuttings would also improve the stand structure by providing better light conditions for potential regeneration of different tree species, also light-adapted ones.
1. Introduction
Forest cover in Poland is estimated at 9435 thousand ha, which is 30.8% of the country’s land area. Coniferous (Scots pine (Pinus sylvestris L.), Norway spruce (Picea abies (L.) Karst.)) are predominant, accounting for 68.4% of forest area, while broadleaves (oaks (Quercus spp.), European beech (Fagus sylvatica L.), silver birch (Betula pendula Roth)) account for 23.8% [1]. Such species composition together with the structure of forest site types affects silviculture, which is based mostly on even-aged management (e.g., clear-cuts, shelterwood cuts). Most frequently, even-aged management leads to simplification and homogenization of forest structure, reflected by low species mixing, low tree size diversity, and low vertical diversity of the stand. After several decades of even-aged silviculture across Europe, it is obvious that such homogenous stand structure leads to serious problems associated with the forest stability in general (both static and biological). Alternative to even-aged silviculture is uneven-aged management, resulting in more diverse forest in terms of its structure. Complex stand structure of the forest managed according to the latter system results usually from different types of cuttings suitable for different tree species. While close-to-nature silviculture (synonymous to uneven-aged silviculture) in Europe is getting more and more interest among foresters, the area of clear-cuts is still significant.
Despite the obvious problems associated with the ecological stability of forests with a simplified structure, a common use of even-aged management results mainly from the former assumption that this type of management is economically more effective than others [2,3]. However, lots of studies show that the total yield of mixed, uneven-aged, and uneven-sized forests can be comparable or even higher than in the case of monocultures [2,3,4]. Forests with complex structure (uneven-aged and uneven-sized) are supposed to mitigate the potential climate changes to a greater extent than structurally homogenous forests. They are also characterized by better adaptation to new site conditions [5,6,7,8]. However, the failure in the use of uneven-aged management to diversify stand structures usually results more likely from a lack of consistency in performing selection cuttings of different combinations [7].
While uneven-aged silviculture is usually applied in silver fir-dominated forests, there are examples of its application in forests consisted of tree species with quite different light requirements [6,9,10,11,12,13]. In such multispecies uneven-aged forests, the combination of even-aged silviculture (small clear-cuts in gaps) with single–tree selection (uneven-aged silviculture) can be highly recommended to provide the suitable conditions for wide range of tree species, for light-adapted, mid-tolerant, and for shade-tolerant species, and to maintain them as structurally diverse forests [8,10].
In order to use this silviculture more widely in practice, it is necessary to find out its effect on structure and its dynamics in uneven-aged forests of different types. Both the length of observation period and the analysis of various aspects of the forest structure developed under the selection management system determine the strength and novelty of the presented study. The overall goal of this study was to analyze the structure and dynamics of a multispecies, uneven-aged forest that had been managed according to uneven-aged silviculture for at least the last two decades. We tested the following hypothesis: uneven-aged silviculture based on selection cuttings can result in high production stands (H1), in which trees with different growth patterns (different tree species) favor strong differentiation of stand structure in different aspects (H2). We also tested whether total growth of the mixed forest, managed according to a selection system, was dominated by dominant trees or by smaller-sized individuals (H3).
2. Methods
2.1. Study Site and Experiment Design
The study site was located in the Unieszów Forestry Range (Siemianice Experimental Forest; 15°10′50′′ N, 18°08′27′′ E; abbreviated as SFR in text) in the Central European Lowland province, in the Central Poland Lowland sub-province. The study area was within the natural range of all major forest tree species in Europe (Scots pine, pedunculate and sessile oak, common ash, European beech, Norway spruce, silver fir, and black alder). The area of the SFR belongs to the southeastern part of the Central European ecoclimatic zone. The climate can be described as warm and humid, and is determined both by oceanic and continental influences. The average annual rainfall is 630 mm, the length of the growing season 210–220 days, the average annual temperature +8.3 °C, the average temperature in January −2.3 °C, and the average temperature in July +18.4 °C.
The prevailing plant community is Galio sylvatici-carpinetum, which covers circa 38% of the forested area. The share of acidophilous oak forest (Calamagrostio arundinaceae-quercetum) is circa 23% and the share of ash-elm forest (Ficario-ulmetum) is circa 10%. Sub-Atlantic fresh pine forest (Leucobryo-pinetum) and acidophilous beech forest (Luzulo pilosae-fagetum) each cover circa 10%. The share of other potential plant communities does not exceed 5%.
The most important forest site types are fresh mixed broadleaved forest (43%) and fresh broadleaved forest (20%). The average growing stock of the nearby stands is evaluated as 313 m3 ha−1 with periodic annual volume increment of 463 m3 ha−1. Between 1993–2017, selection cuttings aiming at harvesting and regeneration were performed at 10-year cutting intervals (periods 1996–2006 and 2007–2017). Trees with permanently inhibited growth (e.g., pine) or trees showing any disease symptoms were to be removed during selection cuttings.
The forest studied is highly differentiated in terms of tree age, varying from 263 to 33 depending on the tree species. Abies alba shows the highest variability in tree age (33–263 years), followed by Quercus robur (63–188 years). Two generations of Pinus sylvestris, Larix decidua, Fagus sylvatica, and Picea abies are present. Betula pendula and Carpinus betulus show the lowest variability of age structure (only one generation is present in the stand layer).
Permanent circular plots (63) of 0.05 ha each (r = 12.62 m) were schematically laid out in the nodes of a 100 m × 50 m rectangular net (Figure 1). All of them were established 25 years ago. The total size of the forest sampled was 41.14 ha.
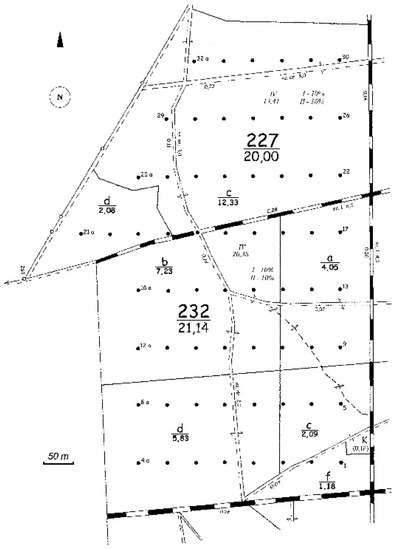
Figure 1.
Distribution of permanent circular measurement plots across the forest being sampled and located in the Unieszów Forestry Range.
Since establishment, five inventories have been carried out. The first measurements were done in 1993, and each plot was re-measured in 1996, 2001, 2006, and finally in 2017. Each time, the diameter of breast height (DBH, cm) and total tree height (h, m) were measured. The species, health status of each tree (dead, alive), and its polar coordinates were also recorded. On the basis of the data collected, different stand structural parameters and indices were determined (Table S1).
2.2. Data Analysis
Stand parameters describing the density (Nha−1), mean DBH of living trees (cm), and total basal area (G, m2 ha−1) were measured and calculated. Forest productivity was described on the basis of merchantable growing stock (m3 ha−1), as well as of the mean annual volume increment (MAI, V, m3 ha−1 year−1). We determined the number and volume of ingrowth trees (trees that reach a DBH of 7 cm in the year of measurement), and calculated the number and volume of losses. Losses resulted from natural mortality process as well as from selection felling (harvesting). We evaluated the ingrowth and losses over two periods: 1996–2006 and 2007–2017.
Non-spatial and spatial structural indices were used to describe three main aspects of stand structure: the spatial pattern of tree distribution, tree-size diversity, and species diversity and species mingling.
Species diversity and mingling were estimated on the basis of three indices. Shannon’s species diversity index (SSP) and its standardized species evenness index (Esp) were used to describe forest diversity in terms of species, and spatial mingling (SM) was used to find out how different tree species were intermingled in the stand. The higher the value of SSP, SM or Esp, the higher the species diversity of the forest [14].
The spatial distribution of trees was described on the basis of the Clark-Evans index (abbreviated as CE), and three main distribution patterns (depending on the index value) were distinguished: for CE = 1, trees were distributed at random; for CE < 1, trees formed clusters; and for CE > 1, trees were regularly dispersed across the space. Deviations from CE = 1 were determined on the basis of 199 Monte Carlo simulations [15].
Tree-size diversity was described using the non-spatial Gini index (GI) and the spatial Füldner’s diameter differentiation index (TD). Both can reach positive values from 0 to 1; the higher the value of the index, the more tree-size diversity can be observed. The Gini coefficient measures size hierarchy (size inequality) and can be used to describe tree-size diversity at the stand level. Being a spatially inexplicit index, it provides information on population scale. The TD index is a spatially explicit measure, and thus, provides information on size diversity on a small spatial scale, namely among the nearest neighbors [3,14]. Formulas for indices calculations are included in Supplementary Materials (Table S1).
2.3. Tree Height-Diameter Curve
On the basis of height measurements of sample trees, we constructed height-DBH curves (species-specific) using Prodan’s function:
where a0, a1, and a2 are the estimated parameters, and dbh is the diameter at breast height (cm).
Merchantable Growing Stock, Volume Increment and Mean Annual Volume Increment MAI (m3)
Merchantable volume (m3) was estimated according to the following function:
where a, b, and c are the estimated parameters.
The volume increment (Vinc) and mean volume annual increment (MAI) were determined over two periods, 1997–2006 and 2007–2017, according to the following formulas:
where Vt—volume at the end of the period, N—volume of losses (cuts), Vt−1—volume at the beginning of the period, and D—volume of ingrowth.
Ingrowth number and ingrowth volume were estimated for 1 ha (m3 ha−1).
2.4. Growth Dominance
Apart from stand parameters and structural indices, we calculated the growth dominance index (GD)—a concentration measure based on the Lorenz curve [16,17]. The index describes the growth distribution of trees in relation to their size, and can therefore be a quantitative means for determining stand structure [18]. It indicates whether larger or smaller trees dominate the growth of the stand, showing the contributions of trees of different sizes to total forest (population) growth [19]. It is calculated from the formula:
where: n—number of trees, BA—cumulative basal area, and Δ—cumulative basal area increment. The GD index can reach values from −1 to +1, and corresponds to the growth dominance curve, thus describing the growth model of the forest according Binkley et al. [17]. The growth dominance curve follows a 1:1 line in case of neutral dominance (a line of equality), i.e., all trees have the same share of stand growth as they do stand mass. If the growth dominance curve lies above the 1:1 line, it suggests a relatively low growth rate of larger trees that account for a smaller portion of stand growth than stand mass; this is called negative growth dominance (or reverse growth dominance). In this case, smaller trees account for a greater proportion of the stand growth than of stand biomass. If the growth dominance curve lies below the 1:1 line—which is called positive growth dominance [17,20]—then larger trees account for more of the stand growth than stand mass. We calculated the general GD index (all living trees pooled together) and species-specific GD index for two periods: 1993–2006 (period 1) and 2006–2017 (period 2). Calculations were done in R environment [21].
3. Results
3.1. Stand Parameters and Their Dynamics over the 24-Year Period
The relative density, relative basal area, and diameter characteristics of tree species over the time period studied are presented in Table 1 and Table 2.

Table 1.
Changes in density (TPH), basal area (BA), relative density (Nrel), and basal area (BArel) in the multispecies, uneven-aged forest in 1993, 2006 and 2017.
Table 2.
Mean diameter, standard deviation (± SD), min-max values, and coefficient of variation (CV) of tree species present in the multispecies, uneven-aged forest in 1993, 2006 and 2017.
Over the 24-year period, the dominant tree species in the forest was the silver fir (Aa), observed for both tree number (Nrel) and basal area (BArel). The second important tree species was the Scots pine, followed by the pedunculate oak. The other tree species showed clearly lower values for both parameters. Clear change over the 24 years was observed for the Scots pine (Ps) and hornbeam (Cb), which changed according to opposite trends. In case of the pine, there was a clear decrease in relative abundance and basal area. In case of the hornbeam, there was an increase in both parameters (Table 1). A decreasing trend similar to that of the Scots pine was observed in case of the Norway spruce. Other tree species showed minor changes. The most stable condition was exhibited by the oak, whose share changed only slightly over the entire period. The diameter structure of all living trees, pooled together irrespective of tree species, showed a reversed-J shape (Figure 2).
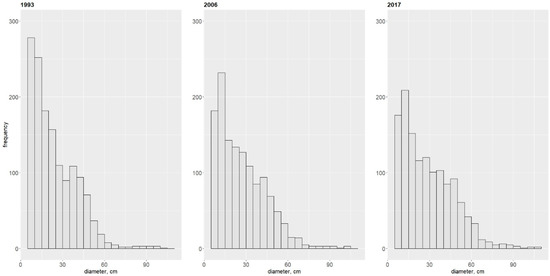
Figure 2.
Diameter structure for all living trees present in the multispecies, uneven-aged forest in 1993, 2006 and 2017.
Analysis of diameter structures for particular tree species showed clear differences in the shape of diameter structure (Figure S1, Supplementary Material). The shape most similar to that shown in Figure 2 was observed for the silver fir (Aa), pedunculate oak (Qr), and Norway spruce (Pa).
The diameter structure of the hornbeam was similar to a reverse-J shape in 2006 and 2017. The Scots pine showed a diameter structure typical for an even-aged stand, similar to the Gaussian distribution. Other tree species showed two maximums depending on the diameter size class.
A statistical description of tree diameters of particular tree species is presented in Table 2 and Figure 3.
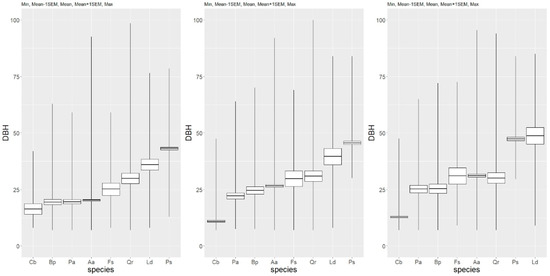
Figure 3.
Boxplots for the diameter of tree species present in the multispecies, uneven-aged forest in 1993, 2006, and 2017 (from left to right) (ascending order).
The smallest mean diameter was exhibited by the hornbeam (Cb), and the highest by the Scots pine (Ps) and European larch (Ld). In 1993, the mean diameters for the common birch (Bp), spruce (Pa), and fir (Aa) were similar, and slightly higher than for the hornbeam. The beech (Fs), pedunculate oak (Qr), and larch (Ld) exhibited a clearly higher value of DBH. In the following years, the mean DBH increased for most tree species except the hornbeam. At the end of the observation period, the largest mean DBH was exhibited by the pine and larch. The maximum tree diameter over the period was exhibited by the oak (Table 2). Diameter diversity measured by the coefficient of variation (cv) was lowest for the Scots pine (17%–18%), and highest for the oak (78%–84%). Other tree species showed relatively moderate variability of diameter (Table 2).
3.2. Growing Stock of Merchantable Timber and Volume Increment
The average growing stock (V) at the beginning of the research was 449 m3 ha−1; after 24 years, it had increased to 586.8 m3 ha−1 (Table 3). Over the 24-year period, the highest volume of merchantable timber was observed for the fir, pine, and oak, while the lowest growing stock was observed for the birch and hornbeam.
Table 3.
Growing stock (V) and mean annual volume increment (MAI) by tree species in the multispecies, uneven-aged forest over 24 years.
In the analyzed period, timber volume increased for the fir and all broadleaved tree species (the oak, beech, birch, and hornbeam), but decreased for other conifers (Table 3, Figure 4).
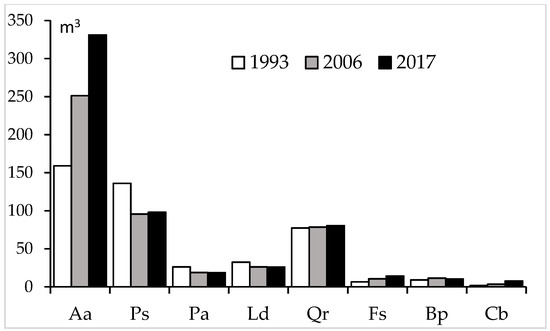
Figure 4.
Changes in growing stock (V, m3) over the investigated period by tree species present in the multispecies, uneven-aged forest located in the Unieszów Forestry Range.
The mean annual volume increment (MAI) over the entire period was 11.26 m3 ha−1 year−1. In two 10-year periods, the MAI showed only slight change: MAI2006–1996 = 12.44 m3 ha−1 year−1 and MAI2007–2017 = 11.29 m3 ha−1 year−1 (Table 3). Over the 24-year period, the highest (and relatively stable) MAI was observed for the fir (Table 3). For other tree species, the MAI was clearly lower and rarely exceeded 1 m3 ha−1. The MAI was a little bit higher in the first analyzed period (1996–2006). It increased from 2007–2017 in comparison to the first period only in case of the fir, beech, and hornbeam (Figure 5). In case of the hornbeam, the MAI calculated in 2007–2017 was twice as high as in 1996–2006, and in case of the pine, spruce, larch, and birch, it was twice as low as in 1996–2006.
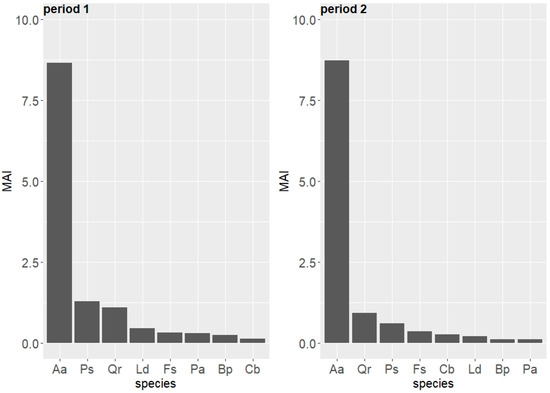
Figure 5.
Species-specific mean annual volume increment (MAI, m3 ha−1 y−1) in two periods (period 1: 1996–2006 and period 2: 2007–2017) in the uneven-aged forest located in the Unieszów Forestry Range.
3.3. Ingrowth and Losses
The number and volume of ingrowth and losses over both 10-year periods by tree species is presented in Table 4. In terms of number of losses, the highest was observed for conifers (Aa, Ps, Pa), in particular the fir. The pine and spruces showed a significantly smaller number of losses during the first period (Table 4, Figure 6). The trend was similar for volume of losses—the Scots pine showed the highest, followed by the oak, fir, and spruce. Other tree species showed much lower numbers.
Table 4.
Number (nha−1) and volume (v, m3 ha−1) of species-specific losses and ingrowth over both periods (1996–2006 and 2007–2017) in the multispecies, uneven-aged forest.
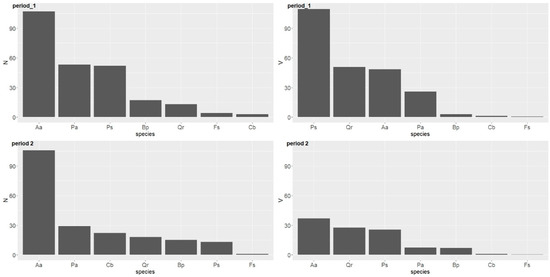
Figure 6.
Number (nha−1) and volume (m3 ha−1) of losses by tree species over two periods in the uneven-aged forest located in the Unieszów Forestry Range.
During the second period, the fir experienced the highest losses in terms of number and volume (Figure 6). The oak and pine showed a similar volume and had a similar number of trees removed. Other tree species were removed to a lesser extent (Table 4).
Ingrowths were practically dominated by two species: the hornbeam and fir. The highest number was observed in case of the hornbeam, while the silver fir showed the highest volume of ingrowth (Table 4, Figure 7). Other tree species showed much lower numbers of ingrowths, with the oak having the highest.
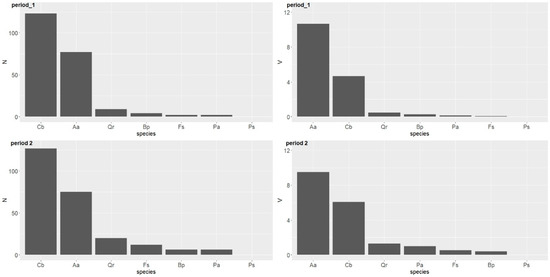
Figure 7.
Number (ha−1) and volume (m3 ha−1) of ingrowths by tree species over two periods in the uneven-aged forest located in the Unieszów Forestry Range.
In both periods, no ingrowths were found in case of the Scots pine. In the years 2007–2017, the number of ingrowths was slightly higher for other tree species.
3.4. Change in Stand Structural Indices over the 24-Year Period
3.4.1. Non-Spatial Indices
Species diversity—Shannon Species Diversity Index (SSP) and Species Evenness Index (Esp)
Species diversity based on Shannon’s index SSP as calculated for the whole control unit showed only minor dynamics over the two decades of observation. The index steadily increased with age (Figure 8), indicating an increase in species diversity. Variation in the SSP index across measurements is presented in the supplementary material (Figure S2, Supplementary Material).
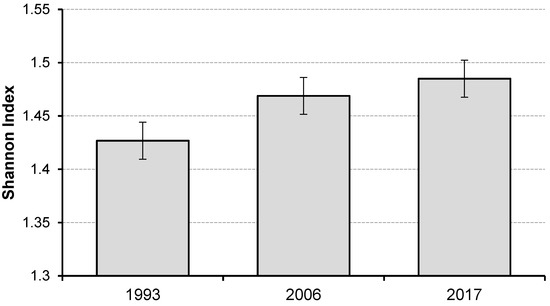
Figure 8.
Change in mean values (and sample error) of Shannon species diversity SSP index over the 24-year period in the multispecies, uneven-aged forest.
In case of the species evenness index (Esp), the general trend is similar to that observed for the SSP. The slight increase of Esp with age was a result of the more even distribution of tree species. It achieved values ranging from 69% to 71% at the beginning and the end of the investigated period, respectively.
Tree Size Inequality—Gini Index (GI)
The mean value of the GI index, which describes the diversity of trees in respect of their diameter, achieved a similar number over the whole investigated period (Figure 9). We found no statistical difference in GI index over the examined period. The variation in GI index across measurements from different inventories is presented in the supplementary material (Figure S3, Supplementary Material).
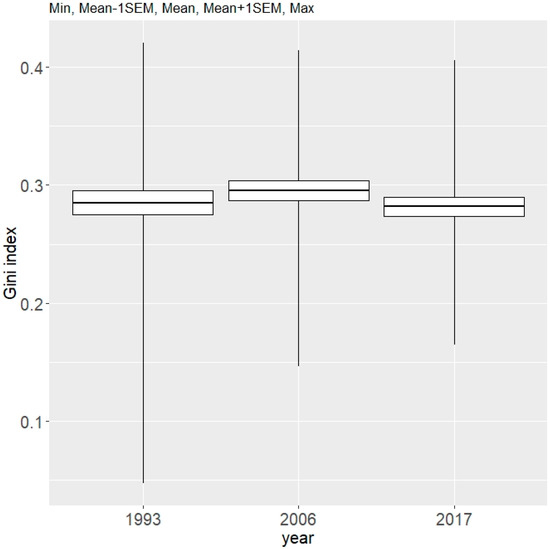
Figure 9.
Mean values of Gini index (describing tree diameter inequality, regardless of tree species) for data from the 1993, 2006, and 2017 inventories conducted in the Unieszów Forestry Range.
Analysis of species-specific GI index indicated that the highest value over the 24-year period was for the silver fir (Figure 10). In 1993 and 2006, the beech took second place (GI = 0.14 and GI = 0.15), followed by the other tree species. At the beginning, the lowest GI index was observed for the hornbeam (GI = 0.03). In 2017, the lowest GI index was observed for the birch and pine, while for the hornbeam the GI index clearly increased to 0.11 (Table S2, Supplementary Material).
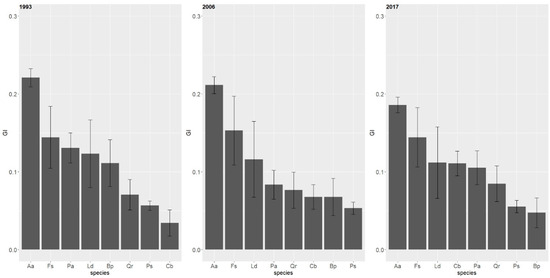
Figure 10.
Species-specific mean value of Gini index (whiskers = standard error) for different years of observation in the multispecies, uneven-aged forest located in the Unieszów Forestry Range.
The inequality of diameter in case of the firs decreased with age, and a similar trend was observed for the birch and spruce. A clear increase in GI index is visible in case of the hornbeam, and in case of the other tree species, the GI index was rather stable (Figure 10). Variation in GI index, expressed by the coefficient of variation, was the smallest for the fir (40%–43%), and highest for the pedunculate oak (169%–183%). Species-specific values of the GI index are presented in Table S1 (Supplementary Material).
3.4.2. Spatial Indices
Spatial Positioning of Trees and Tree Species—Clark-Evans Index (CE)
The combined mean value of the CE index, calculated for all living trees, was around 1, and this value was slightly exceeded in 2006 (Figure S4, Supplementary Material). This indicates that the trees tended to be randomly distributed. The spatial positioning of particular tree species was much more diversified.
The lowest level of the CE index at the beginning of the investigated period was for the birch (CE = 0.76), followed by the larch (CE = 0.89) and oak (CE = 0.93). Values lower than 1 indicated a slight tendency towards clumping. The pine, fir, and spruce were characterized by an average CE index very close to 1, indicating that their spatial patterns did not deviate from randomness (Figure 11).
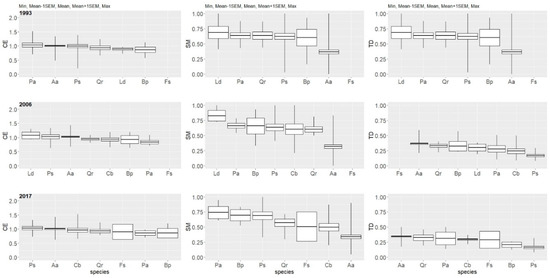
Figure 11.
Species-specific indices of spatial positioning, spatial mingling, and spatial diameter differentiation for specified years in the multispecies, uneven-aged forest located in the Unieszów Forestry Range.
In 2006, the average CE index for almost all tree species increased, with the exception of the Norway spruce, for which the index dropped to CE = 0.84—the lowest value among all species. Besides the spruce, a relatively small value of CE was observed for the birch (CE = 0.92) and oak (CE = 0.95). In 2006, for the first time, the number for the hornbeam was sufficient to conduct an analysis. The average CE index for this tree species reached a value of CE = 0.94. The highest CE index in this year was observed for the larch (CE = 1.07) (Figure 11).
In 2017, the average value of the CE index, in comparison with the value in 2006, decreased for the fir, beech, birch, and oak. The increase of the CE index has already been stated for the hornbeam and spruce; in case of the Scots pine, the value of the CE index did not change (Figure 11). In case of the larch, the number of trees dropped to a level that did not allow for reliable analysis.
Spatial Mingling of Tree Species—SM Index
The mean value of the SM index over the analyzed period did not differ significantly and indicated a moderate spatial mixture of tree species (Figure S4, Supplementary Material).
At the beginning, the European beech achieved the highest SM index (SM = 0.81), while the lowest SM index was achieved by the silver fir (SM = 0.36). Other tree species achieved values more or less similar to each other, varying from 0.58 to 0.64 (Figure 11).
In 2006, the average SM index dropped for the fir and beech (this was especially pronounced in case of the latter). For other tree species, the SM index increased slightly, most of all for the larch (SM = 0.91). In case of the hornbeam, the value of the SM index reached SM = 0.60 (Figure 11).
In 2017, the average SM index increased in comparison with 2006 for five tree species (Aa, Ps, Bp, Fs, and Pa) but decreased for two species—the oak and hornbeam (Figure 11). Average SM index values are presented in Figure S4 (Supplementary Material).
Tree Diameter Diversity—TD Index
The mean value (stand level) of the TD index, which describes the diversity of diameters among the nearest neighbors, was relatively high at the beginning of the study (TD = 0.49), and decreased significantly in subsequent periods of observation, reaching a value of TD = 0.31 in 2017 (Figure S4, Supplementary Material).
At the beginning, the lowest differentiation index was observed for the beech (TD = 0.24) and fir (TD = 0.37). The highest TD index was achieved by the larch (TD = 0.69), followed by the spruce (TD = 0.64), oak (TD = 0.64), and pine (TD = 0.62) (Figure 11. In 2006, the TD index decreased for each tree species. The highest TD was observed for the beech (TD = 0.44), followed by the fir (TD = 0.36). The oak and birch demonstrated similar values of this index (TD = 0.33). In case of the larch, the index dropped from 0.69 to 0.30. The lowest TD index was achieved by the pine (TD = 0.17). In case of the hornbeam, the average TD index reached a value of TD = 0.24 (Figure 11). In 2017, the stand-level TD index was closer to that from 2006. For some species, the value of the TD index slightly decreased; an increase was observed only for the hornbeam (TD = 0.30) and spruce (TD = 0.31). In case of the Scots pine, the index was the same as in 2006 (Figure 11).
Mean values of the TD index for each tree species are presented in Figure S5 (Supplementary Material).
3.5. Growth Dominance
The index of growth dominance (GD) indicated that over the whole investigated period, smaller trees most influenced the stand-growth increment (measured by the basal area). This was shown by a negative GD index, which during the first 13 years was GC = −0.31, and over the next 10 years dropped to GC = −0.25 (Figure 12). The growth dominance curve for all trees pooled together is symmetric.
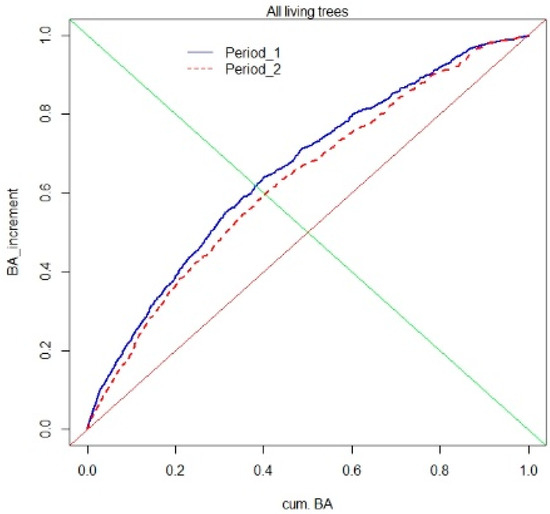
Figure 12.
Growth dominance curves for the multispecies, uneven-aged forest, calculated for the basal area (BA) of all trees in both periods of observation.
Most of tree species showed a similar reverse growth dominance pattern, with the only exception being the Scots pine, which showed small positive growth dominance, but only during the first analyzed period (1993–2006). This means that in case of most tree species, the contribution of smaller trees to the total stand growth was higher than the contribution of dominant trees.
In contrast to analysis of all trees as a whole, species-specific analysis showed an asymmetric growth dominance curve, with a shift towards the right-hand side of the curve as age increased. The most pronounced shift can be observed for the Norway spruce. However, the main tree species—the silver fir—demonstrated a practically symmetric growth dominance curve over the two decades.
Species-specific growth dominance curves are presented in Figures S6 and S7 in the Supplementary Material.
4. Discussion
4.1. Demographic Stand Parameters and Their Dynamics
Most forests managed according to selection system consist of shade-tolerant tree species, with a small admixture of light-adapted species. Our results showed that over the 24-year period, the total tree density decreased slightly. Simultaneously, the total basal area as well as growing stock clearly increased with a stable and relatively high annual volume increment (MAI) of 11–12 m3 ha−1 year−1 over the entire period. This corroborates the earlier observations [22]), pointed out that the growing stock of uneven-aged forests on fertile sites should be over 400 m3 ha−1. However, tree density, basal area, and growing stock can vary significantly in forests managed according to the selection system depending on their location [10]. Similar density and total basal area were reported in uneven-aged forests consisting of shade-tolerant tree species in Serbia, with the highest proportion of silver fir [23]. In other forests located in Bosnia and Herzegovina [24], tree density was, in turn, much higher than in our study, but growing stock (498 m3 ha−1 and 664 m3 ha−1) was more similar. Significantly lower density was found in a mixed primeval forest composed of similar tree species, but a basal area similar to that from our study (circa 35 m2 ha−1) [25]. Jaworski et al. [9] reported that the tree density of silver fir-dominated uneven-aged forests in southern Poland varied from 492 to 774 TPH, and in relation to basal area it varied from 31 to 45 m2 ha−1. They found highly diversified growing stock, ranged from 384 to 628 m3 ha−1. Our results generally confirmed the supposition that species composition of forests treated with selection system is dominated by shade-tolerant tree species and that dominance will be rather maintained. Other tree species, including light-demanding species, form an admixture but in different proportions [9,10,25]. While the selection system seems to be especially suitable for shade-tolerant species, there are some examples of implementation of this system in forests consisting of light-adapted species. Such forests are usually characterized by smaller tree density, lower basal area, and relatively low growing stock [12,26].
The species-specific analysis presented in our study showed that the main tree species—over the two decades of observations—was the silver fir. However, at the beginning, the share of light-demanding tree species, i.e., the pine, oak, larch, and birch, was about 56% of the total basal area, and 31% in terms of relative abundance. From this group, the Scots pine was dominant, followed by oak. At the same time, shade-tolerant species (fir, spruce, beech, and hornbeam) accounted for about 44% of total basal area, but 69% in terms of abundance. Over the 24-year period, the share of shade-tolerant tree species significantly increased in abundance, and total basal area. The proportion of light-demanding species significantly dropped in relation to both parameters. In general, the share of basal area decreased for almost all tree species; most of these were light-demanding tree species. Most shade-tolerant species increased their share in basal area, except for spruce and beech. The silver fir showed the highest growth, followed by the hornbeam and beech, while the pine showed the greatest decrease. The observed change in stand demography resulted mainly from harvesting aiming to remove large, economically valuable, trees (mostly pine, oak and fir, spruce). Gaps created by removals are usually filled up by young generations due to favorable light condition in the forest floor. Our results showed that silver fir and hornbeam were the winners. Light-adapted tree species regenerated in rather small numbers. It indicates that the selection cutting conducted over the examined period were favorable for shade-tolerant tree species but not light-adapted ones. Our results showed that the expansion of the hornbeam influenced the most demographic relations in the forest during the study period. This tree species showed a nearly six-fold increase in basal area and a nearly 18-fold increase in abundance throughout the study period. Thus, on the basis of our findings, we can make assumption that the species composition of the forest in the future will result mainly from the expansion of this tree species and—to a certain extent—from human interventions controlling the mixing of different tree species. Favorable conditions for the hornbeam in the absence of human activity have been reported in [27]. Other studies stated that the persistence of shade-tolerant, mid-tolerant, and shade-intolerant tree species is possible in uneven-aged forests for two main reasons: one is the fact that these groups of species may occur in different stand layers; the other is human interventions controlling the mixing of different groups of species [10]. As results showed, more light-adapted tree species tend to avoid the neighborhood of shade-tolerant tree species, but can survive around species with similar light requirements [10]. The dominance of the hornbeam seems to not benefit the potential regeneration of other tree species (including the silver fir) due to its strong shading of the forest floor and its impact on their regeneration. However, as far as we know, this role is poorly understood. We therefore assume that the presence of light-demanding species in the stand is rather highly threatened, especially in case of limited human intervention [27]. The positive effect of silvicultural treatments done in the first period can be seen in the following years (2007–2017), when the number of ingrowths of other tree species slightly increased. Other studies showed that in an uneven-aged forest, the silver fir usually is the most abundant species, and species such as the beech, spruce, larch, and pine can constitute a valuable admixture [9]. Keren et al. [23] demonstrated a slight increase in the relative abundance of the fir, and a decrease in the abundance of the beech and spruce over a 50-year period. They also indicated that the share of more light-demanding tree species (Acer pseudoplatanus) increased slightly. Our results are therefore in contradiction with their results, as our results show a rather clear decrease of light-demanding tree species in the species composition of a forest managed according to selection system. Success in fir regeneration was demonstrated by Petritan et al. [13] in a virgin forest in the southern Carpathians in Romania.
4.2. Structural Diversity and Forest Structure Dynamics
Over the two decades, the species richness did not change, but the share of species showed a certain change due to demographic processes and human interventions. Different structural measures (SSP, Esp) showed that uneven-aged forest, subject to selection cuttings, can demonstrate relatively high species diversity. We observed that over the two decades, the value of both indices measuring species diversity increased. We found that species mingling (SM) was relatively high over the entire period; however, a slight decrease in the average stand value of this index with age was visible. In this aspect our results were similar to those obtained for the Dinaric Mountains [24]. Moreover, we demonstrated that silver fir showed the lowest mixing over the entire period, which means its neighborhood was more homogeneous. Additionally, the hornbeam showed a similar trend, which supports our expectation of a potential codominant role for this tree species in the species composition of the future stand. Homogeneous patches of these tree species can be rather unsuitable for regeneration of light-demanding tree species, while the opposite is possible. Other tree species showed a higher value of the mixing index, indicating that their neighborhoods are more diverse and that their distribution is scattered in the stand. The neighborhood configuration plays, therefore, an important role in creation of suitable niche for tree species of different light requirements.
The future of tree species can also be inferred from the species-specific diameter structure curve. Our results confirmed a reverse J-shape of diameter distribution in general (for all living trees), which has been frequently reported in literature [7,9,10,23,25,28]. Such a shape of diameter structure is usually treated as synonymous of uneven-aged structure and is an indicator of a highly structured forest. Our results confirmed this overall statement for the analyzed forest. While studying species-specific diameter distributions, we found that only silver fir, pedunculate oak, Norway spruce, and to some extent European hornbeam showed similar (reverse J-shaped) distributions. These tree species therefore have the most influence on overall forest structure and more likely they will affect the future development of the forest. In contrast, Scots pine showed diameter distribution typical for even-aged stands and, as we assume, will play only a minor role in the future, due to its insufficient regeneration.
Size structure of the forest can be also inferred from various structural indices. In general, the variation in tree diameter of the studied forest was at last moderate. It was indicated by relatively small values of the Gini coefficient (<0.3). As indicated by other authors, low—and similar to ours—values of the GI are typical for even-sized stands [25,29,30]. Klopcic and Boncina [31] reported GI values twice as high for mixed silver fir-European beech forests in Slovenia. Threshold GI values higher than those presented here (for distinction of diversified and homogenous forests) were observed by [28,29]. The silver fir exhibited the highest GI values over the entire period, indicating that its inequality in diameter was higher than that of other tree species. Moderate diversity of tree sizes was also indicated by spatial diameter differentiation index (TD), describing tree size configuration at the neighborhood scale. This stand structural parameter clearly decreased with age, and was more distinct during the second and third inventories. Species-specific analysis revealed higher tree size diversity around different tree species. At the beginning, the most diversified in respect of tree diameter was the neighborhood of the larch, followed by the spruce, oak, and pine. A more homogenous neighborhood was initially around the silver fir. Over the 24-year period, the average TD index clearly decreased for each tree species, suggesting the presence of a kind of mechanism that balances diameter diversity among the nearest neighbors. Such a mechanism may be management activities aimed at creating more space for ingrowth by removing large trees—mostly pines, oaks, and spruces. For these species, the decrease in TD value was the strongest. At the end of the study, the silver fir showed the highest TD index of all tree species, which indicates increasing variation in diameter at the neighborhood as a result of the cuttings of large trees aiming at the creation of more space for silver fir upgrowth. Relatively high values of the TD index in uneven-aged forests was reported from the Dinaric Mountains [24].
The spatial pattern of trees in general did not deviate from randomness over the two decades. This type of spatial pattern has been frequently reported in old-growth forests [2,11,13,32,33]. Species-specific analysis pointed to a similar pattern for most tree species. Trees of larger diameters showed slightly higher values of the CE index, while trees smaller in size showed smaller values of this index. This general trend was frequently reported in studies of uneven-aged forest dynamics. As an example, Bartkowicz and Paluch [10] found that large trees are predominantly regularly dispersed on small spatial scales, while medium-sized trees showed two types of pattern: regular and aggregated. Only small trees demonstrated clumped patterns of distribution. A similar trend was observed for fir and beech of different sizes by Janik et al. [34] and in old-growth forests consisting of tree species with higher light requirements [3,11].
The relationship between tree sizes and growth rates was examined using the growth dominance index. Generally, the index demonstrated negative values, indicating reverse growth dominance values over the two decades investigated. For all trees regardless of species, the index increased slightly over the 24 years of forest development, but was still negative at the end of the study. This is consistent with the phase of reverse growth dominance observed in other old-growth forests [17,18,20,35], which means that the contribution of smaller trees to the total growth of the forest was larger than the contribution of large, dominant trees. In mixed forests, consisting of tree species with different light requirements, growth dominance is hypothesized to be higher for light-demanding tree species than for shade-tolerant species [36]. The highest GD index value was found for stands dominated by the trembling aspen, and the lowest for forests dominated by the black spruce and balsam fir. Our results partially corroborated these observations. In our case, the highest GD index was achieved by the Scots pine, and the lowest was observed for hornbeam. However, other light-demanding tree species (the pedunculated oak, birch, and larch) achieved a relatively low GD index, comparable to or even lower than that of the silver fir. Yet, our species-specific analysis showed a decrease of GD index for most tree species with age. The only exceptions were the larch and birch. It is assumed that the decreasing trend in GD index may be related more to reduction of resource acquisition and utilization by dominant trees than to improved growing conditions for non-dominant trees [36]. Competition between trees is also frequently linked to the growth dominance measure [18,35,37]. According to earlier studies, stands with strong positive growth dominance demonstrate asymmetrical competition, in contrast to stands with reverse growth dominance, which demonstrate symmetrical competition. The reverse growth dominance becomes usually the dominant phase when inter-tree distances increase, meaning the competition of large trees with smaller ones is reduced [19]. Then, the smaller trees start to contribute more to forest growth. Because silvicultural treatments drive competition, they can also help to establish certain growth dominance patterns [37]. Reverse growth dominance in old-growth forests suggests that harvesting trees of larger sizes with low vigor is the best option, and can maximize forest growth [36].
5. Conclusions
Our results confirmed that uneven-aged lowland temperate forests consisting of shade-tolerant, mid-tolerant, and shade-intolerant tree species can be very productive and exhibit a stable and high annual volume increment (H1 hypothesis). The high productivity of the forests is a result of the presence of the silver fir, but the Scots pine and pedunculate oak can also play an important role. Uneven-aged mixed forests can be relatively diverse in term of species composition, and silvicultural treatments seem to be appropriate for maintenance of this diversity. While species composition is rather complex, different tree species exhibit different forms of mixing with other species, which may play an important role in shaping species diversity in the future. Homogeneous patches of the fir and hornbeam may not be suitable for species with higher light requirements, leading to their elimination from the stand in the future. Analysis of the ingrowth rate and ingrowth species composition supports this assumption very clearly. Despite the presence of tree species with different light requirements and different growth patterns, the size differentiation of the forest can be rather low or moderate on the local spatial scale. Thus, the H2 hypothesis can be only partly supported by our results.
Analysis of the relationships between tree sizes and growth rates revealed that the growth of the stand was dominated by smaller and mid-sized trees, which corresponds to the reverse dominance growth phase of stand development (H3 hypothesis).
Taking into account the results obtained, our study indicated that the selection cuttings performed during the investigated period favored relatively high productivity of the stand. At the same time, these treatments were not intense enough to assure more abundant regeneration of shade-intolerant tree species. Increased cutting intensity would seem to favor relatively high annual growth, which may also improve the demography of regeneration of these valuable species. Such increase in intensity can be attained by using group selection cutting instead of single selection cutting.
Supplementary Materials
The following are available online at https://www.mdpi.com/1999-4907/11/1/57/s1, Figure S1: Species-specific diameter distribution over the observed period (specified years) in the multispecies uneven-aged forest located in the Unieszów Forestry Range. Figure S2: Variation of Shannon species diversity index (SSP) on measurement plots in 1993, 2006 and 2017 inventories (from top to the bottom) in the multispecies uneven-aged forest located in the Unieszów Forestry Range. Figure S3: Variation of Gini size inequality index (GI) on measurement plots in 1993, 2006 and 2017 inventories (from top to the bottom) in the multispecies uneven-aged forest located in the Unieszów Forestry Range. Figure S4: Mean spatial positioning (CE), spatial mingling (DM) and spatial differentiation of tree diameter (TD)—tree species pooled—at the neighborhood spatial scale over the investigated period. Figure S5: Mean values of CE, DM and TD indices and standard errors of the means calculated for tree species in 1993 (a), 2006 (b), and 2017 (c). Figure S6: Growth dominance curves for conifers present in the multispecies uneven-aged forest in two analyzed periods. Figure S7: Growth dominance curves for broadleaved tree species present in the multispecies uneven-aged forest in two analyzed periods; Table S1: Spatially inexplicit and spatially explicit indices describing the structural aspects of the forest. Table S2: Species-specific GI index (±standard deviation) describing the inequality in trees diameter over the 24-year period.
Author Contributions
Conceptualization, W.B.; Methodology, W.B., J.S., and W.K.; Formal Analysis, W.B. and J.S.; Writing, J.S., W.K., and R.K.; Original Draft Preparation, J.S. All authors have read and agreed to the published version of the manuscript.
Funding
The publication was co-financed within the framework of Ministry of Science and Higher Education program as “Regional Initiative Excellence” in the years 2019–2022, project number 005/RID/2018/19.
Acknowledgments
We thank Tomasz Wawro, Paweł Tysiąc, and Wanda Bartkowiak for helping with the field work.
Conflicts of Interest
The authors declare no conflict of interest.
References
- Rozkrut, D. Statistical Yearbook of Forestry; Zakład Wydawnictw Statystycznych: Warszawa, Poland, 2018. [Google Scholar]
- Paluch, J. Rębnia przerębowa jako nowoczesna metoda biologicznej racjonalizacji. Sylwan 2006, 150, 54–63. [Google Scholar]
- Del Río, M.; Pretzsch, H.; Alberdi, I.; Bielak, K.; Bravo, F.; Brunner, A.; Condés, S.; Ducey, M.J.; Fonseca, T.; von Lüpke, N.; et al. Characterization of the structure, dynamics, and productivity of mixed-species stands: Review and perspectives. Eur. J. For. Res. 2016, 135, 23–49. [Google Scholar] [CrossRef]
- Sharma, A.; Bohn, K.; Jose, S.; Dwivedi, P. Even-Aged vs. Uneven-Aged Silviculture: Implications for Multifunctional Management of Southern Pine Ecosystems. Forests 2016, 7, 86. [Google Scholar] [CrossRef]
- Spathelf, P.; Ammer, C. Forest management of scots pine (Pinus sylvestris L.) in northern Germany-a brief review of the history and current trends. Forstarchiv 2015, 86, 59–66. [Google Scholar]
- O’Hara, L.K. Multiaged Silviculture. In Managing for Complex Forest Stand Structures; Oxford University Press: Oxford, UK, 2014. [Google Scholar]
- Adamic, M.; Diaci, J.; Rozman, A.; Hladnik, D. Long-term use of uneven-aged silviculture in mixed mountain Dinaric forests: A comparison of old-growth and managed stands. Forestry 2017, 90, 279–291. [Google Scholar] [CrossRef]
- Nolet, P.; Kneeshaw, D.; Messier, C.; Béland, M. Comparing the effects of even- and unevenaged silviculture on ecological diversity and processes: A review. Ecol. Evol. 2018, 8, 1217–1226. [Google Scholar] [CrossRef] [PubMed]
- Jaworski, A.; Paluch, J.; Pach, M.; Kołodziej, Z.; Majerczyk, K. Charakterystyka lasów przerębowych w wybranych nadleśnictwach Regionalnej Dyrekcji Lasów Państwowych w Krakowie. Sylwan 2007, 6, 34–52. [Google Scholar]
- Bartkowicz, L.; Paluch, J. Co-occurrence of shade-tolerant and light-adapted tree species in uneven-aged deciduous forests of southern Poland. Eur. J. For. Res. 2018. [Google Scholar] [CrossRef]
- Szmyt, J.; Tarasiuk, S. Species-specific spatial structure, species coexistence and mortality pattern in natural, uneven-aged Scots pine (Pinus sylvestris L.)-dominated forest. Eur. J. For. Res. 2018, 137. [Google Scholar] [CrossRef]
- Guldin, J.M. Experience with the selection method in pine stands in the southern United States, with implications for future application. Forestry 2011, 84, 539–546. [Google Scholar] [CrossRef]
- Petritan, I.C.; Commarmot, B.; Hobi, M.L.; Petritan, A.M.; Bigler, C.; Abrudan, I.V.; Rigling, A. Structural patterns of beech and silver fir suggest stability and resilience of the virgin forest Sinca in the Southern Carpathians, Romania. For. Ecol. Manag. 2015, 356, 184–195. [Google Scholar] [CrossRef]
- Pretzsch, H. Forest Dynamics, Growth and Yield; Springer: Berlin/Heidelberg, Germany, 2010. [Google Scholar]
- Baddeley, A.; Rubak, E.; Turner, R. Spatial Point Patterns. In Methodology and Applications with R; CRC Press: Boca Raton, FL, USA, 2014. [Google Scholar]
- Binkley, D. A hypothesis about the interaction of tree dominance and stand production through stand development. For. Ecol. Manag. 2004, 190, 265–271. [Google Scholar] [CrossRef]
- Binkley, D.; Kashian, D.M.; Boyden, S.; Kaye, M.W.; Bradford, J.B.; Arthur, M.A.; Fornwalt, P.J.; Ryan, M.G. Patterns of growth dominance in forests of the Rocky Mountains, USA. For. Ecol. Manag. 2006, 236, 193–201. [Google Scholar] [CrossRef]
- Fernández-Tschieder, E.; Binkley, D. Linking competition with Growth Dominance and production ecology. For. Ecol. Manag. 2018, 414, 99–107. [Google Scholar] [CrossRef]
- West, P.W. Calculation of a growth dominance statistic for forest stands. For. Sci. 2014, 60, 1021–1023. [Google Scholar] [CrossRef]
- Pommerening, A.; Brzeziecki, B.; Binkley, D. Are long-term changes in plant species composition related to asymmetric growth dominance in the pristine Białowieża Forest? Basic Appl. Ecol. 2016, 17, 408–417. [Google Scholar] [CrossRef]
- R Core Team. R: A Language and Environment for Statistical Computing; R Foundation for Statistical Computing: Vienna, Austria, 2019. [Google Scholar]
- Bauer, F.W. Waldbau als Wiessenschaft; Bd. 2; BLV: München, Germany, 1968. [Google Scholar]
- Keren, S.; Medarević, M.; Obradović, S.; Zlokapa, B. Five decades of structural and compositional changes in managed and unmanaged montane stands: A case study from South-East Europe. Forests 2018, 9, 479. [Google Scholar] [CrossRef]
- Keren, S.; Diaci, J.; Motta, R.; Govedar, Z. Stand structural complexity of mixed old-growth and adjacent selection forests in the Dinaric Mountains of Bosnia and Herzegovina. For. Ecol. Manag. 2017, 400, 531–541. [Google Scholar] [CrossRef]
- Kołodziej, Z.; Paluch, J.; Pach, M.; Bartkowicz, L. Tekstura karpackiego dolnoreglowego drzewostanu mieszanego o charakterze pierwotnym [Texture of a primeval lower montane mixed forest in the Carpathians]. Sylwan 2015, 159, 600–609. [Google Scholar]
- Andrzejczyk, T. Rębnia przerębowa w drzewostanach sosnowych. Sylwan 2006, 8, 52–60. [Google Scholar]
- Woziwoda, B.; Kopeć, D. Changes in the silver fir forest vegetation 50 years after cessation of active management. Acta Soc. Bot. Pol. 2015, 84, 177–187. [Google Scholar] [CrossRef][Green Version]
- Pach, M.; Podlaski, R. Tree diameter structural diversity in Central European forests with Abies alba and Fagus sylvatica: Managed versus unmanaged forest stands. Ecol. Res. 2015, 30, 367–384. [Google Scholar] [CrossRef]
- O’Hara, K.L.; Hasenauer, H.; Kindermann, G. Sustainability in multi-aged stands: An analysis of long-term plenter systems. Forestry 2007, 80, 163–181. [Google Scholar] [CrossRef]
- Duduman, G. A forest management planning tool to create highly diverse uneven-aged stands. Forestry 2011, 84, 301–314. [Google Scholar] [CrossRef]
- Klopcic, M.; Boncina, A. Stand dynamics of silver fir (Abies alba Mill.)-European beech (Fagus sylvatica L.) forests during the past century: A decline of silver fir? Forestry 2011, 84, 259–271. [Google Scholar] [CrossRef]
- Szwagrzyk, J.; Szewczyk, J.; Bodziarczyk, J. Spatial variability of natural stand in the Babia Góra National Park. Fol. For. Pol. 1997, 39, 61–78. [Google Scholar]
- Paluch, J.G.; Kołodziej, Z.; Pach, M.; Jastrzębski, R. Spatial variability of close-to-primeval Fagus–Abies–Picea forests in the Western Carpathians (Central Europe): A step towards a generalised pattern. Eur. J. For. Res. 2015, 134, 235–246. [Google Scholar] [CrossRef]
- Janík, D.; Adam, D.; Hort, L.; Král, K.; Šamonil, P.; Unar, P.; Vrška, T. Tree spatial patterns of Abies alba and Fagus sylvatica in the Western Carpathians over 30 years. Eur. J. For. Res. 2014, 133, 1015–1028. [Google Scholar] [CrossRef]
- Doi, T.B.; Binkley, D.; Stape, L.J. Does reverse growth dominance develop in old plantations of Eucalyptus saligna? For. Ecol. Manag. 2010, 259, 1815–1818. [Google Scholar] [CrossRef]
- Pothier, D. Relationships between patterns of stand growth dominance and tree competition mode for species of various shade tolerances. For. Ecol. Manag. 2017, 406, 155–162. [Google Scholar] [CrossRef]
- West, P.W. Use of the Lorenz curves to measure size inequality and growth dominance in forest plantations. Aust. For. 2018, 81, 231–238. [Google Scholar] [CrossRef]
© 2020 by the authors. Licensee MDPI, Basel, Switzerland. This article is an open access article distributed under the terms and conditions of the Creative Commons Attribution (CC BY) license (http://creativecommons.org/licenses/by/4.0/).