Article

Do Coffee Agroforestry Systems Always Improve Soil Carbon Stocks Deeper in the Soil?—A Case Study from Turrialba, Costa Rica

by
Nilovna Chatterjee
1,*,
P. K. Ramachandran Nair
2,
Vimala D. Nair
3,
Abhishek Bhattacharjee
4,
Elias de Melo Virginio Filho
5,
Rheinhold G. Muschler
5 and
Martin R. A. Noponen
6
1
Department of Agronomy and Horticulture, University of Nebraska-Lincoln, Lincoln, NE 68583, USA
2
School of Forest Resources and Conservation, University of Florida, Gainesville, FL 32611, USA
3
Soil and Water Sciences Department, University of Florida, Gainesville, FL 32611, USA
4
Nemours Biomedical Research, Jacksonville, FL 32207, USA
5
CATIE, Centro Agronómico Tropical de Investigación y Enseñanza, Turrialba 30501, Costa Rica
6
Rainforest Alliance, London EC2N 2AT, UK
*
Author to whom correspondence should be addressed.
Forests 2020, 11(1), 49; https://doi.org/10.3390/f11010049
Submission received: 7 November 2019 / Revised: 10 December 2019 / Accepted: 24 December 2019 / Published: 31 December 2019
(This article belongs to the Section Forest Ecology and Management)

Abstract

:
Shaded perennial agroforestry systems (AFS) are regarded as desirable land-use practices that improve soil carbon sequestration. However, most studies assume a positive correlation between above ground and below ground carbon without considering the effect of past and current land management, textural variations (silt and clay percentage), and such other site-specific factors that have a major influence on the extent of soil C sequestration. We assessed SOC stock at various depths (0–10, 10–30, 30–60, and 60–100 cm) in shaded perennial coffee (Coffea arabica L.) AFS in a 17-year-old experimental field at the Centro Agronómico Tropical de Investigación y Enseñanza, (9°53′44′′ N, 83°40′7′′ W; soil type: Ultisols and Inceptisols, Turrialba, Costa Rica. The treatments included coffee (Coffea arabica L.) grown conventionally (with chemical fertilizers) and organically (without chemical fertilizers) under two shade trees, Erythrina poeppigiana (Walp.) O.F. Cook., and Terminalia Amazonia J.F.Gmel., Sun Coffee (Coffea arabica L.) (Sole stand of coffee without shade), and Native Forest. Three replicated composite soil samples were collected from each system for each depth class, and SOC stocks in three soil aggregate fractions (2000–250 µm, 250–53 µm, and <53 µm) and in the whole soil determined. The total SOC stocks were highest under forest (146.6 Mg C ha−1) and lowest under sun coffee (92.5 Mg C ha−1). No significant differences were noted in SOC stock within coffee AFS and sun coffee across fraction sizes and depth classes. Organic management of coffee under heavily pruned E. poeppigiana, with pruned litter returned to soil, increased SOC stocks for 0–10 cm depth soil only. High input of organic materials including pruned litter did not improve SOC stocks in deeper soil, whereas variations in silt and clay percentages had a significant effect on SOC stocks. The study suggests that high amounts of aboveground biomass alone are not a good indicator of increased SOC storage in AFS, particularly for soils of sites with historical characteristics and management similar to this study.

1. Introduction

Soils form the greatest terrestrial carbon (C) sinks, with the total C stored in soils accounting for three times the C stored aboveground in vegetation [1]. The carbon stored in the topsoil (0–30 cm) accounts for half of the soil organic carbon (SOC) and is considered highly susceptible to losses due to decomposition promoted by land-management practices. On the other hand, SOC stored in the deep soil is not degraded easily. The adoption of land management practices that promote secure storage of carbon in soil is highly recommended as a strategy for climate-change mitigation [2,3,4]. The role of agroforestry systems (AFS) in this context has been particularly recognized [5,6,7,8,9,10].
There exists a common belief that agroforestry systems enhance SOC stocks compared to tree-less annual crop systems [11,12]. However, very few publications mention the site-specificity of agroforestry systems in improving SOC stocks. Additionally, the carbon sequestration potential of land-use systems requires measurements of SOC stocks over time. However, the majority of the available literature on SOC stocks are reports of one-time study, making it hard to estimate soil C sequestration [13].
Globally, more than 11 million hectares of tropical land is under coffee production (FAO, 2014). Typically, coffee agroforests are categorized under shaded perennial AFS, in which coffee (Coffea arabica L., Coffea canephora Pierre ex A.Froehner.) are cultivated under the shade of tall-growing plants. Several studies have pointed out that shaded perennial systems often “mimic” a forest-like environment and have very high soil carbon storage potential (≈150 Mg C ha−1) [14,15,16,17]. A global meta-analysis reported 48% higher SOC stocks under shaded perennial agroforests when compared to monoculture systems [18]. The same study also quantified a mere 3.4% lower SOC stock up to 1-m soil depth in shaded perennial systems when compared to forests [18]. The underlying mechanisms that lead to high SOC stocks within these systems include the accumulation and turn-over of leaf litter and roots, a continuous supply of organic matter to the soil [18,19,20]. Thus, the proper design and management of shaded perennial AFS are critical in order to improve SOC storage and subsequent sequestration [11].
Soil aggregates constitute the basic units of the soil structure and play a pivotal role in SOC storage, SOC dynamics, and C retention [21,22]. Higher C inputs in soil can enhance soil aggregation [23]. Soil aggregate formation is described using the hierarchical model (HM) proposed by [24,25]. These aggregates are classified based on their size as macroaggregates (2000–250 µm), microaggregates (250–53 µm) and silt-and-clay (<53 µm). The macroaggregates are more sensitive to changes in soil management practices and organic inputs compared to microaggregates and silt-and-clay particles. Given the importance of size fractions in SOC storage, several studies on the potential of C sequestration in soils under AFS have emphasized the importance of determining the extent of C storage in different aggregate classes at deeper soil depths, up to 1-m [17,26,27,28,29].
While undertaking studies on SOC storage within soil aggregates in shaded perennial AFS, soil depth becomes an important parameter as a substantial amount organic matter gets deposited in subsoil horizon from penetrating tree root exudates and bioturbation [30,31].
Costa Rica is a small Central American country where coffee (Coffea arabica) is the single most important crop in terms of land use with 109,000 hectares of land under coffee cultivation according to a report published by the Food and Agriculture in the year 2015 [32], and most of the crop is grown under shade trees (shaded perennial AFS). In most coffee producing Central American countries, the management variables introduced by farmers are: (i) the use of shade trees versus shade devoid, “sun” coffee, (ii) the types of shaded trees: unpruned, timber species versus heavily pruned nitrogen fixing species, and (iii) application of chemical fertilizer (conventional) versus organic fertilizer. In this scenario, the study reported here was undertaken to evaluate the effect of the above management variables in coffee AFS in Costa Rica such as the nature of shade trees and their pruning regimes and the use of organic versus chemical fertilizers on SOC stocks in soil aggregates. Specifically, the objectives of this study were:
(1)
To compare the differences in whole soil and aggregate-associated carbon stocks among coffee AFS with the above-mentioned management variables, a coffee monoculture (sun coffee), and an adjacent forest across varying depth classes up to 1 m.
(2)
To assess whether differences in management practices within coffee AFS helped in improving soil aggregation and SOC storage relative to monoculture sun coffee.
(3)
To evaluate if AFS promote aggregate associated C within the smallest aggregate fraction (<53 µm) across varying depth classes.

2. Materials and Methods
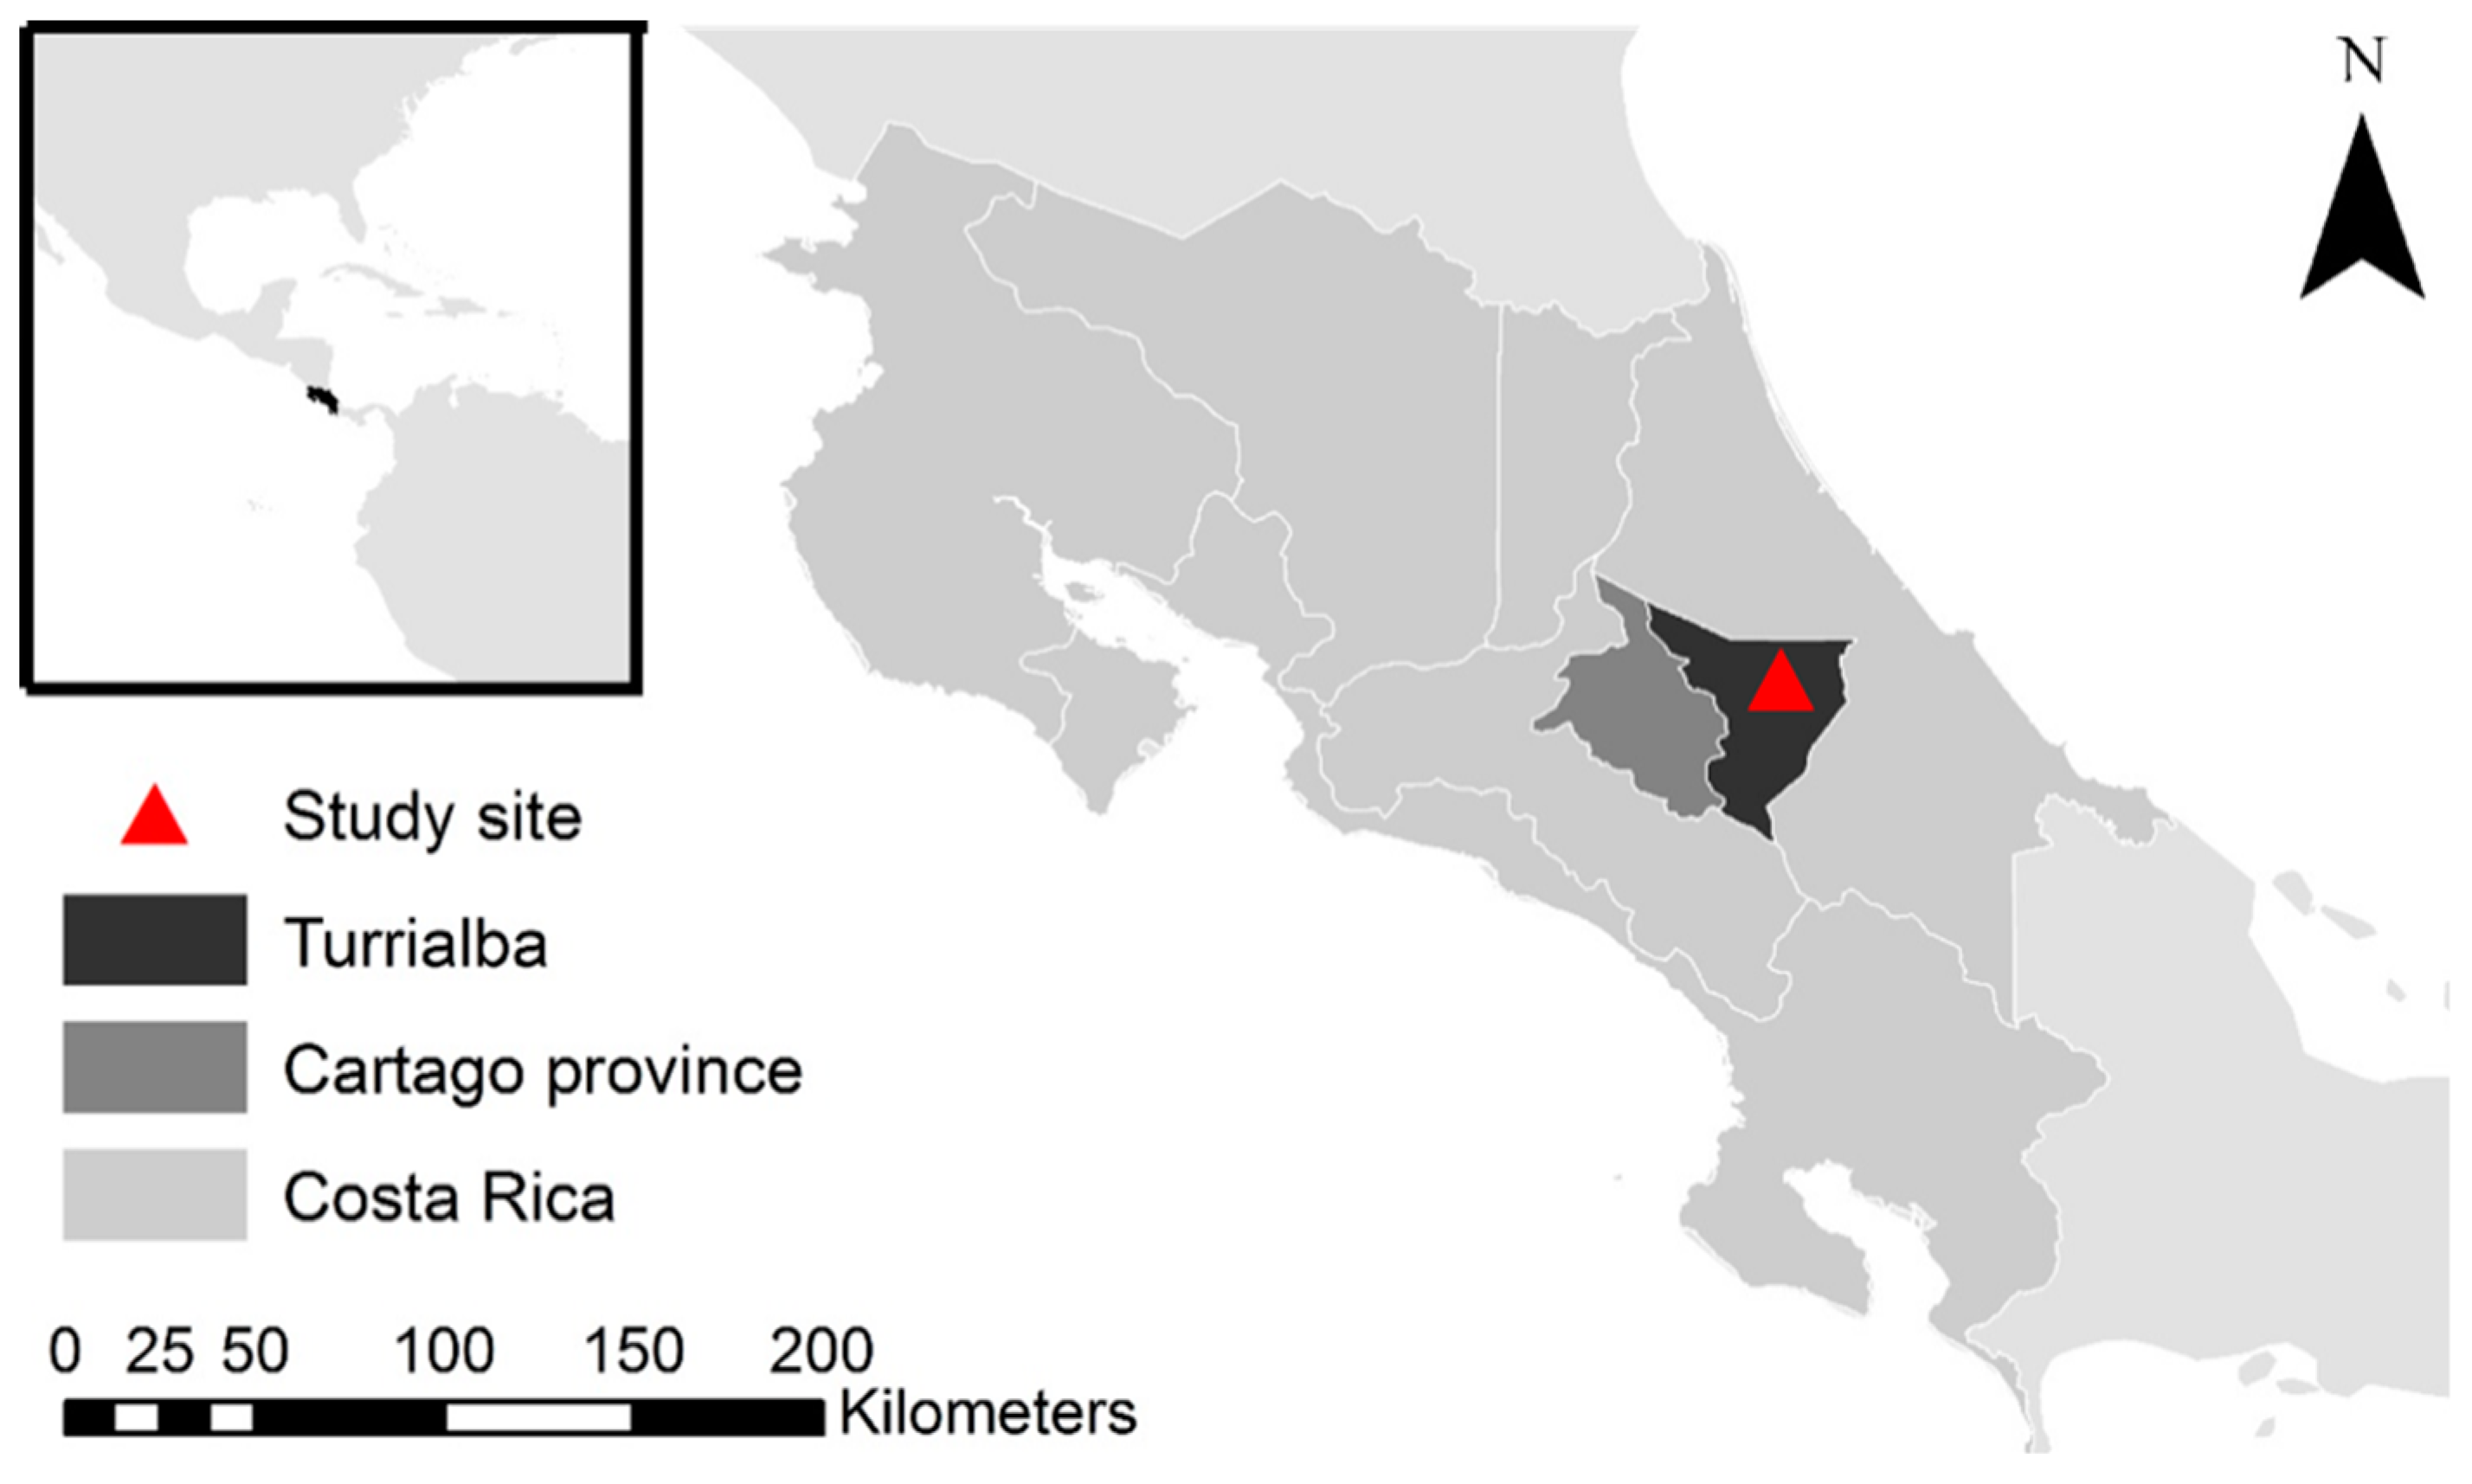
2.1. Study Location

The study was conducted in an experimental field station managed by the ‘Centro Agronómico Tropical de Investigación y Enseñanza’ (CATIE), Turrialba, Costa Rica (CATIE, CR) that represents low altitude (685 m above sea level) coffee growing regions of the world. The site, located at 9°53′44′′ N, 83°40′7′′ W, and 685 m above sea level (Figure 1), was formerly under sugar cane (Saccharum officinarum L.) cultivation. Coffee cultivar Coffea arabica L. ‘Caturra’ was planted in 2000. The Koppen climate classification for Turrialba is Cfb (Marine West Coast Climate) with no marked dry season. The annual precipitation is 2600 mm year−1 and mean annual temperature is 22 °C [11,33]. The soil type has been classified as Inceptisols (Typic Endoaquepts) and Ultisols (Typic Endoaquults) under the USDA Soil Taxonomy classification system.

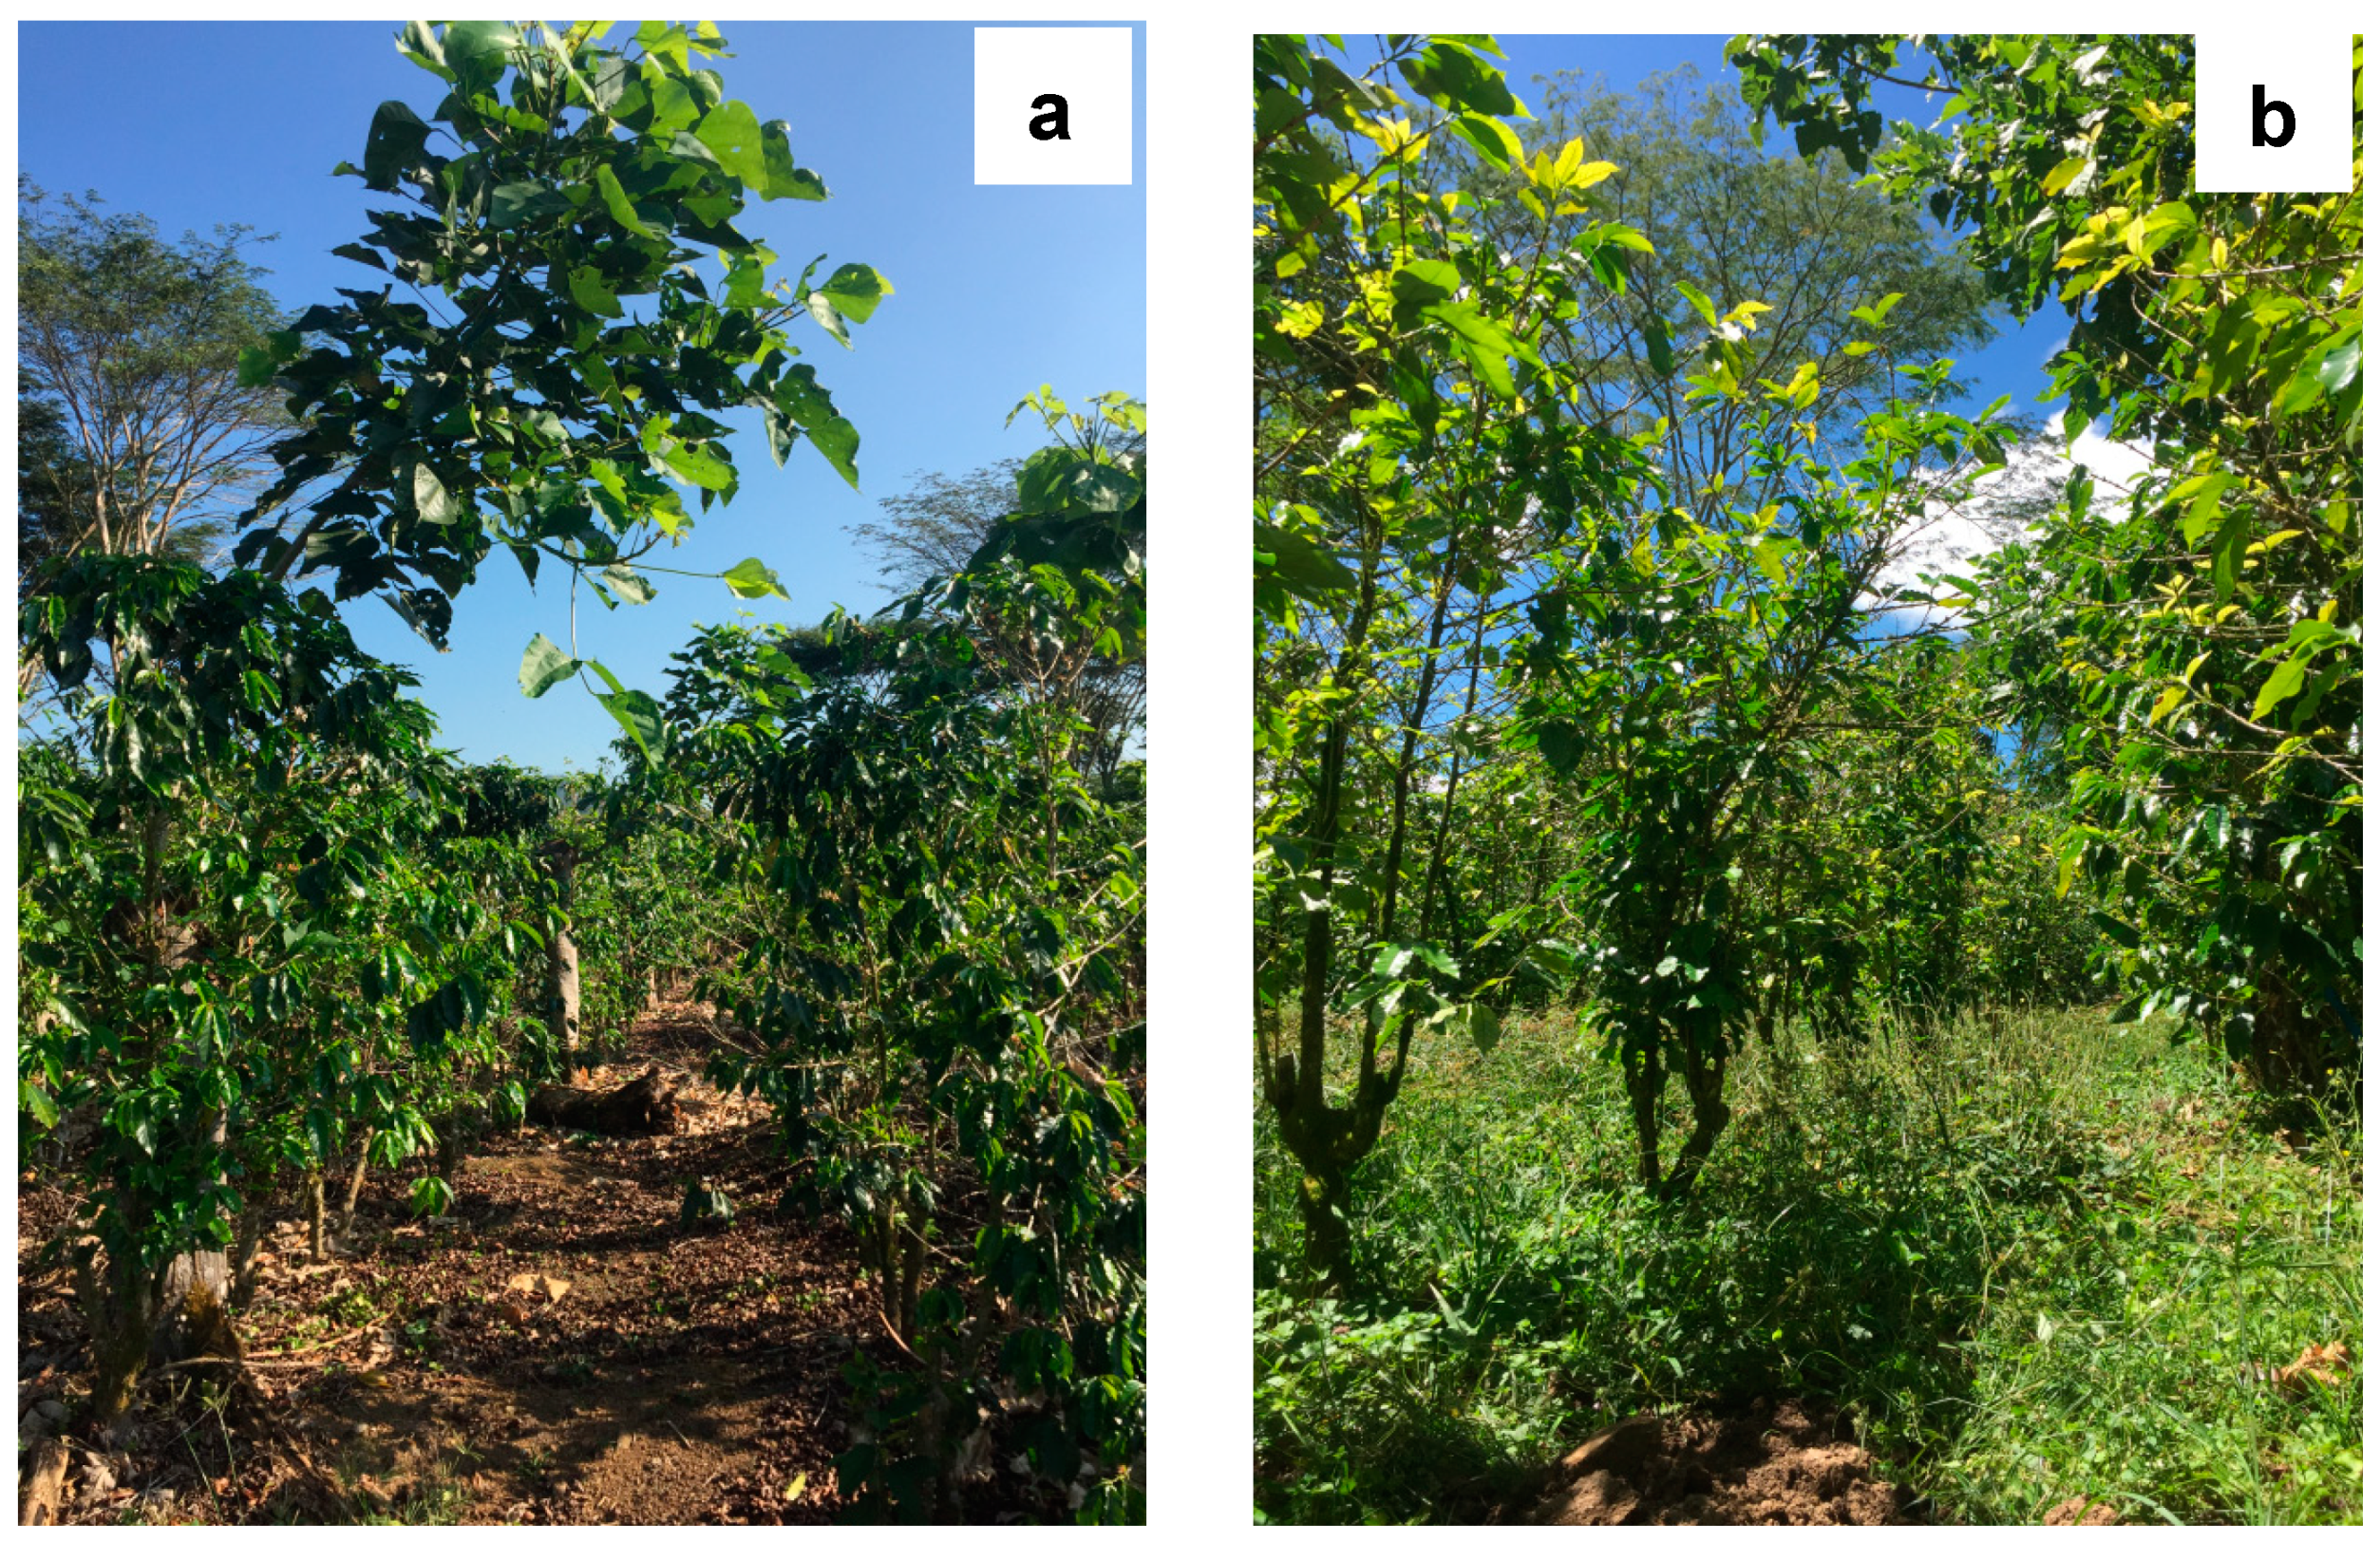
2.2. Management Practices under Coffee AFS

The six different land-use systems (Figure 2) selected for this study:
  • Conventional intensively managed coffee + N2 fixing species (Erythrina poeppigiana (Walp.) O.F. Cook.) as shade tree (CE)
  • Conventional intensively managed coffee + timber species (Terminalia amazonia J.F.Gmel.) as shade tree (CT)
  • Organic intensively managed coffee + N2 species (Erythrina poeppigiana (Walp.) O.F. Cook.) as shade tree (OE)
  • Organic intensively managed coffee + timber species (Terminalia amazonia J.F.Gmel.) as shade tree (OT)
  • Full sun grown coffee (Coffea arabica L.) (SC) (monoculture)
  • Forest: Native, Talamancan montane forest (Bosque Florencia) from a nearby site (FO)
Coffee, Coffea arabica L. var. Catuura, in the experimental plot was planted at 8000 plants ha−1 with two plants per planting hole—a common practice in Costa Rica. Coffee planting holes were spaced 1 × 2 m apart with trees planted at 4 × 6 m. Shade trees were planted at 417 trees ha−1. The tree management regime varied according to the shade species, and the timber tree shade (Terminalia Amazonia) were managed through periodic thinning. The leguminous, N2 fixing shade tree species (Erythrina poeppigiana) were pruned regularly to provide the organic N input to the soil. Timber tree species had their lower branches pruned each year to improve their form. Only the trunks of the thinned trees of the timber species were removed, branches and leaves were left on site. In the conventional treatment with Erythrina shade tree, Erythrina was pruned completely (pollarded) twice a year. In organic treatment with Erythrina, a minimum of three branches were left for partial shade cover after each of the two annual prunings. In all cases, the pruned material was left on site. Under a conventional intensive management regime, the trees were pruned to a height of 1.8–2.0 m with the removal of all branches above this height (pollarding), another common practice in Costa Rica [34]. The details of the conventional and organic management regimes are furnished in Table 1, Table 2 and Table 3.

2.3. Soil Sampling

Soil samples were collected following a randomized complete block design (RCBD) from selected plots of Conventional + Erythrina (CE), Conventional Terminalia (CT), Forest (FO), Organic + Erythrina (OE), Organic + Terminalia (OT), Sun Coffee (SC). Each sampling plot measuring 1 × 1 m was dug up to collect representative soil samples from four depth classes: 0–10, 10–30, 30–60, and 60–100 cm. Samples from four randomly selected sampling sites per plot were composited to form one replicate. Three such replicates were collected from four different, randomly selected plots of each treatment (land-use system), giving a total of 72 samples (6 treatments × 4 depth classes × 3 replicates per plot). At each sampling location, the selected 1 m × 1 m site was dug down to one-meter depth to collect samples from the four depth classes. For the determination of soil bulk density at each depth class, a steel cylinder of known volume was inserted horizontally on the wall of the pits at the center of each depth class; the soil inside the cylinder was collected, dried, and weighed. The soil samples were air-dried and sieved (2 mm sieve) at the soils laboratory in Centro Agronómico Tropical de Investigación y Enseñanza. The portion of soil that did not pass through 2 mm sieve (#10 U.S. Standard Testing Sieve) was discarded; the 2 mm-sieved soil samples, hereafter referred to as the whole soil, were bagged, and shipped to the University of Florida, Gainesville, FL, USA, for further analyses.

2.4. Soil Preparation and Analysis

Samples from the whole soil were fractionated into three aggregate size classes >250 μm, 250–53 μm and <53 μm at the Soil and Water Sciences Department laboratory, University of Florida, following the classical soil fractionation protocol [35], further modified by [21] and followed by previous researchers of this laboratory [16,27,29,30,36,37]. Soil samples were separated into aggregates by wet-sieving through a series of two sieve sizes (250 and 53 µm) to obtain the three fraction size classes: macro (>250 µm), micro (250–53 μm), and silt- and clay- sized fraction (<53 µm). Prior to wet sieving, the soil samples were air dried and 100 g of the air-dried sample was subjected to slaking by rapid immersion in 250 mL of distilled water. The process of slaking disintegrates the water unstable aggregates in soil, leaving only water stable aggregates to proceed with further analysis. The soil solution was poured over 250 μm sieve and fractionated manually by moving the sieve up and down about 5 cm each, 120 times in two minutes. The soil fraction that remained on the top of the 250 μm sieve was backwashed with a distilled water into a glass beaker. The soil solution that passed through the 250 μm sieve was poured over the 53-μm sieve (#270 U.S. Standard Testing Sieve), and the procedure was repeated. The three soil fractions >250 μm, 250–53 μm, and <53 μm (hereafter referred to as soil fractions), were dried at 65 °C, weighed, ground for homogenization using a QM-3A High Speed Vibration Ball Mill for 10 min, and stored in individually sealed and labeled plastic bags for C analysis. The average recovery of initial soil mass was 96%. The soil characteristics are elaborated in Table 4. Soil pH was determined in a 1:10 soil:water suspension. The total C stored to a meter depth is the sum of the C stored at each of the depths within the soil profile.
The weight of oven-dried samples (dry weight) under each aggregate size was noted (Table 4).
The whole soil not treated with the slaking or fractionation procedure, was dried and ground for homogenization. Soil samples were analyzed in a Carlo Erba NA1500 CNHS elemental analyzer for carbon and nitrogen percentages.
The C storage was calculated as:
C stock   =   C concentration   ×   BD   ×   Depth   ×   Weight   Fraction
where C stock = C storage is expressed in Mg ha−1 (per cm soil thickness unless specified otherwise) in each fraction for a given depth, C concentration = C concentration in size fraction (g 100 g−1) of that fraction size ,   BD = Bulk density (Mg m−3) ,   Depth = Depth of soil profile (cm ,   and   Weight   Fraction = weight of the fraction in the whole soil as a ratio (dimensionless).
The depth-wise distribution of different soil-fraction-size classes within replicates is furnished in Table 5.
Additionally, the C concentrations at the start of the experiment in 2001 up to a depth of 40 cm were obtained by personal communication with Martin Noponen and from his published study [11]. The C stocks were calculated using Equation (1). The carbon sequestration potential was measured as the rate of change in soil carbon over a time-period of 15 years from the inception.

2.5. Statistical Analyses

In order to probe whether treatment, fraction size and depth of soil had any effect on SOC stocks, a full fixed effect ANOVA model was fitted using R studio version 3.6 (Table 6 and Table 7). The best fitting parsimonious model (Table 4) was used over the full model. Multiple pair wise comparisons were conducted with Forest (FO) and Sun coffee (SC) as references for treatments, the topsoil profile 0–10 cm for depth and aggregate size > 250 µm as fraction size. When Forest (FO) was considered as a reference category for treatment, Sun coffee (SC) was excluded for the comparison and vice-versa. The response variable for all the comparison was SOC stocks expressed in Mg C ha−1.
The following equation illustrates the model:
Y i j k l   =   μ   +   α i   +   β j   +   γ k   +   ( α β ) i j   +   ( β γ ) j k   +   ( α γ ) i k   +   ε i j k l
where, Y i j k l = SOC stock (in log scale), for the observation corresponding to the i th treatments and the j th depth level and k th fraction size in the l th replicate,
  • i   = 1 ,   ,   5 ,   j   =   1 ,   2 ,   3 ,   k   =   1 ,   ,   4 ,   l   =   1 ,   ,   4 .
  • μ = overall effect,
  • α i = effect due to the i th treatments
  • β j = effect due to the j th depth level,
  • γ k = effect of the k th fraction size.
  • ( α β ) i k = interaction effect of the i th treatments and the j th depth level
  • ( β γ ) j k = interaction effect of the j th depth level and the k th fraction size
  • ( α γ ) i k = interaction effect of the i th treatments and the k th fraction size
  • ε i j k l = normal random error
We also compared the mean effect of treatments under each depth class and fraction size (Supplementary Material, Figures S1 and S2) as strong interactions existed between Treatment × Fraction size and Depth × Fraction size. For all analyses, the normality assumptions were validated by performing the Shapiro-Wilk test.
All statistical tests were performed using R studio [31]. In order to understand the effect of textural variability (silt and clay content) within treatments on SOC stocks, we ran linear regressions in similar way, as stated in a similar study conducted in India [17], independently across all depth classes as per the following equation:
log ( S O C )   =   ß 0   +   ß s i l t   ×   s i l t   +   ß c l a y   ×   c l a y   +  
where denotes the normal random error, ß 0 denotes the intercept, interpreted as the average log   ( S O C ) level when the two predictors are set to be equal to zero, ß s i l t and ß c l a y denote the regression coefficient of the predictor silt (clay), which is interpreted as the average change in log   ( S O C ) level caused by one unit change in silt (clay).

3. Results

3.1. Various Interaction Effects and the Analysis of Variance (ANOVA)

The factors treatment (p < 0.0001), depth (p < 0.0001), and fraction size (p < 0.0001) were found to have significant effect on total SOC stocks (Table 6 and Table 7). Interactions of Treatment × Fraction size, Depth × Fraction size (p < 0.001), and Treatment × Fraction size (p < 0.001) were also significant (Table 6). However, the interaction of treatment with depth (Treatment × Depth) was insignificant (p = 0.55). Dropping the insignificant interaction, we fitted a parsimonious model. The parsimonious model fitting showed significant interaction effect of Treatment × Fraction Size (p < 0.001) and Depth × Fraction Size (p < 0.001). Results of multiple comparisons with Forest as control, showed that for the lowest depth class 60–100 cm, the effect of all AFS on SOC stocks were significant within macroaggregates (p < 0.05) (Supplementary Material; Figures S1 and S2). No significant differences were noted when AFS treatments were compared to Sun coffee (Supplementary Material). For all analyses, high p-values for the Shapiro-Wilk test supported the normality assumption to compare different treatments at each depth and fraction size.

3.2. Soil Organic Carbon Stock in Whole Soil up to 1 m

The soil carbon stocks in whole soil varied across AFS, FO, and SC (Figure 3), with the highest under FO (146.6 Mg C ha−1) and lowest under SC (92.4 Mg C ha−1). The variation in SOC stock trended in the following order: FO > OT > OE > CT > CE > SC (Figure 3). The soil characteristics at different depth classes are given in Table 2 and the depth-wise distribution of soil fractions are elaborated in Table 3. The SC, CT, OE, and OT treatments had 37%, 25%, 23%, and 14.5% fewer SOC stocks than the Forest. Compared to the OT and OE AFS treatments, the monoculture SC had 35%, 18.4%, and 15% fewer SOC stocks in whole soil up to a depth of 1 m. The soil carbon stocks in FO and OT were not significantly different from each other (Figure 3).

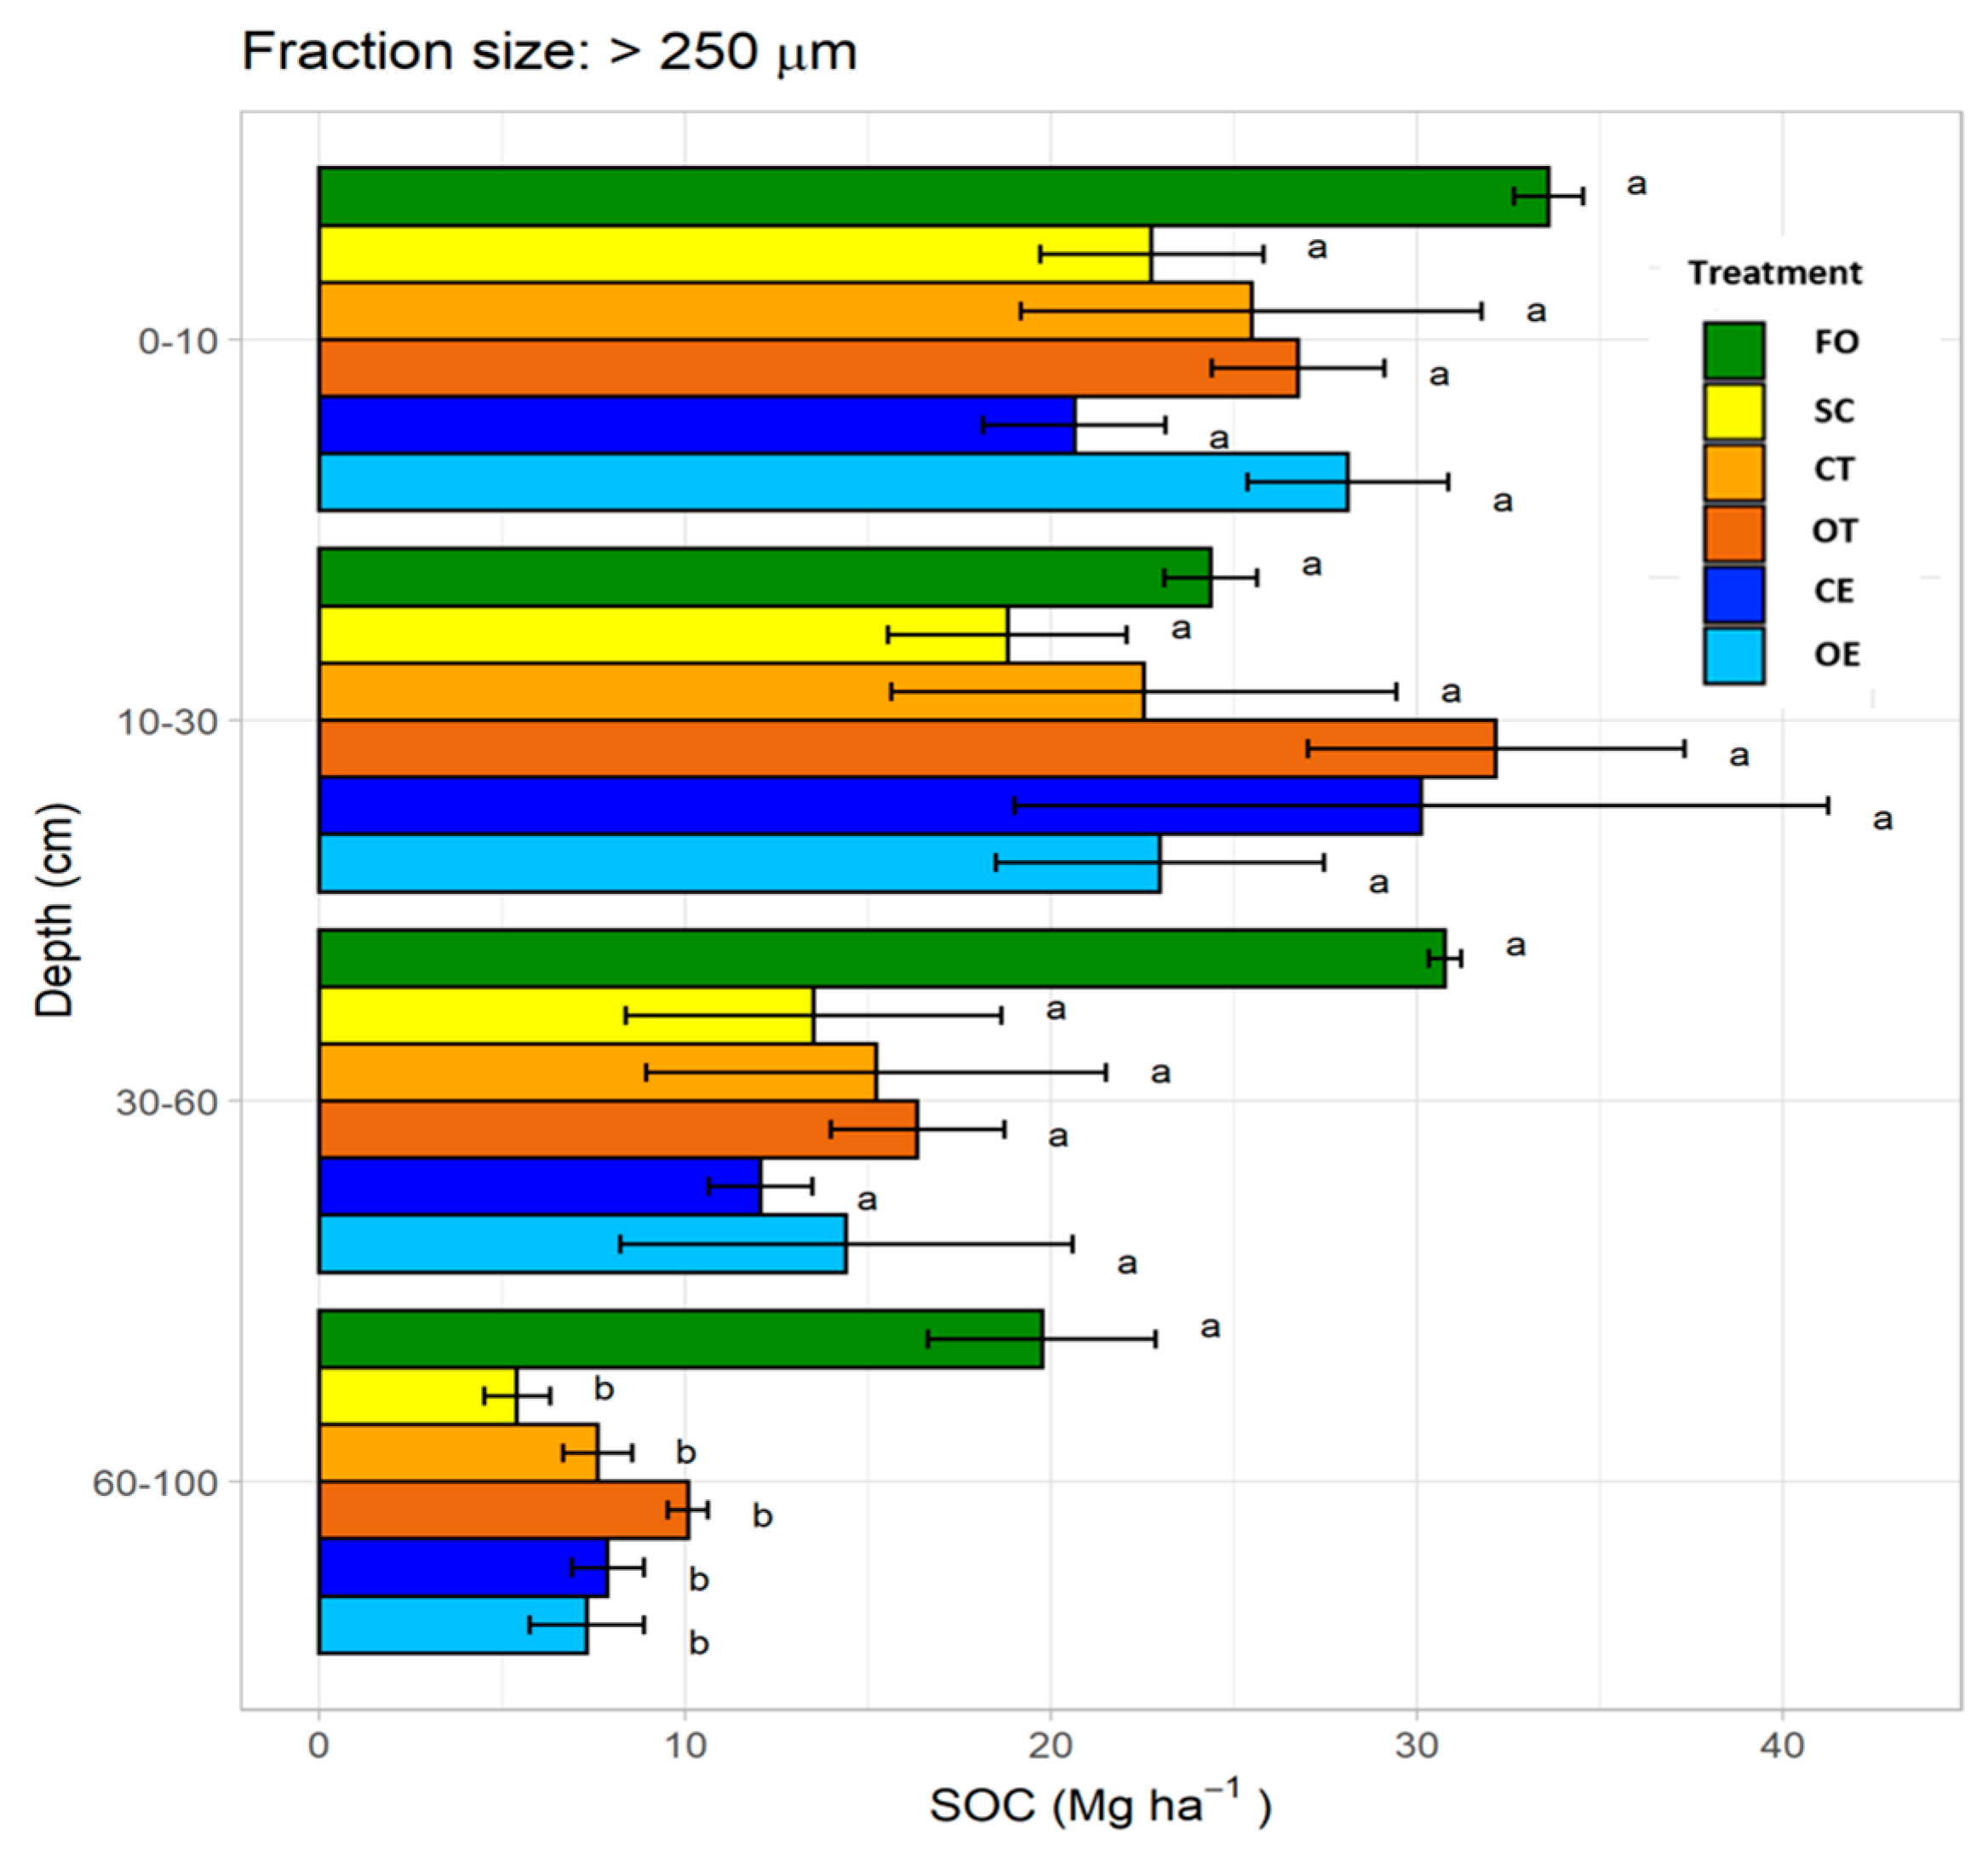
3.3. Soil Organic Carbon Stocks in Macroaggregates (>250 μm)

In a 1-m soil profile, the total SOC contained in the macroaggregates were 116.1, 84.4, 71.6, 70.1, 68.3, and 63 (Mg C ha−1) in FO, OT, CE, CT, OE, and SC treatments, respectively (Figure 4), with the highest amount under FO. The macroaggregates retained the highest proportion of total C. When compared to FO, the SOC stocks under all AFS and SC were significantly lower in the 60–100 cm depth. For all other depth classes, no significant differences were noted within macroaggregates in AFS treatments and SC when compared to FO (Supplementary Figure S1).

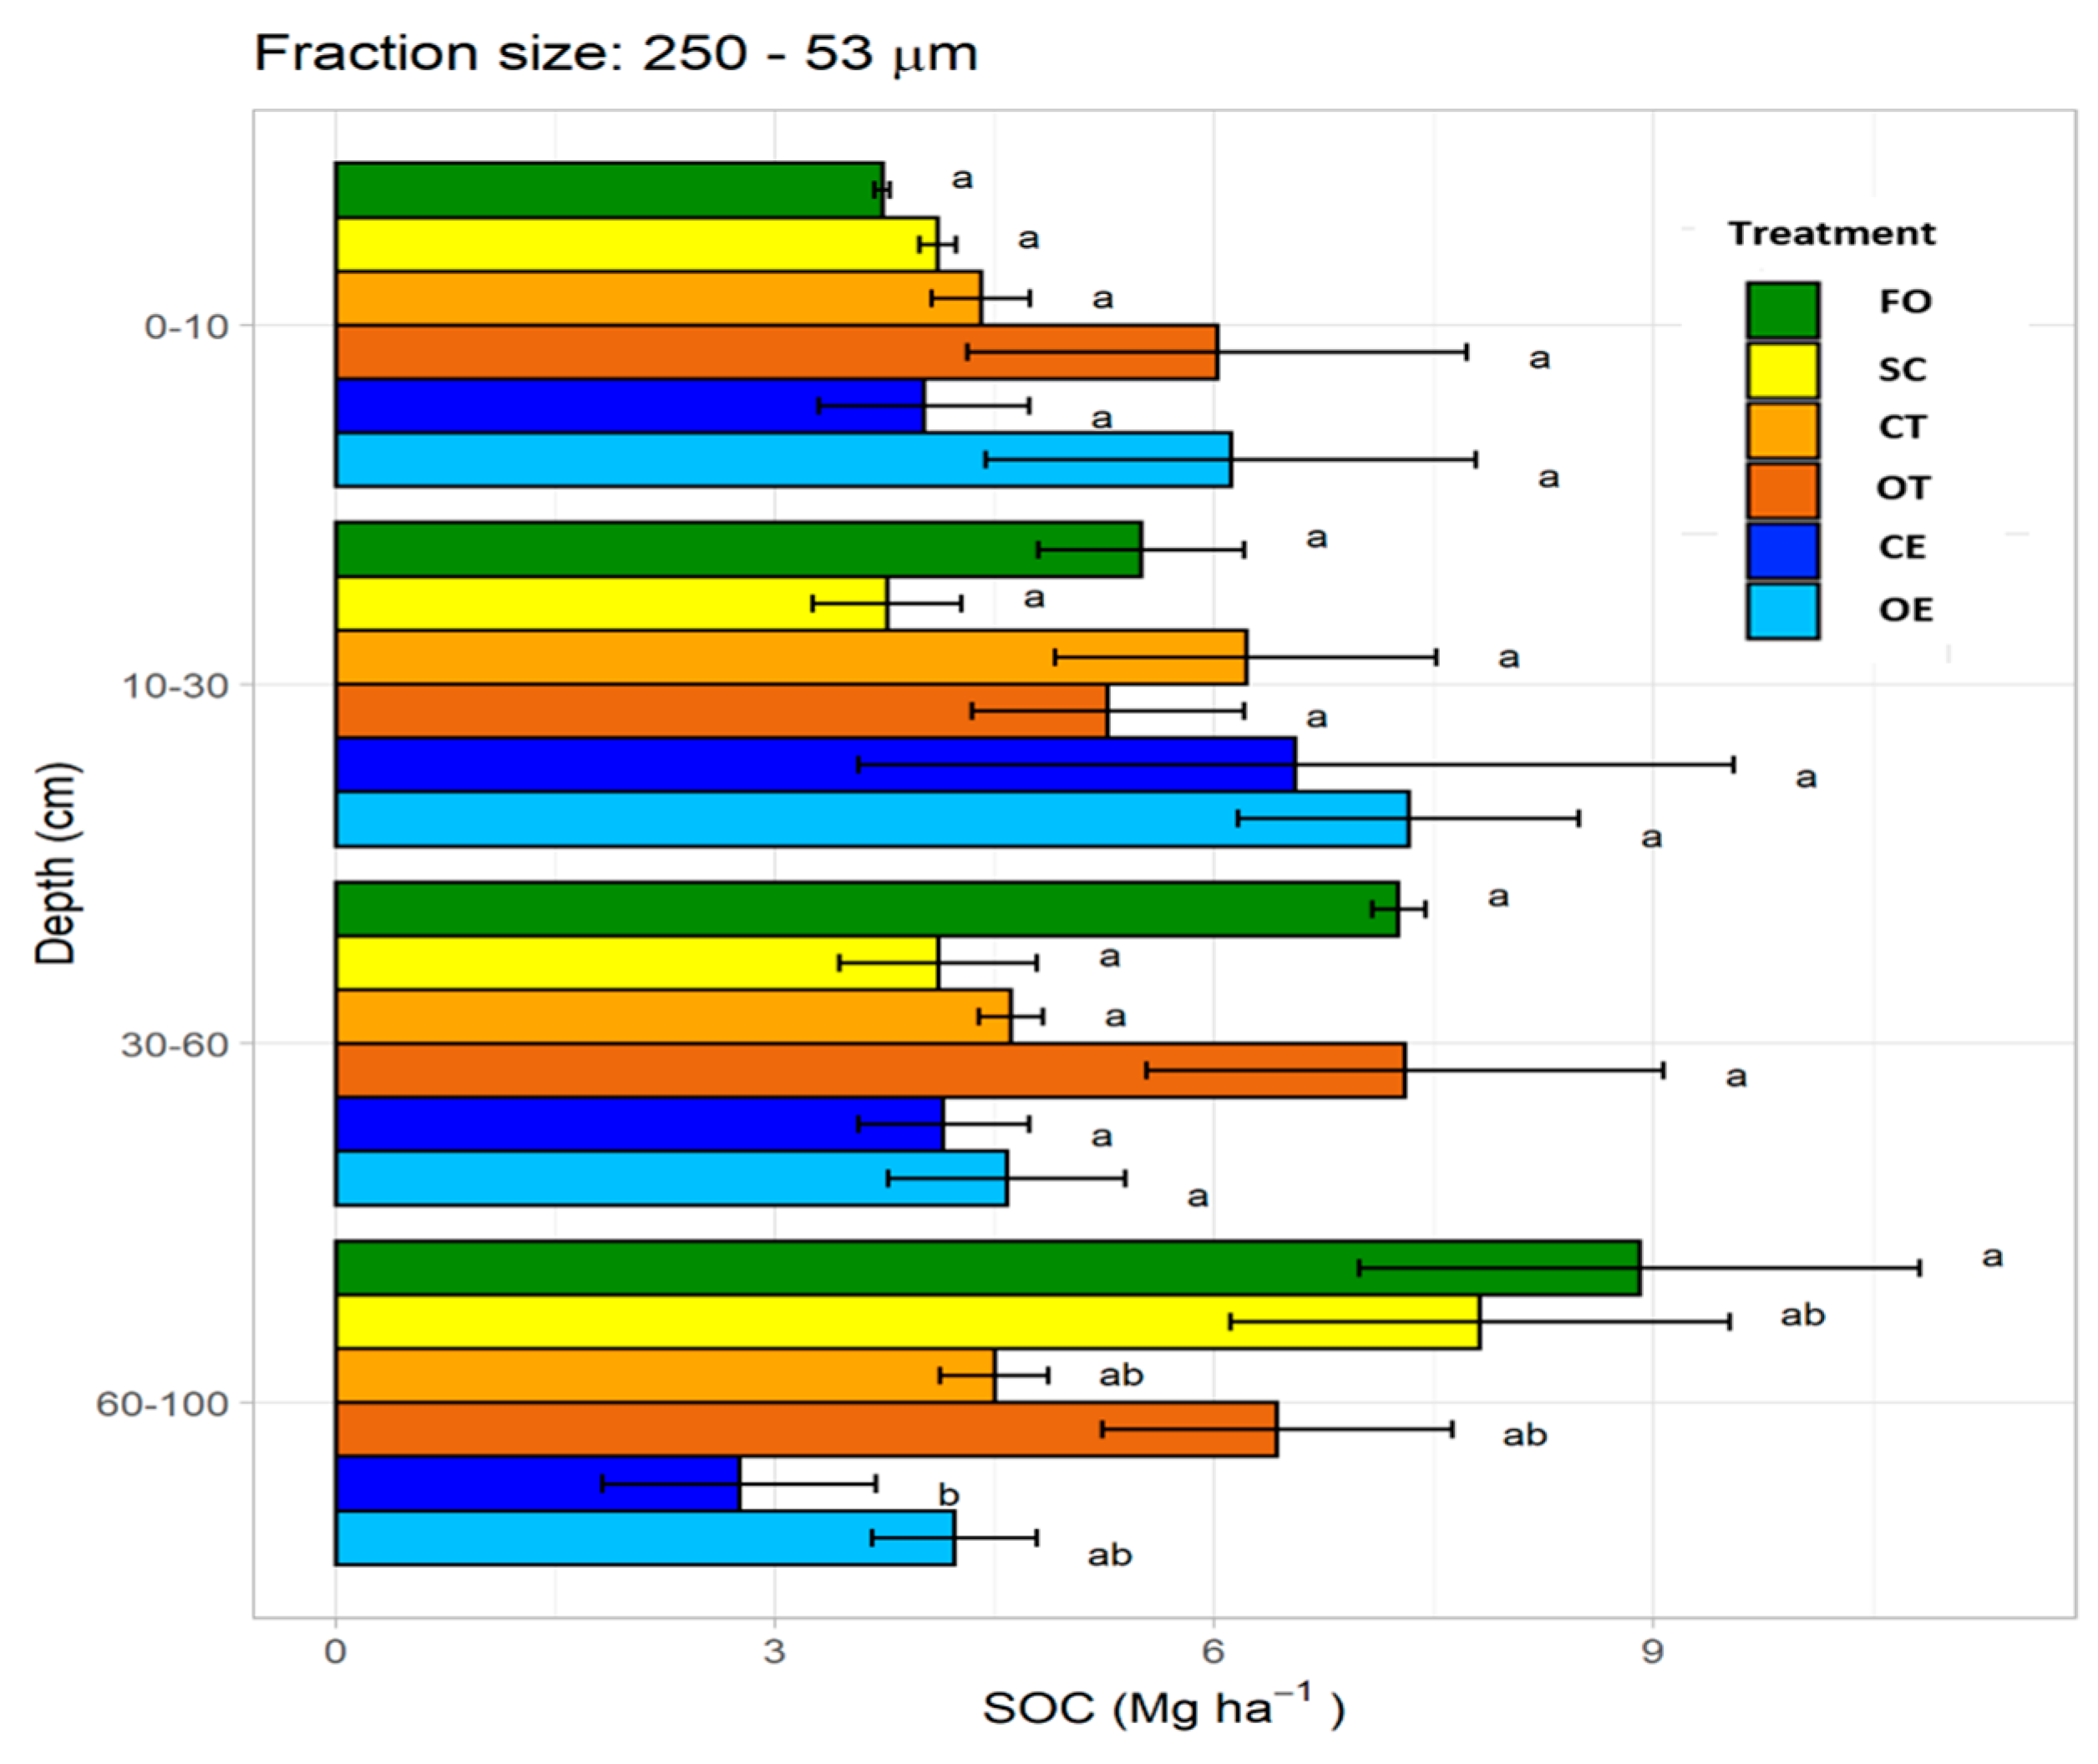
3.4. Soil Organic Carbon Stock in Microaggregates (250–53 μm)

Within a soil depth of 1 m, the total SOC contained in the microaggregates was highest under OT, closely followed by FO (Figure 5). Within the 0–10 cm, OE and OT had higher SOC stocks (6.4 Mg C ha−1 and 6.38 Mg C ha−1) while Forest had 3.75 Mg C ha−1. Results of multiple comparisons showed that the SOC stocks in CCE were significantly lower than FO at the lowest depth class 60–100 cm. No other statistical significance was noted across AFS treatments, SC, and FO within microaggregates (250–53 μm) (Supplementary Material, Figures S1 and S2).

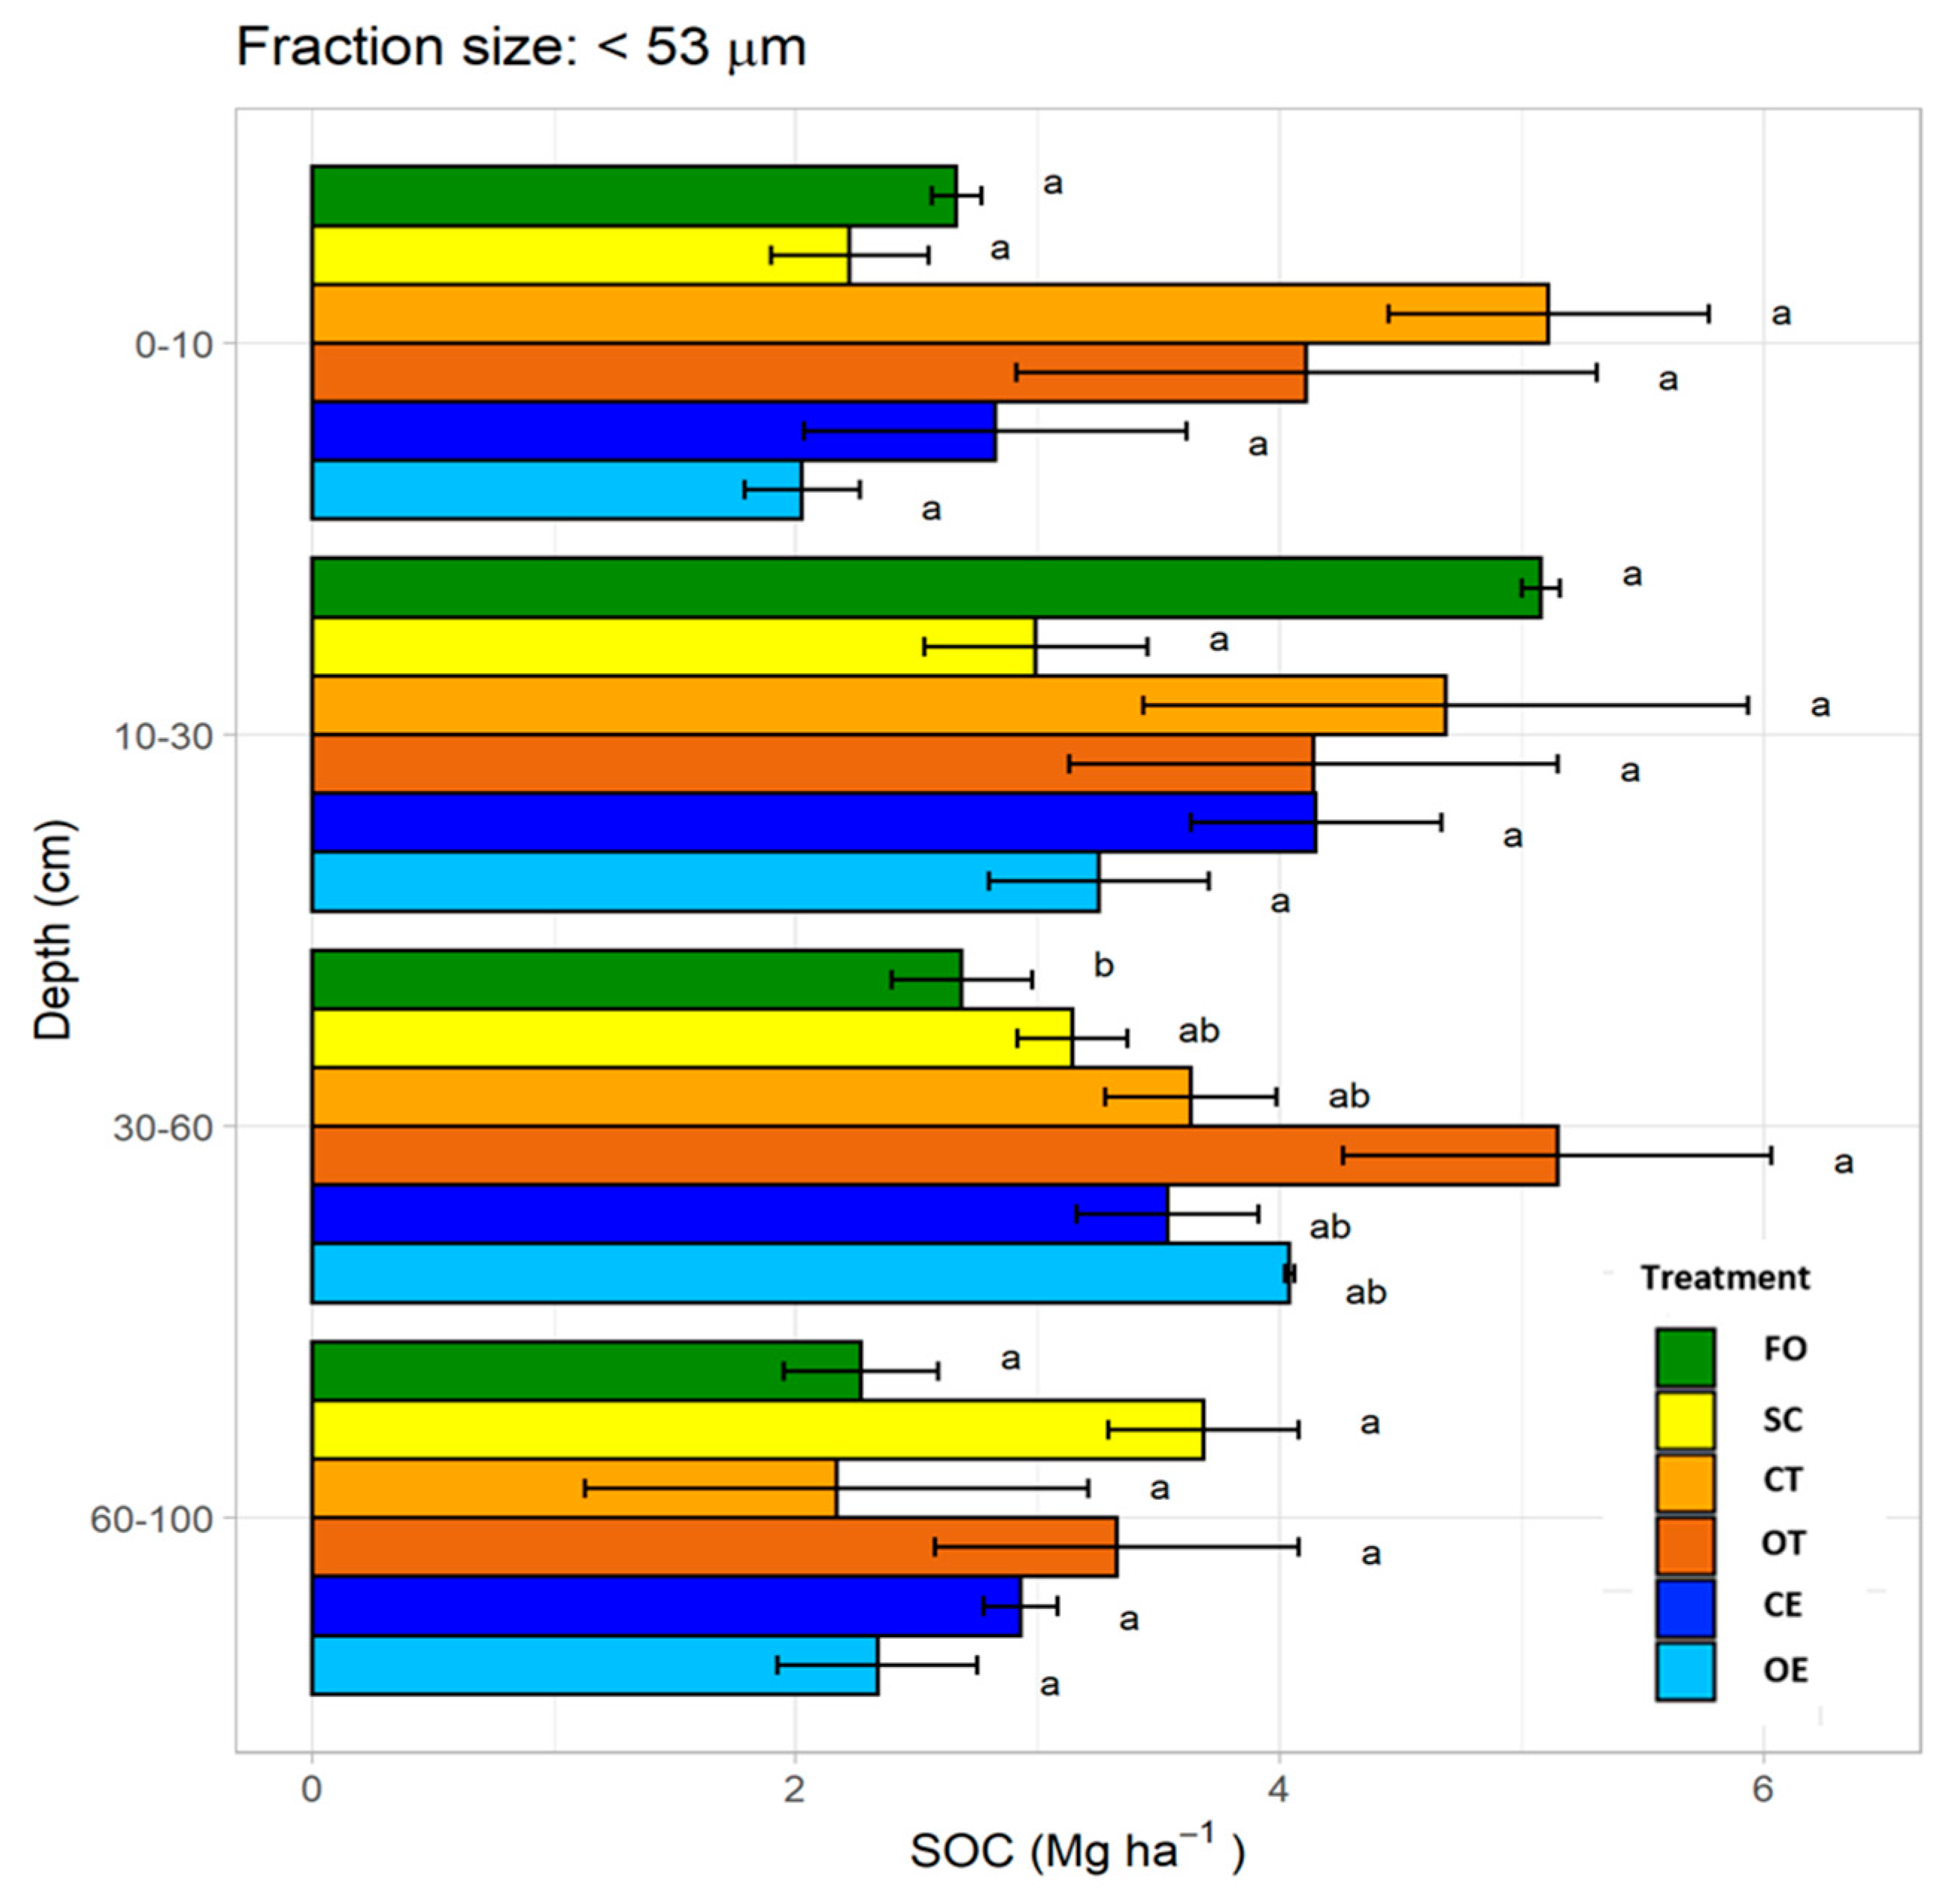
3.5. Soil Organic Carbon Stock in Silt and Clay Fraction (<53 μm)

The SOC contents in this fraction was higher under the two AFS systems with Terminalia as the shade tree (CT and OT), especially in the uppermost soil layer, 0–10. cm (Figure 6). The treatment CT had higher SOC stocks in the top two soil layers (0–10 cm and 10–30 cm). The results of multiple comparison tests showed no significant differences within treatments, with exception to CE compared to FO (Supplementary Figure S1).

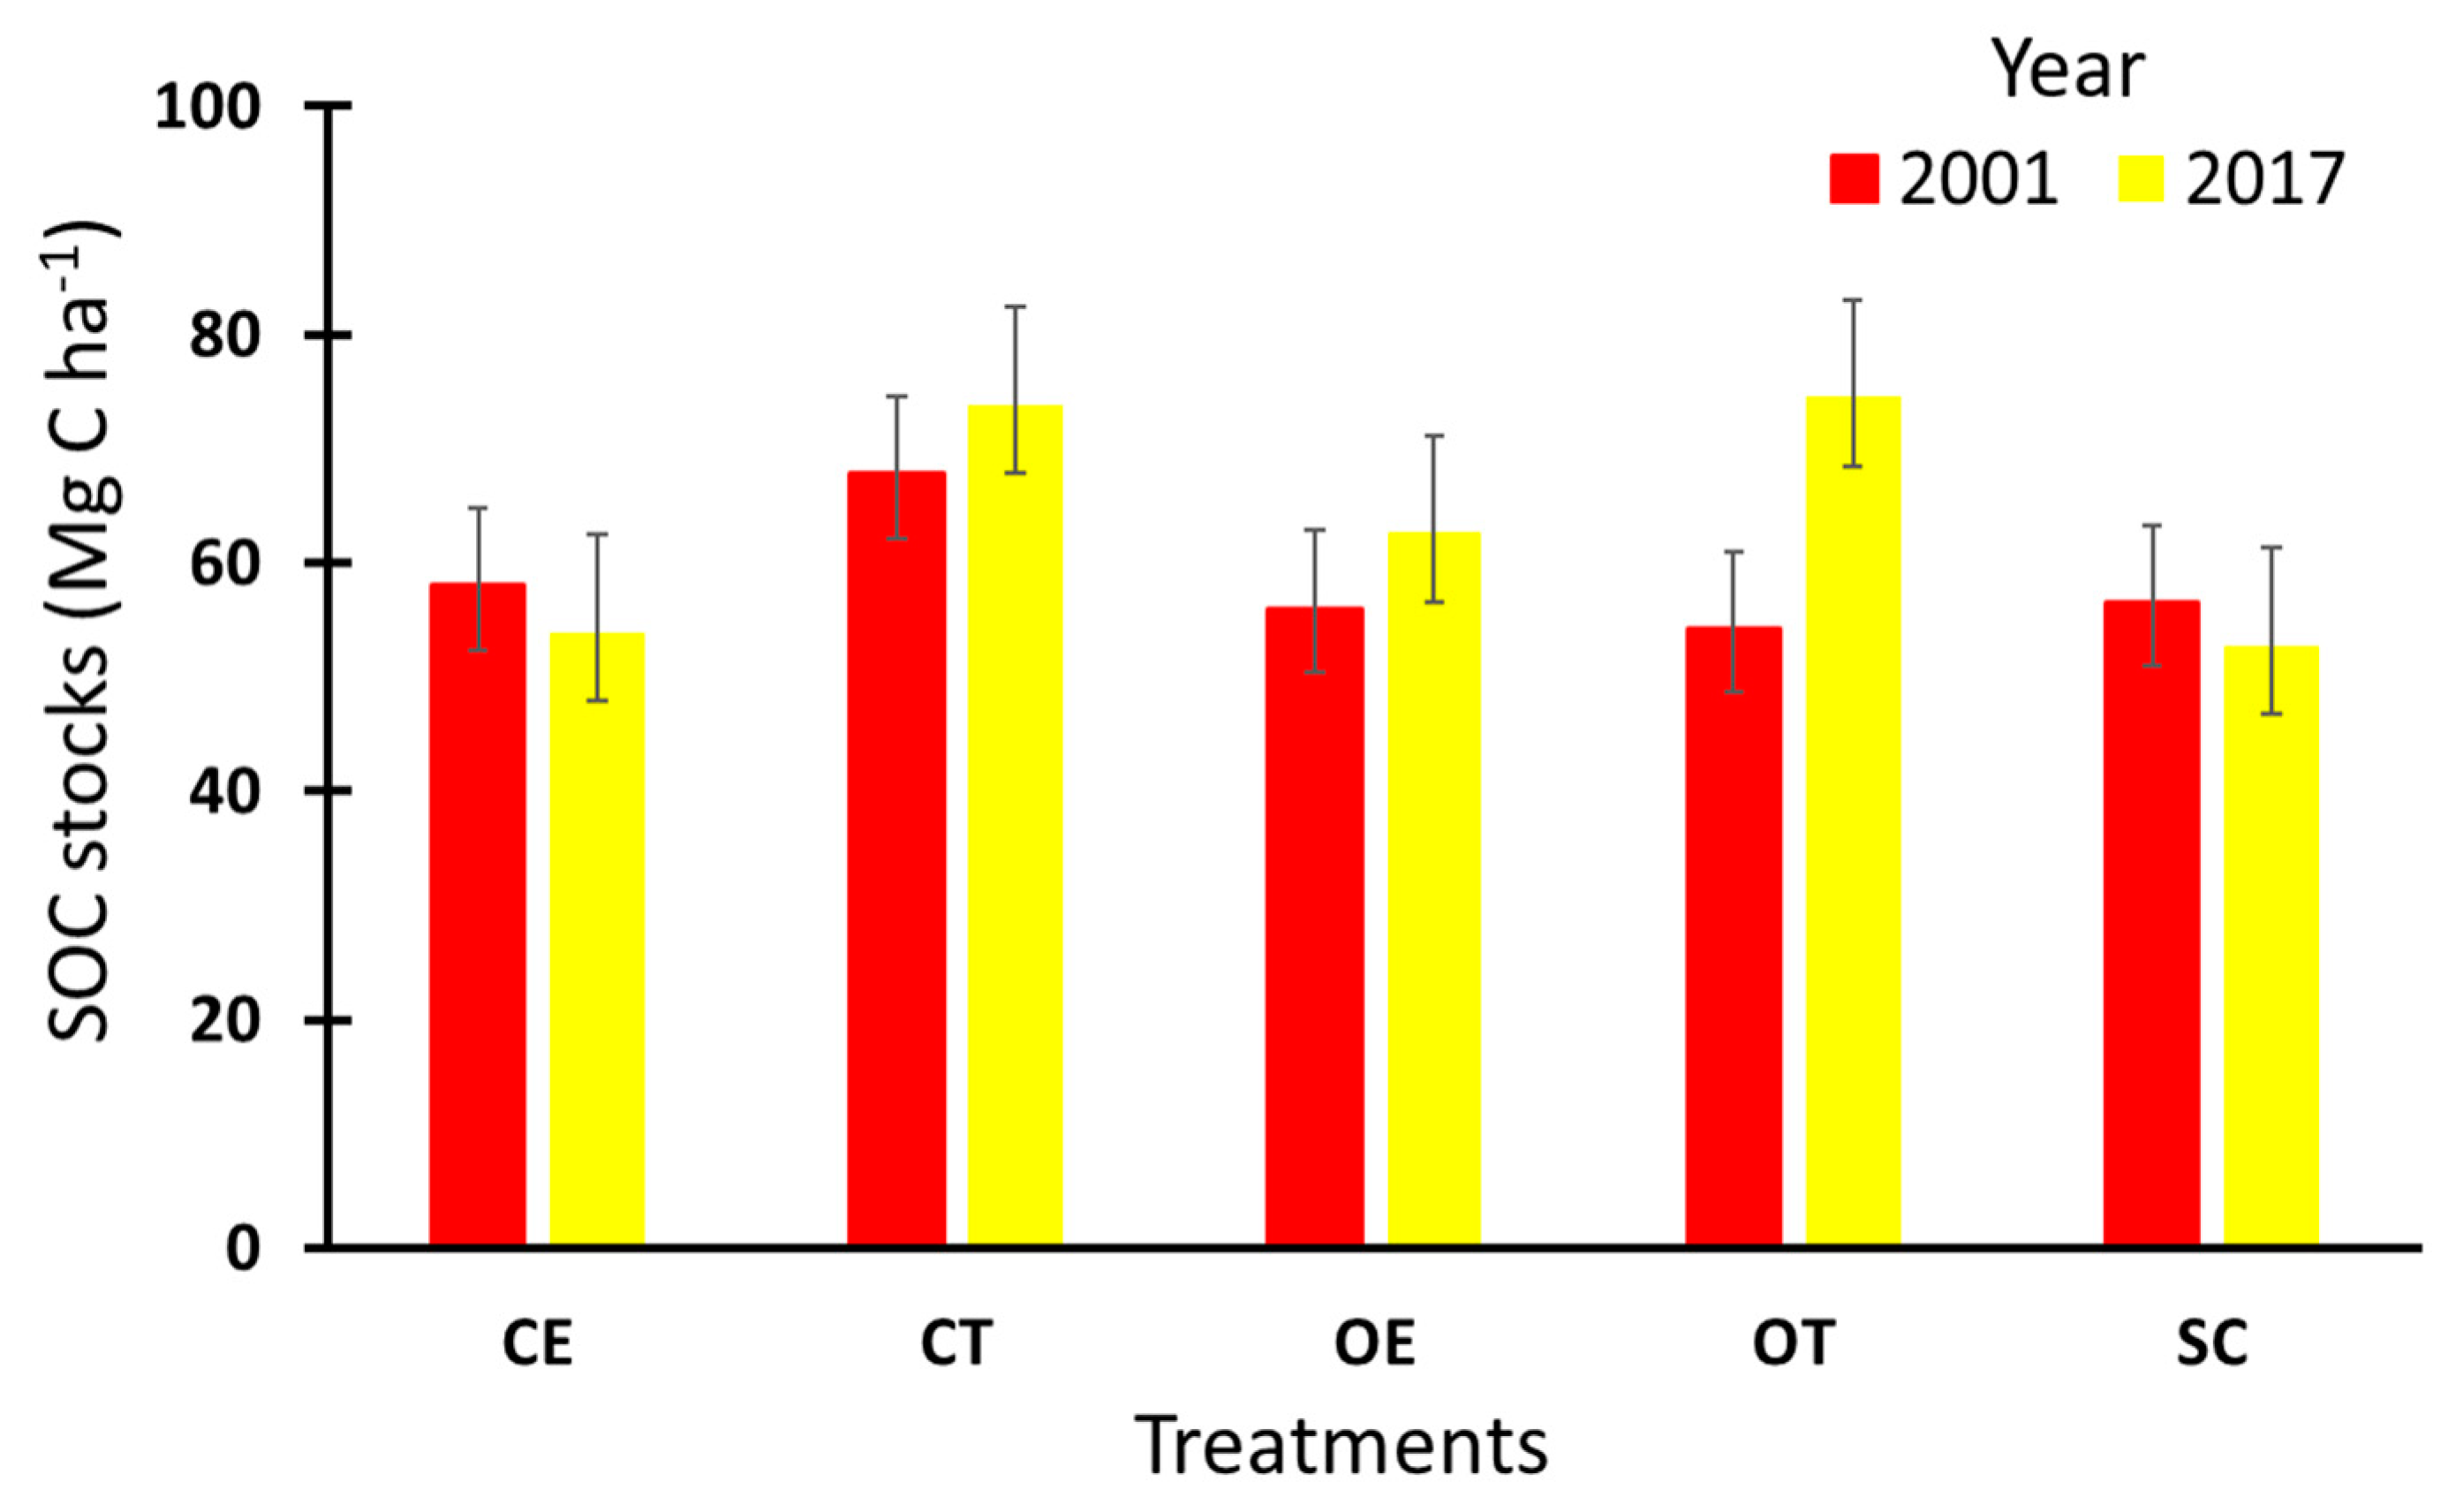
3.6. Carbon Sequestration Potential (CSP)

The SOC stocks calculated from the C concentrations at the start of the experiment in 2001 were compared to SOC stocks in measured in 2017 under CE, CT, OE, OT, and SC treatments (Table 8, Figure 7). Additionally, the carbon sequestration potential (Mg C ha−1 yr−1) reported the following trend: OT > OE ~ CT > CE ~ SC. The CSP was the highest under OT (1.3 Mg C ha−1 yr−1). Both SC and CE showed a decrease in SOC stocks from the time of establishment of AFS in 2001 (Figure 7).

3.7. Effect of Management and Type of Shade on SOC Stocks

The results from the mixed effects model for each soil depth class including coffee management (subplot) treatments and the initial C concentration (measured in the year 2001) as fixed effects showed for 0–10 cm soil depth SOC stock changes were significantly in the organic than the conventional management treatments (p = 0.0003). For the lower depth classes (up to 30 cm), SOC stocks declined and no significant differences were noted between organic and conventional management practices (p = 0.54). As an additional test, we used a non-parametric Wilcoxon rank sum test and no significant differences were noted in SOC stocks in the entire soil depth 0–30 cm was evaluated (p = 0.54) between conventional and organic management. The soil organic carbon stocks within AFS treatments with pruned shade trees (Erythrina shade) were significantly higher (p = 0.107) in the 0–10 cm soil depth but no significant differences were noted for 10–30 cm (p = 0.61).

3.8. Modeling the Effect of Textural Variability on SOC Stocks in Whole Soil

We looked at the textural variabilities in soil (Table 2) and the regression models with clay and silt as co-variates for whole soil. The regression models with percentage clay content and percentage silt content as a covariate for whole soil, indicated that both silt and clay content in soil across treatments affected the SOC stocks in whole soil (p = 0.024; p = 0.033).

4. Discussion

4.1. Land-Use System—Soil Depth Class—Aggregate Size Interactions in SOC Storage under Shaded AFS

While reporting results involving multiple factors and their effects on SOC stocks, it is essential to analyze and interpret all possible interactions influencing SOC stocks [38]. The significant Fraction size × Treatment interaction (Table 6 and Table 7) indicate that fraction sizes within soil aggregates influence the effect of treatments on SOC stocks. Considering the macroaggregate (>250 µm) fraction size as the reference, the other two fraction sizes showed significant different main effect on SOC stock. This indicated that there were differences between fraction sizes in the amount of SOC stocks stored within them (Table 6 and Table 7), or, the amount of SOC stock is influenced by land-use system and fraction size. The interaction effect was also significant, in Depth × Fraction size (Table 7), that means the fractions sizes also had a significant effect on the amount of SOC stocks at different depth classes. Therefore, SOC stock variations at different depth classes can also be attributed to the relative levels of various fraction sizes. For example, predominance of a fraction size such as macroaggregates or silt + clay could also be an indication of higher or lower levels of total SOC stock at any depth class. The amount of SOC stock at any depth class was not influenced by land use system (treatments) but was influenced by soil fraction size class. The influence of soil fraction size class on SOC stocks have been reported previously in coherence to our findings in other agroforestry systems such as Silvopastoral systems in Brazil and USA, shaded cocoa AFS in Brazil, Dehesa systems in Spain, shaded coffee AFS and, Homegardens in India [17,27,28,36,37,39]. The effect of fraction size class was significantly different at different depth classes. The interactions of Depth × Treatment were not significant in general and under a specific level of treatment interaction. Thus, SOC stocks under shaded and unshaded systems (CE, CT, OE, OT vs. SC) did not vary significantly at any depth class. The interaction effects of Fraction size × Treatment with respect to specific treatments was significant for SC indicating that even though the effect of shade vs. unshaded treatments is not significant under whole soil, statistical differences are noted within fraction size (Table 6).

4.2. SOC Stocks in Whole Soil

It is important to understand the temporal trends in SOC stocks in a changing land-use system or agricultural practices when assessing their potential environmental impacts. Factors like vegetation type, climate, ecosystem productivity, soil aggregates, soil texture, and management practices strongly influence the input and output of organic carbon within agroecosystems [21]. Although, increased aboveground biomass and subsequent increased organic matter input is presumed to improve SOC stocks in tree based, shaded perennial AFS, which often mimic forest-like ecosystem [40], this study site did not demonstrate the presumed trend. Such a trend could be attributed to the previous land-use history of the sites (sugar cane fields) and also direct us towards the fact that these systems, predominated by woody plants and limited soil disturbance post land-use change from sugar cane to coffee AFS maybe transitioning to new equilibrium between organic matter input and SOC stocks [11]. The biomass input was higher under CE and OE treatments (Table 1) but the SOC stocks did not show a significant difference within CE, OE and other AFS as well as SC (Figure 3). On the other hand, organic management practices increased SOC stocks temporally in the top soil (Figure 7). The difference between management treatments could be attributed to application of organic fertilizers (at up to 11.25 Mg ha−1 year−1). Moreover, the amount of organic fertilizer applied was positively correlated to changes in 0–10 cm depth SOC (r2 = 0.18, p < 0.01) [11] while amount of leaf litter and pruned material also did not have any significant effect on SOC stocks beyond 10 cm [11]. Thus, organic management could aide in increasing SOC stocks, in the soil layer in this particular study location in coherence with other studies reported from the region [11,41,42].
The SOC stocks under OT (125 Mg C ha−1), OE (114 Mg C ha−1), up to a depth of 100 cm were comparable to the values of 111 Mg C ha−1 for shade grown coffee systems up to a depth of 40 cm in Costa Rica [5] and global estimates of ~150 Mg C ha−1 under shaded perennial AFS [43]. The SOC stocks in our study site at the onset of the experiment in the year 2001 as reported in the following order of CE, CT, OE, OT and SC (Mg C ha−1) as: 54, 67.8, 56, 54.2 and 56.5 up to a depth of 40 cm [11]. Over the period of 16 years, the SOC stocks from this study as quantified in the year 2017 are being reported in the following order of CE, CT, OE, OT and SC (Mg C ha−1) as: 53.9, 71.6, 60.3, 61.5 and 52.8 (Figure 7). This leads us to infer that even though SOC stocks increased under most AFS no significant differences were noted. Additionally, the carbon sequestration potential (CSP) in the order of the treatments CE, CT, OE, OT and SC (Mg C ha−1 yr−1) were 0.3, −0.2, 0.4, 1.3 and −0.2 respectively (Table 8) which are not very high amount of C sequestration rates considering the fact that the agroforestry experiment was initiated 15 years back.
Total SOC stock decreased with soil depth in all land-use systems (Figure 3), in coherence to other reported results from different coffee growing regions in Uganda, Togo, Peru, Mexico and India [17,40,42,44,45,46,47]. All these studies have reported varied ranges of SOC stocks within coffee AFS. This shows that SOC stocks under shaded AFS varies globally due to variations within ancillary factors like soil condition, age of system, soil type, previous land-use history, types of shade tree, and so on.

4.3. Soil Organic Carbon in Various Aggregate-Size Fractions

4.3.1. Macroaggregates (>250 µm)

Macroaggregates are formed when light fraction (LF) SOM, which is composed of fresh plant residue, is decomposed by fungi and bacteria. Fungal hyphae and bacterial extracellular polysaccharides serve as nucleation cores to accrete larger masses of slightly decomposed SOM that become macroaggregates. The macroaggregates comprised of the highest soil weight recovery and distribution post wet sieving and oven drying (Table 5), ranging from 70.6% and 68.5% under FO and CE to 38.5% under SC up to a depth of 100 cm. Similar skewness of weight distribution towards macroaggregates within AFS were also reported by other researches from different sites globally [16,17,48]. The formation of macroaggregates begin when light fraction soil organic matter (SOM) is decomposed by soil microbes. This light fraction SOM is primarily composed of fresh plant residues and along with fungal hyphae and bacterial polysaccharides accrete more SOM to promote higher macroaggregate formation [21,49]. In land-use systems such as AFS, there is a continuous of fresh plant residue from tree litterfall, promoting macroaggregate formation. This could have impacted the aggregate weight distribution towards macroaggregate within AFS in our study. The variations in SOC content within macroaggregates is mostly limited to the topsoil [50]. In this study, within the depth of 30 cm, higher contents of SOC stocks were found within the macroaggregates of CT, OE and OT than in SC; where SOC stocks decreased by 30% (Figure 5). Beyond 60 cm, the SOC stocks within macroaggregates of FO were significantly higher that all other AFS but no significant differences were noted between SC and coffee AFS treatments. Similar trends were reported from a study conducted in a rubber AFS site where differences in SOC stocks in macroaggregates were noted only beyond a depth of 30 cm [48].
These AFS systems considered for the study was established in the year 2001 (~17 years old), while the FO has been in place for >100 years. The SOC stock values are considered as characteristic of each systems thus the significant difference noted between FO and other AFS especially in the lower depth classes (60–100 cm) could also reflect the “tree effect” in time. The lack of difference between unshaded SC and shaded AFS treatments highlights the poor correlation of above ground biomass stocks to SOC stocks and system specificity. Similar trends have been reported from the same study site [11].

4.3.2. Microaggregates (250–53 µm)

Within microaggregates, no significant differences were noted across all depth classes with the exception of CE being significantly lower than FO. The mean residence time (MRT), of microaggregates ranges between 10 and 100 years [50,51,52]. Given the intimate association of MRT of SOC within microaggregates and its subsequent stability, one may concur that the C stored in microaggregates are more robust than macroaggregates and improved SOC storage within this size class under AFS with organic management OE and OT are relatively more secure and stable. However, the results of this study show that SOC allocation within fraction sizes are highly site-specific and depends on a myriad of other components than just increased biomass from AFS over conventional practices such as SC and management practices. Additionally, the physicochemical properties inherent to the soils often limits SOC stocks and further sequestration even when input to the system in the form of organic matter is increased [21]. The soils under coffee AFS have been left undisturbed which could have led to stabilized SOC equivalent to SOC stored within microaggregates in FO. Other supporting evidence highlighting the role of microaggregates in improving SOC stocks and C sequestration in wheat fields showed that carbon from wheat straw was stabilized and stored in microaggregates [53,54].

4.3.3. Silt and Clay Fraction (<53 μm)

The SOC stocks in the silt-and-clay fraction were significantly higher under the organically managed, Terminalia shade AFS (OT) up to a depth of 60 cm. The percentage weight distribution within this aggregate size increased with depth under all land-use types similar to studies [16,37,48]. Post wet sieving, the distribution of silt-and-clay fraction under FO within 60–100 cm accounted to only 28.2 g while OE and OT treatments reported 18.6 g and 22.1 g respectively (Table 3). No significant difference was noted in SOC stocks among treatments under this depth class which indicates that treatments under Terminalia amazonia could have promoted aggregate distribution [55], especially in improving the allocation within the smallest aggregate size classes.

4.4. Rhizodeposition and Management under Shaded Perennial Systems

4.4.1. Timber Species versus N2 Fixing Species

In Costa Rica, coffee (Coffea arabica) are often grown under the shade of tall shade trees [56]; as these systems are known to have higher potential for soil carbon sequestration apart from improving soil health, nutrient cycling and providing other ecosystem services [57]. The roots of the coffee shrubs can extend up to 2 m in total length [58], although the fine roots are concentrated up to a depth of 40 cm, which corroborates the higher distribution of SOC stocks up to 30 cm in our study. This rooting depth is a function of soil type [59].
In AFS, the choice of shade tree becomes a critical moderator for SOC stock improvement, as seen in this study and other studies in Costa Rica [60,61]. Globally, farmers have many practical reasons for planting leguminous shade trees like Erythrina spp., Gliricidia spp. along with coffee and cacao AFS; e.g., ease of establishment and ability to re-sprout after pollarding [19]. However, the benefits of including Erythrina spp. in intensively managed coffee plantations are only limited to the top soil [19,33]. In this study, we found similar trends where coffee AFS under the shade of highly pruned Erythrina spp. contributed to an increase in SOC stocks only up to a depth of 10 cm after 17 years of establishment. The lack of significant differences beyond a depth of 10 cm could be due to limited rate of incorporation of organic matter from topsoil into deeper soil layers. In deeper soil layers, the incorporation of SOC stocks is facilitated by root mediated mechanisms such as organic matter input via root turn over, exudation, effect of the root sink on soil water relations, and so on [11]. In the study site, the lack of significant increase in SOC stocks after 17 years could be due to stimulated SOC decomposition by accelerated aeration which in turn fast paced the effect of labile C from roots, priming soil microbes to deplete the existing SOC stocks quickly [62,63].
It is imperative to comprehend the rooting pattern, root growth and decomposition in coffee plantations under the varying shade trees (Timber versus N2 fixing). Understanding such variations are pivotal to improvement in SOC stocks and the very existence of ecosystem services like production of timber and non-timber produce, to regulation or support of various ecosystem functions such as pest control or nitrogen cycling [64]. There is still limited understanding of how the rhizodeposition from shade trees affect soil carbon sequestration [65]. Understanding the dynamics and patterns of rhizodeposition by introducing trees within agricultural crops to improve SOC stocks are crucial in order to device management practices that will foster C accumulation in soils [66]. Farmers have many practical reasons for choosing N2 fixing shade tree species, such as Erythrina spp. as they are easy to establish and grows faster upon pollarding, large amount of litterfall and subsequent nutrient recycling from litterfall pruning residues [19]. However, in our study we did not note a direct correlation between increased litterfall and SOC stocks (Table 1, Table 2 and Table 3). Overall, the treatments under Erythrina, CE and OE received an average biomass (including litterfall and prunings) of 17.4 Mg C ha−1 while the ones under Terminalia, CT and OT received 8–10 Mg C ha−1, but the SOC stocks (Mg C ha−1) were in the order of: OT > OE; CT > CE. This bolsters the fact that effect of rhizodeposition is more pivotal in these systems. Similar ideas highlighting differences in root biomass and architecture (rooting depth, distance, area and volume) were also reported [66,67] that could contribute to altered SOC stocks.

4.4.2. Organic Versus Conventional Management

In the past decade, much attention has been devoted to organic management practices for SOC stock improvements and its potential C sequestration in soil. Some researchers have been proponents of organic treatments [68,69], while other studies have been the opponents of organic management practices [4,13,70]. These studies have warned of the short comings of organic management practices and C accounting methodologies that can over-estimate the net sequestration of C into soil [11]. The term C sequestration is often used define an increase in SOC stocks over time following a change in land-use system. The coffee agroforestry in our study site was established in the year 2001. Over the past 17 years, the soil carbon stocks have not increased significantly under all treatments up to a depth of 40 cm (Figure 7). The soil carbon sequestration potential was highest under OT at 1.3 Mg C ha−1 yr−1 which was well within the ranges (0.65–1.54 Mg C ha−1 yr−1) reported by studies from the same site [8]. However, scientists argue that these improvements in SOC stocks could aide in climate change mitigation if they result in net addition transfer of C from atmospheric CO2 to soil which is not necessarily the case [8,11]. At this point, one may question the use of added organic C by the application of amendments such as chicken manure, coffee pulp as these applications may lead to only a transfer of C from one terrestrial pool to another and might not actually lead to “sequestration” [70]. Had alternative practices stored the C in soil for longer (e.g., through conversion of the organic input to biochar, biosolid) then it may have more net positive impact in C sequestration. In our study, we assessed the effects of management practices on SOC stocks. Analyzing such effects using a mixed effects model could bring about some clarity on this. Taking this discussion any further is beyond the scope of our study.

4.4.3. Do Trees in AFS Always Improve and Sequester Carbon Stocks Deeper in the Soil?

In order to comprehend, the effects of land-use systems such as AFS on SOC stocks, one needs to the environmental impact that systems contribute to. Several studies have reported a decline in SOC stocks when shifted from forest to managed ecosystems [11,71,72]. In this study site in Costa Rica, the shift in land-use from arable sugar cane to coffee agroforestry showed only slight increase in SOC stocks even after 17 years of establishment. Study from the same site in Costa Rica reported a nine-year decrease in SOC stocks over 0–40 cm depth by an average, across all AFS, of 9.99 Mg C ha−1 (12.4%) [11]. Our studies showed an average increase of 16% in 17 years for all AFS except CE (Figure 7). This indicates that changes in management practices and land-use need the transition time to reach a new equilibrium as there is a sudden increase in inputs of organic matter before actual SOC accrual starts. Additionally, we noted that SOC stocks increased in 0–10 cm depth, coherent to previous studies conducted in the same experimental site [11]. Addition of organic fertilizer, leaf prunings and litter could be attributed to the increase in SOC stocks in the 0–10 cm depth. This directs us to comment that, in addition to soil type, climate, management practices and the SOC storage capacity of soil [73], the SOC stock in surface soil depends on the quantity and quality of organic matter and litter input [74,75]. This bolsters our findings where coffee AFS under heavily pruned Erythrina shade trees showed increased SOC stock with soil depth 0–10 cm, but not in unpruned coffee AFS under the shade of Terminalia trees. This increased SOC stocks, restricted to the topsoil are not resistant to decomposition. An interesting observation that we noted from this study was the lack of significant differences in SOC stock between the shaded AFS and SC across all depth classes and fraction sizes (Supplementary Figures S1 and S2) despite great variation in the above-ground biomass within these systems (between an average of 9.1 Mg C ha−1 for SC, 22.6 Mg C ha−1 for OE, CE and 115.8 Mg C ha−1 for OT, CT shaded AFS [11]. Thus, increasing above ground biomass need not necessarily be positively linear correlated to above ground biomass. Assuming such a linear correlation may lead to erroneous estimates of total C in large ecosystems [8,11] but can still be practiced in farm-scale afforestation and reforestation total C accounting as proposed by the United Nations Framework Convention for Climate Change in the year 2011.
In summary, carbon stocks deeper in the soil (below 50 cm) are more resistant to decomposition than those in the surface soil and are therefore considered sequestered. Repeated addition of easily decomposable leaf litter such as leaf biomass (prunings) of nitrogen-rich shade trees (E. poeppigiana) to the soil surface may not lead to long-term soil C build-up in deeper layers, because such materials will easily decompose and release most (up to 90%) of the C as CO2 into the atmosphere. In the long run (maybe 50+ years; this study site had this treatment for only 17 years) some of that C may get stored in deeper layers in microaggregates and silt + clay fractions and become sequestered. That is why there is more C in FO plots. This is only hypothetical; we don’t have long-term data.

4.5. Are Textural Variations Influencers of SOC Stocks in Soil?

The inclusion of textural variation as a covariate to extract its effect of SOC stocks showed that both silt and clay content influenced SOC stocks in whole soil and textural variations did influence SOC stocks. However, there is lack of universality in this relationship. Studies conducted in grasslands of New Zealand, coffee AFS in India reported no correlation between textural variation and SOC stocks [8,76]. It was suggested that the relationship between SOC stocks and clay content depends on the scale size of the study with different climatic gradients and vegetation can also be a moderator [77]. The same study also showed that SOC stock and clay percentage decreased linearly from humid climatic conditions to the semi-arid sites, suggesting that these changes were partly controlled by rainfall regimes at a regional scale. At local scale, the soil nutrients like total N and total P could also be key driving factors along with textural variations in influencing SOC stocks.

4.6. Limitations of the Study

One of the limitations of this study is the lack of uniformity in soil characteristics between FO and other AFS. We noticed that FO had the highest clay content and lowest bulk density in particular, at a depth of 60–100 cm. At this depth class, the supply of organic matter is certainly not so high to reduce bulk density to 0.75 g cm−3. At a given depth, for the silt + clay fraction (<53 µm), the second lowest organic carbon stock was observed (Figure 6) and this fraction had the highest average percentage weight of all other plots in this depth, indicating that the aggregation is lower and could not lead to higher porosity and this explained the lower bulk density. In addition, the proportion of clay in the FO area was more than 20% higher than all other treatments at all depths. The soil conditions may not have been similar especially in terms of textural properties at lower depths. This does not mean that the AFS treatments are not comparable to FO but need to be regarded as different in characteristics. Such variabilities are characteristics of long-term stands of different AFS management practices. One must acknowledge that these practical challenges within AFS studies and the AFS treatments here have been represented in actual field conditions. The lack of availability of uniform sites of long-term plant associations are realities in agroforestry and therefore explorative studies, such as this one, are of value. These results are only indicative and site-specific.

5. Conclusions

The presence of trees that provide optimum shade density and increase above-ground biomass in shaded perennial AFS is generally perceived as contributing to increase in SOC stocks. Our study from a seventeen-year-old experimental site did not agree with this general perception. Although overall SOC stocks improved over 17 years under most AFS, the increase was not proportional to aboveground biomass. We attribute the lack of such a correlation between aboveground biomass and increased SOC stocks within treatments to a multitude of factors that influence changes in SOC stocks, such as the nature of shade tree, soil type, quality of litter and pruning added to the soil, previous land-use, and so on. The treatments coffee under Erythrina poeppigiana managed both conventionally, i.e., with chemical fertilizer application (CE), and organically (OE) had almost double the quantity of biomass and higher shade density as compared to the corresponding treatments under Terminalia amazonia (CT and OT), the SOC stocks did not correlate with increased biomass and shade density. Forest continued to have the highest SOC stocks especially beyond a depth of 60 cm. Our results suggest that the shaded coffee AFS could play an important role in environmental protection by mitigating GHG emission through the storage of relatively high amounts of well-protected organic carbon in the smallest soil fractions compared with treeless systems. However, soil- and plant management practices have considerable influence on the extent of benefit that can be realized from such systems.

Supplementary Materials

The following are available online at https://www.mdpi.com/1999-4907/11/1/49/s1, Figure S1: Multiple paired comparison of various AFS with Forest (FO) for all fraction size at various depth classes, Figure S2: Multiple paired comparison of various AFS with Sun Coffee (SC) for all fraction size at various depth classes.

Author Contributions

Performed the experiments and collected the data: N.C., P.K.R.N., V.D.N., R.G.M., M.R.A.N.; Data analysis, Statistics and R coding: N.C., A.B.; Contributed to writing the manuscript: N.C., P.K.R.N., A.B.; Designed the experiment: N.C., E.d.M.V.F., R.G.M., P.K.R.N., V.D.N. All authors have read and agreed to the published version of the manuscript.

Funding

This research received no external funding.

Acknowledgments

We thank the Centro Agronómico Tropical de Investigación y Enseñanza (CATIE), Costa Rica for permitting us to conduct research in their managed sites; Luis Romero and Luis Araujo for helping us collect the soil samples; Saptarshi Chakraborty for his initial advice on the statistical analyses; Jason Curtis on his assistance with the soil analyses. We express our heartfelt gratitude to Timothy A. Martin, School of Forest Resources and Conservation, University of Florida, Gainesville for awarding a departmental field-work grant to facilitate this study in Costa Rica.

Conflicts of Interest

The authors declare no conflict of interest.

References

  1. Lal, R.; Smith, P.; Jungkunst, H.F.; Mitsch, W.J.; Lehmann, J.; Nair, P.K.R.; McBratney, A.B.; de Moraes Sá, J.C.; Schneider, J.; Zinn, Y.L.; et al. The carbon sequestration potential of terrestrial ecosystems. J. Soil Water Conserv. 2018, 73, 145A–152A. [Google Scholar] [CrossRef] [Green Version]
  2. Stout, B.; Lal, R.; Monger, C. Carbon capture and sequestration: The roles of agriculture and soils. Integr. J. Agric. Biol. Eng. 2016, 9, 1–8. [Google Scholar]
  3. Nair, P.K.R.; Kumar, B.M.; Nair, V.D. Agroforestry as a strategy for carbon sequestration. J. Plant Nutr. Soil Sci. 2009, 172, 10–23. [Google Scholar] [CrossRef]
  4. Powlson, D.S.; Gregory, P.J.; Whalley, W.R.; Quinton, J.N.; Hopkins, D.W.; Whitmore, A.P.; Hirsch, P.R.; Goulding, K.W.T. Soil management in relation to sustainable agriculture and ecosystem services. Food Policy 2011, 36, S72–S87. [Google Scholar] [CrossRef]
  5. Hergoualc’h, K.; Blanchart, E.; Skiba, U.; Hénault, C.; Harmand, J.M. Changes in carbon stock and greenhouse gas balance in a coffee (Coffea arabica) monoculture versus an agroforestry system with Inga densiflora, in Costa Rica. Agric. Ecosyst. Environ. 2012, 148, 102–110. [Google Scholar] [CrossRef]
  6. Lorenz, K.; Lal, R. Biochar application to soil for climate change mitigation by soil organic carbon sequestration. J. Plant Nutr. Soil Sci. 2014, 177, 651–670. [Google Scholar] [CrossRef] [Green Version]
  7. Soto-Pinto, L.; Anzueto, M.; Mendoza, J.; Ferrer, G.J.; de Jong, B. Carbon sequestration through agroforestry in indigenous communities of Chiapas, Mexico. Agrofor. Syst. 2010, 78, 39–51. [Google Scholar] [CrossRef]
  8. Noponen, M.R.A.; Edwards-Jones, G.; Haggar, J.P.; Soto, G.; Attarzadeh, N.; Healey, J.R. Greenhouse gas emissions in coffee grown with differing input levels under conventional and organic management. Agric. Ecosyst. Environ. 2012, 151, 6–15. [Google Scholar] [CrossRef] [Green Version]
  9. Nair, P.R.; Nair, V.D. Solid-fluid-gas: The state of knowledge on carbon-sequestration potential of agroforestry systems in africa. Curr. Opin. Environ. Sustain. 2014, 6, 22–27. [Google Scholar] [CrossRef] [Green Version]
  10. Montagnini, F.; Nair, P.K.R. Carbon sequestration: An underexploited environmental benefit of agroforestry systems. Agrofor. Syst. 2004, 61, 281–295. [Google Scholar]
  11. Noponen, M.R.A.; Healey, J.R.; Soto, G.; Haggar, J.P. Sink or source-The potential of coffee agroforestry systems to sequester atmospheric CO2 into soil organic carbon. Agric. Ecosyst. Environ. 2013, 175, 60–68. [Google Scholar] [CrossRef] [Green Version]
  12. Pardon, P.; Reubens, B.; Reheul, D.; Mertens, J.; De Frenne, P.; Coussement, T.; Janssens, P.; Verheyen, K. Trees increase soil organic carbon and nutrient availability in temperate agroforestry systems. Agric. Ecosyst. Environ. 2017, 247, 98–111. [Google Scholar] [CrossRef]
  13. Sanderman, J.; Baldock, J.A. Accounting for soil carbon sequestration in national inventories: A soil scientist’s perspective. Environ. Res. Lett. 2010, 5, 34–45. [Google Scholar] [CrossRef]
  14. Tscharntke, T.; Clough, Y.; Bhagwat, S.A.; Buchori, D.; Faust, H.; Hertel, D.; Hölscher, D.; Juhrbandt, J.; Kessler, M.; Perfecto, I.; et al. Multifunctional shade-tree management in tropical agroforestry landscapes—A review. J. Appl. Ecol. 2011, 48, 619–629. [Google Scholar] [CrossRef] [Green Version]
  15. Monroe, P.H.M.; Gama-Rodrigues, E.F.; Gama-Rodrigues, A.C.; Marques, J.R.B. Soil carbon stocks and origin under different cacao agroforestry systems in Southern Bahia, Brazil. Agric. Ecosyst. Environ. 2016, 221, 99–108. [Google Scholar] [CrossRef]
  16. Gama-Rodrigues, E.F.; Nair, P.K.R.; Nair, V.D.; Gama-Rodrigues, A.C.; Baligar, V.C.; Machado, R.C.R. Carbon storage in soil size fractions under Two cacao agroforestry systems in Bahia, Brazil. Environ. Manag. 2010, 45, 274–283. [Google Scholar] [CrossRef]
  17. Chatterjee, N.; Nair, P.K.R.; Nair, V.D.; Viswanath, S.; Bhattacharjee, A. Depth-wise distribution of soil-carbon stock in aggregate-sized fractions under shaded-perennial agroforestry systems in the Western Ghats of Karnataka, India. Agrofor. Syst. 2019. [Google Scholar] [CrossRef]
  18. Chatterjee, N.; Nair, P.K.R.; Chakraborty, S.; Nair, V.D. Agriculture, Ecosystems and Environment Changes in soil carbon stocks across the Forest-Agroforest-Agriculture/Pasture continuum in various agroecological regions: A meta-analysis. Agric. Ecosyst. Environ. 2018, 266, 55–67. [Google Scholar] [CrossRef]
  19. Beer, J. Litter production and nutrient cycling in coffee (Coffea arabica) or cacao (Theobroma cacao) plantations with shade trees. Agrofor. Syst. 1988, 7, 103–114. [Google Scholar] [CrossRef]
  20. Oelbermann, M.; Voroney, R.P. Carbon and nitrogen in a temperate agroforestry system: Using stable isotopes as a tool to understand soil dynamics. Ecol. Eng. 2007, 29, 342–349. [Google Scholar] [CrossRef]
  21. Six, J.; Conant, R.T.; Paul, E.A.; Paustian, K. Stabilization mechanisms of soil organic matter: Implications for C-saturation of soils. Plant Soil 2002, 241, 155–176. [Google Scholar] [CrossRef]
  22. Chevallier, T.; Blanchart, E.; Albrecht, A.; Feller, C. The physical protection of soil organic carbon in aggregates: A mechanism of carbon storage in a Vertisol under pasture and market gardening (Martinique, West Indies). Agric. Ecosyst. Environ. 2004, 103, 375–387. [Google Scholar] [CrossRef]
  23. Jastrow, J.D.; Amonette, J.E.; Bailey, V.L. Mechanisms controlling soil carbon turnover and their potential application for enhancing carbon sequestration. Clim. Chang. 2007, 80, 5–23. [Google Scholar] [CrossRef]
  24. Hassink, J. The capacity of soils to preserve organic C and N by their association with silt and clay particles. Soil Sci. Soc. Am. J. 1997, 61, 131–139. [Google Scholar] [CrossRef]
  25. Tisdall, J.M.; Oades, J.M. Organic matter and water-stable aggregates in soils. J. Soil Sci. 1982, 33, 141–163. [Google Scholar] [CrossRef]
  26. Haile, S.G.; Nair, P.K.R.; Nair, V.D. Carbon Storage of Different Soil-Size Fractions in Florida Silvopastoral Systems All rights reserved. J. Environ. Qual. 2008, 37, 1789–1797. [Google Scholar] [CrossRef]
  27. Howlett, D.S.; Mosquera-Losada, M.R.; Nair, P.K.R.; Nair, V.D.; Rigueiro-Rodríguez, A. Soil carbon storage in silvopastoral systems and a treeless pasture in northwestern Spain. J. Environ. Qual. 2011, 40, 825–832. [Google Scholar] [CrossRef]
  28. Tonucci, R.G.; Nair, V.D.; Ramachandran Nair, P.K.; Garcia, R. Grass vs. tree origin of soil organic carbon under different land-use systems in the Brazilian Cerrado. Plant Soil 2017, 419, 281–292. [Google Scholar] [CrossRef]
  29. Tonucci, R.G.; Nair, P.K.R.; Nair, V.D.; Garcia, R.; Bernardino, F.S. Soil Carbon Storage in Silvopasture and Related Land-Use Systems in the Brazilian Cerrado. J. Environ. Qual. 2011, 40, 833–841. [Google Scholar] [CrossRef]
  30. Takimoto, A.; Nair, V.D.; Nair, P.K.R. Contribution of trees to soil carbon sequestration under agroforestry systems in the West African Sahel. Agrofor. Syst. 2009, 76, 11–25. [Google Scholar] [CrossRef]
  31. RStudio Team. RStudio Integrated Development for R; RStudio, Inc.: Boston, MA, USA, 2019. [Google Scholar]
  32. The Food and Agriculture Organization. Agriculture in Costa Rica. Available online: http://www.fao.org/3/y4632e/y4632e0a.htm (accessed on 29 November 2019).
  33. Haggar, J.; Barrios, M.; Bolaños, M.; Merlo, M.; Moraga, P.; Munguia, R.; Ponce, A.; Romero, S.; Soto, G.; Staver, C.; et al. Coffee agroecosystem performance under full sun, shade, conventional and organic management regimes in Central America. Agrofor. Syst. 2011, 82, 285–301. [Google Scholar] [CrossRef]
  34. Muschler, R.G. Shade improves coffee quality in a sub-optimal coffee-zone of Costa Rica. Agrofor. Syst. 2001, 51, 131–139. [Google Scholar] [CrossRef]
  35. Elliott, E.T. Aggregate Structure and Carbon, Nitrogen, and Phosphorus in Native and Cultivated Soils. Soil Sci. Soc. Am. J. 1986, 50, 627–633. [Google Scholar] [CrossRef]
  36. Haile, S.G.; Nair, V.D.; Nair, P.K.R. Contribution of trees to carbon storage in soils of silvopastoral systems in Florida, USA. Glob. Chang. Biol. 2010, 16, 427–438. [Google Scholar] [CrossRef]
  37. Saha, S.K.; Nair, P.K.R.; Nair, V.D.; Kumar, B.M. Carbon storage in relation to soil size-fractions under tropical tree-based land-use systems. Plant Soil 2010, 328, 433–446. [Google Scholar] [CrossRef]
  38. Vargas, M.; Glaz, B.; Alvarado, G.; Pietragalla, J.; Morgounov, A.; Zelenskiy, Y.; Crossa, J. Analysis and interpretation of interactions in agricultural research. Agron. J. 2015, 107, 748–762. [Google Scholar] [CrossRef] [Green Version]
  39. Takimoto, A.; Nair, P.K.R.; Nair, V.D. Carbon stock and sequestration potential of traditional and improved agroforestry systems in the West African Sahel. Agric. Ecosyst. Environ. 2008, 125, 159–166. [Google Scholar] [CrossRef]
  40. Hombegowda, H.C.; van Straaten, O.; Köhler, M.; Hölscher, D. On the rebound: Soil organic carbon stocks can bounce back to near forest levels when agroforests replace agriculture in southern India. SOIL Discuss. 2015, 2, 871–902. [Google Scholar] [CrossRef]
  41. Häger, A. The effects of management and plant diversity on carbon storage in coffee agroforestry systems in Costa Rica. Agrofor. Syst. 2012, 86, 159–174. [Google Scholar] [CrossRef]
  42. Soto-Pinto, L.; Aguirre-Dávila, C.M. Carbon stocks in organic coffee systems in Chiapas, Mexico. J. Agric. Sci. 2014, 7, 117–128. [Google Scholar] [CrossRef] [Green Version]
  43. Abou Rajab, Y.; Leuschner, C.; Barus, H.; Tjoa, A.; Hertel, D. Cacao Cultivation under Diverse Shade Tree Cover Allows High Carbon Storage and Sequestration without Yield Losses. PLoS ONE 2016, 11, e0149949. [Google Scholar]
  44. Tumwebaze, S.B.; Byakagaba, P. Soil organic carbon stocks under coffee agroforestry systems and coffee monoculture in Uganda. Agric. Ecosyst. Environ. 2016, 216, 188–193. [Google Scholar] [CrossRef]
  45. Tumwebaze, S.B.; Bevilacqua, E.; Briggs, R.; Volk, T. Soil organic carbon under a linear simultaneous agroforestry system in Uganda. Agrofor. Syst. 2012, 84, 11–23. [Google Scholar] [CrossRef]
  46. Dossa, E.L.; Fernandes, E.C.M.; Reid, W.S.; Ezui, K. Above-and belowground biomass, nutrient and carbon stocks contrasting an open-grown and a shaded coffee plantation. Agrofor. Syst. 2008, 72, 103–115. [Google Scholar] [CrossRef]
  47. Ehrenbergerová, L.; Cienciala, E.; Kučera, A.; Guy, L.; Habrová, H. Carbon stock in agroforestry coffee plantations with different shade trees in Villa Rica, Peru. Agrofor. Syst. 2016, 90, 433–445. [Google Scholar] [CrossRef]
  48. Chen, C.; Liu, W.; Jiang, X.; Wu, J. Effects of rubber-based agroforestry systems on soil aggregation and associated soil organic carbon: Implications for land use. Geoderma 2017, 299, 13–24. [Google Scholar] [CrossRef]
  49. Jastrow, D. Soil aggregate formation and the accrual of particulate and mineral-associated organic carbon. Soil Biol. Biochem. 1996, 28, 665–676. [Google Scholar] [CrossRef]
  50. Totsche, K.U.; Amelung, W.; Gerzabek, M.H.; Guggenberger, G.; Klumpp, E.; Knief, C.; Lehndorff, E.; Mikutta, R.; Peth, S.; Prechtel, A.; et al. Microaggregates in soils. J. Plant Nutr. Soil Sci. 2018, 181, 104–136. [Google Scholar] [CrossRef] [Green Version]
  51. Fontaine, S.; Barot, S.; Barré, P.; Bdioui, N.; Mary, B.; Rumpel, C. Stability of organic carbon in deep soil layers controlled by fresh carbon supply. Nature 2007, 450, 277–280. [Google Scholar] [CrossRef]
  52. Chenu, C.; Plante, A.T. Clay-sized organo-mineral complexes in a cultivation chronosequence: Revisiting the concept of the “primary organo-mineral complex”. Eur. J. Soil Sci. 2006, 57, 596–607. [Google Scholar] [CrossRef]
  53. Angers, D.A.; Recous, S.; Aita, C. Fate of carbon and nitrogen in water-stable aggregates during decomposition of 13C15N-labelled wheat straw in situ. Eur. J. Soil Sci. 1997, 48, 295–300. [Google Scholar] [CrossRef]
  54. Gale, W.J.; Cambardella, C.A.; Bailey, T.B. Root-derived carbon and the formation and stabilization of aggregates. Soil Sci. Soc. Am. J. 2000, 64, 201–207. [Google Scholar] [CrossRef]
  55. Garces, A.M. Characterization of the Spatial Variability of Soil Properties and Coffee Fine Roots in Shade Tree-Coffee Associations under Organic and Conventional Management Practices. Ph.D. Thesis, Tropical Agriculture Research and Higher education Centre, Turrialba, Costa Rica, 2011. [Google Scholar]
  56. Defrenet, E.; Roupsard, O.; van den Meersche, K.; Charbonnier, F.; Stokes, A.; Roumet, C.; Rapidel, B.; De Melo, E.; Filho, V.; Vargas, V.J.; et al. Root biomass, turnover and net primary productivity of a coffee agroforestry system in Costa Rica: Effects of soil depth, shade trees, distance to row and coffee age. Ann. Bot. 2016, 118, 833–851. [Google Scholar] [CrossRef] [Green Version]
  57. Nair, P. Managed Multi-strata Tree + Crop Systems: An Agroecological Marvel. Front. Environ. Sci. 2017, 5, 1–5. [Google Scholar] [CrossRef]
  58. Cuenca, G.; Aranguren, J.; Herrera, R. Root growth and litter decomposition in a coffee plantation under shade trees. Plant Soil 1983, 71, 477–486. [Google Scholar] [CrossRef]
  59. Pierret, A.; Maeght, J.-L.; Clément, C.; Montoroi, J.-P.; Hartmann, C.; Gonkhamdee, S. Understanding deep roots and their functions in ecosystems: An advocacy for more unconventional research. Ann. Bot. 2016, 118, 621–635. [Google Scholar] [CrossRef] [Green Version]
  60. Montagnini, F. Accumulation in above-ground biomass and soil storage of mineral nutrients in pure and mixed plantations in a humid tropical lowland. For. Ecol. Manag. 2000, 134, 257–270. [Google Scholar] [CrossRef]
  61. Redondo-Brenes, A.; Montagnini, F. Growth, productivity, aboveground biomass, and carbon sequestration of pure and mixed native tree plantations in the Caribbean lowlands of Costa Rica. For. Ecol. Manag. 2006, 232, 168–178. [Google Scholar] [CrossRef]
  62. Richter, D.D.; Markewitz, D.; Trumbore, S.E.; Wells, C.G. Rapid accumulation and turnover of soil carbon in a re-establishing forest. Nature 1999, 400, 56–58. [Google Scholar] [CrossRef] [Green Version]
  63. Richter, D.D.B.; Hofmockel, M.; Callaham, M.A.; Powlson, D.S.; Smith, P. Long-term soil experiments: Keys to managing Earth’s rapidly changing ecosystems. Soil Sci. Soc. Am. J. 2007, 71, 266–279. [Google Scholar] [CrossRef]
  64. Meylan, L.; Gary, C.; Allinne, C.; Ortiz, J.; Jackson, L.; Rica, C. Agriculture, Ecosystems and Environment Evaluating the effect of shade trees on provision of ecosystem services in intensively managed coffee plantations. Agric. Ecosyst. Environ. 2017, 245, 32–42. [Google Scholar] [CrossRef]
  65. Cerda, R.; Allinne, C.; Gary, C.; Tixier, P.; Harvey, C.A.; Krolczyk, L.; Mathiot, C.; Clément, E.; Aubertot, J.; Avelino, J. Effects of shade, altitude and management on multiple ecosystem services in coffee agroecosystems. Eur. J. Agron. 2017, 82, 308–319. [Google Scholar] [CrossRef]
  66. Rasse, D.P.; Rumpel, C. Is soil carbon mostly root carbon? Mechanisms for specific stabilization. Plant Soil 2005, 269, 341–356. [Google Scholar] [CrossRef]
  67. Sinacore, K.; Hall, J.S.; Potvin, C.; Royo, A.A.; Ducey, M.J.; Ashton, M.S. Unearthing the hidden world of roots: Root biomass and architecture differ among species within the same guild. PLoS ONE 2017, 12, e0185934. [Google Scholar] [CrossRef] [PubMed]
  68. Freibauer, A.; Rounsevell, M.D.A.; Smith, P.; Verhagen, J. Carbon sequestration in the agricultural soils of Europe. Geoderma 2004, 122, 1–23. [Google Scholar] [CrossRef]
  69. Scialabba, N.E.; Muller-Lindenlauf, M. Organic agriculture and climate change. Renew. Agric. Food Syst. 2010, 25, 158–169. [Google Scholar] [CrossRef] [Green Version]
  70. Powlson, D.S.; Stirling, C.M.; Thierfelder, C.; White, R.P.; Jat, M.L. Does conservation agriculture deliver climate change mitigation through soil carbon sequestration in tropical agro-ecosystems? Agric. Ecosyst. Environ. 2016, 220, 164–174. [Google Scholar] [CrossRef]
  71. Powlson, D.S.; Whitmore, A.P.; Goulding, K.W.T. Soil carbon sequestration to mitigate climate change: A critical re-examination to identify the true and the false. Eur. J. Soil Sci. 2011, 62, 42–55. [Google Scholar] [CrossRef]
  72. Smith, P.; Powlson, D.; Glendining, M.; Smith, J. Potential for carbon sequestration in European soils: Preliminary estimates for five scenarios using results from long-term experiments. Glob. Chang. Biol. 1997, 3, 67–79. [Google Scholar] [CrossRef]
  73. Parton, W.J.; Stewart, J.W.B.; Cole, C.V. Dynamics of C, N, P and S in grassland soils: A model. Biogeochemistry 1988, 5, 109–131. [Google Scholar] [CrossRef]
  74. Carter, M.R.; Gregorich, E.G. Carbon and nitrogen storage by deep-rooted tall fescue (Lolium arundinaceum) in the surface and subsurface soil of a fine sandy loam in eastern Canada. Agric. Ecosyst. Environ. 2010, 136, 125–132. [Google Scholar] [CrossRef]
  75. Parton, W.J.; Schimel, D.S.; Cole, C.V.; Ojima, D.S. Analysis of factors controlling soil organic matter levels in great plains grasslands. Soil Sci. Soc. Am. J. 1987, 51, 1173–1179. [Google Scholar] [CrossRef]
  76. Percival, H.J.; Parfitt, R.L.; Scott, N.A. Factors controlling soil carbon levels in New Zealand grasslands is clay content important? Soil Biol. Biochem. 2000, 64, 1623–1630. [Google Scholar]
  77. Zhong, Z.; Chen, Z.; Xu, Y.; Ren, C.; Yang, G.; Han, X.; Ren, G.; Feng, Y. Relationship between soil organic carbon stocks and clay content under different climatic conditions in Central China. Forests 2018, 9, 598. [Google Scholar] [CrossRef] [Green Version]
Figure 1. Location of the study in Turrialba, Cartago province, Costa Rica.
Forests 11 00049 g001
Figure 2. Management practices selected for the study: (a) Conventional intensive (b) Organic intensive. Location: Turrialba, Costa Rica.
Forests 11 00049 g002
Figure 3. Total soil organic carbon (SOC) content in the whole soil up to 1 m depth in six different land-use systems in Turrialba, Cartago, Costa Rica. Treatments: CE: Conventional Erythrina, CT: Conventional Terminalia, FO: Forest, OE: Organic Erythrina, OT: Organic Terminalia, SC: Sun Coffee.
Forests 11 00049 g003
Figure 4. Depth-wise mean soil organic carbon (SOC) in Mg C ha−1 stock in macroaggregates (>250 µm) soil up to 1-m depth in six different land-use systems in Turrialba, Costa Rica. Note: Tukey’s test was used to determine the significant differences among mean SOC within land-use systems. Lower case letters indicate differences (at the 0.05 probability level) in SOC among land-use systems compared within 1 m. Error bars indicate the standard error of the mean. Treatments: CE: Conventional Erythrina, CT: Conventional Terminalia, FO: Forest, OE: Organic Erythrina, OT: Organic Terminalia, SC: Sun Coffee.
Forests 11 00049 g004
Figure 5. Depth-wise mean soil organic carbon stock (SOC) in Mg C ha−1 in microaggregates (250–53 µm) soil up to 1 m depth in six different land-use systems in Turrialba, Costa Rica. Note: Tukey’s test was used to determine the significant differences among mean SOC within land-use systems. Lower case letters indicate differences (at the 0.05 probability level) in SOC among land-use systems compared within 1 m. Error bars indicate the standard error of the mean. Treatments: CE: Conventional Erythrina, CT: Conventional Terminalia, FO: Forest, OE: Organic Erythrina, OT: Organic Terminalia, SC: Sun Coffee.
Forests 11 00049 g005
Figure 6. Depth-wise mean soil organic carbon (SOC) in Mg C ha−1 stock in silt + clay fraction (<53 µm) soil up to 1 m depth in six different land-use systems in Turrialba, Costa Rica. Note: Tukey’s test was used to determine the significant differences among mean SOC within land-use systems. Lower case letters indicate differences (at the 0.05 probability level) in SOC among land-use systems compared within 1 m. Error bars indicate the standard error of the mean. Treatments: CE: Conventional Erythrina, CT: Conventional Terminalia, FO: Forest, OE: Organic Erythrina, OT: Organic Terminalia, SC: Sun Coffee.
Forests 11 00049 g006
Figure 7. Soil organic carbon stocks (Mg C ha−1) in whole soil under various AFS treatments up to a depth of 40 cm for the years 2001 and 2017. The SOC for the year 2017 are up to 30 cm while that of 2001 are up to 40 cm, n = 3 for both years. Note: The C concentrations for the year 2001 were obtained from Martin Noponen by personal communication. SOC stocks were calculated from C concentration provided; SOC stock = Cconcentration × BD × Depth. Treatments: CE: Conventional Erythrina, CT: Conventional Terminalia, FO: Forest, OE: Organic Erythrina, OT: Organic Terminalia, SC: Sun Coffee.
Forests 11 00049 g007
Table 1. Mean organic matter inputs (Mg ha−1 year−1) and management practices in coffee AFS sites in Costa Rica (Conventional intensive vs. Organic intensive).
Name of TreatmentConventional Intensive (CI)Organic Intensive (OI)
Soil Amendments300 kg N ha−1
20 kg P ha−1
150 kg K ha−1
287 kg N ha−1
205 kg P ha−1
326 kg K ha−1
Chicken manure 9 Mg ha−1
Coffee Pulp 5 Mg ha−1
Shade RegulationDrastic pruningRegulated pruning
Weed ControlHerbicideSelective mechanical removal
Disease ControlFungicideAs required
Quantities of soil amendments are shown as mean values of known amounts applied annually over twelve years (2004–2016). Nutrient inputs from decomposition of shade tree biomass were not considered. Quantities of organic matter inputs are shown as mean values of leaf litter collected in 2009 from previous studies [33]; who reported these values from the same experimental site [8,11]. Note: These values are reported from other studies conducted in the same research site [33], and not a part of our study.
Table 2. Biomass (kg ha−1) produced naturally and through management in each treatment.
TreatmentHerbLitterfallCoffee PruningTree PruningTotal
CE22541044104999717,357
CT12338321659451310,126
OE16430777837635217,428
OT1338219995542038696
Quantities of biomass are shown as mean values of various collected in 2006, 2009 and 2011, adapted from previous studies conducted in the same site [8,11,33].
Table 3. Percentage shade cover, height, and diameter at breast height (DBH), basal area of shade trees in the experimental site in Turrialba, Costa Rica; adapted from previous studies conducted in the same site [33].
Shade TreeShade before Pruning (%)Shade after Pruning (%)Height (m)DBH (cm)Basal Area per Tree (cm2)
Erythrina77.451.36.0822.943.9
Terminalia45.836.19.141110.9
Table 4. Soil characteristics (bulk density, pH, and particle-size distribution) at different depths in five land-use systems in Turrialba, Cartago, Costa Rica .
Land-Use Types/TreatmentsDepth (cm)Bulk Density (Mg m−3)pHParticle Size Distribution (g 100 g−1 Soil)
Sand ClaySilt
CE0–100.73 (0.02)6.137.6 (1.21)40.8 (1.2)21.6 (0.58)
10–300.62 (0.08)5.545.6 (0.51)36.8 (0.41)17.6 (0.24)
30–600.99 (0.05)5.543.6 (0.96)36.4 (1.11)20 (0.88)
60–1001.03 (0.06)5.343.6 (1.03)32.4 (1.11)24 (0.99)
CT0–101.13 (0.03)6.036.8 (0.87)42 (0.81)21.2 (1.01)
10–300.90 (0.03)5.132.4 (0.84)44.4 (1.16)23.2 (1.08)
30–600.83 (0.07)5.440.4 (0.21)36.4 (0.77)23.2 (0.36)
60–1000.83 (0.02)5.438 (1.81)34.4 (1.22)27.6 (0.76)
FO0–100.64 (0.05)4.529.2 (0.98)58.4 (1.25)12.4 (0.42)
10–300.69 (0.02)5.124.8 (1.01)66.4 (1.08)8.8 (0.96)
30–600.73 (0.04)5.335.2 (0.87)58.4 (0.55)6.4 (0.34)
60–1000.76 (0.01)5.133.2 (1.11)56.4 (1.08)10.4 (1.23)
OE0–100.86 (0.04)6.337.6 (0.95)40.4 (1.21)22 (1.23)
10–300.92 (0.04)6.339.6 (1.47)40.4 (1.16)20 (1.02)
30–601.12 (0.01)5.841.6 (1.15)36.4 (1.01)22 (0.55)
60–1000.98 (0.03)5.937.2 (0.76)34.4 (1.51)28.4 (0.98)
OT0–100.89 (0.03)6.547.6 (1.31)30.4 (1.13)22 (0.56)
10–300.77 (0.02)6.137.6 (0.94)38.4 (1.82)24 (1.02)
30–601.15 (0.06)5.741.6 (1.54)38.8 (0.87)19.6 (1.11)
60–1000.91 (0.08)5.941.6 (0.34)32.8 (1.21)25.6 (0.45)
SC0–100.81 (0.02)6.433.2 (1.67)42.4 (1.43)24.4 (1.12)
10–300.95 (0.02)6.645.2 (0.77)36.8 (0.76)18 (0.88)
30–600.99 (0.05)5.845.2 (1.21)32.4 (1.8)22.4 (1.2)
60–1001.04 (0.19)5.343.2 (1.01)34.4 (0.96)22.4 (0.74)
CE: Conventional Erythrina, CT: Conventional Terminalia, FO: Forest, OE: Organic Erythrina, OT: Organic Terminalia, SC: Sun Coffee. Note: Values reported are the means and standard error (in parenthesis) obtained from sampling sites. Each land-use system had three replicates i.e., n = 3.
Table 5. Depth-wise distribution of different soil-fraction-size classes under six land-use systems in Turrialba, Cartago, Costa Rica ‡¥.
Average Percentage Weight (%) Distribution of Size Fraction at Various Depth
Soil Depth (cm)Size Fraction (µm)CECTFOOEOTSC
0–10>25081 (5.1)75.8 (1.11)90.5 (2.8)81.7(3.6)75.9 (2.1)81.5 (2.8)
250 < x < 5313.9 (4.3)15.7 (2.3)10.3 (5.1)15.6 (2.2)18.0 (2.4)15.5 (1.8)
<5311.5 (2.3)19.6 (1.5)8.9 (3.6)6.8 (2.2)13.6 (1.3)8.8 (0.6)
10–30>25075.9 (6.7)71.5 (3.2)74.1 (6.2)74.5 (3.1)84.1 (2.2)73.9 (3.8)
250 < x < 5320.5 (4.8)22.2 (3.8)15.6 (4.2)16.1 (4.2)15.1 (4.5)17.1 (4.1)
<5312.9 (3.1)16.5 (1.1)15.3 (1.7)11.8 (2.8)11.9 (0.9)15.3 (0.7)
30–60>25066.1 (5.2)65.0 (4.5)83.7 (5.2)62.2 (4.6)58.4 (5.4)51.9 (6.6)
250 < x < 5325.8 (6.6)28.5 (2.7)20.0 (3.8)25.0 (2.2)29.7 (1.7)38.3 (3.2)
<5319.9 (1.4)20.4 (2.1)17.8 (2.1)22.1 (1.9)20.7 (1.4)19.8 (1.4)
60–100>25068.7 (4.1)53.5 (6.2)70.6 (5.4)55.2 (6.3)53.0 (5.9)38.5 (2.5)
250 < x < 5323.1 (3.2)35.0 (3.7)29.6 (3.7)33.8 (4.5)37.2 (4.1)38.5 (4.1)
<5322.9 (3.6)22.1 (1.1)28.2 (1.8)18.6 (3.1)18.8 (1.2)25.5 (0.6)
Note: Values reported are the means and standard error (in parenthesis) obtained from sampling sites. Each land-use system had three replicates i.e., n = 3. ¥ CE: Conventional Erythrina, CT: Conventional Terminalia, FO: Forest, OE: Organic Erythrina, OT: Organic Terminalia, SC: Sun Coffee.
Table 6. Analysis of variance (ANOVA), (factor analysis; Model 1) with interaction effects of Treatments, Depth and Fraction size on SOC stocks (Mg C ha−1) without the individual effect of each site level.
CategoryDfSum Sq.Mean Sq.F ValuePr (>F)
Treatment5492985.03<0.0001
Depth3110937018.8<0.0001
Fraction Size211,1155557283.9<0.0001
Treatment × Depth15324221.10.054
Treatment × Fraction Size10628633.2<0.0001
Depth × Fraction Size6215836018.3<0.0001
Treatment × Depth × Fraction Size30555190.940.0299
Residuals144281820
This model is referred as Full Interaction Model. Response: SOC (Mg C ha−1). The numbers in bold represent significant interaction effects.
Table 7. Analysis of variance (ANOVA), (Parsimonious model; Model 2) without the treatment and depth interaction on SOC stocks (Mg C ha−1) showing individual effect of each site level.
CategoryDfSum Sq.Mean Sq.F ValuePr (>F)
Treatment5492985.34<0.0001
Depth3110937018.8<0.0001
Fraction Size211,1155557284.1<0.0001
Treatment × Fraction Size10628633.2<0.0001
Depth × Fraction Size6215836018.4<0.0001
Residuals189369720
For the sake of parsimony and better interpretability, the Treatment × Depth interaction was dropped. F test comparison showed that Model 2 was a better fit (p = 0.011 **). The numbers in bold represent significant interaction effects.
Table 8. Change in SOC stocks (2001–2017) and carbon sequestration potential (CSP) under various AFS up to a depth of 40 cm.
Depth (cm)TreatmentSOC Stocks in 2001 (Mg C ha−1)SOC Stocks in 2017
(Mg C ha−1)
Soil CSP
(Mg C ha−1 yr−1)
(2001–2017)
0–10CE26.425.3−0.1
10–40CE30.528.5−0.1
0–40CE5853.9−0.2
0–10CT28.432.90.3
10–40CT39.441.00.1
0–40CT67.873.90.4
0–10OE24.329.50.3
10–40OE31.833.10.1
0–40OE5662.60.4
0–10OT26.435.50.6
10–40OT27.8390.7
0–40OT54.274.51.3
0–10SC24.227.70.2
10–40SC32.325.1−0.5
0–40SC56.552.8−0.2
Note: The SOC for the year 2017 are up to 30 cm while the other two years are up to 40 cm. The C concentration for the year 2001 was obtained by personal communication with Martin Noponen. SOC stocks were calculated from C concentration provided; SOC stock = Cconcentration × BD × Depth. Treatments: CE: Conventional Erythrina, CT: Conventional Terminalia, FO: Forest, OE: Organic Erythrina, OT: Organic Terminalia, SC: Sun Coffee.

