Abstract
To effectively further research the regional carbon sink, it is important to estimate forest aboveground biomass (AGB). Based on optical images, the AGB can be estimated and mapped on a regional scale. The Landsat 8 Operational Land Imager (OLI) has, therefore, been widely used for regional scale AGB estimation; however, most studies have been based solely on peak season images without performance comparison of other seasons; this may ultimately affect the accuracy of AGB estimation. To explore the effects of utilizing various seasonal images for AGB estimation, we analyzed seasonal images collected using Landsat 8 OLI for a subtropical forest in northern Hunan, China. We then performed stepwise regression to estimate AGB of different forest types (coniferous forest, broadleaf forest, mixed forest and total vegetation). The model performances using seasonal images of different forest types were then compared. The results showed that textural information played an important role in AGB estimation of each forest type. Stratification based on forest types resulted in better AGB estimation model performances than those of total vegetation. The most accurate AGB estimations were achieved using the autumn (October) image, and the least accurate AGB estimations were achieved using the peak season (August) image. In addition, the uncertainties associated with the peak season image were largest in terms of AGB values < 25 Mg/ha and >75 Mg/ha, and the quality of the AGB map depicting the peak season was poorer than the maps depicting other seasons. This study suggests that the acquisition time of forest images can affect AGB estimations in subtropical forest. Therefore, future research should consider and incorporate seasonal time-series images to improve AGB estimation.
1. Introduction
As an important characteristic of forest ecosystems, forest aboveground biomass (AGB) provides a basis for ecosystem and forestry research; AGB estimation further provides data critical to estimating the forest carbon sink [1,2]. In recent years, accurate and rapid AGB estimation has, therefore, become crucial for forest ecosystem and global climate change research.
Traditionally, high precision AGB field measurement methodologies have involved extensive field surveys [3]. However, these methods are time-consuming, laborious and destructive; in addition, they cannot be used to analyze the spatial distribution and dynamic change of AGB on a large scale [4]. Today, remote sensing-based methodologies are more commonly used to estimate AGB as they rapidly provide near real-time, dynamic and regional scale data, and the characteristics of the obtained images are strongly correlated with AGB [5]. Remote sensing data can be divided into two categories: Passive remote sensing (optical sensors, thermal and microwave) and active remote sensing (radar and light detection and ranging (LiDAR)) [5,6,7]. Optical sensors such as Landsat, Systeme Probatoire d’Observation de la Terre (SPOT), the moderate-resolution imaging spectroradiometer (MODIS), QuickBird and the Advanced Very High-Resolution Radiometer (AVHRR) have been widely used for AGB estimation because of their coverage, repetitive observation and cost-effectiveness [6,8]. Of these sensors, Landsat images are the most commonly used for remote sensing-based AGB estimations because the sensors provide a long-term data record and have medium spatial resolution, wide spatial coverage and high spectral sensitivity [9]. In many countries, the spatial resolution obtained using Landsat is similar to the size of sample plots in national forest inventories; therefore, using Landsat to estimate AGB can reduce spatial errors associated with matching pixels to sample plots [10].
The information derived from Landsat images significantly correlates with AGB because these images provide valuable information regarding the forest canopy [11]. In fact, previous studies have shown that individual spectral bands, vegetation indices, transformed images (using principal component analysis (PCA)) and textural images are strongly correlated with AGB and can, therefore, be used to effectively estimate AGB [12,13,14,15]. Furthermore, many statistical models can be used in developing remote sensing-based AGB models. These models can be divided into two categories: (i) Parametric models (linear, nonlinear, etc.) [16,17,18] and (ii) nonparametric models (random forest, RF; artificial neural networks, ANN; support vector machines, SVM; etc.) [14,19,20,21]. Multiple linear regression models, however, are most frequently used in AGB research.
Optical sensors mainly provide information about the forest canopy [11]. The canopy structure of subtropical forests significantly varies between seasons, and even between months [6,22,23]. These variations can cause differences in remote sensing data [24]. Therefore, AGB estimation can vary widely when time-series images are used to model AGB in the same study area [25]. Previous studies have used a single Landsat image (taken during the peak growing season or at a time close to when the ground survey of national forest inventory plots took place) to estimate AGB [21,26,27,28]. These images, however, do not always accurately reflect forest characteristics. For example, dense canopy cover during the peak growing season often results in extremely saturated images [25,29,30], which ultimately affects AGB estimation accuracy. Some studies have, therefore, utilized time-series of Landsat images to estimate AGB, e.g., Zhu and Liu [25], Safari et al. [31] and Powell et al. [32]. These studies, however, focused on particular forest type or a regional forest. Therefore, there exists a knowledge gap regarding whether time-series Landsat images affect the accuracy of AGB estimations in different forest types and whether the estimations differ among forest types.
Given this gap in knowledge, this study explores the use of seasonal Landsat 8 Operational Land Imager (OLI) images in estimating AGB in a subtropical forest in northern Hunan, China, using stepwise regression. The main objectives of this study were to: (1) Explore the potential variables of seasonal time-series data for different forest types when estimating AGB; (2) investigate the potential of seasonal time-series data in improving the accuracy of AGB estimations in different forest types; and (3) investigate the uncertainties associated with using seasonal time-series data to estimate AGB.
2. Materials and Methods
2.1. Study Area
The study area is located in Hunan Province, central China (path/row: 124/40), and comprises an inclined transition zone from the hills of central Hunan to Dongting Plain. The climate is a typical subtropical monsoon humid climate [33] with an average annual temperature and annual precipitation of 16.5 °C and 1200–1700 mm, respectively. The study area is further characterized by four distinct seasons: Spring (March to May), summer (June to August), autumn (September to November) and winter (December to February). Chinese fir (Cunninghamia lanceolate (Lamb.) Hook.) and Chinese red pine (Pinus massoniana) plantations, evergreen broadleaf, deciduous and mixed forests dominate this area with scattered bamboo and shrub lands [34]. A total of 303 forest plots were inventoried in 2014 by the National Forest Continuous Inventory (NFCI) in China (Figure 1).
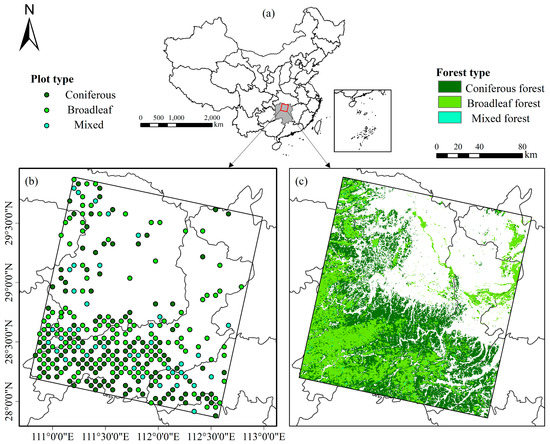
Figure 1.
Study area (red box) in Hunan Province, China (a); the spatial distribution of sample plots (b); and the distribution of forest types (c).
2.2. Calculation of Plot-Level AGB
A total of 303 sample plots were used in this research including, 125 CFF (coniferous forest) plots, 138 BLF (broadleaf forest) plots, and 40 MXF (mixed forest) plots (Table 1). The area of the sample plots is 0.067 ha, and the plots were systematically allocated based on a 4 × 8 km grid (NFCI). The AGB values of the study plots were calculated according to tree species or species groups described in a previous study [35]. Statistical information regarding the sample plot data based on different forest types is summarized in Table 1. The AGB values of all sample plots ranged from 5.01 Mg/ha to 151.06 Mg/ha with an average AGB of 48.27 Mg/ha. The mixed forest had the highest mean (±standard deviation) AGB (52.69 ± 29.45 Mg/ha).

Table 1.
Summary of the sample plots by forest type (CFF, coniferous forest; BLF, broadleaf forest; MXF, mixed forest; TV, total vegetation).
2.3. Remote Sensing Data and Information Extraction
To explore the effectiveness of utilizing seasonal images to estimate AGB, we acquired four cloud-free Landsat 8 OLI images which covered different forest states within the study area from spring to winter during 2013 and 2014 (Table 2). These four Landsat 8 OLI images were Landsat surface reflectance data downloaded from the United States Geological Survey (USGS) website (https://earthexplorer.usgs.gov/). Landsat 8 OLI surface reflectance data are generated using the land surface reflectance code (LaSRC), which utilizes the coastal aerosol band to perform aerosol inversion tests, uses auxiliary climate data from MODIS, and a unique radiative transfer model [36].
Table 2.
Landsat 8 Operational Land Imager (OLI) imagery acquired for this study.
To estimate forest AGB in the study area, we calculated and extracted 165 spectral variables: Six original bands, 12 vegetation indices, the first three bands from principal component analysis, and 144 texture variables using a gray-level co-occurrence matrix (Table 3).
Table 3.
Summary of the predictor variables.
2.4. Vegetation Classification Data
The European Space Agency (ESA) Climate Change Initiative (CCI) was developed to address climate change at a global level [48]. As part of this initiative, the ESA has derived and consolidated global CCI land cover (CCI-LC) information including annual landcover maps from 1992 to 2015. For the present study, we obtained the CCI-LC data of the study area from MERIS and SPOT satellite images at 300 m spatial resolution [49]. Further, the 2014 CCI-LC map of the study area was downloaded from the ESA website (http://maps.elie.ucl.ac.be/CCI/viewer/index.php) to obtain forest stratifications (coniferous forest (CFF), broadleaf forest (BLF), and mixed forest (MXF)) for AGB estimation.
2.5. AGB Estimation Model
Pearson product-moment correlation coefficient was used to analyze the relationships between plot AGB and spectral variables, and the spectral variables which had significant correlations with AGB were used as independent variables. Stepwise regression analysis is a frequently used approach in AGB research to determine and select the spectral variables which best contribute to forest AGB. Stepwise regression ultimately results in a regression model containing the variables which best explain the dependent variable (AGB in this study). During the stepwise regression, multicollinearity, which creates highly sensitive parameter estimators with inflated variances and leads to improper model selection, was analyzed between each pair of selected spectral variables using the variance inflation factor (VIF). In this study, if the VIF of a spectral variable exceeded ten, this spectral variable was considered seriously collinear with other variables [50,51].
The stepwise regression model developed in this study assumed that a linear relationship exists between independent (spectral variables) and dependent variables (AGB of different forest types). The model is defined in Equation (1) and describes the relationship between AGB and spectral variables:
where y is AGB, a is the constant term, , …, represent the independent variables, , …, represent the parameters of the independent variables, and ε is the error.
To analyze the accuracy of the AGB models derived from the seasonal images for different forest types, the following workflow was used (Figure 2).
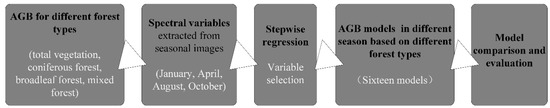
Figure 2.
The workflow for aboveground biomass (AGB) models derived from different scenarios.
2.6. Model Comparison and Evaluation
Model performance was evaluated using ‘10-fold’ cross validation [52], and predicted AGB values were compared to observed AGB values using three accuracy indicators: Coefficient of determination (R2), root mean square error (RMSE and RMSE %) and bias. Accuracy indicator Equations (2)–(5) are as follows:
where is the observed AGB value, is the predicted AGB value based on models, is the arithmetic mean of all observed AGB values, and n is the sample number. In general, a higher R2 value and lower RMSE and RMSE% values indicate a greater accuracy of the model.
We generated ten predicted forest AGB maps using the results of 10-fold cross validation, and the average of these AGB maps was taken as the final spatial distribution of AGB. In addition, the standard deviation (Stdev) of spatial AGB predictions was calculated to analyze the uncertainty of each pixel [53,54]. Larger Stdev values indicate higher estimation uncertainty and smaller Stdev values indicate lower estimation uncertainty.
3. Results
3.1. Comparison of AGB Estimates Using Seasonal Images of Total Vegetation
The variables of AGB models for total vegetation using seasonal images were selected using stepwise regression according to the correlation between AGB, the dependent variable and spectral variables. We found that four variables were included in the AGB models for January, April and October, whereas six variables were included in the AGB model for August (Table 4). The selected variables of these models indicated that the textural images of Landsat 8 OLI played an important role in forest AGB estimation of total vegetation regardless of the season.
Table 4.
The selected variables for AGB estimation models for different months based on the total vegetation.
Based on 10-fold cross validation, the results of model fitting are shown in Table 5. We found that the use of seasonal Landsat 8 imagery resulted in different AGB estimates. For total vegetation, the stepwise regression model of the October image showed the highest R2 value (0.39) and the lowest RMSE (21.67 Mg/ha; 44.1% of the mean) and bias (−0.19 Mg/ha) values. The model based on the peak season (August) image showed the lowest R2 value (0.27), followed by the January and April models. Overall, the results demonstrated that the acquisition time of Landsat 8 imagery significantly influenced AGB estimation, and that the peak season (August) image showed inferior performance compared to that of the other AGB estimation models.
Table 5.
Summary of the accuracy assessment results for the seasonal models based on the total vegetation.
The relationship between the predicted AGB and observed total vegetation AGB for different seasons using stepwise regression model is shown as scatterplots in Figure 3(a1–d1). Each month, we detected overestimations when the plot AGB value was lower than 30 Mg/ha, and underestimations when the plot AGB value was higher than approximately 90 Mg/ha. The August model showed the largest bias (Figure 3(c2)). The bias calculated for each prediction model showed a skewed distribution (Figure 3(a2–d2)), but when the bias was less than −25 Mg/ha or greater than 25 Mg/ha, bias frequencies of the October model were smaller than those of the other three months.
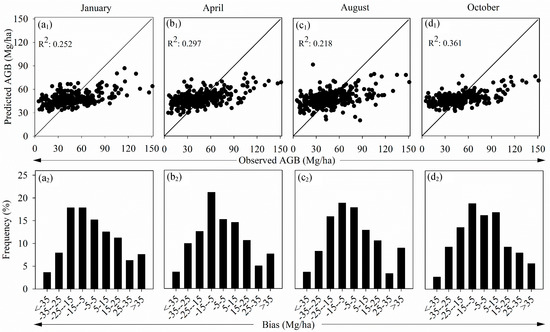
Figure 3.
Model performances were evaluated using 10-fold cross validation and predicted AGB values were compared to observed AGB values using accuracy indicators. Scatterplots depict the relationship between predicted and observed AGB estimation values in each month (a1–d1). Histograms depict model biases (a2–d2).
The above analysis was based on the overall performance of different stepwise regression models generated for each month, but it cannot provide detailed information regarding the effect of different forest types on estimation of total vegetation AGB. Table 6 summarizes the RMSE and RMSE% results for different forest types. For CFF and BLF, the RMSE and RMSE% were lowest when the October image was used for AGB estimation. For MXF, the RMSE and RMSE% were lowest when the April image was used for AGB estimation. While the October model resulted in lower R2 and RMSE values than the April model, the April model performed better in MXF AGB estimation than the October model.
Table 6.
Summary of RMSE (Mg/ha) and RMSE% results from different seasonal images under non-stratified conditions.
3.2. Comparison of AGB Estimates Using Seasonal Images of Different Forest Types
The independent variables selected by the AGB models using seasonal images of the three forest types are summarized in Table 7. The selected variables varied among each forest type in different months. However, in general, texture measures were involved in all AGB models, indicating that when considering different forest types and months, textural information significantly contributed to improving the AGB predictions in this study.
Table 7.
The selected variables for AGB estimation models in different months based on different forest types.
We further compared the AGB models derived using seasonal images of three forest types (Table 8). For the different forest types, we found that regardless of month, MXF model performances were better than those of CFF and BLF. The performances of the CFF and BLF models did not significantly differ. Regarding all model performances, R2 value differences ranged from 0.13 for the BLF models to 0.2 for the MXF models, RMSE (RMSE%) value differences ranged from 1.85 Mg/ha (3.03%) for the BLF models to 3.92 Mg/ha (7.44%) for the MXF models. Overall, the model obtained using data from the October image had the least bias, whereas the August model performed had the largest bias; the January and April models were intermediate. The R2 values were all less than 0.55 and the RMSE% were all larger than 35%; these results indicated that though the performances of the models for different forest types were better than those of total vegetation, nearly half of the AGB variation cannot be explained. When compared to the previously constructed total vegetation models (Table 5 vs. Table 8), the models based on different forest types resulted in larger R2 and lower RMSE (RMSE%) values and performed better overall, indicating that consideration of forest type can improve AGB estimation.
Table 8.
Summary of the accuracy assessment results for the seasonal models based on different forest types.
We further compared the AGB models derived using seasonal images of three forest types (Table 8). For the different forest types, we found that regardless of month, MXF model performances were better than those of CFF and BLF. The performances of the CFF and BLF models did not significantly differ. Regarding all model performances, R2 value differences ranged from 0.13 for the BLF models to 0.2 for the MXF models, RMSE (RMSE%) value differences ranged from 1.85 Mg/ha (3.03%) for the BLF models to 3.92 Mg/ha (7.44%) for the MXF models. Overall, the model obtained using data from the October image had the least bias, whereas the August model performed had the largest bias; the January and April models were intermediate. The R2 values were all less than 0.55 and the RMSE% were all larger than 35%; these results indicated that though the performances of the models for different forest types were better than those of total vegetation, nearly half of the AGB variation cannot be explained. When compared to the previously constructed total vegetation models (Table 5 vs. Table 8), the models based on different forest types resulted in larger R2 and lower RMSE (RMSE%) values and performed better overall, indicating that consideration of forest type can improve AGB estimation.
The relationship between the predicted and observed AGB values of the three forest types in different seasons using stepwise regression models is shown as scatterplots in Figure 4. Overestimations occurred in plots with AGB values lower than approximately 30 Mg/ha for CFF, BLF, and MXF, whereas underestimations occurred in plots with AGB values higher than approximately 100 Mg/ha for each forest type. The scatter plot constructed using the October data better fit the line y = x, whereas the scatter plot constructed using the August data was more discrete with serious over- and underestimation issues (Figure 4). January and April prediction model biases showed skewed distributions (Figure 4), the model bias of October represented a normal distribution, and the model bias of August was discrete. Further, the October bias values mostly ranged from −15 Mg/ha to 15 Mg/ha, and there were lower proportions of bias values < −25 Mg/ha or >25 Mg/ha.
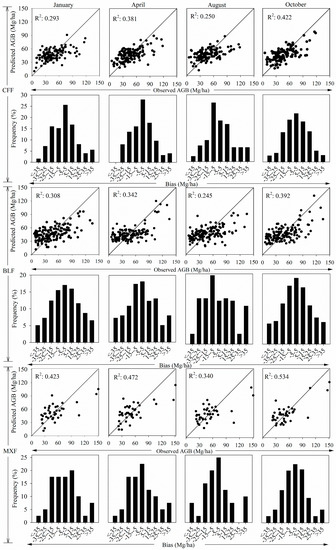
Figure 4.
Model performances were evaluated using 10-fold cross validation and predicted AGB values were compared to observed AGB values using accuracy indicators. Scatterplots depict the relationship between predicted and observed AGB estimation values in each month for each forest type (top). Histograms depict model biases in each month for each forest type (bottom). CFF, coniferous forest; BLF, broadleaf forest; MXF, mixed forest.
3.3. AGB Distribution Maps and Map Quality
In addition to model diagnostics, we predicted AGB distribution maps and AGB standard deviation (Stdev) maps within the study area. Using seasonal images, we constructed AGB spatial distribution maps based on total vegetation and different forest types (Figure 5). AGB distribution patterns in different months varied, supporting our previous results (Section 3.1 and Section 3.2) which suggested that seasonal model performances differed. Further, AGB distribution patterns for total vegetation were narrow (within the range of 25 Mg/ha to 75 Mg/ha; Figure 5a), whereas AGB distribution patterns for different forest types were discrete (within the range of 0 Mg/ha to 100 Mg/ha; Figure 5b). These results indicate that models constructed based on forest types can achieve relatively low (<25 Mg/ha) and high (>75 Mg/ha) AGB values and thus alleviate over- and underestimation. In addition, October distribution maps were more heterogeneous than those of the other months, further indicating that October model performances were superior.
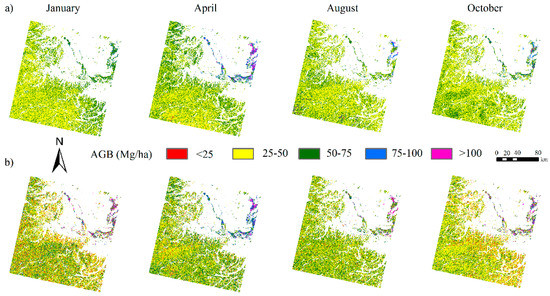
Figure 5.
Spatial distribution of forest aboveground biomass (AGB) using seasonal images under different scenarios: (a) The total vegetation; (b) forest types including coniferous forest, broadleaf forest and mixed forest.
Stdev maps of each scenario are shown in Figure 6. For both total vegetation and different forest types, the model uncertainties for October were smaller compared with those for January, April and August, indicating that the October AGB maps were more accurate. Moreover, model uncertainties for August were larger compared with those for the other three months, indicating that the August AGB maps were the least accurate. The Stdev values of different AGB ranges for different forest types were further calculated and analyzed (Figure 7). When mapping the AGB of both the total vegetation and the different forest types, the Stdev values were greater when the AGB values were <25 Mg/ha or >75 Mg/ha. In this case, the Stdev of the August models were the largest, followed by the January, April and October models. This result indicated that AGB maps exhibiting these AGB values (<25 Mg/ha or >75 Mg/ha) showed the largest uncertainty when utilizing the August image. In addition, when attained AGB values were >75 Mg/ha, all Stdev values for each scenario were larger than three, further indicating a large amount of uncertainty associated with these particular AGB values.
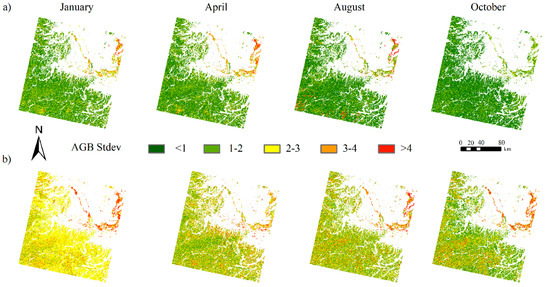
Figure 6.
Standard deviation (Stdev) maps of AGB values using seasonal images under different scenarios: (a) The total vegetation; (b) forest types including coniferous forest, broadleaf forest and mixed forest.
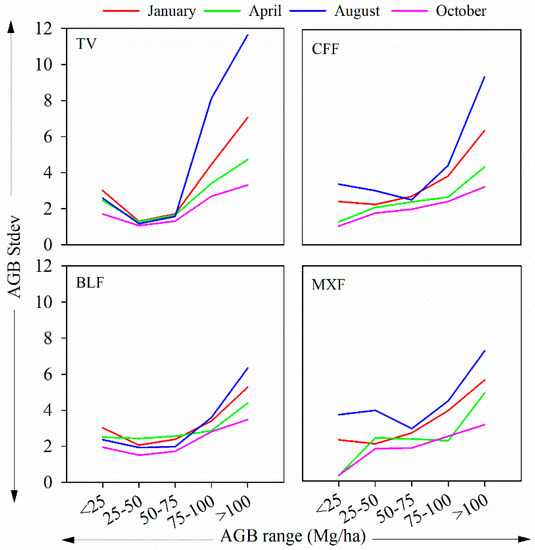
Figure 7.
The standard deviation (Stdev) of AGB within different AGB value ranges (TV, total vegetation; CFF, coniferous forest; BLF, broadleaf forest; MXF, mixed forest).
4. Discussion
Forests are complex ecosystems containing variable species composition and structure; therefore, the image information (especially textural information) of these ecosystems also varies considerably [55,56]. Previous studies utilizing Landsat images to estimate AGB were unable to determine which spectral variables were best able to predict AGB [6,57]. In this study, the selected spectral variables used for AGB models of different months and different forest types varied. Nonetheless, we found that for all forest types, textural images played an important role in AGB estimation, in accordance with previous research [58]. The selected variables belonged to various original bands (bands 2 to 7), indicating that all original bands can be used to estimate AGB in this study. These results differed from earlier research in which the shortwave infrared (SWIR) bands (e.g., Landsat TM spectral bands 5 and 7) were more important in AGB estimation than other bands [59,60,61]. In addition, in previous research utilizing Landsat imagery, spectral information (e.g., vegetation index, original band) was often selected to estimate the AGB of coniferous forest given that the structure of coniferous forest was simple and the importance of spectral information over textural information. On the other hand, textural information has often been used in the study of broadleaf forest and mixed forest given that those forests often have multiple canopy layers and more complex structures. In our study area, because of the low level of forest management, the forest structure was complex; therefore, in this study, for each forest type, textural information was mostly used to estimate AGB, regardless of which seasonal image was utilized.
In this study, stepwise regression was used to estimate AGB of different forest types based on Landsat 8 OLI seasonal images. We found that in our study area, the best month for AGB estimation was October given that the R2 values of different forest types were higher than 0.39. Overall, this result indicates that the October image can explain more than 39% of the information regarding the estimated AGB for each forest type. The less accuracy month for AGB estimation was August given that the R2 value for total vegetation was only 0.27. Stepwise regression is a widely used methodology of fitting regression models based on the correlation between dependent and independent variables. During this procedure, the significance of an introduced variable is tested, and the variable that is of least significant is discarded [62]. While selection of variables depends upon the degree of linear correlation, selection of variables with low correlation is possible; this can ultimately affect the accuracy of the model. The forest characteristics of different forest types were heterogeneous. Different forest types were different in spectral characteristics caused by the heterogeneity of the stand structures and species compositions. The correlations among the spectral variables and AGB of different forest types were also different. In this case, the performances of models for different forest types were significantly different. In our study, among all forest types analyzed, we found that the MXF models achieved the best results for AGB estimation. This indicates that the image information was most strongly correlated with MXF compared with other forest types, and therefore, the image can better reflect the condition of the mixed forest. However, when the forest types were considered in AGB estimation, model accuracy was further affected by the number of plots [59]. In this study, there were 135 CFF plots and 128 BLF plots, whereas there only 40 MXF plots. Therefore, MXF models may have been more accurate given the far fewer number of plots analyzed compared with the models for the other forest types.
In this study, Landsat 8 OLI seasonal images were used to estimate AGB. The four seasonal images utilized were associated with four seasons of the study area (January (winter), April (spring), August (summer) and October (autumn)). The results showed that utilization of the peak season (August) image resulted in inadequate AGB estimation compared with the other seasons, in accordance with results reported by Zhu and Liu (2014) [25]. These researchers further found that the normalized difference vegetation index (NDVI)-based AGB estimates of the forest senescing period were better than those of the peak season in a temperate forest of southeastern Ohio, USA [25]. Furthermore, in accordance with our results, previous researchers detected over- and underestimations when utilizing Landsat 8 OLI imagery to estimate AGB in a subtropical forest in western Hunan, China [58]. In our study, these uncertainties were common among all seasonal images analyzed. The observed underestimations within the higher range of AGB values may have been a consequence of image saturation issues affecting model performance [56,63]. Regarding AGB values within the lower range, model performance was likely affected by mixed pixels, thus resulting in AGB overestimation [64]. While uncertainties were detected among all time-series images, underestimation associated with the peak season (August) within the high AGB range (>75 Mg/ha) was more serious than that associated with the other seasons. Taken together, these results suggest that image saturation more strongly influenced AGB estimation results for August than it did for the other seasons, further indicating that the uncertainties were less in the other seasons. In addition, the overestimation associated with the peak season was greater than that associated with the other seasons.
5. Conclusions
In this study, seasonal Landsat 8 OLI imagery was utilized to estimate forest AGB in a subtropical forest in northern Hunan Province, China. Study plots were classified according to forest types (CFF, BLF, MXF and total vegetation) and stepwise regression was used to select appropriate variables and thus effectively model AGB based on the seasonal images. Subsequently, models of the different scenarios (different forest types in different seasons) were compared. Given the variables selected during stepwise regression, we concluded that seasonal image textural information was most significantly correlated with AGB, and that the study area is made up of forests with complex structures. The method of AGB estimation based on forest type is very useful for improving the accuracy of AGB estimation because the model performances for the different forest types (CFF, BLF and MXF) are better than those for the total vegetation, regardless of season. The time-series images, which reflect various seasons, can affect AGB estimations, with the autumn image (October) potentially yielding the most accurate AGB estimations and the peak season (August) image being of poorer quality in a subtropical forest. We also explored the accuracies of seasonal images in remote sensing-based AGB estimation. We hope to provide new insight into using Landsat images to improve the accuracy of biomass estimation.
Future research will focus on the mechanism underlying the cause of these differences when utilizing seasonal Landsat 8 OLI images in AGB estimation of different forest types.
Author Contributions
Conceptualization, C.L. and M.L.; Data Curation, C.L., Y.L. and Q.D.; Formal Analysis, C.L., Y.L. and J.L.; Funding Acquisition, M.L.; Methodology, C.L. and M.L.; Project Administration, M.L.; Resources, M.L. and Q.D.; Software, C.L. and Y.L.; Supervision, M.L.; Validation, C.L., Y.L. and J.L.; Visualization, C.L. and J.L.; Writing—Original Draft, C.L.; Writing—Review & Editing, C.L., M.L., J.L., Y.L. and Q.D. All authors have read and agreed to the published version of the manuscript.
Funding
This research was funded by National Natural Science Foundation (NO. 31770679), and Top−notch Academic Programs Project of Jiangsu Higher Education Institutions, China (TAPP, PPZY2015A062).
Acknowledgments
The authors are grateful to the ESA (http://maps.elie.ucl.ac.be/CCI/viewer/index.php) and USGS (http://glovis.usgs.gov/) for providing the Land Cover map and Landsat 8 OLI images.
Conflicts of Interest
The authors declare no conflict of interest.
References
- Houghton, R.A. Aboveground forest biomass and the global carbon balance. Glob. Chang. Biol. 2005, 11, 945–958. [Google Scholar] [CrossRef]
- Houghton, R.A.; Hall, F.; Goetz, S.J. Importance of biomass in the global carbon cycle. J. Geophys. Res. 2009, 114. [Google Scholar] [CrossRef]
- West, P.W. Tree and Forest Measurement, 2nd ed.; Springer: New York, NY, USA, 2009; ISBN 9783540959656. [Google Scholar]
- Vashum, K.T.; Jayakumar, S. Methods to Estimate Above-Ground Biomass and Carbon Stock in Natural Forests—A Review. J. Ecosyst. Ecogr. 2012. [Google Scholar] [CrossRef]
- Galidaki, G.; Zianis, D.; Gitas, I.; Radoglou, K.; Karathanassi, V.; Tsakiri–Strati, M.; Woodhouse, I.; Mallinis, G. Vegetation biomass estimation with remote sensing: Focus on forest and other wooded land over the Mediterranean ecosystem. Int. J. Remote Sens. 2017, 38, 1940–1966. [Google Scholar] [CrossRef]
- Lu, D.; Chen, Q.; Wang, G.; Liu, L.; Li, G.; Moran, E. A survey of remote sensing-based aboveground biomass estimation methods in forest ecosystems. Int. J. Digit. Earth 2014, 9, 63–105. [Google Scholar] [CrossRef]
- Rodríguez-veiga, P.; Wheeler, J.; Louis, V.; Tansey, K. Quantifying Forest Biomass Carbon Stocks from Space. Curr. For. Rep. 2017, 3, 1–18. [Google Scholar] [CrossRef]
- Kumar, L.; Sinha, P.; Taylor, S.; Alqurashi, A.F. Review of the use of remote sensing for biomass estimation to support renewable energy generation. J. Appl. Remote Sens. 2015, 9, 097696. [Google Scholar] [CrossRef]
- Cohen, W.B.; Goward, S.N. Landsat’s Role in Ecological Applications of Remote Sensing. Bioscience 2004, 54, 535–545. [Google Scholar] [CrossRef]
- Sun, H.; Qie, G.; Wang, G.; Tan, Y.; Li, J.; Peng, Y.; Ma, Z.; Luo, C. Increasing the accuracy of mapping urban forest carbon density by combining spatial modeling and spectral unmixing analysis. Remote Sens. 2015, 7, 15114–15139. [Google Scholar] [CrossRef]
- Roy, P.S.; Ravan, S.A. Biomass estimation using satellite remote sensing data—An investigation on possible approaches for natural forest. J. Biosci. 1996, 21, 535–561. [Google Scholar] [CrossRef]
- Safari, A.; Sohrabi, H. Ability of landsat-8 OLI derived texture metrics in estimating aboveground carbon stocks of coppice Oak Forests. Int. Arch. Photogramm. Remote Sens. Spat. Inf. Sci. 2016, XLI-B8, 751–754. [Google Scholar] [CrossRef]
- Zhao, Q.; Yu, S.; Zhao, F.; Tian, L.; Zhao, Z. Comparison of machine learning algorithms for forest parameter estimations and application for forest quality assessments. For. Ecol. Manag. 2019, 434, 224–234. [Google Scholar] [CrossRef]
- Ou, G.; Li, C.; Lv, Y.; Wei, A.; Xiong, H.; Xu, H.; Wang, G. Improving aboveground biomass estimation of Pinus densata forests in Yunnan using Landsat 8 imagery by incorporating age dummy variable and method comparison. Remote Sens. 2019, 11, 738. [Google Scholar] [CrossRef]
- Zhang, Y.; Li, F.; Liu, F. Forest biomass estimation based on remote sensing method for north Daxingan mountains. Adv. Mater. Res. 2011, 339, 336–341. [Google Scholar] [CrossRef]
- Yan, E.; Lin, H.; Wang, G.; Sun, H. Improvement of Forest Carbon Estimation by Integration of Regression Modeling and Spectral Unmixing of Landsat Data. IEEE Geosci. Remote Sens. Lett. 2015, 12, 2003–2007. [Google Scholar] [CrossRef]
- Fernández-Manso, O.; Fernández-Manso, A.; Quintano, C. Estimation of aboveground biomass in Mediterranean forestsby statistical modelling of ASTER fraction images. Int. J. Appl. Earth Obs. Geoinf. 2014, 31, 45–56. [Google Scholar] [CrossRef]
- Zhao, P.; Lu, D.; Wang, G.; Wu, C.; Huang, Y.; Yu, S. Examining spectral reflectance saturation in landsat imagery and corresponding solutions to improve forest aboveground biomass estimation. Remote Sens. 2016, 8, 469. [Google Scholar] [CrossRef]
- Shen, W.; Li, M.; Huang, C.; Wei, A. Quantifying Live Aboveground Biomass and Forest Disturbance of Mountainous Natural and Plantation Forests in Northern Guangdong, China, Based on Multi-Temporal Landsat, PALSAR and Field Plot Data. Remote Sens. 2016, 8, 595. [Google Scholar] [CrossRef]
- Tian, X.; Su, Z.; Chen, E.; Li, Z.; van der Tol, C.; Guo, J.; He, Q. Estimation of forest above-ground biomass using multi-parameter remote sensing data over a cold and arid area. Int. J. Appl. Earth Obs. Geoinf. 2012, 14, 160–168. [Google Scholar] [CrossRef]
- Wu, C.; Shen, H.; Shen, A.; Deng, J.; Gan, M.; Zhu, J.; Xu, H.; Wang, K. Comparison of machine-learning methods for above-ground biomass estimation based on Landsat imagery. J. Appl. Remote Sens. 2016, 10, 035010. [Google Scholar] [CrossRef]
- Blodgett, C.; Jakubauskas, M. Remote Sensing of Coniferous Forest Structure in Grand Teton National Park; University of Wyoming National Park Service Research Center: Laramie, WY, USA, 1995; Volume 19. [Google Scholar]
- Delissio, L.J.; Primack, R.B. The impact of drought on the population dynamics of canopy-tree seedlings in an aseasonal Malaysian rain forest. J. Trop. Ecol. 2003, 19, 489–500. [Google Scholar] [CrossRef]
- Rautiainen, M.; Heiskanen, J. Seasonal Dynamics of Boreal Forest Structure and Reflectance. In Proceedings of the AGU Fall Meeting, San Francisco, CA, USA, 13–17 December 2010. [Google Scholar]
- Zhu, X.; Liu, D. Improving forest aboveground biomass estimation using seasonal Landsat NDVI time-series. ISPRS J. Photogramm. Remote Sens. 2015, 102, 222–231. [Google Scholar] [CrossRef]
- Tian, X.; Li, Z.; Su, Z.; Chen, E.; van der Tol, C.; Li, X.; Guo, Y.; Li, L.; Ling, F. Estimating montane forest above-ground biomass in the upper reaches of the Heihe River Basin using Landsat-TM data. Int. J. Remote Sens. 2014, 35, 7339–7362. [Google Scholar] [CrossRef]
- Zhu, J.; Huang, Z.; Sun, H.; Wang, G. Mapping forest ecosystem biomass density for Xiangjiang River Basin by combining plot and remote sensing data and comparing spatial extrapolation methods. Remote Sens. 2017, 9, 241. [Google Scholar] [CrossRef]
- Shao, Z.; Zhang, L. Estimating forest aboveground biomass by combining optical and SAR data: A case study in genhe, inner Mongolia, China. Sensors 2016, 16, 834. [Google Scholar] [CrossRef]
- Mutanga, O.; Adam, E.; Cho, M.A. High density biomass estimation for wetland vegetation using worldview-2 imagery and random forest regression algorithm. Int. J. Appl. Earth Obs. Geoinf. 2012, 18, 399–406. [Google Scholar] [CrossRef]
- Huete, A.; Didan, K.; Miura, T.; Rodriguez, E.P.; Gao, X.; Ferreira, L.G. Overview of the radiometric and biophysical performance of the MODIS vegetation indices. Remote Sens. Environ. 2002, 83, 195–213. [Google Scholar] [CrossRef]
- Safari, A.; Sohrabi, H.; Powell, S.; Shataee, S. A comparative assessment of multi-temporal Landsat 8 and machine learning algorithms for estimating aboveground carbon stock in coppice oak forests. Int. J. Remote Sens. 2017, 38, 6407–6432. [Google Scholar] [CrossRef]
- Scott, L.; Powell; Cohen, W.B.; Healey, S.P.; Kennedy, R.E.; Moisen, G.G.; Pierce, K.B.; Ohmann, J.L. Quantification of live aboveground forest biomass dynamics with Landsat time-series and field inventory data: A comparison of empirical modeling approaches. Remote Sens. Environ. 2010, 114, 1053–1068. [Google Scholar] [CrossRef]
- Chen, A.; He, X.; Guan, H.; Cai, Y. Trends and periodicity of daily temperature and precipitation extremes during 1960–2013 in Hunan Province, central south China. Theor. Appl. Climatol. 2018, 132, 71–88. [Google Scholar] [CrossRef]
- Li, W.; Li, F. Research of Forest Resources in China, 1st ed.; China Forestry Publishing House: Beijing, China, 1996; ISBN 7503817224. [Google Scholar]
- Li, H.; Lei, Y.; Zeng, W.; Chen, Y.; Huang, G. Estimation and Evaluation of Forestry Biomass Carbon Storage in China; China Forestry Press: Beijing, China, 2010. [Google Scholar]
- Vermote, E.; Justice, C.; Claverie, M.; Franch, B. Preliminary analysis of the performance of the Landsat 8/OLI land surface reflectance product. Remote Sens. Environ. 2016, 185, 46–56. [Google Scholar] [CrossRef]
- Rouse, W.; Haas, R.H.; Deering, D.W. Monitoring vegetation systems in the Great Plains with ERTS, NASA SP-351. In Third ERTS-1 Symposium; NASA: Washington, DC, USA, 1974; Volume 1, pp. 309–317. [Google Scholar]
- Lu, D.; Mausel, P.; Brondízio, E.; Moran, E. Relationships between forest stand parameters and Landsat TM spectral responses in the Brazilian Amazon Basin. For. Ecol. Manag. 2004, 198, 149–167. [Google Scholar] [CrossRef]
- Nemani, R.; Pierce, L.; Running, S.; Band, L. Forest ecosystem processes at the watershed scale: Sensitivity to remotely-sensed leaf area index estimates. Int. J. Remote Sens. 1993, 14, 2519–2534. [Google Scholar] [CrossRef]
- Clevers, J.G.P.W. The derivation of a simplified reflectance model for the estimation of leaf area index. Remote Sens. Environ. 1988, 25, 53–69. [Google Scholar] [CrossRef]
- Wu, W. The Generalized Difference Vegetation Index (GDVI) for dryland characterization. Remote Sens. 2014, 6, 1211–1233. [Google Scholar] [CrossRef]
- Ünsalan, C.; Boyer, K.L. Linearized vegetation indices based on a formal statistical framework. IEEE Trans. Geosci. Remote Sens. 2004, 42, 1575–1585. [Google Scholar] [CrossRef]
- Gao, B.-C. NDWI-A Normalized Difference Water Index for Remote Sensing of Vegetation Liquid Water from Space. Remote Sens. Environ. 1996, 58, 257–266. [Google Scholar] [CrossRef]
- Gitelson, A.A.; Merzlyak, M.N. Remote sensing of chlorophyll concentration in higher plant leaves. Adv. Space Res. 1998, 22, 689–692. [Google Scholar] [CrossRef]
- HUETE, A.R. A Soil-Adjusted Vegetation Index (SAVI). Remote Sens. Environ. 1988, 25, 295–309. [Google Scholar] [CrossRef]
- Birth, G.S.; McVey, G.R. Measuring the Color of Growing Turf with a Reflectance Spectrophotometer 1. Agron. J. 1968, 60, 640–643. [Google Scholar] [CrossRef]
- Lu, D.; Batistella, M. Exploring TM image texture and its relationships with biomass estimation in Rondônia, Brazilian Amazon. Acta Amaz. 2005, 35, 249–257. [Google Scholar] [CrossRef]
- Bontemps, S.; Defourny, P.; Radoux, J.; Van Bogaert, E.; Lamarche, C.; Achard, F.; Mayaux, P.; Boettcher, M.; Brockmann, C.; Kirches, G.; et al. Consistent Global Land Cover Maps for Climate Modeling Communities: Current Achievements of the ESA’s Land Cover CCI. In Proceedings of the ESA Living Planet Symposium, Edinburgh, UK, 9–13 September 2013; pp. 9–13. [Google Scholar]
- Liu, X.; Yu, L.; Li, W.; Peng, D.; Zhong, L.; Li, L.; Xin, Q.; Lu, H.; Yu, C.; Gong, P. Comparison of country-level cropland areas between ESA-CCI land cover maps and FAOSTAT data. Int. J. Remote Sens. 2018, 39, 6631–6645. [Google Scholar] [CrossRef]
- Gómez, R.S.; Pérez, J.G.; Del, M.; López, M. Collinearity diagnostic applied in ridge estimation through the variance inflation factor. J. Appl. Stat. 2016, 43, 1831–1849. [Google Scholar] [CrossRef]
- Brien, R.M.O. A Caution Regarding Rules of Thumb for Variance Inflation Factors. Qual. Quant. 2007, 41, 673–690. [Google Scholar] [CrossRef]
- Burman, B.Y.P. A comparative study of ordinary cross-validation, r-fold cross-validation and the repeated learning-testing methods. Biometrika 1989, 76, 503–514. [Google Scholar] [CrossRef]
- Freeman, E.A.; Moisen, G.G.; Coulston, J.W.; Wilson, B.T. Random forests and stochastic gradient boosting for predicting tree canopy cover: Comparing tuning processes and model performance. Can. J. For. Res. 2015, 46, 323–339. [Google Scholar] [CrossRef]
- Fassnacht, F.E.; Hartig, F.; Latifi, H.; Berger, C.; Hernández, J.; Corvalán, P.; Koch, B. Importance of sample size, data type and prediction method for remote sensing-based estimations of aboveground forest biomass. Remote Sens. Environ. 2014, 154, 102–114. [Google Scholar] [CrossRef]
- White, J.C.; Gómez, C.; Wulder, M.A.; Coops, N.C. Characterizing temperate forest structural and spectral diversity with Hyperion EO-1 data. Remote Sens. Environ. 2010, 114, 1576–1589. [Google Scholar] [CrossRef]
- Singh, M.; Malhi, Y.; Bhagwat, S. Biomass estimation of mixed forest landscape using a Fourier transform texture-based approach on very-high-resolution optical satellite imagery. Int. J. Remote Sens. 2014, 35, 3331–3349. [Google Scholar] [CrossRef]
- Wang, X.; Shao, G.; Chen, H.; Lewis, B.J.; Qi, G.; Yu, D.; Zhou, L.; Dai, L. An application of remote sensing data in mapping landscape-level forest biomass for monitoring the effectiveness of forest policies in northeastern china. Environ. Manag. 2013, 52, 612–620. [Google Scholar] [CrossRef]
- Li, C.; Li, Y.; Li, M. Improving forest aboveground biomass (AGB) estimation by incorporating crown density and using Landsat 8 OLI images of a subtropical forest in western Hunan in central China. Forests 2019, 10, 104. [Google Scholar] [CrossRef]
- Gao, Y.; Lu, D.; Li, G.; Wang, G.; Chen, Q.; Liu, L.; Li, D. Comparative analysis of modeling algorithms for forest aboveground biomass estimation in a subtropical region. Remote Sens. 2018, 10, 627. [Google Scholar] [CrossRef]
- Chrysafis, I.; Mallinis, G.; Gitas, I.; Tsakiri-Strati, M. Estimating Mediterranean forest parameters using multi seasonal Landsat 8 OLI imagery and an ensemble learning method. Remote Sens. Environ. 2017, 199, 154–166. [Google Scholar] [CrossRef]
- Lu, D. Aboveground biomass estimation using Landsat TM data in the Brazilian Amazon. Int. J. Remote Sens. 2005, 26, 2509–2525. [Google Scholar] [CrossRef]
- Bonate, P.L. Pharmacokinetic-Pharmacodynamic Modeling and Simulation; Springer: New York, NY, USA, 2011; ISBN 9781441994844. [Google Scholar]
- Lu, D. The potential and challenge of remote sensing-based biomass estimation. Int. J. Remote Sens. 2006, 27, 1297–1328. [Google Scholar] [CrossRef]
- Main-Knorn, M.; Moisen, G.G.; Healey, S.P.; Keeton, W.S.; Freeman, E.A.; Hostert, P. Evaluating the remote sensing and inventory-based estimation of biomass in the western carpathians. Remote Sens. 2011, 3, 1427–1446. [Google Scholar] [CrossRef]
© 2019 by the authors. Licensee MDPI, Basel, Switzerland. This article is an open access article distributed under the terms and conditions of the Creative Commons Attribution (CC BY) license (http://creativecommons.org/licenses/by/4.0/).