Article

Growth, Nutrient Assimilation, and Carbohydrate Metabolism in Korean Pine (Pinus koraiensis) Seedlings in Response to Light Spectra

1
Northeast Institute of Geography and Agroecology, Chinese Academy of Sciences, Changchun 130102, China
2
College of Natural Resources, University of Wisconsin–Stevens Point, Stevens Point, WI 54481, USA
3
University of Chinese Academy of Sciences, Beijing 100049, China
*
Author to whom correspondence should be addressed.
Forests 2020, 11(1), 44; https://doi.org/10.3390/f11010044
Submission received: 31 October 2019 / Revised: 24 December 2019 / Accepted: 27 December 2019 / Published: 31 December 2019

Abstract

:
A need is growing to plant superior Korean pine (Pinus koraiensis Siebold & Zucc.) seedlings to cope with the degradation of secondary forests in Northeast Eurasia. The goal of this study was to detect the physiological effect on the quality of Korean pine seedlings exposed to a range of spectra. One-year-old seedlings (n = 6) were cultured in three light-emitting diode (LED) spectra (69‒77 μmol m−2 s−1) of 13.9% red (R) + 77.0% green (G) + 9.2% blue (B) (R1BG5), 26.2% R + 70.2% G + 3.5% B (R2BG3), and 42.3% R + 57.3% G + 0.4% B (R3BG1). The spectrum of high-pressure sodium (HPS) lamps (43.9% R + 54.7% G + 1.5 B) was taken as the reference. Results showed that LED-lighting resulted in shorter seedlings with a greater diameter, shoot biomass, assessed quality, and sturdiness compared to those under the HPS-lighting. The R3BG1 spectrum reduced the shoot nitrogen (N) deficiency induced by the HPS spectrum, while the R1BG5 treatment induced a steady-state uptake of N and phosphorus (P) in whole-plant organs. The R1BG5 spectrum also resulted in a higher soluble sugar concentration and higher activities of glutamine synthetase and acid phosphatase in needles compared to the control. Seedlings in the R2BG3 spectrum had the highest concentrations of chlorophyll and soluble protein in the leaves. Overall, the R-high LED-spectrum could stimulate biomass accumulation in shoot, but meanwhile resulted in a P deficiency. Hence, the LED lighting in the R1BG5 spectrum is recommended to promote the quality of Korean pine seedlings.

1. Introduction

Korean pine (Pinus koraiensis Siebold & Zucc.) is one of the dominant tree species in forests in the cold regions of Northeast China and Siberia [1,2]. Lands dwelled by Korean pine populations account for an area of nearly five million square kilometers. Forests with Korean pine trees also include populations of Juglans mandshurica Max., Fraxinus mandshurica Rup., and Quercus mongolica Fisch. ex Ledeb. [2]. Korean pine trees in primary forests have been affected by over-harvesting for timber production and pine nuts for human consumption for four decades. Korean pine seedlings grafted on Pinus sylvestris var. mongolica Litv. root stock was undertaken to improve transplant success with the aim to maximize temporal seed production. Thus, natural Korean pine forests have declined from their original habitats and methods to grow secondary forests through grafted seedlings have resulted in unacceptable mortality rates. Korean pine was introduced from Changbai Mountain to the Great Xing’an Mountains during the last 20 years, but few successes have been found and recorded [3]. Further, as a result of both anthropogenic exploitation and natural disasters, the abundance of Korean pine trees declined in secondary forests, which was also accompanied by a degradation of associated ecosystem functions [4]. Determining methods to successfully increase the number of Korean pine trees in forests is important for improving the quality of secondary forests.
Planting qualified seedlings is a conventional approach to promote the abundance of desired tree species. Culturing Korean pine seedlings to a desired size usually needs several years because of their extremely slow growing rate. The Chinese national standard for tree seedling quality suggests a nursery culture of Korean pine seedlings requires up to 4 years as 2-2 stocks [5]. This protocol can generally assure a morphological size with a height of 12 cm and a root-collar diameter (RCD) over 0.35 cm [5]. However, a field study revealed that Korean pine seedlings may not need such a long time to obtain the expected quality and morphology [6]. Shorter-term nursery cultures reduce the expenses of labor, land, fertilizer, and water. Hence, an available cultural regime in a nursery or greenhouse that results in Korean pine seedlings with the same or higher quality in a shorter time is needed to increase the efficiency of afforestation using high-quality seedlings.
Photosynthetically appropriate light energy is indispensable for the growth and photosynthesis of juvenile tree plants [7]. The technical development of light-emitting diode (LED) lighting has enabled supplying artificial illumination to tree seedlings with a controlled spectrum with appropriate red (R) (600–700 nm), green (G) (500–600 nm), and blue (B) (400–500 nm) lights at a lower energy cost than conventional lighting. Greenhouse trials revealed that LED lighting with R-high spectra can greatly promote tree shoot growth [8,9,10]. Studies of some boreal species showed that increased shoot development by LED lighting was also accompanied by increased sturdiness, which may, in contrast, impair seedling quality [7,11]. Growth and physiological performances can also be promoted using B [12] and G lights [13]. In addition, tree seedlings may also show a species-specific response in morphology and quality to various spectra [14]. Responses of the physiology and growth in pine trees to LED spectra were also found to vary in the current literature [7,11,14], but still little is known about the response of Korean pine seedlings. Thus, improving seedling quality through artificial culture with LED lighting may be an approach to improve the cultural protocol of Korean pine seedlings [9,10].
In secondary forests where Korean pine trees dwell, illumination conditions of light intensity and quality can both significantly affect seed germination, seedling photosynthesis, and tree growth in this species [2,15,16]. The seeds of Korean pine require a light transmittance lower than 60% for germination, but its seedlings require a higher transmittance and at least a minimum 7% canopy openness [2,15]. To test this, measuring seedling growth, nutrient assimilation, and carbohydrate metabolism is important to understand the response of Korean pine seedlings to various LED spectra.
High-pressure sodium (HPS) lamps are currently used to promote tree seedling growth [17]; however, this involves a high energy cost for large-scale use in tree seedling cultures [18]. More LED lighting spectrum combinations are possible than with HPS lighting and at a lower energy cost [7,9,11,18]. The aim of this study was to reveal the mechanism for the development of quality in Korean pine seedlings exposed to a range of spectra through measuring growth, biomass, carbohydrates, foliar physiology, and enzyme activity. We hypothesized that, compared to the HPS spectrum, a higher-R spectrum from LED lighting would result in (i) faster growth and higher quality, and (ii) both nutrient assimilation and carbohydrate metabolism improvements.

2. Materials and Methods

2.1. Plant Material and Pre-Culture

Eight cones were collected from the sunlit part of the overlapping canopies from two mother Korean pine trees found locally in Linjiang City (41°56′ N, 127°16′ E), Jilin Province, Northeast China. Approximately 120 seeds from each cone were collected, giving a total of 960 seeds. The seeds were sterilized by soaking them in 0.5% (w/w) potassium permanganate for 30 min [19] and stratified in sand at a 0.15 m depth from October 2016 to April 2017. The seeds were then extracted and watered to remove any remaining sand. The cleaned seeds were sterilized and soaked in water for 24 h. About 90 non-viable seeds floated on the water’s surface with 870 vigorous seeds left. Thereafter, seeds were sown in 1.1 m width and 40 m length nursery beds in Linjiang City (41°44′ N, 126°51′ E). A total of 790 seedlings germinated. Nursery soils were loamy sands with 18% clay particles of <0.002 mm or less in diameter, with a 5.89 soil pH and 3.1% organic matter (OM). The available nitrogen (N), phosphorus (P), and potassium (K) were 184, 134, and 193 mg kg−1, respectively. All 790 seedlings were grown for six months in 2017 and overwintered [19].

2.2. Seedling Transplant

Overwintered Korean pine seedlings were transported to the Laboratory of Combined Manipulations of Illumination and Fertility on Plant Growth (Zhilunpudao Agric. S&T Ltd., Changchun, China) (43°58′ N, 125°24′ E) in Changchun City, Northeast China. Seven hundred and sixty-eight uniform-size individuals were chosen from the overwintered seedlings. The initial height and root-collar diameter (RCD) of the chosen seedlings were measured to be 3.3 cm and 0.10 cm, respectively. In the laboratory, the seedlings were first cleaned with distilled water to remove the nursery soil. Half of the lateral roots were removed and then seedlings were transplanted to a planting tray with 32 cavities (13 cm deep, 7 cm top-diameter, and 212 cm3 volume) in a 4 × 8 arrangement with all cavities planted and filled with a commercial peat, spent-mushroom residue (SMR), and perlite substrate in the volumetric proportion of 55:20:25 (Mashiro-Dust™, Zhiluntuowei A&F S&T, Ltd., Changchun, China). The substrate had ammonium N of 80.0 mg kg−1, nitrate N of 1.7 g kg−1, available P of 0.4 g kg−1, OM of 13.0%, pH of 4.8, and electrical conductivity of 1.6 µS cm−1. A total number of 768 seedlings were grown in 24 planting-trays with 32 individuals in each tray.

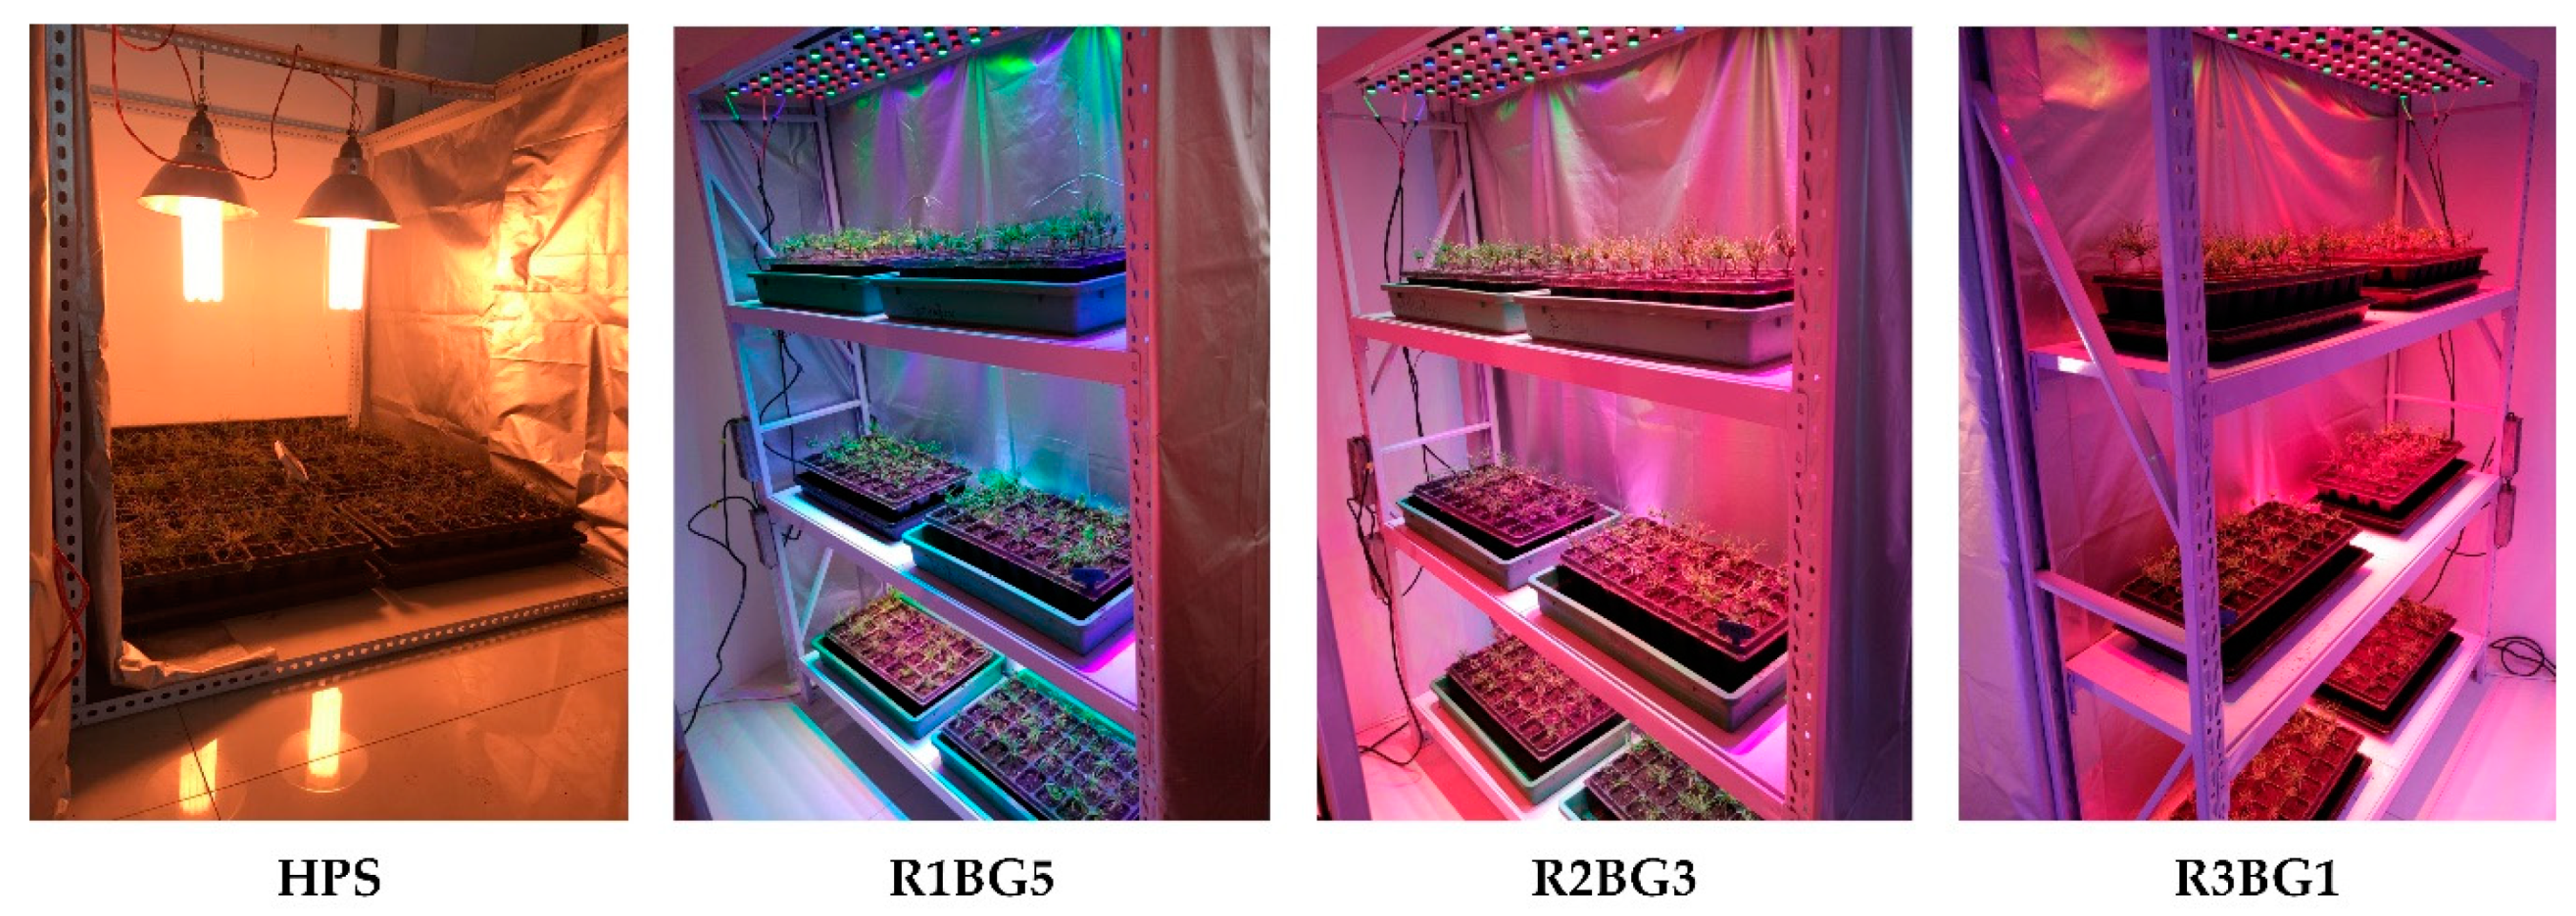
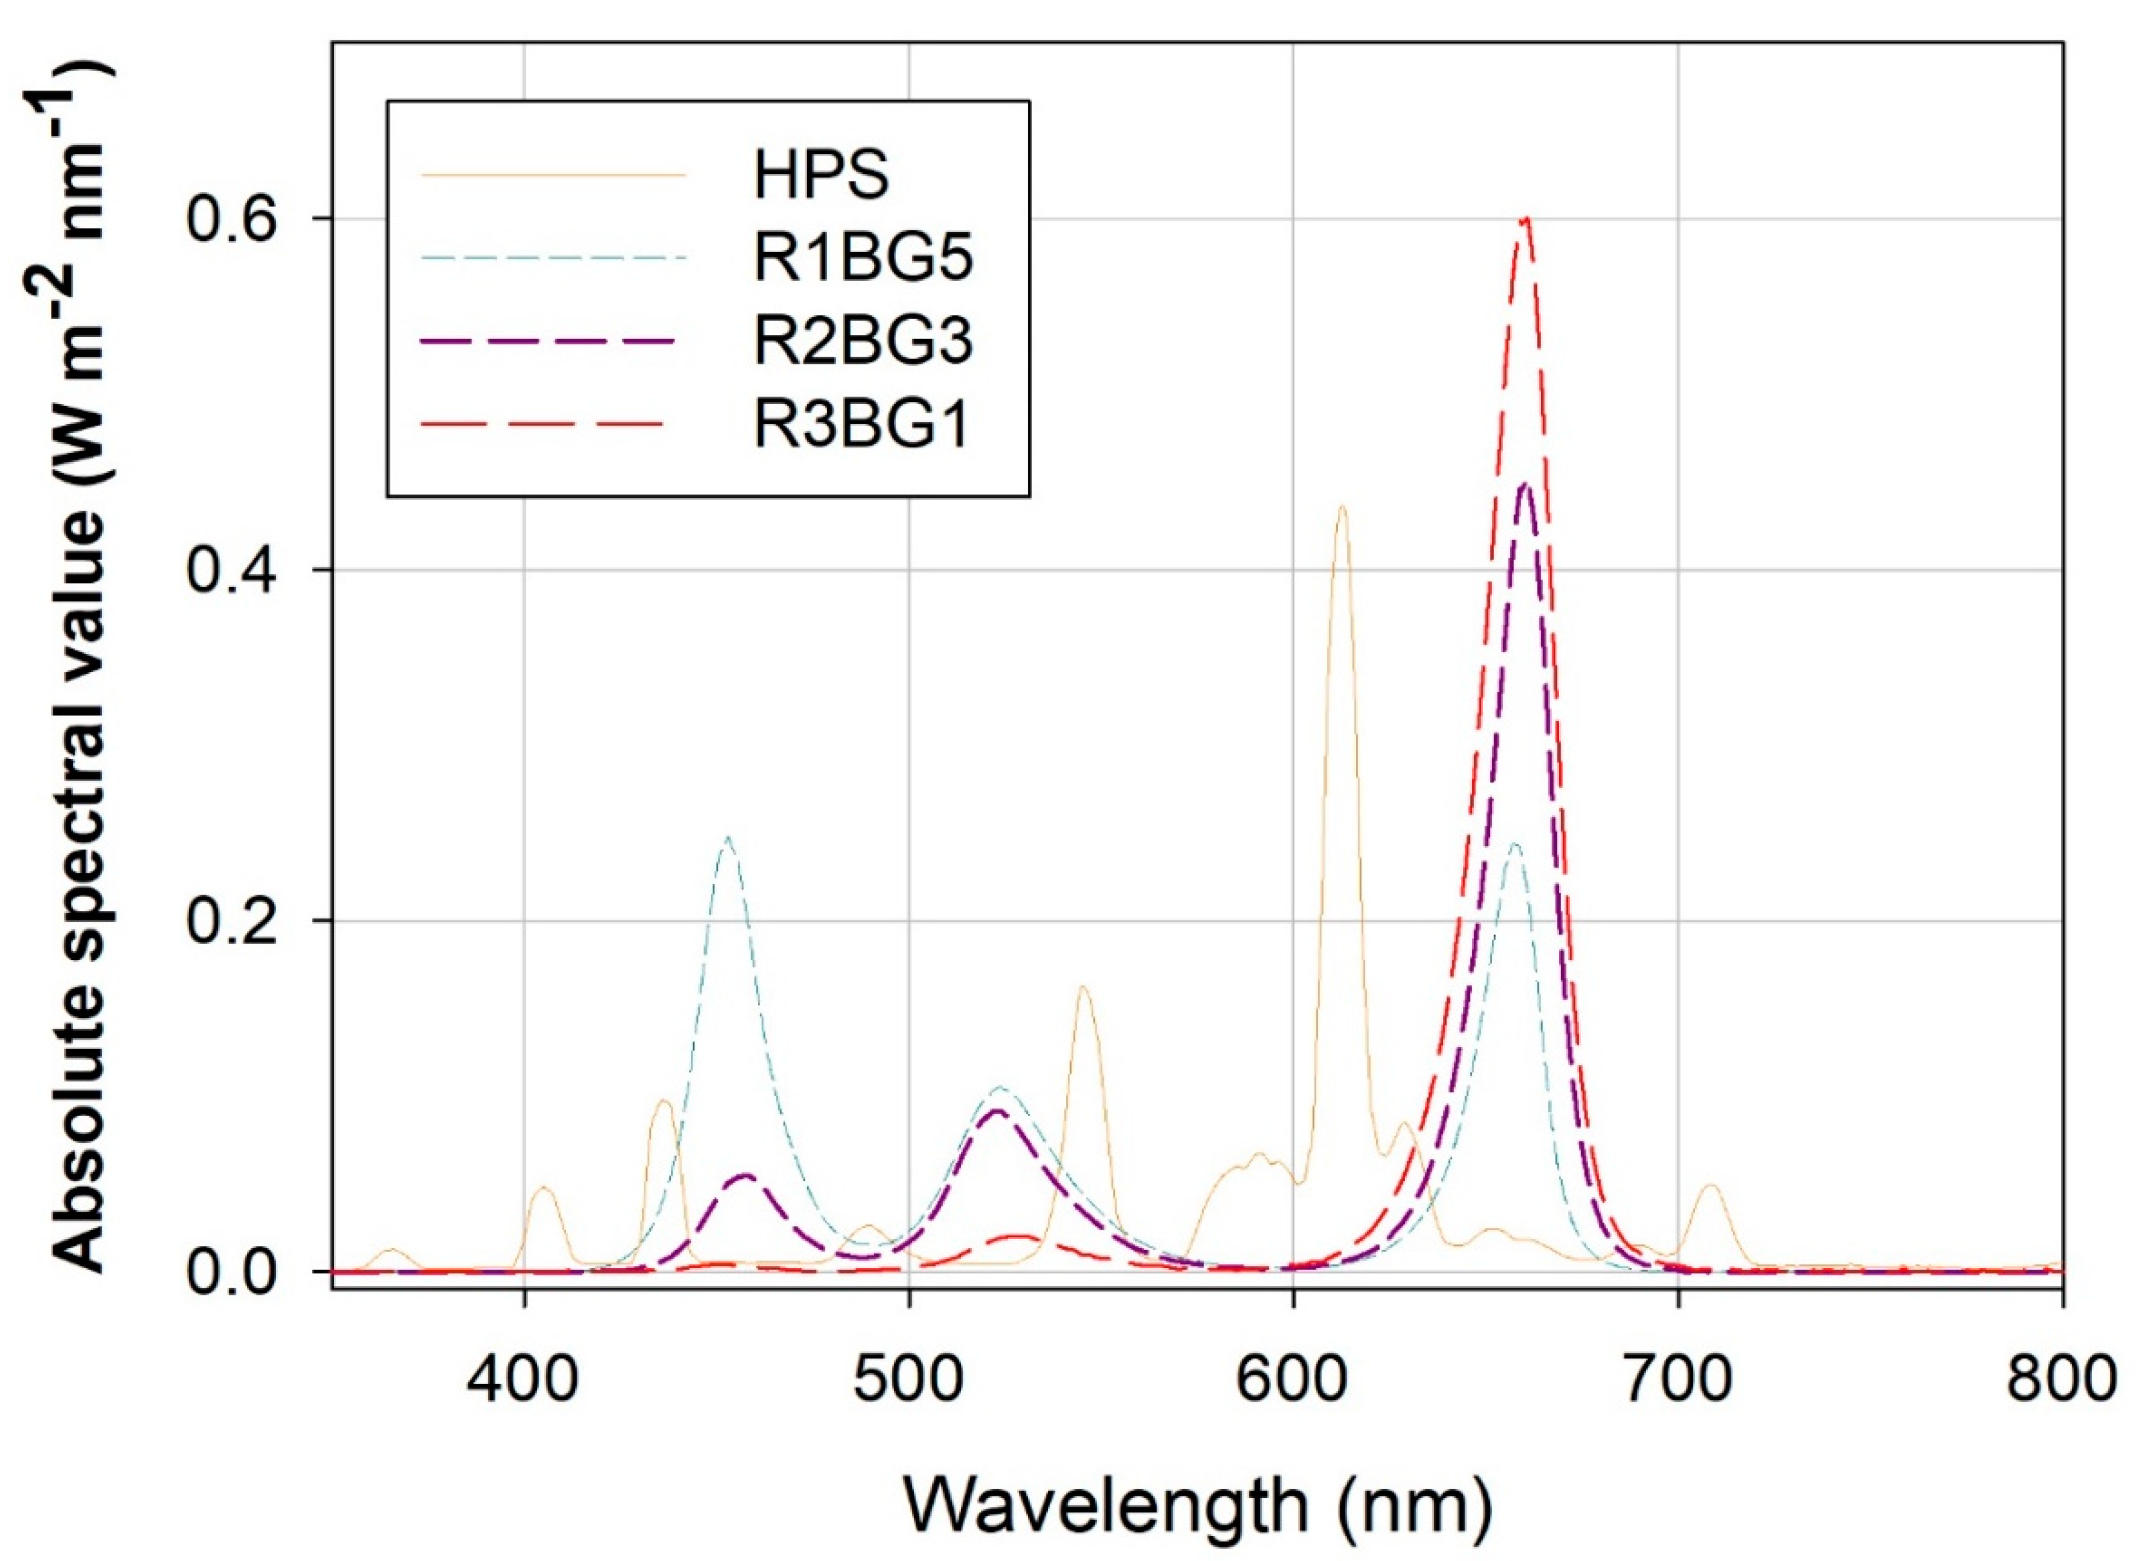
2.3. Illumination Treatment

Four illumination treatments were given using three LED lighting spectra plus one spectrum from HPS as the control reference. LED lighting was supplied by panels (0.1 m height × 0.4 m width × 1.2 m length) that were fixed to the top of the growing chambers with three shelves (Figure 1). Each shelf was sized 2.0 m × 0.5 m × 1.5 m (height × width × length). Each shelf had a 375 L volume of inner space and was 0.5 m × 0.5 m × 1.5 m (height × width × length) in size. Hence, a shelf allowed a potential 37 cm space for seedling shoot elongation. Two trays were placed on each shelf and six total trays in three chambers were used as replicated measuring units (n = 6). A pair of HPS lamps were hung 60 cm above the ground, beneath which six trays of seedlings were placed horizontally to obtain similar light conditions as with the LED lighting (Table 1). The experiment was conducted as a single factor design of three LED treatments and one HPS control with six randomly placed replicates of trays with 192 seedlings in each treatment.
On the downward-facing side of the panel on each shelf roof, 100 diodes were embedded onto the surface with a spacing of 2 cm × 2 cm. Each diode was covered by a filter to control the energy loss from the lateral emission of light. To promote a uniform heterogeneous lighting pattern, the difference of photosynthetic photon flux rate (PPFD) was designed to be no more than 5% between any randomly paired spots at least 15 cm beneath the LED panel. Each diode was manufactured to emit one of R, G, or B lights, where each color was controlled by transformers as follows: the electric flow of the R light was controlled by a 200-W electrical transformer and the electric currents of G and B lights were bulked and controlled by a 135-W transformer. Therefore, regulating the electric current flow enabled the intensity of R light and combined G+B lights.
Through adjusting the electric currents, we were able to obtain the three LED spectra by adjusting the light intensity of each wavelength. Therein, R light was intensified from 10% to 30% of whole power of R-light-transformer, meanwhile decreasing the G+B lights’ intensity from 50% to 30% and to 10%. The three LED spectra treatments were then able to be labeled as R1BG5 (10% R power and 50% G+B power), R2BG3 (20% R power and 30% G+B power), and R3BG1 (30% R power and 10% G+B power). According to previous experiences of continuous lighting on tree seedlings [17,18,20], seedlings were illuminated for 18 h per day from 06:00 to 24:00. The specific lighting properties and details for the spectra are shown in Table 1. The graphical relationships between the wavelengths and spectra values for the four spectra treatments are shown in Figure 2.

2.4. Seedling Culture

Seedlings were cultured in a sealed room where only artificial illumination occurred. The temperature was controlled to be in the range between 15.1 °C and 31.7 °C using a cooling fan and a steam heater. The temperature was higher in the HPS lighting condition by 1.6 °C–2.0 °C than in the LED lighting condition due to the HPS lamps emitting a greater amount of heat than the LED panels. The relative humidity (RH) was kept constant at 66% and 99% for the lowest and highest levels, respectively. Trays with seedlings were placed in plastic tanks to receive sub-irrigation (Figure 1). One week after transplanting, the seedlings started to receive liquid fertilization by mixing (NH4)2SO4 and K2HPO4 (N-P2O5-K2O, 4-14-9) according to an exponential model at the rate of 140 mg N seedling−1 [21] through 24 weekly applications. The initial N content in whole seedlings was 1.6 mg, hence the coefficient r was calculated to be 0.19. Seedlings were watered once a week on the same day with a fertilizer application. Both water and fertilizer-solution were poured into the tank to facilitate water absorption through the roots. To facilitate the fertilization, trays were removed from the shelves during the process and then replaced back to the shelves at random. Seedlings were fertilized for six months.

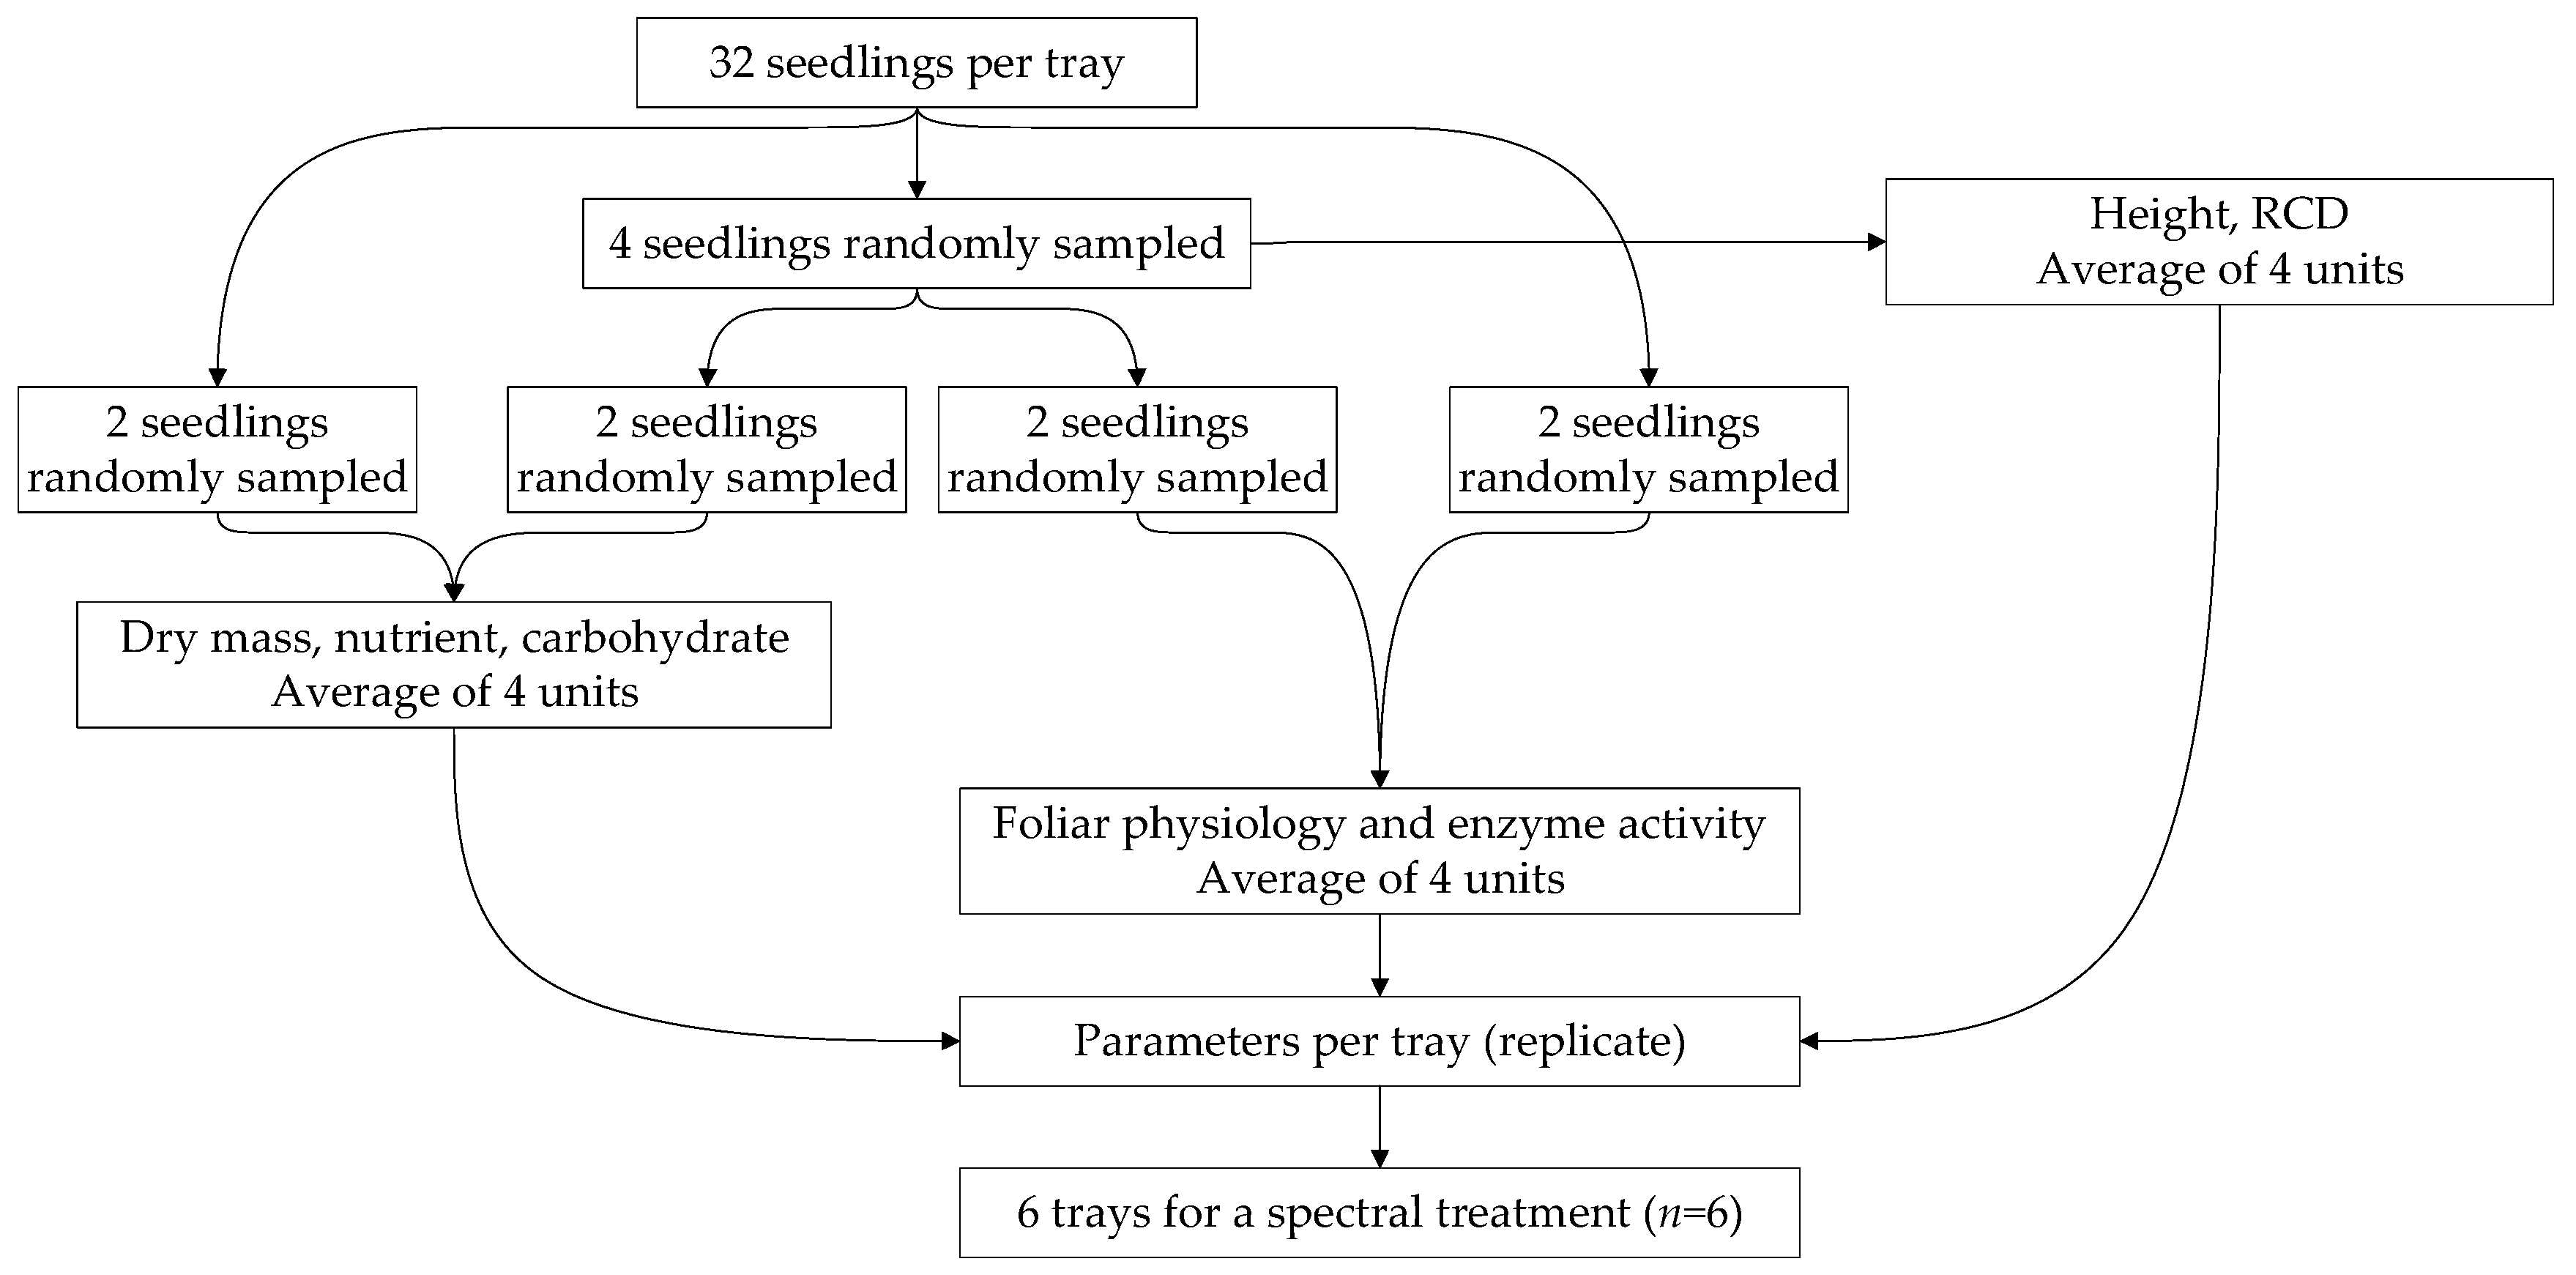
2.5. Seedling Sampling

After the last application of the fertilizer, the lights were switched off and all seedlings were grown without any further irrigation for another week. The short-day treatment was necessary to induce dormancy of the apical bud for coniferous seedlings [22]. Thereafter, four seedlings were randomly sampled (using random numbers from 1 to 32 given by the computer) as replicates from each spectral treatment and measured for height and RCD growth. The height was evaluated using the length of the woody stem from the root collar top to the tip of the apical bud. The RCD was measured for the stem diameter about 3 cm above the root collar. These four seedlings were then randomly divided into two groups with two seedlings per group. Another two seedlings were randomly sampled from the same tray, plus the first group’s two seedlings, and measured for dry mass and determined for nutrient and carbohydrate concentrations. The third pair of randomly sampled seedlings, plus the first pair of seedlings, were used for determining the foliar chlorophyll, protein, and enzyme activity. Therefore, a total number of eight seedlings were randomly sampled from one tray as a replicate for each spectral treatment. Forty-eight seedlings were randomly sampled using six replicated trays (four seedlings per tray as a replicate) for the measurement of 192 seedlings (six trays × 32 seedlings per tray) for one treatment. The systematic process of sampling and replicated parameters is shown in Figure 3.

2.6. Chemical Analysis

After measuring the shoot growth, seedlings were divided into two parts, namely the shoot and root tissue, which were then both dried in an oven at 70 °C for 72 h; after which, the biomass was measured. Dried samples were ground to a powder and used for determining the carbohydrate and nutrient contents. Soluble sugars (glucose, fructose, and sucrose) and starch concentrations were determined using the colorimetric method with a spectrophotometer at the wavelength of 490 nm [9] (UV-Visible 8453, Agilent Technologies Inc., Santa Clara, CA, USA). A 0.5-g sample was dissolved in 50 mL of distilled water, then steamed using high pressure for two hours and the concentration of soluble sugars was measured. The residual was washed by adding 15 mL distilled water, which was then removed via extraction 5 min later, oven-dried at 70 °C, and added to 10 mL of 3% (v/v) hydrochloric acid for extracting in a sealed test-tube in boiling water for eight hours. Thereafter, samples were added to 1 mL of 28% phenol solution and measured for the starch concentration using chromatography at the 490 nm absorbance wavelength. Another 0.2 g sample was digested in 5 mL of 99% (v/v) hydrogen peroxide solution and 95% (v/v) sulfuric acid solution and diluted to 50 mM. N was measured using the Kjeldahl method and P was measured using Inductively Coupled Plasma Optical Emission Spectrometry (ICP-OES) (Thermo Fisher Scientific, Waltham, MA USA).
All physiological parameters were determined using fresh needles [10]. A sample of 0.05 g was placed in a 5-mL test tube for soaking in 2.5 mL of dimethyl sulfoxide. Then, the tube was heated for 1 h in boiling water and reserved for 24 h. Chlorophyll a and b were measured using the spectrophotometer method at wavelengths of 663 nm and 645 nm, respectively. Another leaf sample of 0.1 g was ground in 1 mL of phosphate buffer with a pH of 7.5. The solution was then centrifuged at 3000 rpm for 10 min and treated using 0.1 mL of Folin’s reagent and the protein concentration was determined at 650 nm.
The activities of glutamine synthetase (GS) and acid phosphatase (AP) enzymes were assessed using the method of Wei et al. [23]. For GS, a leaf sample mass of 0.5 g was homogenized in a 5-mL extraction buffer (3.059 g Tris, 0.249 g MgSO4·7H2O, 0.309 g dithiotherithol, and 68.5 g sucrose dissolved in 500 mL deionized water with the pH adjusted to 8.0 using 0.05 mM HCl) at 6000 rpm for 20 min. The homogenate was subsequently further centrifuged (14,000 rpm, 4 °C, 10 min) and used for the GS assay. The 0.7 mL homogenate was added to 6 mL reaction B (6.118 g Tris, 9.959 g MgSO4·7H2O, 1.726 g monosodium glutamate, 1.211 g cysteine, 0.192 g EGTA, pH 7.4, 500 mL) with a solution of 0.7 mL ATP (40 mM). The reaction mixture was incubated at 37 °C for 30 min and stopped by adding 1.0 mL of ferric chloride reagent (3.317 g trichloroacetic acid, 10.102 g FeCl3·6H2O, 5 mL sulfuric acid, 100 mL). The absorbance of the glutamyl-γ-hydroxamate product was measured at 540 nm. The protein concentration was determined using the Coomassie Brilliant Blue G-250 procedure. The 0.5-g fresh sample was ground, centrifuged at 10,000 rpm for 10 min, measured using 1.0 mL supernatant for the protein concentration at 595 nm by adding 5 mL Coomassie Brilliant Blue G-250. For AP, the 0.1-g sample was ground in liquid N with 10 mL of 0.05 M Tris-HCl buffer, containing 1% PVP-10 and 1 mM dithioerythritol, at pH 7.4. The ground sample was centrifuged at 10,000 rpm for 10 min. The supernatant was added to a 10-mL mixture containing 0.2 mM CH3COONa and 0.6 mM p-nitrophenylphosphate (p-NPP) at pH 5.8. The reaction was incubated in the dark at 25 °C for 30 min and was ended by adding 1 mL 6 M NaOH. Absorbance of the reaction mixture was measured spectrophotometrically at 405 nm.

2.7. Indices Calculation

To evaluate the seedling quality, the Dickson quality index (DQI) was used [24]:
D Q I = P l a n t B i o H e i g h t R C D + S h o o t B i o R o o t B i o ,
where PlantBio, ShootBio, and RootBio are the total biomass in the whole-plant, shoot, and root, respectively. Seedling sturdiness index (SI) was employed to evaluate the coordination between the height and RCD [7]:
S I = H e i g h t R C D .

2.8. Statistical Analysis

Statistical analyses were completed using SAS software (ver. 9.4 64-bit, SAS Institute, Cary, NC, USA). Data were tested and were found to follow a normal distribution. Data were first tested using one-way analysis of variance (ANOVA) to detect the effect of spectra treatments on seedling parameters. When the significant effect was indicated by ANOVA at p ≤ 0.05, the means were compared and arranged according to Tukey’s test (α = 0.05). The vector analysis was employed to evaluate the nutritional state of seedlings at the end of the experiment using the control of HPS lighting as the reference. Vector shifts and the corresponding interpretations were adapted from Salifu and Timmer [25].

3. Results

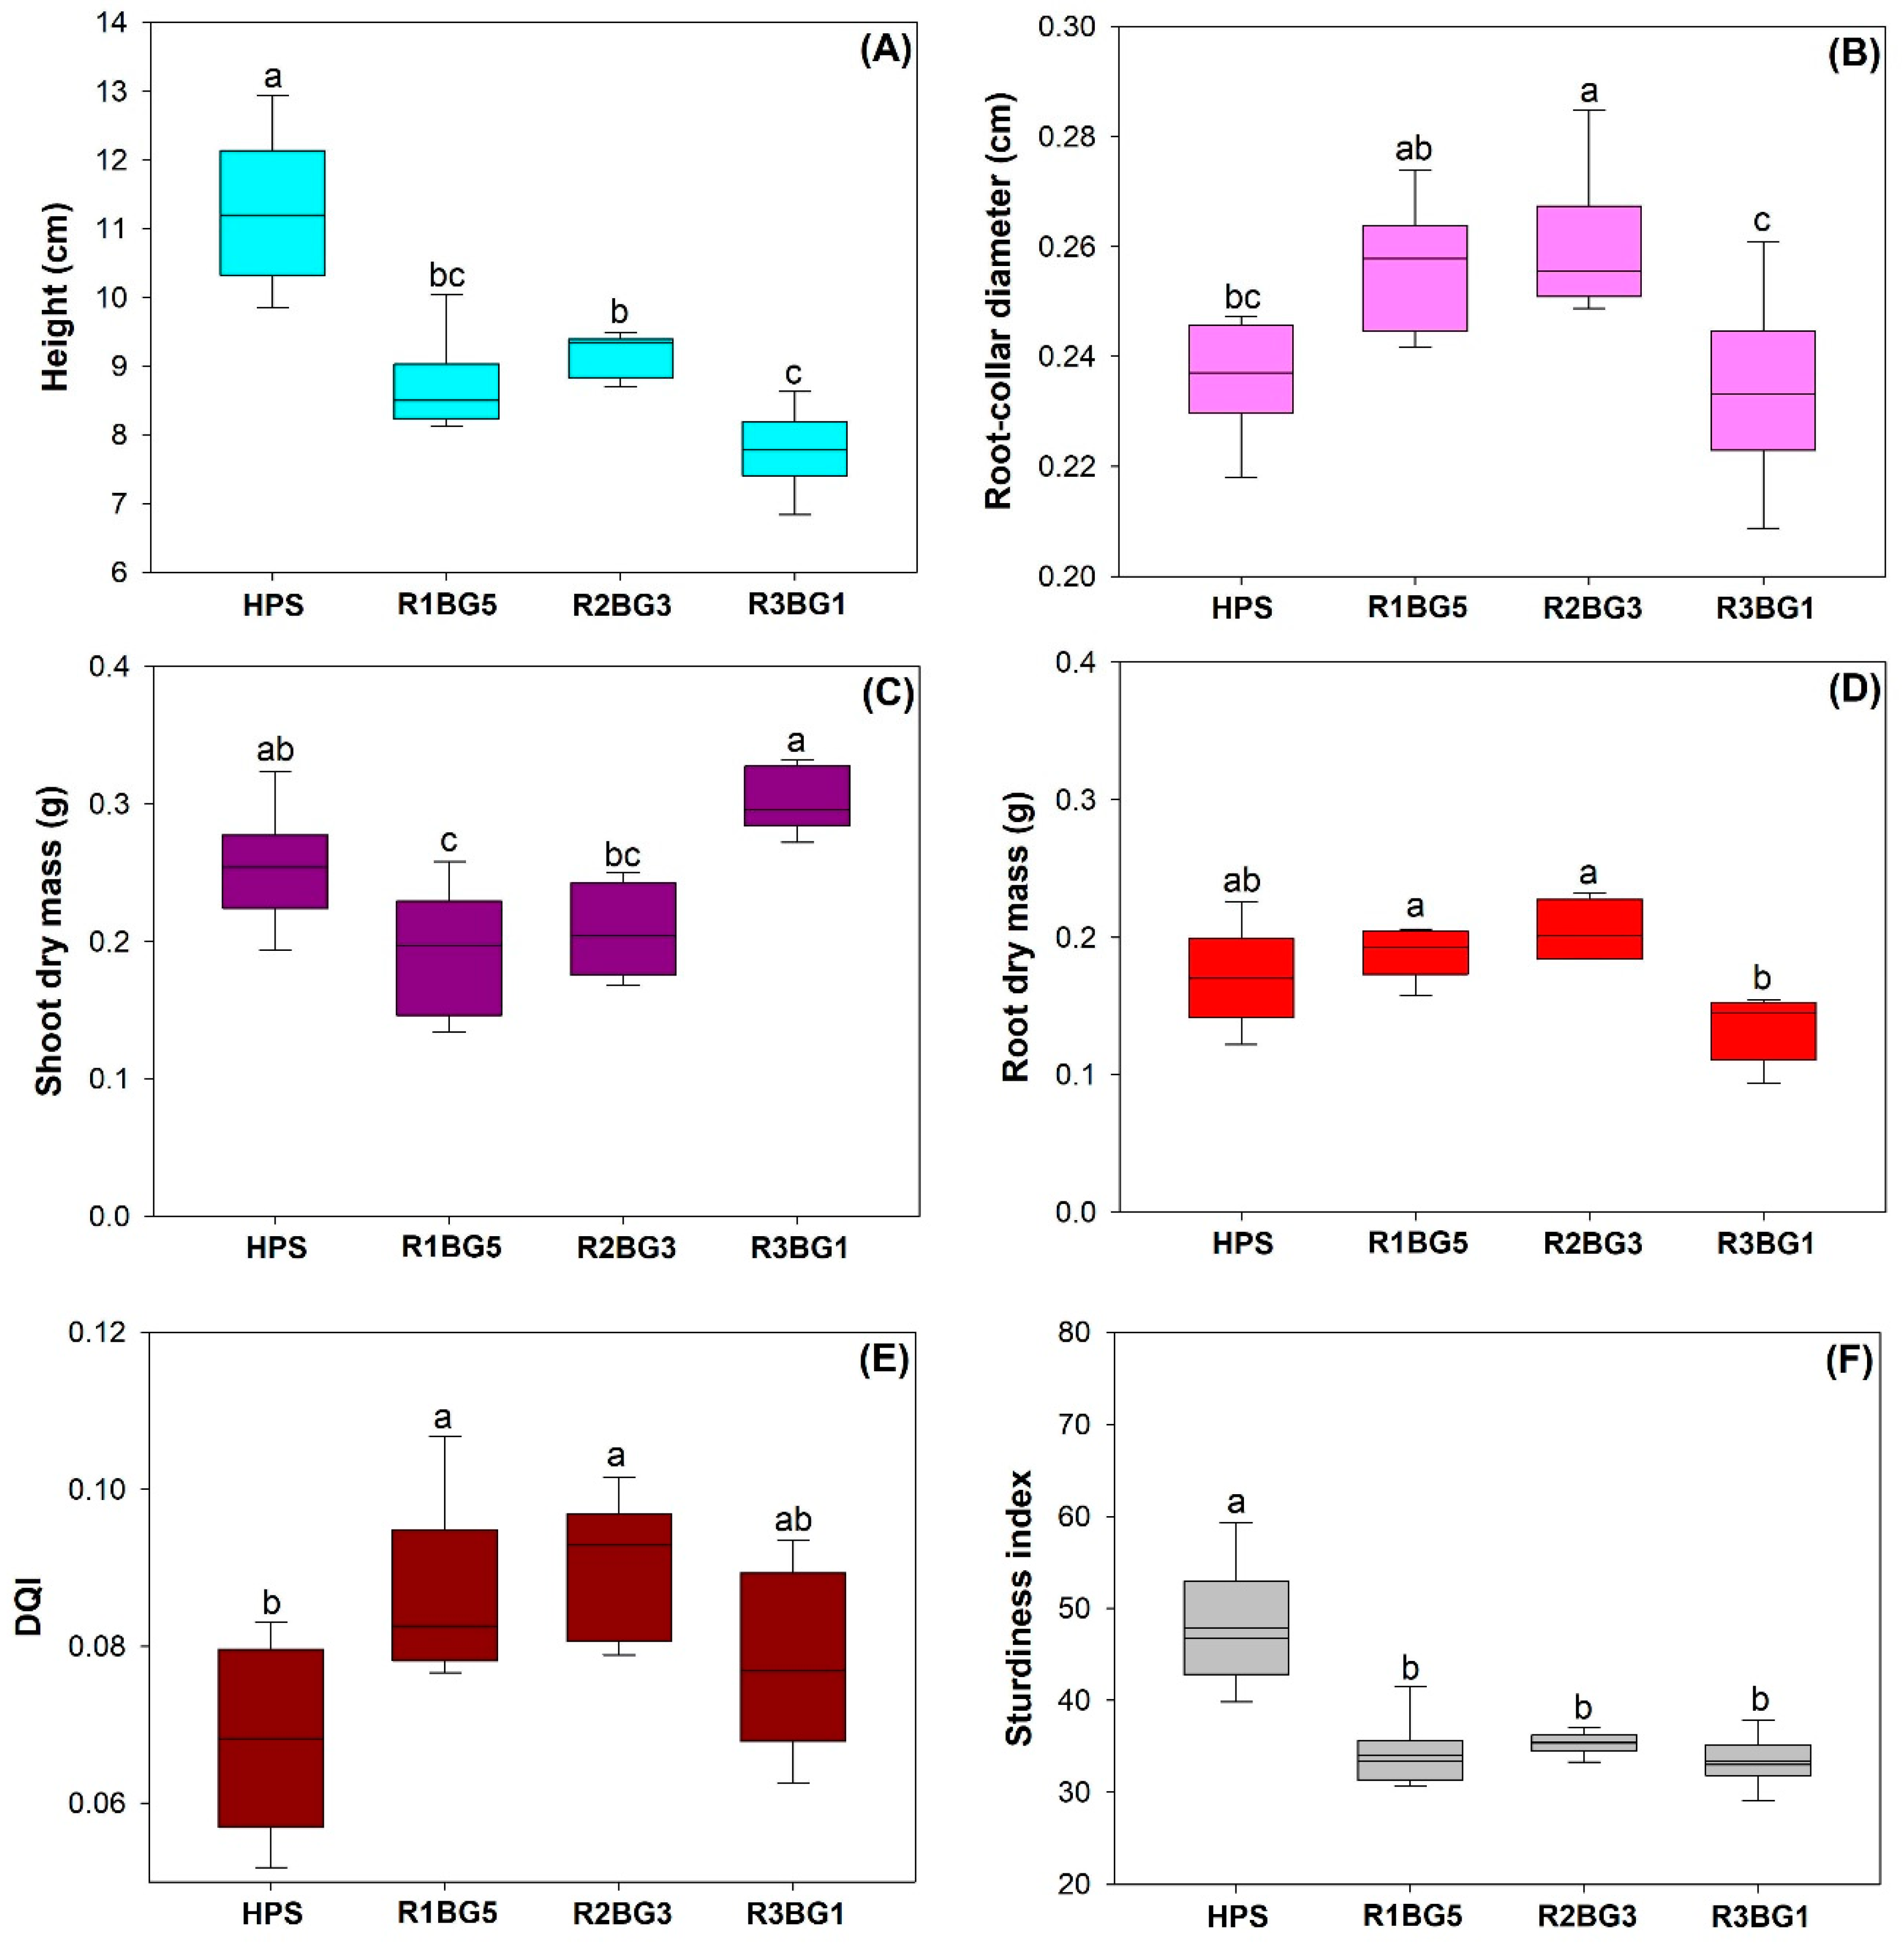
3.1. Seedling Growth, Biomass, and Quality Estimation

The height of Korean pine seedlings was higher in the control spectrum than in the other three LED spectra (F = 24.11; p < 0.0001) (Figure 4A). The seedling height in the HPS control was higher than that in the R1BG5, R2BG3, and R3BG1 treatments by 22.8%, 18.5%, and 30.9%, respectively. The RCD in seedlings of the HPS treatment was lower than that in the R2BG3 treatment by 9.0% (Figure 4B). Either treatment of R1BG5 or R3BG1 had a similar RCD to HPS, but the R1BG5 treatment had a higher RCD than the R3BG1 treatment by 9.6%.
The biomass of shoot and root tissues showed contrasting trends among treatments (Figure 4C,D). Statistically, the shoot biomass in the R3BG1 treatment was greater than that in the R1BG5 and R2BG3 treatments by 56.6% and 45.5%, respectively; meanwhile, the root biomass was 28.8% and 34.4% lower, respectively. The shoot biomass in the R1BG5 treatment was lower by 24.0% than that in the control (Figure 4C). The spectra treatment had a significant effect on the root to shoot biomass ratio (RS) (F = 9.27; p = 0.0005). The RS in seedlings in the control (0.71 ± 0.24) was not statistically different from that in the LED treatments. However, the RS in the R1BG5 and R2BG3 treatments (1.03 ± 0.26 and 1.01 ± 0.18, respectively) was higher than that in the R3BG1 treatment (0.45 ± 0.09) by 128.7% and 124.5%, respectively.
Compared to the control, the DQI was higher in the R1BG5 and R2BG3 treatments by 26.8% and 32.9%, respectively (Figure 4E). All seedlings under LED lighting had a lower sturdiness than those under the control by 26–30% (Figure 4F).

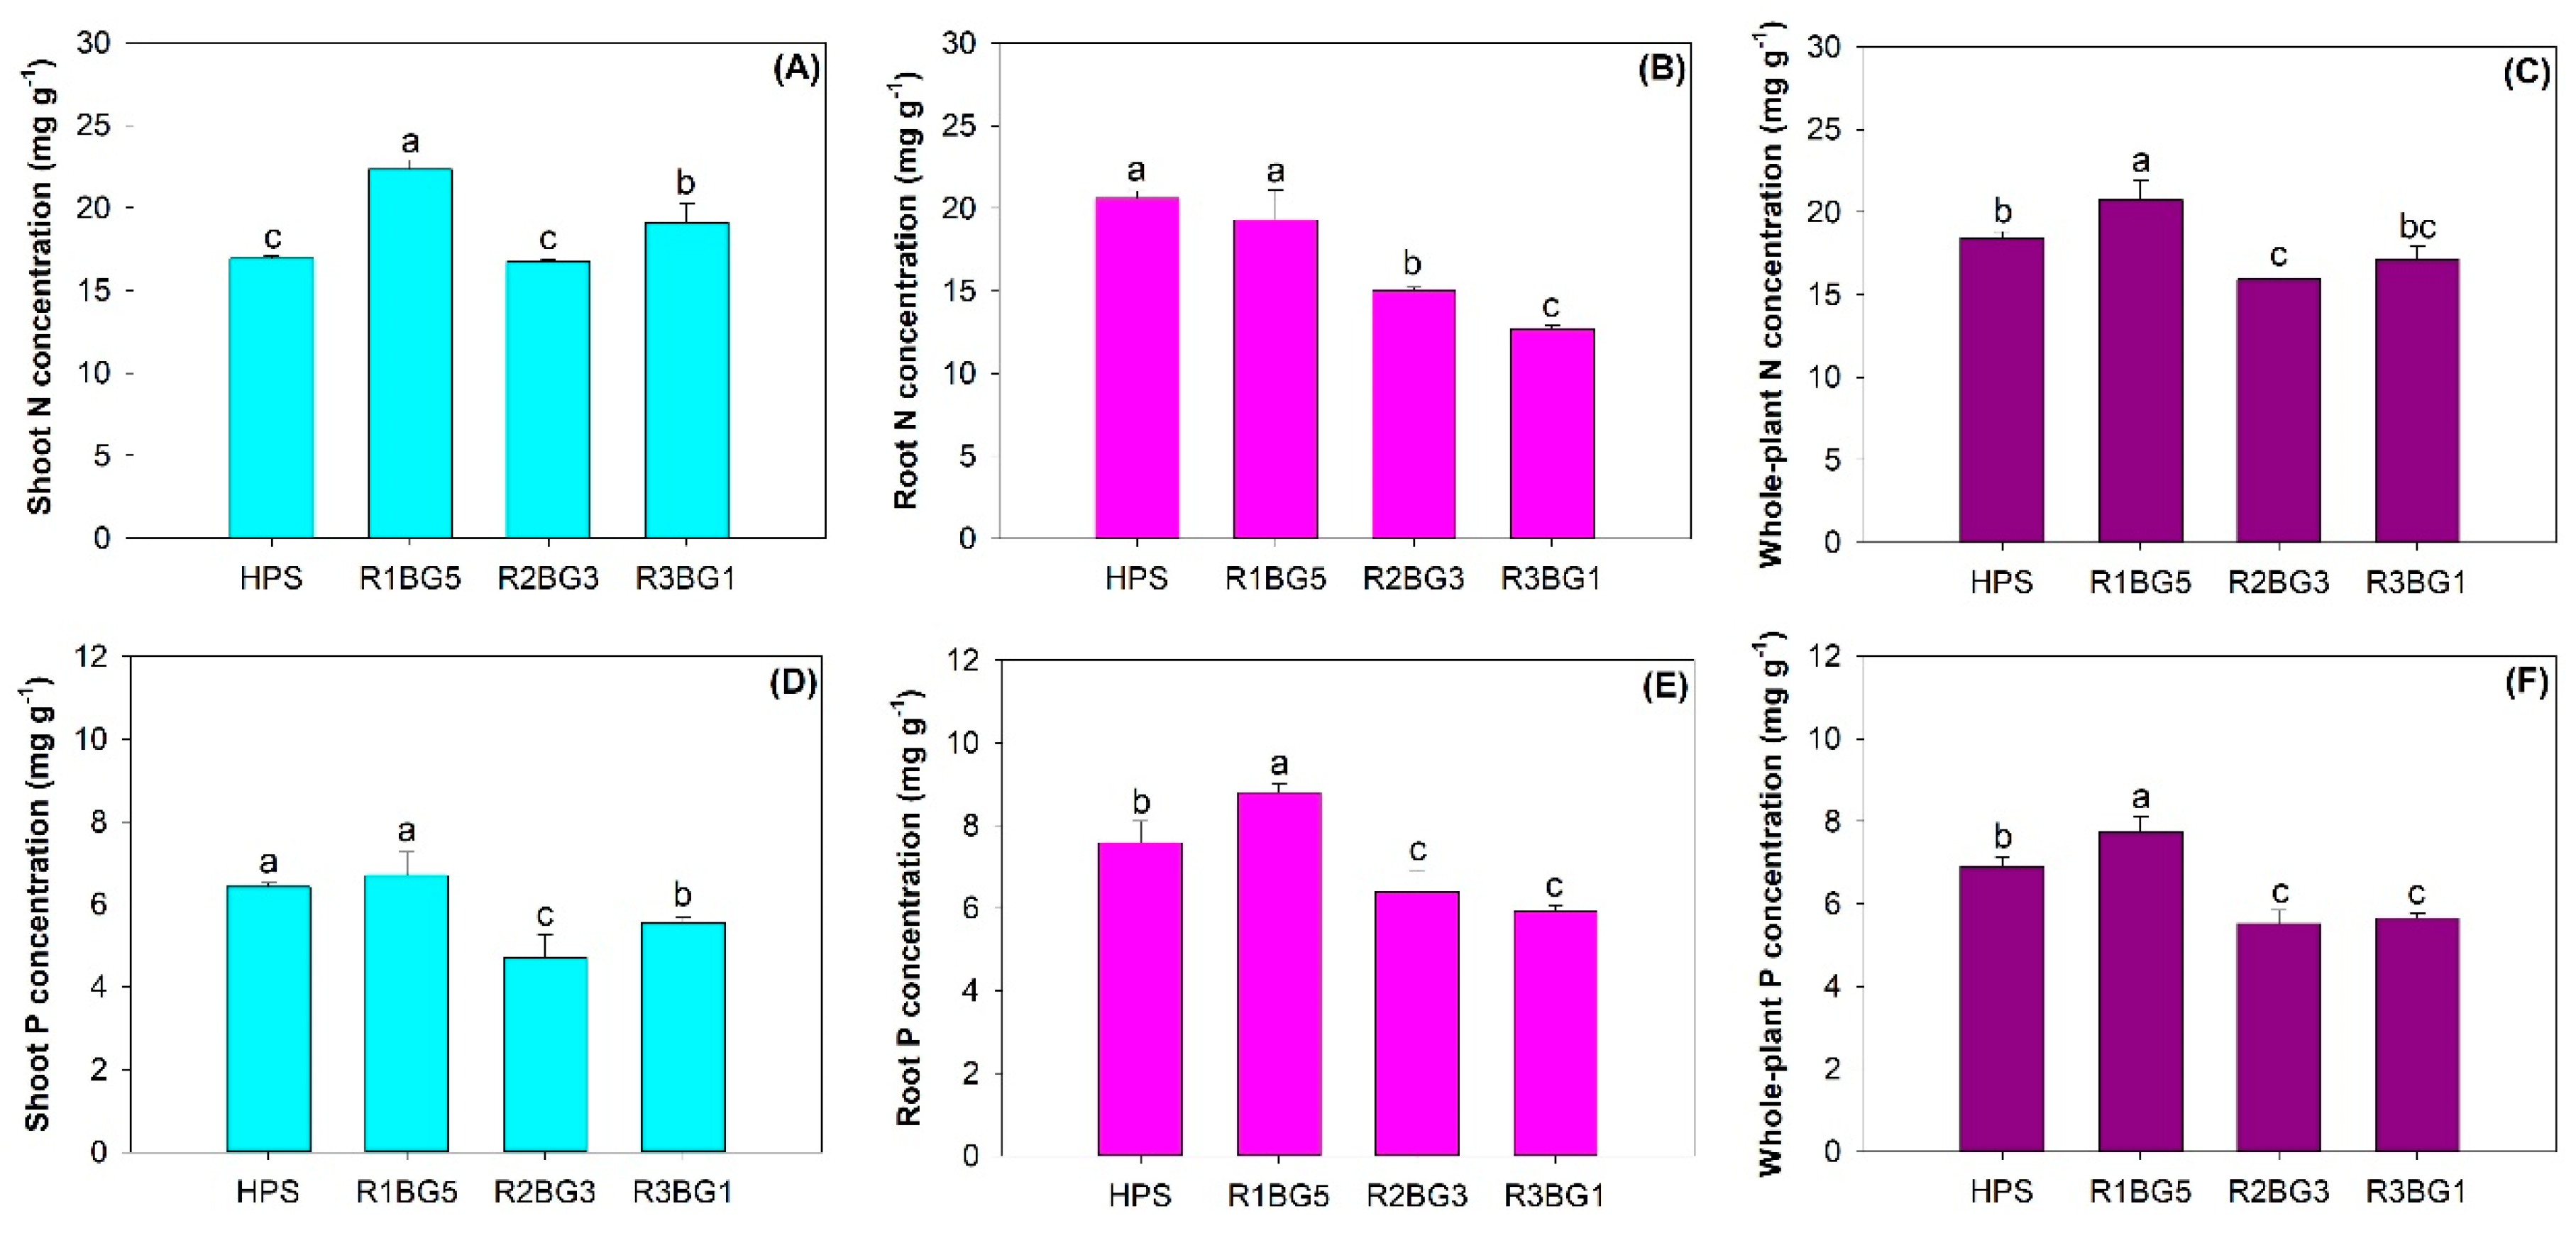
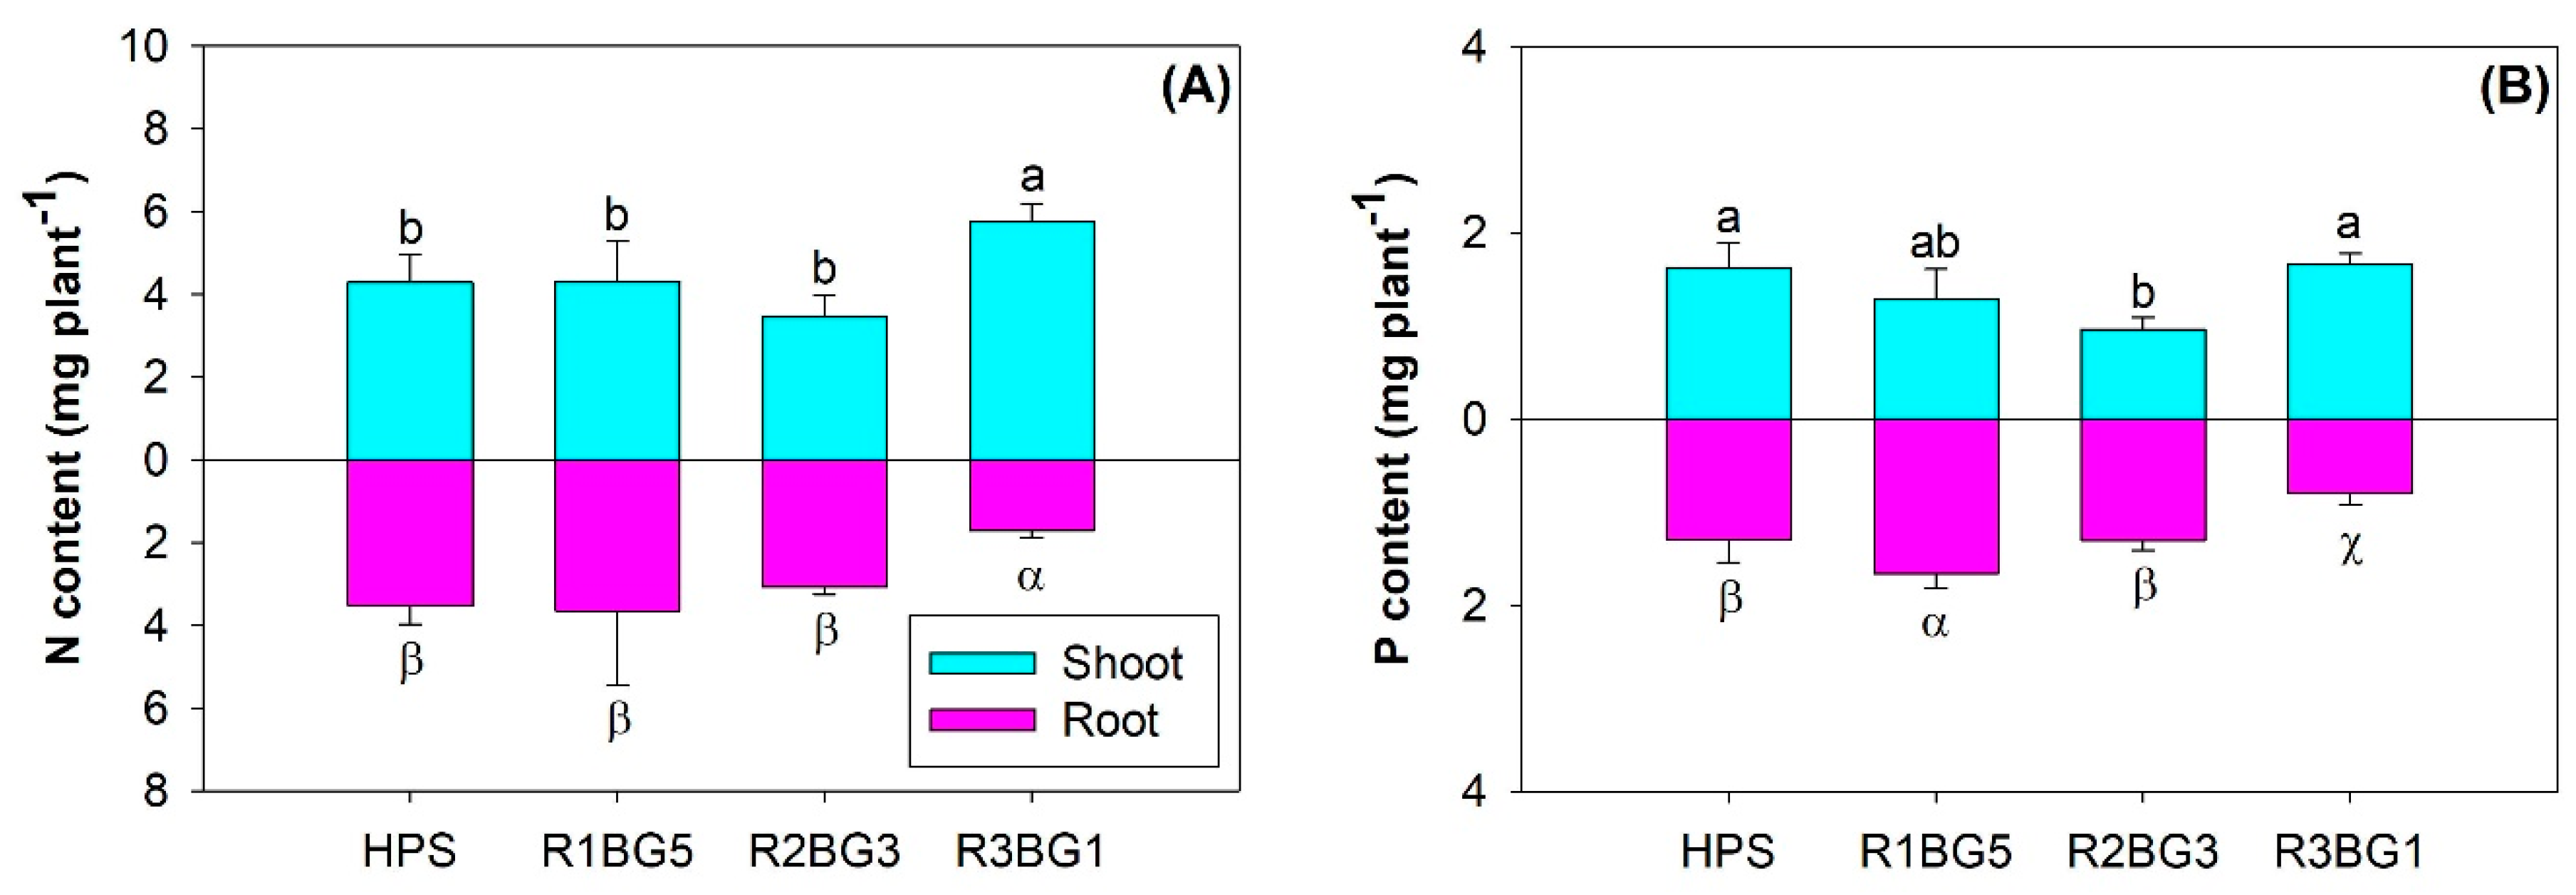
3.2. Nutrient Concentration and Content

Both N and P concentrations and nutrients were statistically different among spectra treatments in the shoot and root parts (Table 2). Compared to the control, the N concentration in seedling shoots in the R1BG5 and R3BG1 treatments was higher by 31.7% and 12.8%, respectively, while that in the R2BG3 and HPS treatments rarely had a significant difference (Figure 5A). The root N concentration was lower in the R2BG3 and R3BG1 treatments by 27.1% and 41.0%, respectively, relative to the control (Figure 5B). Overall, with HPS lighting as the control, the whole-plant N concentration was higher in the R1BG5 treatment by 12.7% but lower by 13.6% in the R2BG3 treatment (Figure 5C).
The shoot P concentration was lower in the R2BG3 and R3BG1 treatments than the control by 26.7% and 13.8%, respectively (Figure 5D). Compared to the control, the root P concentration was higher in the R1BG5 treatment by 15.8%, but lower in the R2BG3 and R3BG1 treatments by 15.9% and 21.9%, respectively (Figure 5E). At the whole-plant scale, the P concentration was also higher in the R1BG5 treatment than the control and lower in R2BG3 and R3BG1 treatments (Figure 5F).
The shoot N content was higher in the R3BG1 treatment than the control by 34.0% (Figure 6A). In contrast, the root N content was lower by 51.5% in this treatment compared to the control (Figure 6A). The shoot P content was lower in the R2BG3 treatment compared to the control by 40.8% (Figure 6B). Compared to the control, the root P content was higher in the R1BG5 treatment by 28.3%, but was decreased in the R3BG1 treatment by 38.5% (Figure 6B).

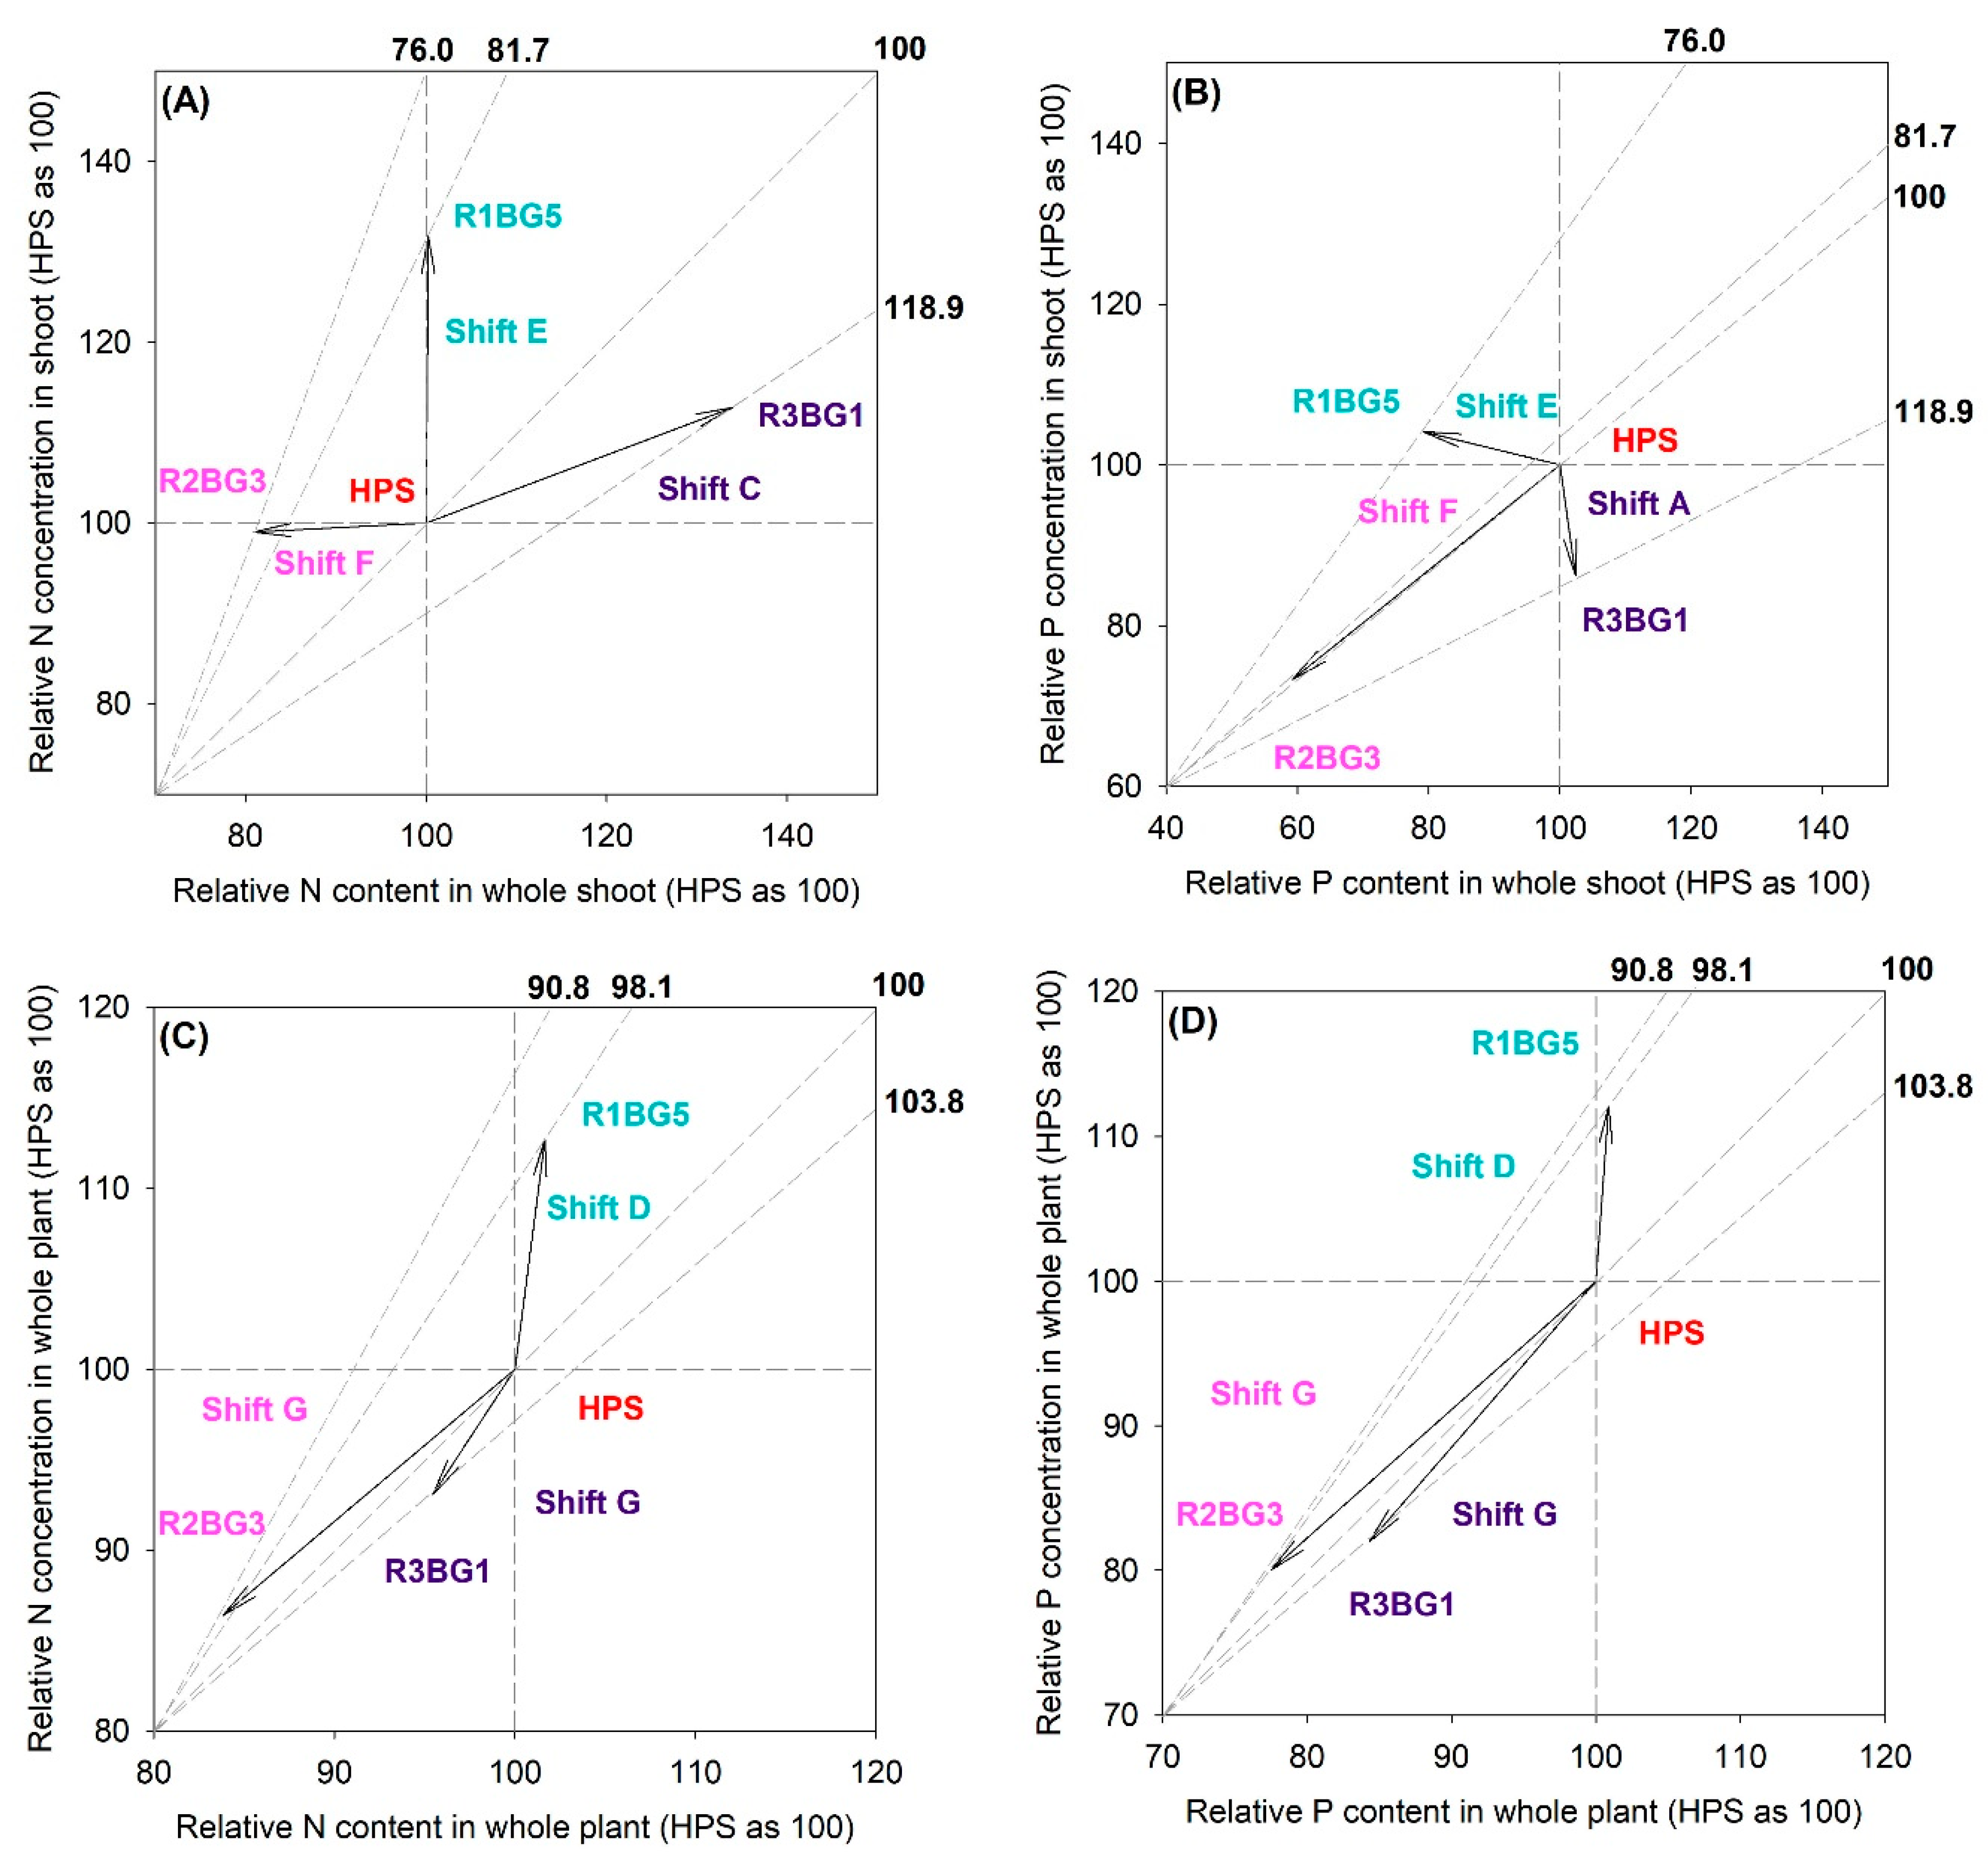
3.3. Vector Analysis on Nutritional Status

With the control as the reference, the R3BG1 treatment resulted in relative increases in biomass, N content, and N concentration in the shoots (Figure 7A). These symptoms were evaluated to be due to a relative N deficiency in the HPS lighting, which was countered by the R3BG1 treatment (Shift C). Because the biomass was relative, it decreased in the R1BG5 and R2BG3 treatments relative to the control, and the N status in shoots of seedlings in these two treatments were evaluated to be excessive (Shifts E and F), no matter whether N concentration was increased or not (Figure 7A).
Relative to the HPS control reference, the R3BG1 treatment resulted in relative increases of both the biomass and P content in the shoots, but a decline of the P concentration (Figure 7B). These symptoms together contributed to the generation of nutrient dilution in the seedlings of the R3BG1 treatment (Shift A). Again, the shoot biomass was decreased in both R1BG5 and R3BG3 treatments relative to the control, and the P status in these two treatments were evaluated to be excessive (Shifts E and F) (Figure 7B).
Because the whole-plant biomass was not statistically different among treatments (F = 2.22; p = 0.1168), both increases of nutrient content and concentration in the R1BG5 treatment resulted in the steady state uptake (Shift D) for both N and P (Figure 7C,D). In addition, with the unchanged whole-plant biomass in the R2BG3 and R3BG1 treatments, both decreases of nutrient content and concentration resulted in a depletion-triggered retranslocation (Shift G) for both N and P (Figure 7C,D).

3.4. Physiological Responses

Although none of the three LED lighting treatments had a significant effect on the chlorophyll a content in Korean pine seedlings relative to the control, the R2BG3 treatment had higher contents of chlorophyll b and a+b (Table 3). The R2BG3 treatment also had a higher protein content than the control. Instead, activities of both GS and AP enzymes were higher in the R1BG5 treatment than in the control.

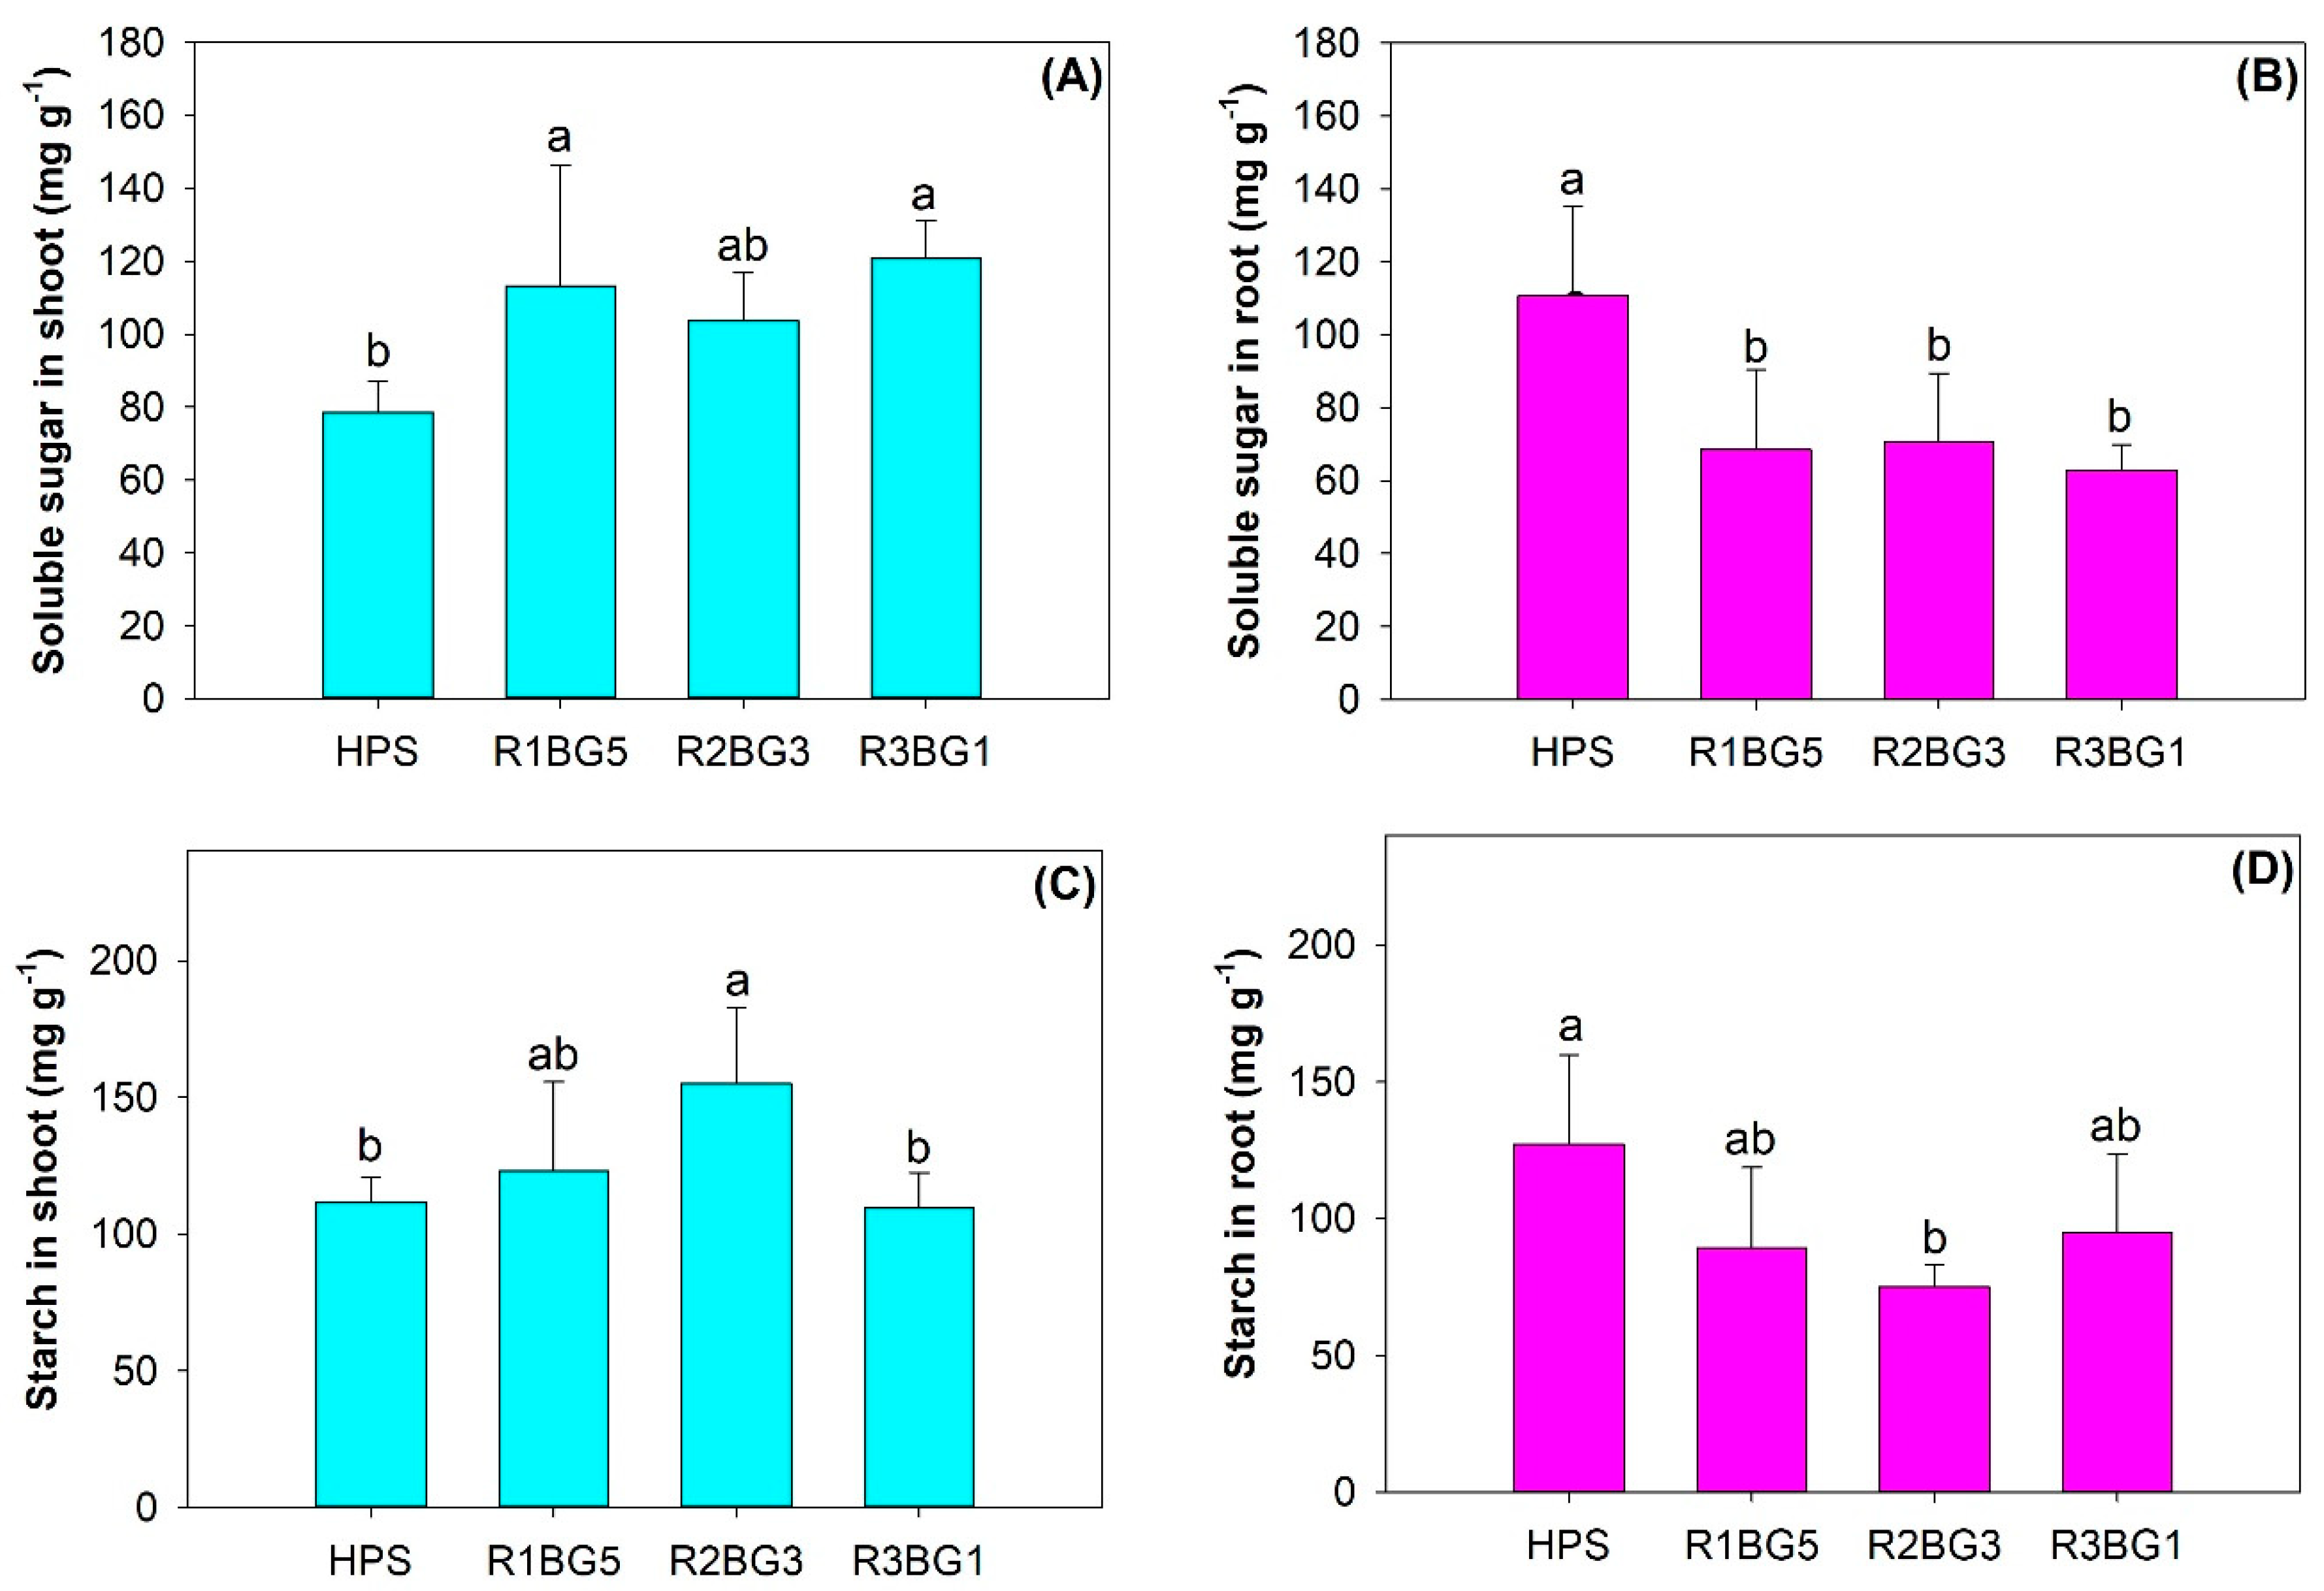
3.5. Carbohydrate Metabolism

The R1BG5 and R3BG1 treatments resulted in higher concentrations of soluble sugar than the control by 44.1% and 53.7%, respectively, in the shoots of Korean pine seedlings (Figure 8A). However, the soluble sugar concentration in the roots was lower in all LED spectra treatments compared to the control (Figure 8B). Among LED spectra, only the R2BG3 treatment resulted in a higher starch concentration in the shoot relative to the control (Figure 8C). This treatment was also the only one that had a lower root starch concentration compared to the control (Figure 8D).

4. Discussion

With the aim of revealing the mechanisms for improving the quality of Korean pine seedlings due to exposure to a range of spectra, we quantified the parameters of growth, dry mass, carbohydrates, foliar physiology, and relevant enzyme activity. All these parameters, plus a seedling quality assessment and sturdiness index, showed significant responses to different lighting spectra to varied extents.

4.1. Growth, Biomass, and Seedling Quality

It was interesting to find that seedlings under the HPS lighting had a longer stem height than those exposed to LED lighting. These results disagree with not only our first hypothesis, but also previous findings on Dalbergia odorifera T. Chen seedlings [9] and Douglas-fir (Pseudotsuga menziesii [Mirb.] Franco) seedlings from an Idaho source [18]. However, our seedlings’ height growth concurred with findings on Norway spruce (Picea abies [L.] H. Karst.) and Scots pine (Pinus sylvestris L.) seedlings [7]. The effect of the HPS spectrum in continuous lighting on shoot elongation resulted in the promotion of height growth in slow-growing species, such as Buddhist pine (Podocarpus macrophyllus [Thunb.] D. Don) [17] and Japanese maple (Acer palmatum Thunb.) [26]. As a slow grower, Korean pine seedlings joined the group that was apt to be promoted by HPS lighting for stem elongation.
The taller stem height in seedlings under the HPS lighting was accompanied by lower RCD compared to the R2BG3 treatment. In other studies, the RCD response to spectra between the HPS and LED lighting treatments was found to depend on the combination of lighting with extra factors [9,18]. For example, with the HPS lighting as the reference, the combination with chitosan oligosaccharide (CO) addition resulted in an RCD increase in Dalbergia odorifera T. Chen seedlings [9]; and the combination between the spectra and latitudinal source resulted in a greater RCD in Engelmann spruce (Picea engelmanniii Parry ex Engelm.) seedlings under LED lighting [18]. Smirnakou et al. reported that the RCD was increased in Quercus ithaburensis subsp. macrolepis Kotschy seedlings under LED lighting compared to those under fluorescent lamps [13]. It was interesting to find that the combined effects of LED lighting between the spectra and extra factors mainly resulted from the high-G spectra [9,18], but other results in this study and the one of Smirnakou et al. were generated using high-G spectra [13]. However, current evidence is still insufficient to make a conclusion that G-light spectra benefited the RCD growth.
The LED lighting in the R3BG1 spectrum resulted in a lower stem height and RCD, but a greater shoot biomass. Therefore, seedlings in this treatment had long and heavy needles, but short and thin stems. Results from the Scots pine seedlings showed that the proportion of biomass in needles to the whole plant can also be increased using an LED lighting spectrum compared to the HPS spectrum [7]. When supplied with CO, D. odorifera seedlings were found to show a greater leaf biomass in LED lighting than in HPS lighting as well [9]. Horticultural studies also revealed that some specific LED lighting spectra can result in the enlargement of leaves [27,28]. The promotion of needle biomass appeared to be a common response to LED lighting for coniferous seedlings. Furthermore, we found that the shoot biomass in Korean pine seedlings increased with the proportion of R light in the LED spectrum. A high-R spectrum from the LED lights was also reported to promote shoot biomass in Larix principis-rupperchtii Mayr. seedlings [10]. Although we did not find a different root/shoot (R/S) ratio between the HPS and LED spectra, our results showed that R/S tended to decline with the increased R-light proportion. In one study conducted by Li et al., R/S also failed to vary between the HPS and LED spectra [9]. Instead, Zhao et al. found that R/S was only lowered in the high-R LED spectrum and not the low-R one [10]. The above results together suggest that, with the increase of R-light proportion in the LED spectra, more biomass tended to be allocated to the shoot in Korean pine seedlings, which did not coincide with stem growth but supported needle biomass accumulation instead.
Both the DQI and SI parameters have been used to evaluate the seedling quality in response to the treatment of artificial lighting [7,9,11,20]. It was found that the transplant performance of tree seedlings was highly correlated to the DQI, which had an opposite relationship with SI [29]. In our study, seedlings in the HPS spectrum had the lowest DQI but the highest SI, which indicated their lower seedling quality than those grown in LED lighting. Therefore, although Korean pine seedlings exposed to HPS lighting were taller than the others, their diameter was not strong enough to support the elongated stem. Li et al. reported that the DQI in LED-treated seedlings was not statistically different from that in the HPS-treated seedlings unless combined with the treatment of CO addition [9]. In contrast, the SI in Norway spruce and Scots pine seedlings was higher in the LED treatment than the HPS treatment [7,11]. Further work is needed to detect the correlates between the quality indices and transplant performance.

4.2. Nutrient Uptake and Allocation

With the increase of R-light proportion in visible lights, the effect of LED spectra on the shoot N reserve relative to the HPS spectrum gradually changed from N depletion to the alleviation of N deficiency, which resulted from the associated increase of the shoot biomass accumulation. However, at the whole-plant scale, the increase of R-light proportion in the LED spectra relative to the HPS spectrum gradually resulted in a shift from steady-state nutrient loading to nutritional depletion that was caused by the decline of the N concentration. Therefore, LED lighting did not overcome HPS lighting in terms of reserving N in the shoot part until the R light in the spectra shifted from a low proportion to a higher proportion. The root N concentration showed a decline with the increase of the R-light proportion in the LED spectra. This decline of the N concentration along the R-light-proportion gradient, plus the decline of the root biomass, together resulted in the decline of the root N content. Regarding the dual declines in both chlorophyll a and GS activity in the needles of seedlings exposed to the R3BG1 spectrum, the high-R spectrum appeared to promote shoot biomass accumulation by consuming foliage N without an additional enhancement for N uptake. In contrast to our results, the high-R spectrum resulted in the increase of N concentration in the roots of Larix principis-rupperchtii Mayr. seedlings in the enriched fertility condition [10]. In the medium to low fertility conditions, no significant response regarding root N concentration in Larix principis-rupperchtii Mayr. seedlings can be found in for the contrasting LED spectra treatments. Perhaps the dose of 140 mg N seedling−1 that we used for Korean pine seedlings was not high enough to supplement the N consumption by the shoot growth in the high R-light spectrum. Hence, the high-R spectrum can benefit N allocation to the shoot part, but the low-R spectrum would cause a steady-state N uptake relative to the HPS lighting spectrum at the whole-plant scale.
Relative to the HPS lighting spectrum, the low-R spectra from LED lighting failed to induce sufficient biomass accumulation in shoots to load P allocation, but the high-R spectrum stimulated the biomass accumulation without sufficient P concentration in the shoots. The root P concentration declined with the increase of R-light proportion in the LED lighting spectra. As a result, compared to the HPS lighting spectrum, only the low-R spectrum could induce the steady-state uptake of P relative to the HPS spectrum. A decline of P concentration in the shoots of Korean pine seedlings in the high-R LED spectrum was also found in the stem of Larix principis-rupperchtii Mayr. seedlings [10]. More studies agreed with our results that the shoot P concentration in tree seedlings tended to be diluted when exposed to the spectrum, which can promote shoot biomass accumulation [9,17,20]. Again, the low-R spectrum from the R1BG5 treatment can best favor P uptake at the whole-plant scale in Korean pine seedlings.

4.3. Physiology and Carbohydrates

We found that chlorophyll b content in the R2BG3 LED-spectrum was higher than that in the HPS spectrum, which concurs with results from Douglas fir seedlings from a New Mexico source [18]. According to Apostol et al., the higher content of chlorophyll was related to a higher photosynthesis [18]. In our study, seedlings in the R2BG3 spectrum were found to have a higher starch content in the shoots than in the HPS spectrum. In addition, our results also showed a higher content of chlorophyll a in the R2BG3 spectrum than in the R3BG1 spectrum. However, one study on larch seedlings did not find any difference in chlorophyll a content between LED spectra [10]. Another study on Quercus ithaburensis subsp. macrolepis Kotschy seedlings also revealed a very limited difference in chlorophyll content among LED spectra [13]. In contrast, the study on Tung tree (Vernicia fordii [Hemsl.] Airy Shaw) found that the involvement of both R and B lights in the spectrum of LED lighting can increase chlorophyll a content [12]. Perhaps it was the higher proportion of B light in the R2BG3 spectrum than in the R3BG1 spectrum that resulted in the higher content of chlorophyll a. More studies are needed for conclusive explanations.
In our study, foliage protein content was found to be higher in the low-R spectrum, which agrees with Zhao et al. [10]. The R2BG3 treatment had the highest level of protein content, but also had the lowest level of N concentration among three LED spectra treatments. Regarding the general rule of the negative relationship between protein and nitrate contents [30], the spectrum from the R2BG3 treatment appeared to weakly utilize protein for N assimilation. Astolfi et al. found that tree seedlings had a highly species-specific response in protein content to light quality [31]. Therein, European beech (Fagus sylvatica L.) seedlings showed a significant decline in protein content due to the LED spectrum than in the controlled fluorescent spectrum. Authors argued that protein was consumed for the generation of rubisco in beech leaves. Future work is suggested to detect rubisco under different spectra to determine the mechanism of the negative relationship between protein and N concentration [31].
GS activity plays an important role during the process of N assimilation. The main function of GS in the chloroplast is to synthesize NH4+ into glutamine [32]. Elmlinger and Mohr revealed that the B light had the ability to increase GS activity [33]. Meya and Kowallik further indicated that the combination of B and R lights would contribute to a higher GS activity than just unique B light [34]. As nitrate has to accumulate in plants only after the conversion into NH4+ via nitrate reductase (NR), GS was also related to nitrate content because the GS activity had a positive relationship with the activity of NR [30]. Among the LED spectra, only the R1BG5 treatment resulted in a higher GS activity than the HPS spectrum. This treatment was also unique in that it resulted in a higher shoot N concentration. Therefore, the combination of R and B lights with a lower proportion of R light in the LED spectrum resulted in the highest N assimilation in shoots. This can also be responsible for the steady-state uptake of N at the whole-plant scale.
The spectrum from the R1BG5 treatment resulted in a higher AP activity than that from the HPS lighting. The R1BG5 treatment also induced a steady-state P uptake relative to the HPS spectrum. Hence, the AP activity had functioned by promoting the P uptake at some steady-state speed without significant change in the biomass in Korean pine seedlings. Horticultural studies have revealed that the AP activity increased in leaves when inorganic P availability was supplied to some over-medium levels [35]. Zhang et al. argued that the AP was excreted to release inorganic P from compounds in leaves and to regulate the redistribution of inorganic P across tissues to optimize the P utilization [36]. Further regulation of the low-R spectrum on AP activity is unclear based on the current literature. More work is needed to make clear the specific mechanisms.
It was found that B light tended to deplete starch concentration through promoting stomatal openings [37,38]. In contrast, the R light was unlikely cause the feedback of stomatal openings [37] but tended to inhibit the export of photosynthetic products [39]. Modal studies found that monochromic B light resulted in the depletion of starch and soluble sugars in leaves, while monochromic R light was prone to reserve foliar carbohydrates [40,41,42]. In our study, shoot starch concentrations showed a simple increase with the increase of the R-light proportion. Instead, the R2BG3 treatment was the only spectrum that resulted in a higher starch concentration in the shoots, but had a lower root starch concentration compared to the HPS lighting. These results mainly resulted from the inhibition of starch distribution to root.
Starch concentration in the shoots of seedlings exposed to the R3BG1 should have been higher than those to the R2BG3 because of the higher proportion of R light and low B light in the spectrum. Regarding the low GS activity in the R3BG1 spectrum, more ammonia could be accumulated, which promoted the breakdown of starch to supply the glucose for oxidative degradation [43,44]. A high concentration of soluble sugars in the R3BG1 spectrum resulted from P-dilution, which has been indicated using vector analysis. When exposed to the P-deficient condition, plants accumulated sugars in the leaves [35,45]. Because the soluble sugar concentration in the roots did not increase in the R3BG1 lighting compared with the HPS lighting, it was unlikely that sugars were distributed to the roots.

5. Conclusions

In this study, the spectrum from HPS lamps was chosen as the reference due to it being a practical but energy-costly approach of artificial lighting for the culture of Korean pine seedlings. Spectra from the LED lighting failed to induce tall seedlings with long stems. Instead, the LED treatments resulted in strong seedlings with a larger diameter, greater shoot biomass accumulation, and better evaluated quality. Among spectra from three LED regimes, although the R3BG1 treatment could counter the N deficiency in shoots compared to the HPS control, the R1BG5 treatment could induce a steady-state uptake of both N and P at the whole-plant scale. In addition, seedlings in the R1BG5 spectrum had a higher soluble sugar concentration and GS and AP activities. Therefore, the LED lighting in the R1BG5 spectrum can be recommended as the replacement for HPS lighting for the practical culture of Korean pine seedlings. However, the growing condition can be further improved with a higher temperature and better-designed LED panels. The out-planting performance of seedlings should also be tested in future works.

Author Contributions

Conceptualization, H.W. and X.H.; methodology, H.W.; software, H.W.; validation, H.W. and X.C.; formal analysis, X.C.; investigation, H.W.; resources, X.C.; data curation, X.C.; writing—original draft preparation, H.W.; writing—review and editing, R.J.H. and X.H.; project administration, X.H. and G.C.; funding acquisition, X.H. and G.C. All authors have read and agreed to the published version of the manuscript.

Funding

This research was funded by the Strategic Priority Research Program of the Chinese Academy of Sciences (grant number XDA23070503), the Regional Key Project in S&T Services Network Program of Chinese Academy of Sciences (grant number KFJ-STS-QYZD-044; KFJ-STS-ZDTP-048), the National Natural Science Foundation of China (grant number 41971122; 41861017; 31600496), the National Key Research and Development Program of China (grant number 2016YFC0500300), and the Funding for Jilin Environmental Science (grant number 2017-16).

Acknowledgments

Authors acknowledge Xiyang Zhao for supplying seedlings for this study. Feng Zhu (Zhilunpudao Agric. S&T Ltd., Changchun, China) is kindly acknowledged for his contributions to seedling transport and the iron shelf establishment. Peiyuan Chen (Zhiluntuowei A&F S&T, Ltd., Changchun, China) is also acknowledged for his contributions to the substrate manufacture and transport.

Conflicts of Interest

The authors declare no conflict of interest.

References

  1. Wang, F.; Liang, D.Y.; Pei, X.N.; Zhang, Q.H.; Zhang, P.; Zhang, J.Q.; Lu, Z.M.; Yang, Y.C.; Liu, G.F.; Zhao, X.Y. Study on the physiological indices of Pinus siberica and Pinus koraiensis seedlings under cold stress. J. Res. 2019, 30, 1255–1265. [Google Scholar] [CrossRef]
  2. Zhang, M.; Yan, Q.L.; Zhu, J.J. Optimum light transmittance for seed germination and early seedling recruitment of Pinus koraiensis: Implications for natural regeneration. iForest 2015, 8, 853–859. [Google Scholar] [CrossRef] [Green Version]
  3. Zhao, G.Y.; Yang, C.T. Discussion of introducing Pinus koraiensis to the Greater Xing’an Mountains. Sci. Technol. 1991, 27, 149–153. (In Chinese) [Google Scholar]
  4. Zhu, J.J. A review on fundamental studies of secondary forest management. J. Appl. Ecol. 2002, 13, 1689–1694. (In Chinese) [Google Scholar]
  5. State Forestry Administration of China. Tree Seedling Quality Grading of Major Species for Afforestation; GB 6000-1999; State Bureau of Quality Technical Supervision: Beijing, China, 1999; p. 193.
  6. Li, G.; Zhu, Y.; Li, Q.; Liu, Y.; Zou, S.; Huang, Y. Effect of seedling age on the seedling quality and field performance of Pinus koraiensis. Sci. Silvae Sin. 2012, 48, 35–41, (In Chinese with English Abstract). [Google Scholar]
  7. Riikonen, J.; Kettunen, N.; Gritsevich, M.; Hakala, T.; Sarkka, L.; Tahvonen, R. Growth and development of Norway spruce and Scots pine seedlings under different light spectra. Environ. Exp. Bot. 2016, 121, 112–120. [Google Scholar] [CrossRef]
  8. Alakarppa, E.; Taulavuori, E.; Valledor, L.; Marttila, T.; Jokipii-Lukkari, S.; Karppinen, K.; Nguyen, N.; Taulavuori, K.; Haggman, H. Early growth of Scots pine seedlings is affected by seed origin and light quality. J. Plant Physiol. 2019, 237, 120–128. [Google Scholar] [CrossRef]
  9. Li, X.W.; Chen, Q.X.; Lei, H.Q.; Wang, J.W.; Yang, S.; Wei, H.X. Nutrient uptake and utilization by Fragrant rosewood (Dalbergia odorifera) seedlings cultured with oligosaccharide addition under different lighting spectra. Forests 2018, 9, 29. [Google Scholar] [CrossRef] [Green Version]
  10. Zhao, J.; Chen, X.; Wei, H.X.; Lv, J.; Chen, C.; Liu, X.Y.; Wen, Q.; Jia, L.M. Nutrient uptake and utilization in Prince Rupprecht’s larch (Larix principis-rupprechtii Mayr.) seedlings exposed to a combination of light-emitting diode spectra and exponential fertilization. Soil Sci. Plant Nutr. 2019, 65, 358–368. [Google Scholar] [CrossRef]
  11. Riikonen, J. Pre-cultivation of Scots pine and Norway spruce transplant seedlings under four different light spectra did not affect their field performance. New For. 2016, 47, 607–619. [Google Scholar] [CrossRef]
  12. Gu, Y.Y.; Zhang, F.H.; Zeng, Y.L.; Zhang, L.; Tan, X.F.; Cao, H.P.; Li, Z. Physiological responses of Tung Tree (Vernicia fordii) saplings to different red, white and blue light-emitting diodes. Int. J. Agric. Biol. 2019, 22, 569–577. [Google Scholar]
  13. Smirnakou, S.; Ouzounis, T.; Radoglou, K.M. Continuous spectrum LEDs promote seedling quality traits and performance of Quercus ithaburensis var. macrolepis. Front. Plant Sci. 2017, 8, 16. [Google Scholar] [CrossRef] [Green Version]
  14. Velasco, M.H.; Mattsson, A. Light quality and intensity of light-emitting diodes during pre-cultivation of Picea abies (L.) Karst. and Pinus sylvestris L. Seedlings—Impact on growth performance, seedling quality and energy consumption. Scand. J. For. Res. 2019, 34, 159–177. [Google Scholar] [CrossRef] [Green Version]
  15. Sun, Y.R.; Zhu, J.J.; Sun, O.J.; Yan, Q.L. Photosynthetic and growth responses of Pinus koraiensis seedlings to canopy openness: Implications for the restoration of mixed-broadleaved Korean pine forests. Environ. Exp. Bot. 2016, 129, 118–126. [Google Scholar] [CrossRef]
  16. Zhang, M.; Zhu, J.; Yan, Q. Seed germination of Pinus koraiensis Siebold & Zucc. in response to light regimes caused by shading and seed positions. For. Syst. 2012, 21, 426–438. [Google Scholar]
  17. Wei, H.X.; Ren, J.; Zhou, J.H. Effect of exponential fertilization on growth and nutritional status in Buddhist pine (Podocarpus macrophyllus Thunb. D. Don) seedlings cultured in natural and prolonged photoperiods. Soil Sci. Plant Nutr. 2013, 59, 933–941. [Google Scholar] [CrossRef] [Green Version]
  18. Apostol, K.G.; Dumroese, R.K.; Pinto, J.R.; Davis, A.S. Response of conifer species from three latitudinal populations to light spectra generated by light-emitting diodes and high-pressure sodium lamps. Can. J. For. Res. 2015, 45, 1711–1719. [Google Scholar] [CrossRef]
  19. Wei, H.X.; Xu, C.Y.; Hawkins, B.J.; Ma, L.Y.; Jiang, L.N. Organic amendment and inorganic fertilization affect soil properties and quality of Larix olgensis bareroot stock. New For. 2012, 43, 155–168. [Google Scholar] [CrossRef]
  20. Li, X.W.; Gao, Y.; Wei, H.X.; Xia, H.T.; Chen, Q.X. Growth, biomass accumulation and foliar nutrient status in fragrant rosewood (Dalbergia odorifera TC Chen) seedlings cultured with conventional and exponential fertilizations under different photoperiod regimes. Soil Sci. Plant Nutr. 2017, 63, 153–162. [Google Scholar] [CrossRef] [Green Version]
  21. Timmer, V.R.; Armstrong, G. Growth and nutrition of containerized Pinus resinosa at exponentially increasing nutrient additions. Can. J. For. Res. 1987, 17, 644–647. [Google Scholar] [CrossRef]
  22. Wallin, E.; Grans, D.; Jacobs, D.F.; Lindstrom, A.; Verhoef, N. Short-day photoperiods affect expression of genes related to dormancy and freezing tolerance in Norway spruce seedlings. Ann. For. Sci. 2017, 74, 14. [Google Scholar] [CrossRef] [Green Version]
  23. Wei, H.X.; Zhao, H.T.; Chen, X. Foliar N:P stoichiometry in Aralia elata distributed on different slope degrees. Not. Bot. Hort. Agrobo. Cluj-Napoca 2019, 47, 887–895. [Google Scholar] [CrossRef] [Green Version]
  24. Dickson, A.; Leaf, A.L.; Hosner, J.F. Quality appraisal of white spruce and white pine seedling stock in nurseries. For. Chron. 1960, 36, 10–13. [Google Scholar] [CrossRef]
  25. Salifu, K.F.; Timmer, V.R. Optimizing nitrogen loading of Picea mariana seedlings during nursery culture. Can. J. For. Res. 2003, 33, 1287–1294. [Google Scholar] [CrossRef]
  26. Zhu, K.Y.; Liu, H.C.; Wei, H.X.; Zhou, J.H.; Zou, Q.C.; Ma, G.Y.; Zhang, J.Q. Prediction of nutrient leaching from culture of containerized Buddhist pine and Japanese maple seedlings exposed to extended photoperiod. Int. J. Agric. Biol. 2016, 18, 425–434. [Google Scholar] [CrossRef]
  27. Kim, H.H.; Goins, G.D.; Wheeler, R.M.; Sager, J.C. Green-light supplementation for enhanced lettuce growth under red- and blue-light-emitting diodes. Hortscience 2004, 39, 1617–1622. [Google Scholar] [CrossRef] [Green Version]
  28. Johkan, M.; Shoji, K.; Goto, F.; Hashida, S.; Yoshihara, T. Blue light-emitting diode light irradiation of seedlings improves seedling quality and growth after transplanting in red leaf lettuce. Hortscience 2010, 45, 1809–1814. [Google Scholar] [CrossRef] [Green Version]
  29. Bayala, J.; Dianda, M.; Wilson, J.; Ouedraogo, S.J.; Sanon, K. Predicting field performance of five irrigated tree species using seedling quality assessment in Burkina Faso, West Africa. New Fors. 2009, 38, 309–322. [Google Scholar] [CrossRef] [Green Version]
  30. Bian, Z.H.; Cheng, R.F.; Wang, Y.; Yang, Q.C.; Lu, C.G. Effect of green light on nitrate reduction and edible quality of hydroponically grown lettuce (Lactuca sativa L.) under short-term continuous light from red and blue light-emitting diodes. Environ. Exp. Bot. 2018, 153, 63–71. [Google Scholar] [CrossRef] [Green Version]
  31. Astolfi, S.; Marianello, C.; Grego, S.; Bellarosa, R. Preliminary investigation of LED lighting as growth light for seedlings from different tree species in growth chambers. Not. Bot. Hort. Agrobo. Cluj-Napoca 2012, 40, 31–38. [Google Scholar] [CrossRef] [Green Version]
  32. Zhang, T.; Shi, Y.Y.; Piao, F.Z.; Sun, Z.Q. Effects of different LED sources on the growth and nitrogen metabolism of lettuce. Plant Cell Tissue Organ Cult. 2018, 134, 231–240. [Google Scholar] [CrossRef]
  33. Elmlinger, M.W.; Mohr, H. Glutamine synthetase in Scots pine seedlings and its control by blue light and light absorbed by phytochrome. Planta 1992, 188, 396–402. [Google Scholar] [CrossRef] [PubMed]
  34. Meya, G.; Kowallik, W. Blue and red light-dependent alterations in the ratio of two forms of glutamine synthetase in Chlorella kessleri. Plant Biol. 1995, 108, 247–254. [Google Scholar]
  35. Naureen, Z.; Sham, A.; Al Ashram, H.; Gilani, S.A.; Al Gheilani, S.; Mabood, F.; Hussain, J.; Al Harrasi, A.; AbuQamar, S.F. Effect of phosphate nutrition on growth, physiology and phosphate transporter expression of cucumber seedlings. Plant Physiol. Biochem. 2018, 127, 211–222. [Google Scholar] [CrossRef] [PubMed]
  36. Zhang, X.M.; Hong, K.; Yi, Y. Effect of short-term phosphate starvation on acid phosphatase activity of Carpinus pubescens and Eurycorymbus cavalerei. Russ. J. Plant Physiol. 2015, 62, 57–64. [Google Scholar] [CrossRef]
  37. Lasceve, G.; Leymarie, J.; Vavasseur, A. Alterations in light-induced stomatal opening in a starch-deficient mutant of Arabidopsis thaliana L deficient in chloroplast phosphoglucomutase activity. Plant Cell Environ. 1997, 20, 350–358. [Google Scholar] [CrossRef] [Green Version]
  38. Olsen, R.L.; Pratt, R.B.; Gump, P.; Kemper, A.; Tallman, G. Red light activates a chloroplast-dependent ion uptake mechanism for stomatal opening under reduced CO2 concentrations in Vicia spp. New Phytol. 2002, 153, 497–508. [Google Scholar] [CrossRef] [Green Version]
  39. Saebo, A.; Krekling, T.; Appelgren, M. Light quality affects photosynthesis and leaf anatomy of birch plantlets in vitro. Plant Cell Tissue Organ Cult. 1995, 41, 177–185. [Google Scholar] [CrossRef]
  40. Chen, X.L.; Wang, L.C.; Li, T.; Yang, Q.C.; Guo, W.Z. Sugar accumulation and growth of lettuce exposed to different lighting modes of red and blue LED light. Sci. Rep. 2019, 9, 10. [Google Scholar] [CrossRef] [Green Version]
  41. Li, H.M.; Tang, C.M.; Xu, Z.G. Effects of different light quality on growth, photosynthetic characteristic and chloroplast ultrastructure of upland cotton (Gossypium hirsutum L.) seedlings. Emir. J. Food Agric. 2017, 29, 104–113. [Google Scholar] [CrossRef] [Green Version]
  42. Li, C.; Liu, D.; Li, L.L.; Hu, S.X.; Xu, Z.G.; Tang, C.M. Effects of light-emitting diodes on the growth of peanut plants. Agron. J. 2018, 110, 2369–2377. [Google Scholar] [CrossRef]
  43. Miyachi, S.; Miyachi, S. Ammonia induces starch degradation in Chlorella cells. Plant Cell Physiol. 1985, 26, 245–252. [Google Scholar]
  44. Miyachi, S.; Miyachi, S. Some biochemical changes related to starch breakdown induced by blue light illumination and by addition of ammonia to chlorella cells. Plant Cell Physiol. 1987, 28, 309–314. [Google Scholar]
  45. Hammond, J.P.; White, P.J. Sucrose transport in the phloem: Integrating root responses to phosphorus starvation. J. Exp. Bot. 2008, 59, 93–109. [Google Scholar] [CrossRef] [PubMed]
Figure 1. Layout of the culture of Korean pine (Pinus koraiensis) seedlings under three light-emitting diode (LED) spectra. HPS—high-pressure sodium (lamps); R1BG5—electric current for red and combined green and blue LEDs were controlled to be 10% and 50%, respectively; R2BG3—electric current was controlled to be 20% (red) and 30% (green and blue); R3BG1—electric current was controlled to be 30% (red) and 10% (green and blue).
Forests 11 00044 g001
Figure 2. Spectral distribution of lights (350–800 nm) under the four light treatments, measured using a portable optical meter (EverFine PLA-20, Yuanfang Elect. S&T Inc., Hangzhou, China). HPS—high-pressure sodium lamps; R1BG5—electric current for red and combined green and blue LEDs were controlled to be 10% and 50%, respectively; R2BG3—electric current was controlled to be 20% (red) and 30% (green and blue); R3BG1—electric current was controlled to be 30% (red) and 10% (green and blue).
Forests 11 00044 g002
Figure 3. Layout of seedling sampling process and the composition of replicated parameters. RCD: root-collar diameter.
Forests 11 00044 g003
Figure 4. Growth (A,B), biomass (C,D), and quality assessment (E,F) for Korean pine (Pinus koraiensis) seedlings under three LED-spectra treatments (R1BG5, R2BG3, and R3BG1) with a high-pressure sodium (HPS) spectrum as the control. Different letters indicate a significant difference according to Tukey’s test at the 0.05 level. DQI—Dickson quality index.
Forests 11 00044 g004
Figure 5. Nitrogen (N) (top) and phosphorus (P) (bottom) concentrations in shoots (left), roots (middle), and the whole plant (right) of Korean pine (Pinus koraiensis) seedlings under three LED-spectra treatments (R1BG5, R2BG3, and R3BG1) with the HPS spectrum as the control. Different letters indicate significant difference according to Tukey’s test at the 0.05 level. Subfigures AC present N concentration in shoot, root, and whole-plant, respectively. Subfigures DF present P concentration in shoot, root, and whole-plant, respectively.
Forests 11 00044 g005
Figure 6. Nitrogen (left) and P (right) contents in the shoots and roots of Korean pine (Pinus koraiensis) seedlings under three LED-spectra treatments (R1BG5, R2BG3, and R3BG1) with the HPS spectrum as the control. Different letters indicate a significant difference according to Tukey’s test at the 0.05 level. Letters of a and b are labels for shoots; symbols of α, β, and χ are labels for roots. Subfigures A and B present N and P contents, respectively.
Forests 11 00044 g006
Figure 7. Vector analysis on N (left) and P (right) statuses in shoots (top) and whole plants (bottom) of Korean pine (Pinus koraiensis) seedlings under three LED-spectra treatments (R1BG5, R2BG3, and R3BG1) with the HPS spectrum as the reference. Shift A—nutrient dilution, Shift C—nutrient deficiency, Shift D—steady-state accumulation, Shift E—toxic excess, Shift F—antagonistic excess, Shift G—nutrient depletion. Interpretations were adapted from Salifu and Timmer [25]. Subfigures A and B present vector analysis on N and P statuses in shoot, respectively. Subfigures C and D present vector analysis on N and P statuses in whole-plant, respectively.
Forests 11 00044 g007
Figure 8. Concentrations of soluble sugars (top) and starch (bottom) in the shoots (left) and roots (right) of Korean pine (Pinus koraiensis) seedlings under three LED-spectra treatments (R1BG5, R2BG3, and R3BG1) with the HPS spectrum as the control. Different letters indicate significant difference according to Tukey’s test at the 0.05 level. Subfigure A and B present soluble sugar concentration in shoot and root, respectively. Subfigure C and D present starch concentration in shoot and root, respectively.
Forests 11 00044 g008
Table 1. Lighting conditions (≈45 cm beneath the lighting source) from high pressure sodium (HPS) lamps and the three types of light-emitting diodes (LEDs) for the culture of Korean pine (Pinus koraiensis) seedlings.
Light SourcePPFD 1 (μmol m−2 s−1)Intensity (Lx)Red (%)Green (%)Blue (%)
HPS73.61 2219343.954.71.5
R1BG5 369.18267813.9779.2
R2BG3 477.12239226.270.23.5
R3BG1 573.99249942.357.30.4
Note: 1 PPFD—photosynthetic photon flux rate; 2 All values are the average of nine spots (EverFine PLA-20, Yuanfang Elect. S&T Inc., Hangzhou, China) that were evenly distributed in the area covering all seedlings; 3 R1BG5—electric current for red and combined green and blue LEDs were controlled to be 10% and 50%, respectively; 4 R2BG3—electric current was controlled to be 20% (red) and 30% (green and blue); 5 R3BG1—electric current was controlled to be 30% (red) and 10% (green and blue).
Table 2. ANOVA on nitrogen and phosphorus concentrations and contents in Korean pine (Pinus koraiensis) seedlings exposed to four regimes of artificial lighting spectra.
OrgansNutrient ConcentrationNutrient Content
F ValuePr > FF valuePr > F
Nitrogen
Shoot77.01<0.00019.940.0003
Root76.90<0.000117.49<0.0001
Whole-plant39.71<0.00013.070.0512
Phosphorus
Shoot24.78<0.000110.900.0002
Root51.44<0.000122.40<0.0001
Whole-plant69.56<0.000110.040.0003
Table 3. Physiological responses of the contents of chlorophyll and soluble protein and activities of glutamine synthetase (GS) and acid phosphatase (AP) in the needles of Korean pine (Pinus koraiensis) seedlings exposed to four regimes of artificial lighting spectra.
ParameterHPS 1R1BG5 2R2BG3 3R3BG1 4F ValuePr > F
Chlorophyll a
(mg g−1 FW)
1.00 ± 0.13ab1.06 ± 0.20ab1.09 ± 0.04a0.84 ± 0.08b3.720.0283
Chlorophyll b
(mg g−1 FW)
0.96 ± 0.19b1.25 ± 0.30ab1.43 ± 0.13a1.25 ± 0.13ab4.680.0124
Chlorophyll a+b
(mg g−1 FW)
1.97 ± 0.24b2.31 ± 0.40ab2.52 ± 0.10a2.09 ± 0.17ab4.680.0124
Soluble protein
(mg g−1 FW)
0.61 ± 0.11b0.67 ± 0.08ab0.91 ± 0.20a0.57 ± 0.15b5.550.0061
GS5 activity
(A540nm mg−1 protein h−1)
4.31 ± 1.61b7.52 ± 1.62a5.20 ± 1.62ab4.79 ± 1.21b4.360.0162
AP6 activity
(μgNPP g−1 FW min−1)
2.12 ± 0.57b3.24 ± 0.70a2.46 ± 0.59ab2.64 ± 0.40ab3.310.0409
Note: 1 HPS—high-pressure lamps; 2 R1BG5—electric current for red and combined green and blue LEDs were controlled to be 10% and 50%, respectively; 3 R2BG3—electric current was controlled to be 20% (red) and 30% (green and blue); 4 R3BG1—electric current was controlled to be 30% (red) and 10% (green and blue); 5 GS—glutamine synthetase; 6 AP—acid phosphatase.

