Article

Differentiation of Environmental Conditions Promotes Variation of Two Quercus wutaishanica Community Assembly Patterns

1
College of Grassland and Environment Sciences, Xinjiang Agricultural University, Ürümqi 830052, China
2
School of Life Sciences, Northwest University, Xi’an 710069, China
*
Author to whom correspondence should be addressed.
These authors should be deemed as first co-authors.
Forests 2020, 11(1), 43; https://doi.org/10.3390/f11010043
Submission received: 29 October 2019 / Revised: 20 December 2019 / Accepted: 24 December 2019 / Published: 27 December 2019
(This article belongs to the Section Forest Ecology and Management)

Abstract

:
Two contradictory niche-based processes, environmental filtering and competitive exclusion, are important ecological processes in community assembly. Quercus wutaishanica forests are the climax communities in the Qinling Mountains and the Loess Plateau, China. Since these areas are characterized by different climate and evolutionary histories, these forests could be a suitable study system to test the phylogenetic niche conservatism hypothesis. We compared variation in community assembly of two distinct Q. wutaishanica forest communities and analyzed how the variations are formed. Quercus wutaishanica forest communities had significantly different species pool, phylogenetic structure and phylogenetic diversity between the two regions that were driven by inconsistency in environment conditions and evolutionary history at the local scale. Soil ammonium nitrogen, soil water content, and nitrate nitrogen play a major role in phylogenetic beta diversity patterns. The effect of environmental filtering on community assembly was more significant on the Loess Plateau than in the Qinling Mountains. Our study also found that local environment is important in mediating the patterns of phylogenetic structure. These findings provide insights into the mechanisms of local community assembly.

1. Introduction

Community assembly has been one of the central topics in plant community ecology for decades. There are two main theories to explain the process of assembly. Niche-based theory predicts that assembly of plant communities is mostly a deterministic process and that the patterns of species coexistence may be affected by environmental filtering (referring to abiotic factors that prevent the establishment or persistence of species at a particular location) or competitive exclusion (referring to interaction of species within community) [1,2]. Alternatively, neutral theory suggests that stochastic processes act on assembly [3] and the structure and composition of a community are mainly constrained by probabilistic dispersal, ecological drift, or historical inertia [4]. Although several researchers have considered that both neutral and deterministic processes may shape community assembly patterns [5,6,7], the deterministic process was regarded as a main process during assembly [8], particularly in temperate regions [9].
Limiting similarity and environmental filtering are two contrary niche-based mechanisms that occur simultaneously along various environmental axes during deterministic assembly, even within a single community, that influence community structure [1,2,10]. In general, limiting similarity is expected to exclude similar coexisting species, whereas environmental filtering tends to select similar species from coexisting species [11].
Since environment, succession, and evolutionary history may influence the assembly process, phylogeny has been used as a proxy to explore evolutionary history because of its close relationship to species taxonomy and differentiation [12,13,14]. Phylogeny is a reflection of species evolutionary history on structure of the community [15,16], and it can help reveal the multitude of processes driving community assembly in various habitats [17]. For instance, abiotic and biotic filters can lead to phylogenetic clustering by constraining species establishment via selection on their phylogenetic patterns [18], whereas limiting similarity would lead to phylogenetic overdispersion. Shortly after the first studies on community phylogenetic structure [15,19], Cavender-Bares et al. [20] explained that the interpretation of community phylogenetic patterns were strongly dependent on the presence or absence of phylogenetic niche conservatism. According to this assumption, community structure based on phylogeny provides a powerful tool to explore the relative importance of community assembly processes [5,6,7,21].
Quantification of communities with alpha and beta diversity provides information on the biodiversity pattern [22,23]. Also, an alternative insight on biodiversity such as phylogenetic diversity can substantially improve our understanding of the mechanisms of biodiversity [15,24,25,26]. Thus, the comparison of changes in plant and phylogenetic diversity among species within communities is an effective way to determine which processes drive community assembly.
Here, we hypothesize that in the drier and harsher conditions on the Loess Plateau, the species co-occurring within the Quercus wutaishanica forest will be more phylogenetically related than those co-occurring within the Q. wutaishanica forest in the wetter and milder conditions of the Qinling Mountains. Because of climate differences between the Qinling Mountains (temperate and moist) and the Loess Plateau (warm and semi-arid), the two Q. wutaishanica forest communities differ significantly in species composition and regional species pools [27]. For example, only about 4.6% of the species are found in both two types of Q. wutaishanica forests [28]. Therefore, although the two types of climax forest communities share the same dominant species, they may have a different evolutionary history. Thus, these communities could provide suitable study systems to test the phylogenetic niche conservatism hypothesis [29]. In the present study, we assess the phylogenetic structure and phylogenetic diversity between the two types of Q. wutaishanica forest in the Qinling Mountains and on the Loess Plateau. Our primary aims were to: (1) compare the variation in community assembly of the two distinct Q. wutaishanica forest communities and analyze how these variations are formed; and (2) test whether the deterministic process is the main process during assembly in the temperate region and if an adverse climate may result in increased clustering of phylogenetic structure.

2. Materials and Methods
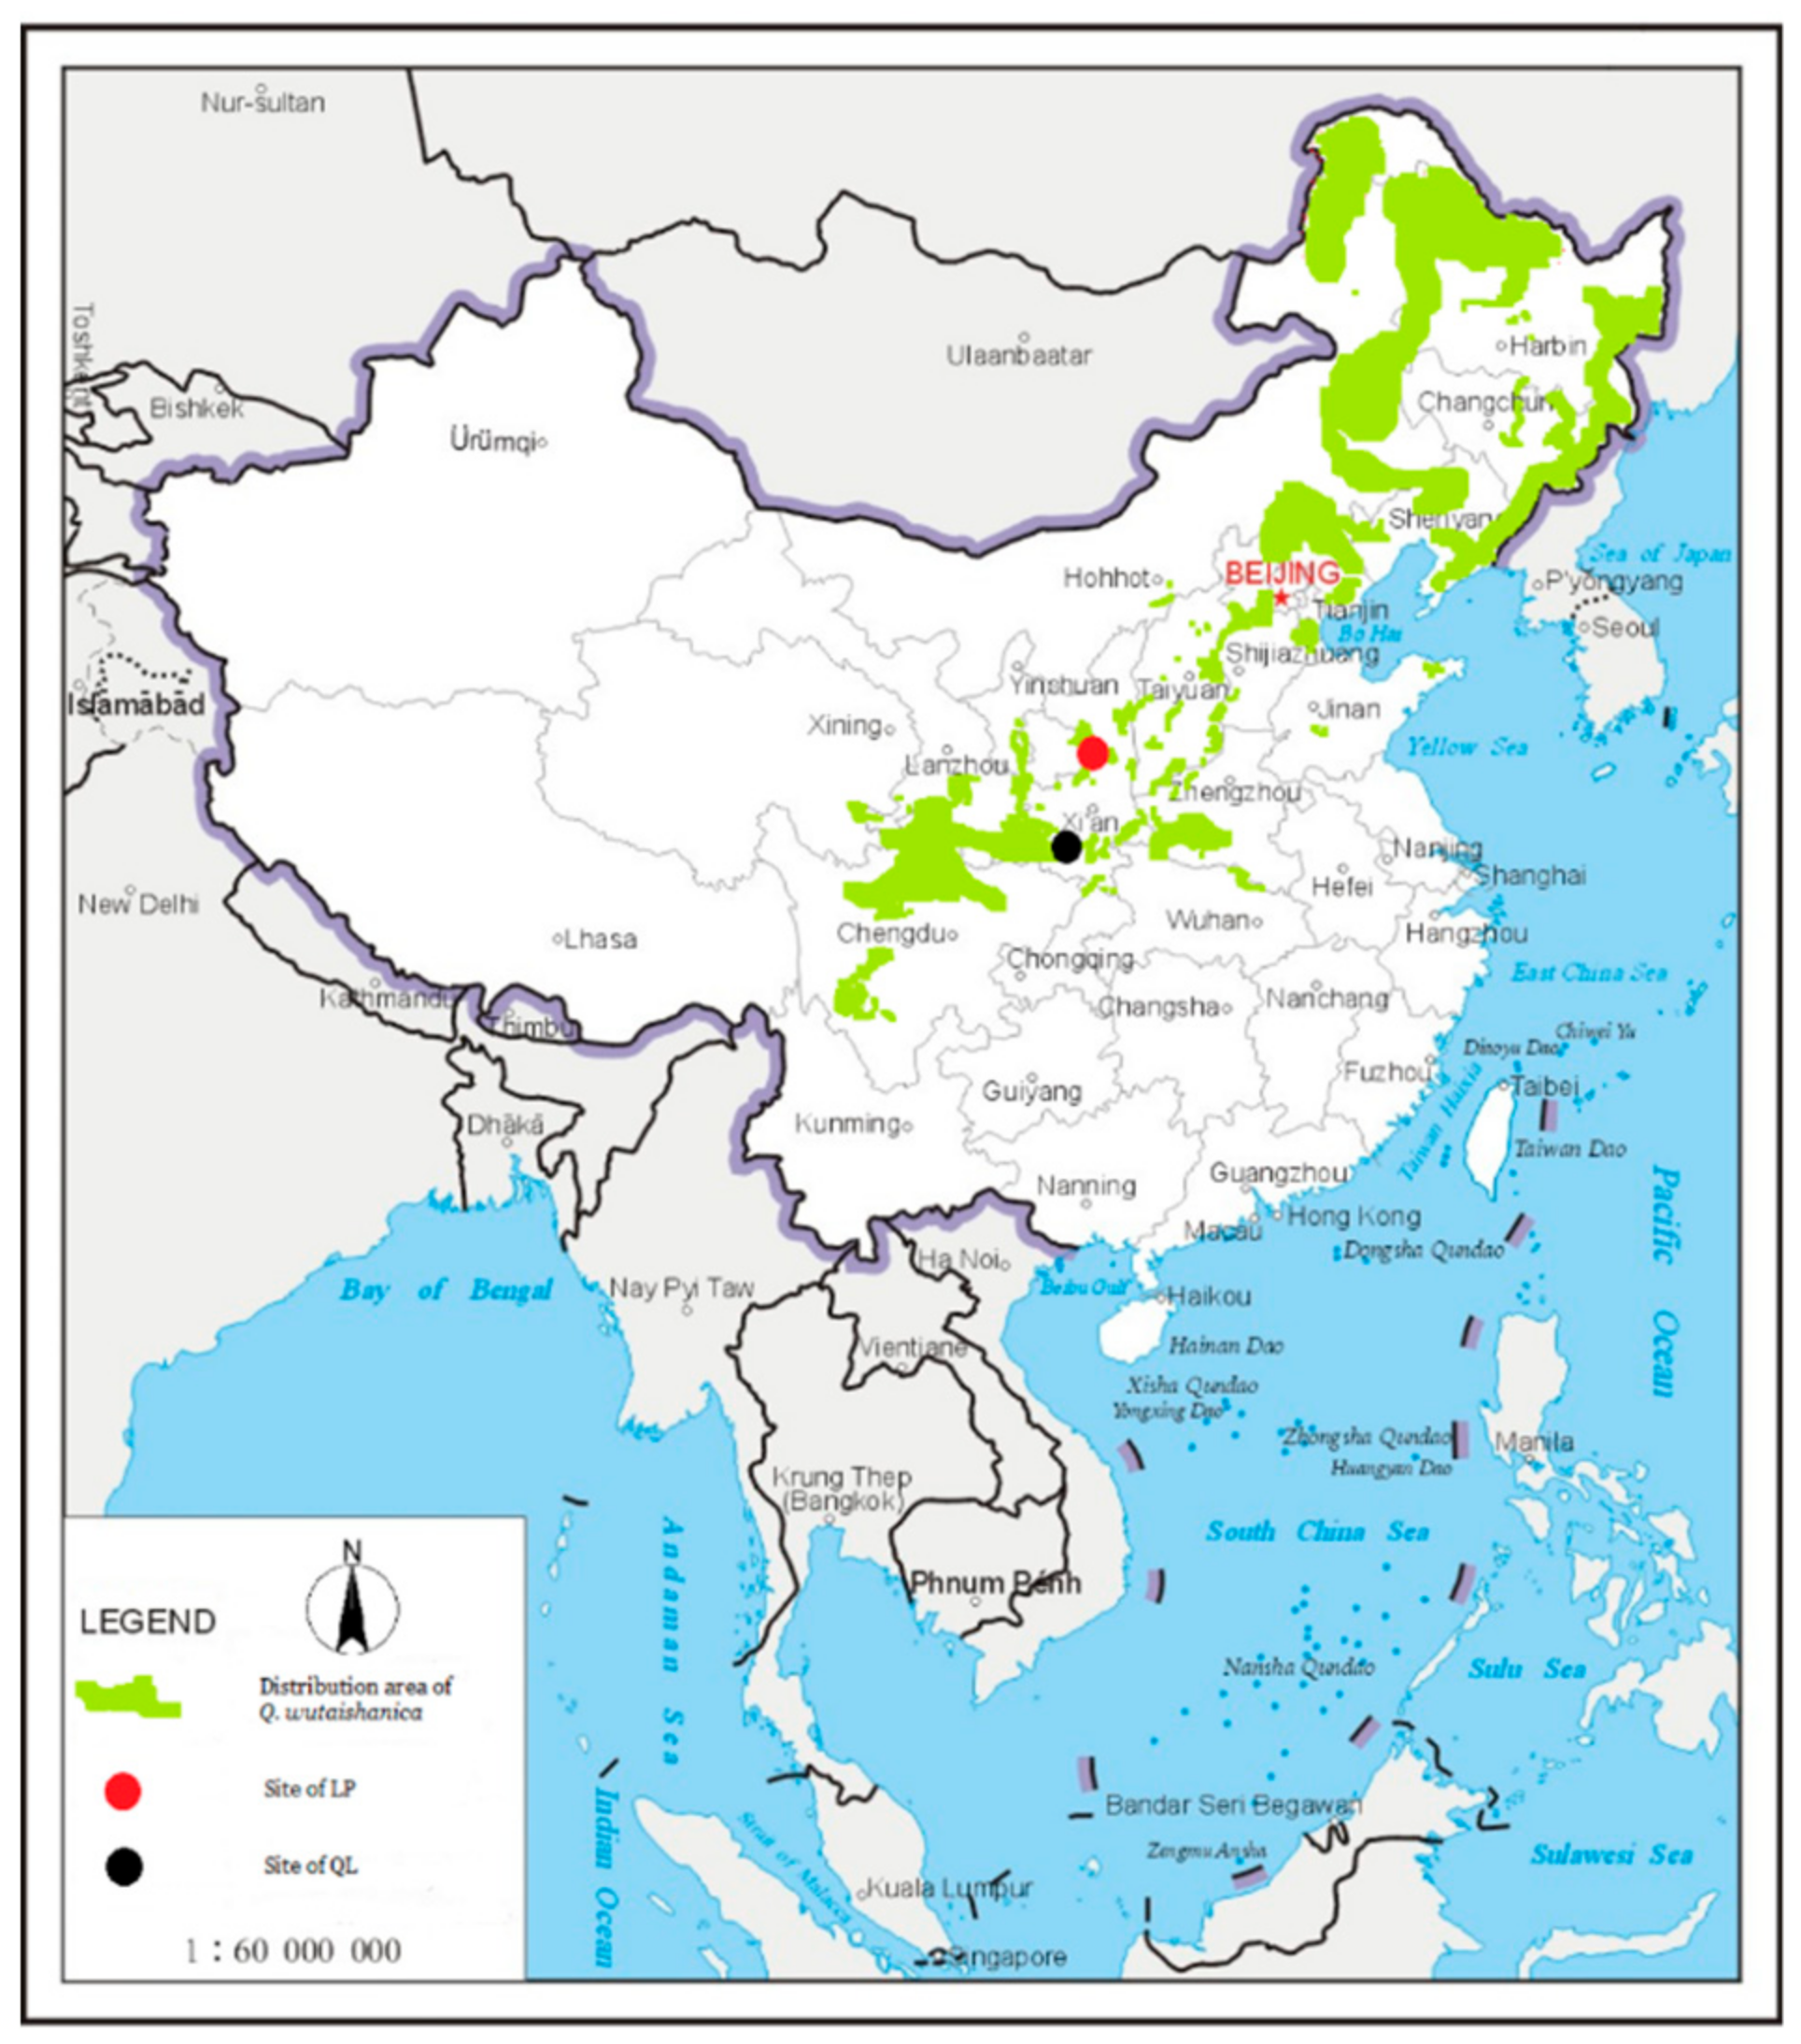
2.1. Study Site

Q. wutaishanica is a dominant tree species in deciduous broad-leaved forests of northern China, and the forest communities dominated by Q. wutaishanica are climax vegetation occupying the upper limit of deciduous broad-leaved forests in the Qinling Mountains (QL) and the northwestern limit (related to water availability and effective accumulated temperature) of forests on the Loess Plateau (LP).
The study was performed in the Ziwuling region (35°41′–35°44′ N, 109°00′–109°02′ E) on the Loess Plateau and the Niubeiliang Nature Reserve (33°84′–33°86′ N, 108°82′–108°87′ E) in the Qinling Mountains, China (Figure 1). The Ziwuling region is characterized by a semi-arid temperate continental monsoon climate, with generally frequent heavy rainfall events in summer. At Ziwuling, the mean annual precipitation is 550 mm, and the mean annual temperature is 9.3 °C. The minimum temperature is −28.5 °C, and there are about 150 frost days. The soils are generally alkalescent loessal soils. Q. wutaishanica forests on the Loess Plateau are generally distributed between 1000 m to 1600 m a.s.l. In the Niubeiliang Nature Reserve, the mean annual precipitation is 900 mm, and the mean annual temperature is 6.5 °C. The absolute minimum temperature is −19 °C, and there are 112 frost days. Soils are slightly acid yellow brown soils. Q. wutaishanica forests in the Qinling Mountains are generally situated between 1800 m and 2200 m [30].

2.2. Floristic Surveys

The vegetation was surveyed in July 2014. Twenty plots (10 × 10 m) in typical Q. wutaishanica forests were established at 1100 m in Ziwuling region while 20 plots (10 × 10 m) were established at 2000 m in Niubeiliang Nature Reserve. For each region, we established transects along the contour line (1100 m in the Ziwuling region and 2000 m in the Niubeiliang Nature Reserve). The plots were set along the transect, and the distance between plots was 50 m. Location of each plot were recorded. Three replications of soil samples from each plot were obtained along the diagonal line of plots. The soil samples were taken from the layer 10–20 cm below the soil surface, since characters of this soil layer were relatively consistent. The soil samples were weighed for soil fresh weight and then air-dried and weighed again for soil dry weight. Soil water content (SWC), soil pH, ammonia nitrogen (AN), nitrate nitrogen (NN), and rapidly available phosphorus (RAP) were measured. Soil pH was measured using an acidometer (PB-100, Sartorius Inc., Göttingen, Germany), and AN, NN, and RAP were measured using a chemical analyzer (Cleverchem 200+, DeChem-Tech GmbH, Hamburg, Germany) and a spectrophotometric method. We documented these environmental factors at the same time for each region. Only woody plants (trees and shrubs) were included in vegetation sampling. All woody species (for tree species, diameter at breast height (DBH) > 10 cm; for shrub species, basal diameter > 1 cm) were identified within each plot and their abundance, coverage, and height were measured.

2.3. Construction of Phylogenetic Tree

Prior to phylogenetic analysis, a super phylogenetic tree was constructed. Although the distance between the two regions is only about 200 km, there is a very large difference in species composition between the Niubeiliang Nature Reserve and the Ziwuling region [28]. In other words, the Q. wutaishanica forests in the two places are not likely to share a common species pool. According to studies in the Ziwuling region and the Niubeiliang Nature Reserve [31,32], we established the species pools by lists of the species present in Q. wutaishanica forests in the Qinling Mountains and on the Loess Plateau. Two phylogenetic trees were constructed for the two areas of Q. wutaishanica forests plots using the informatics tool Phylomatic [33] (available at http://www.phylodiversity.net). Phylomatic utilizes the Angiosperm Phylogeny Group III consensus tree (R20120829) as a backbone to add species from the regional pool based on their taxonomy. We used the BLADJ (a built-in branch length calculation algorithm in Phylocom) algorithm to add the evolutionary branch length based on the node date estimated by Wikström et al. [34]. The BLADJ algorithm was run using the Phylocom 3.0 program (designed by Webb, Ackerly & Kembel) [35].

2.4. Community Phylogenetic Structure

We calculated the net relatedness index (NRI) and nearest taxon index (NTI) to quantify the phylogenetic relatedness among species in each plot [19]. NRI indicates the standardized effect size of the mean phylogenetic distance (MPD). The NTI indicates the mean nearest phylogenetic neighbor among the individual species (mean nearest phylogenetic taxon distance, MNTD) in a community. Random communities as null model were constructed by drawing species from the super species pool for both areas [36]. The species pool used in these randomizations included all the species occurring in the study region. NRI and NTI are defined as follows:
NRI = 1 × MPD observed MPD randomized sdMPD randomized
NTI = 1 × MNTD observed MNTD randomized sdMNTD randomized
where MNTD/MPDobserved is the observed MNTD/MPD, MNTD/MPDrandomized is the expected MNTD/MPD of the randomized assemblages (n = 999), and sdMNTD/MPDrandomized is the standard deviation of the MNTD/MPD for the randomized assemblages. A positive NTI/NRI value indicates that MNTD/MPD is lower than that expected by chance and that phylogenetic clustering of species occurs, and that the assembly process is dominated by limiting similarity. Conversely, a negative NTI/NRI value indicates phylogenetic overdispersion (Webb 2000), and suggests limited similarity. These metrics were estimated with the COMSTRUCT algorithm implemented in Phylocom 3.0 [35]. For the analysis of differences in phylogenetic structures (NRI/NTI), an ANOVA was run.

2.5. Phylogenetic Diversity

We also used Faith’s phylogenetic diversity (PD) to quantify the phylogenetic alpha diversity of each plot [24,37]. For each pair of plots within distinct Q. wutaishanica forests, we calculated a phylogenetic distance which was considered to be a measurement of phylogenetic beta diversity. The phylogenetic beta diversity means the phylogenetic variation between two plots, which is similar to the species beta diversity measurement. Phylogenetic distances were estimated using the COMDIST algorithm implemented in Phylocom 3.0. Phylogenetic beta diversity was determined by linear regression against soil factors.

3. Results

3.1. Two Different Regional Species Pools

In total 125 woody species were recorded. In the Niubeiliang region (Qinling Mountains) we collected 730 individuals belonging to 107 species, and in the Ziwuling region (Loess Plateau) we collected 226 individuals belonging to 37 species (Table S1). We selected 413 woody species for species pools in the Qinling Mountains and 166 woody species for species pools in the Loess Plateau based on our study data. A total of 81 species were found in both regions.

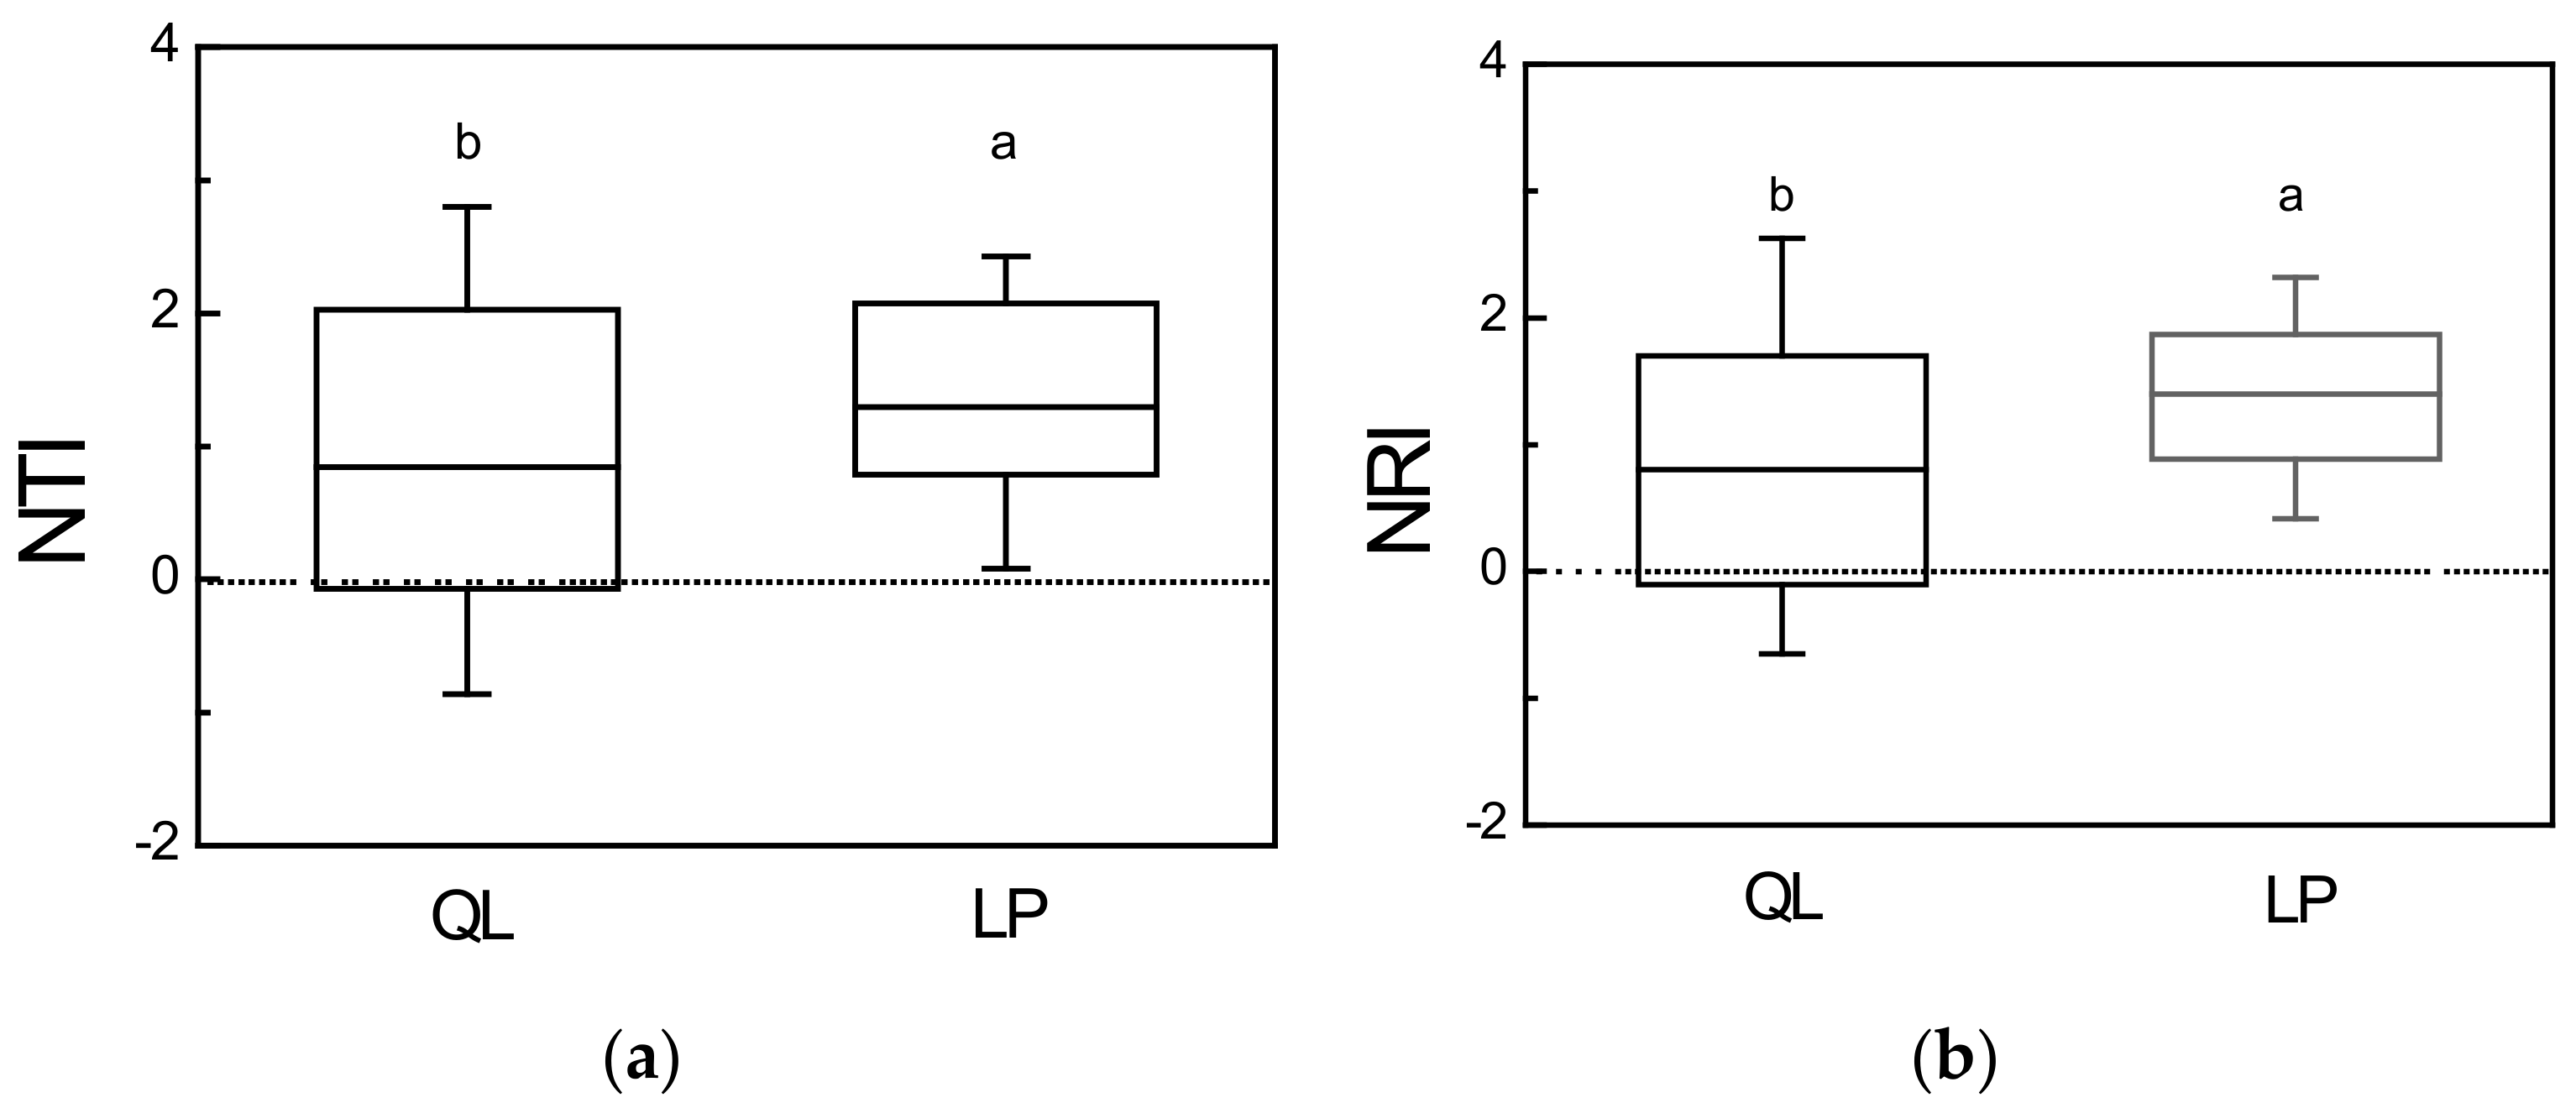
3.2. Phylogenetic Structure

Phylogenetic clustering of Q. wutaishanica forests was found in both the Qinling Mountains (p < 0.05) and the Loess Plateau (p < 0.05). The NRI and NTI results showed a similar pattern, although in the Qinling Mountains, NTI showed more non-random phylogenetic structures in plots than NRI (Figure 2). When phylogenetic structure values of Q. wutaishanica forests were compared, we found that the NRI and NTI of plots in the Qinling Mountains were significantly lower than those in the Loess Plateau. However, the range of values for NRI and NTI of the Qinling Mountains was wider than those for the Loess Plateau.

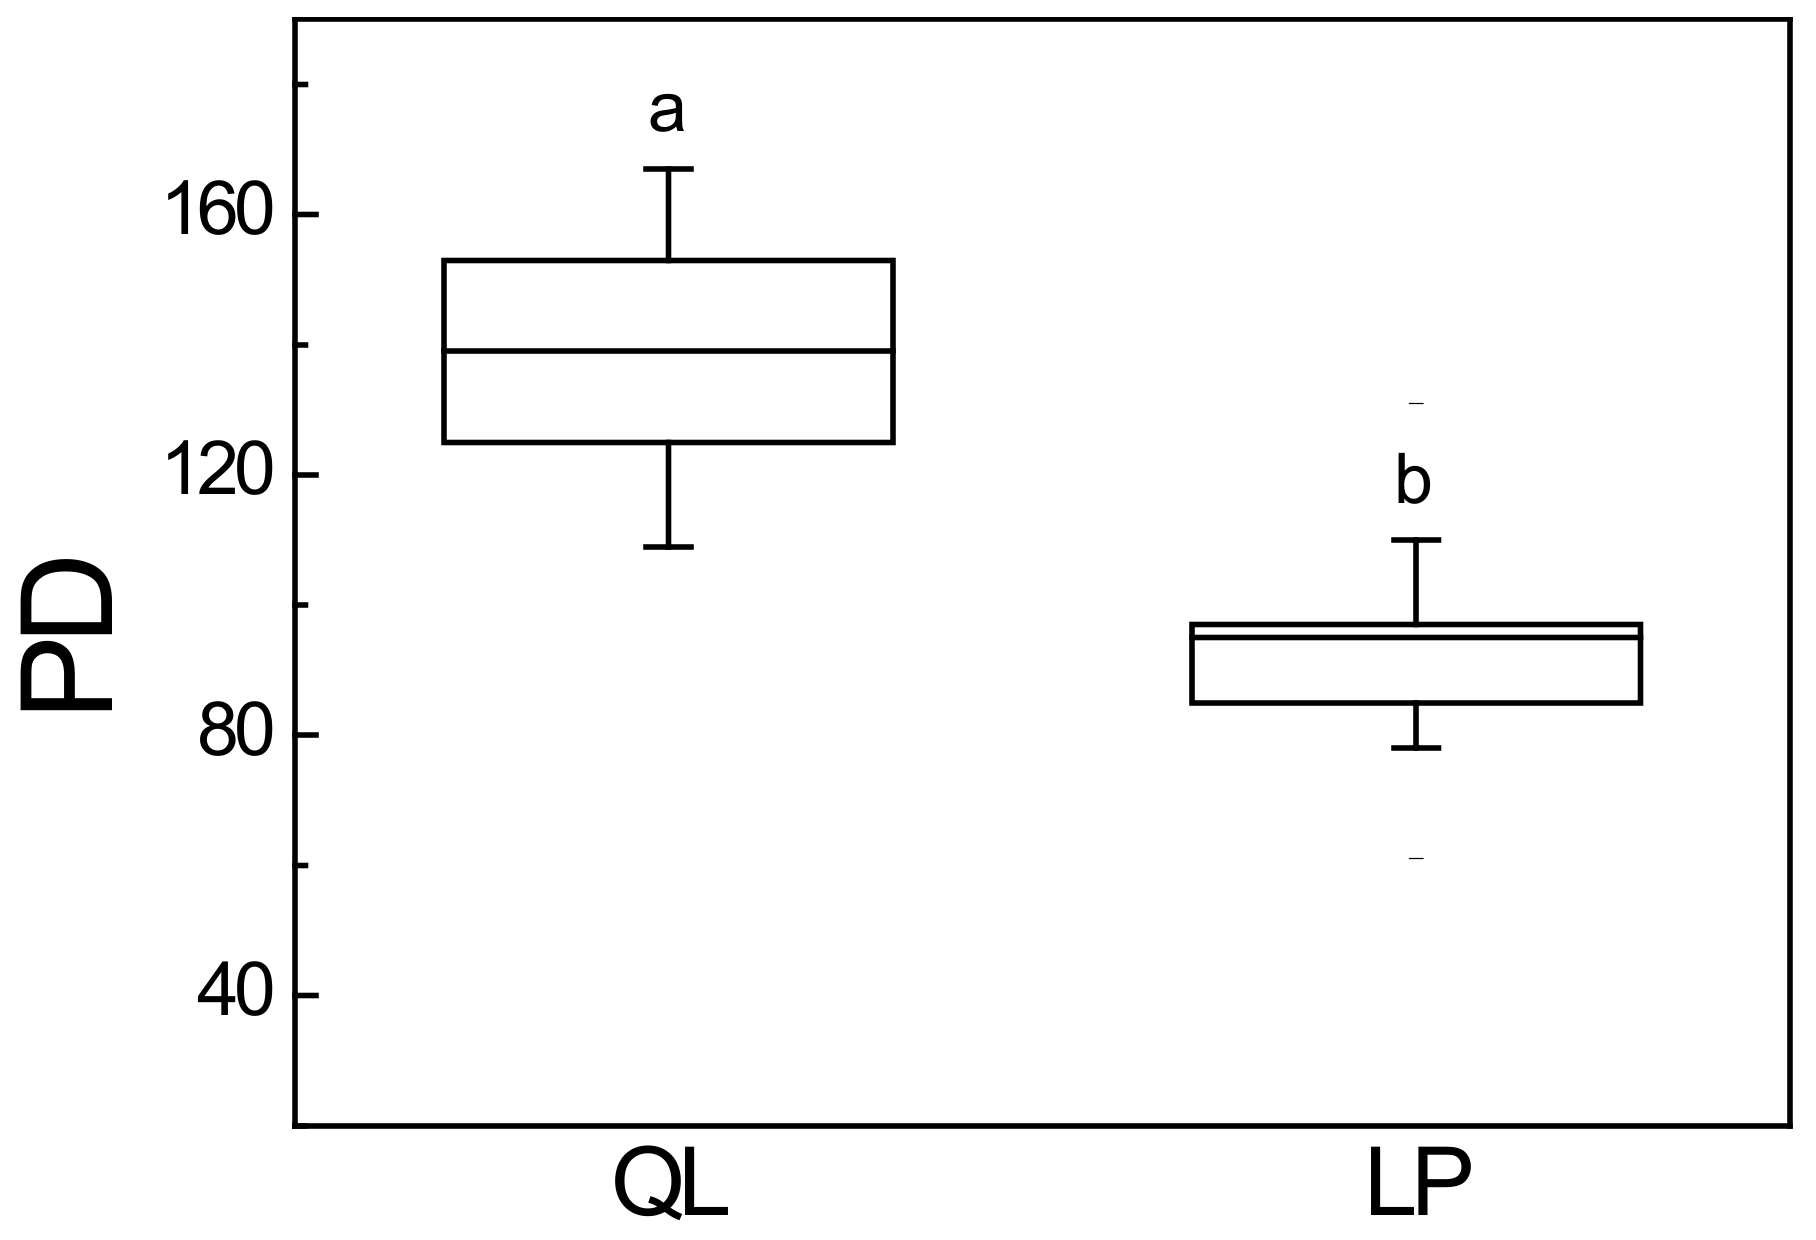
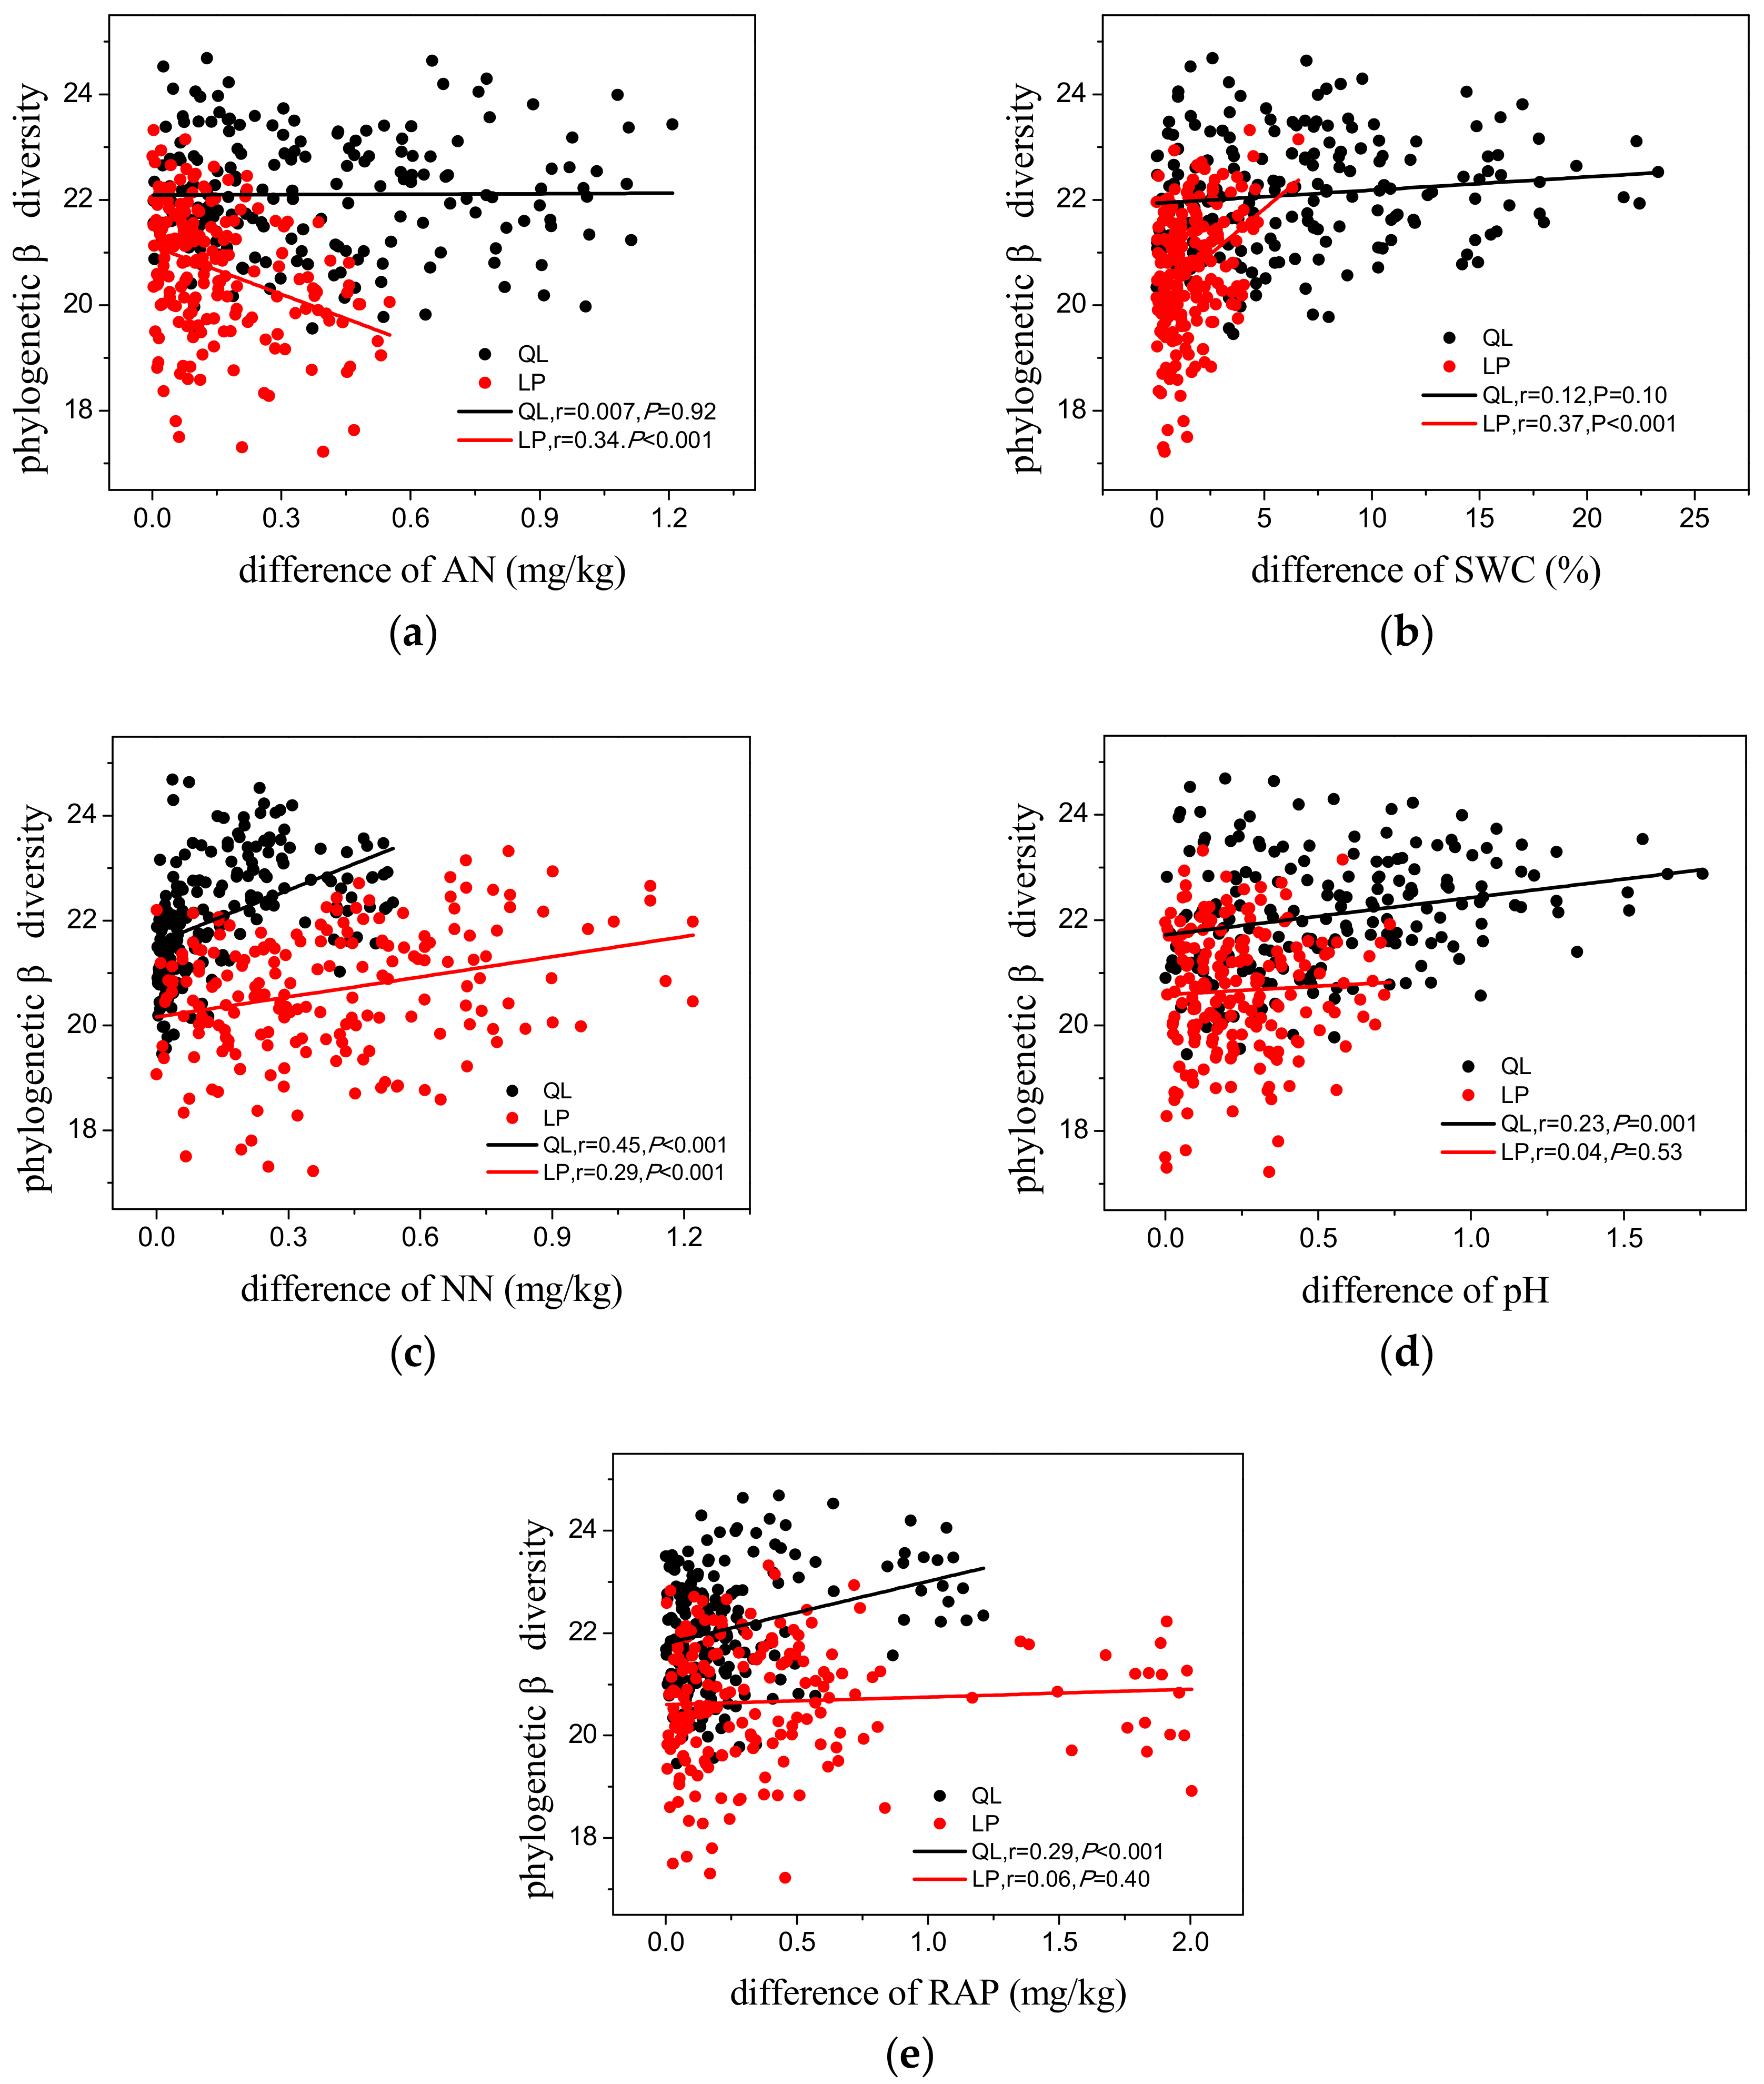
3.3. Phylogenetic Diversity

PD of Q. wutaishanica forests was significantly higher in the Qinling Mountains than in the Loess Plateau (Figure 3). On the other hand, like the patterns of NTI and NRI, the range of PD change in the Qinling Mountains was wider than those on the Loess Plateau. Note that PD is significantly related to species richness. The number of species in each region was significantly different (Table 1).
We analyzed phylogenetic beta diversity changes in each region along AN, SWC, NN, soil pH, and RAP gradients. In the current study, the distance between the plots within the same site was very close (the maximum distance was 500 m). Thus, we did not discuss the relationship between beta phylogenetic diversity and distance between plots in this paper. For beta diversity based on AN, the linear regression lines of beta diversity showed different patterns in the two regions (Figure 4a). For SWC, the slope linear regression lines differ significantly (but no significance in QL, Figure 4b), and for NN, the linear regression lines exhibited similar patterns but they do not overlapped (Figure 4c). However, phylogenetic beta diversity exhibited different patterns within the two regions based on pH and RAP. There was an increasing tendency for beta diversity along the pH and RAP differentiation gradient in the Qinling Mountains, while there was no linear relationship between beta diversity and pH or RAP in the Loess Plateau (Figure 4d,e).

4. Discussion

4.1. Phylogenetic Structure Reveals Dissimilar Patterns of Community Assembly

Studies of phylogenetic structures can provide evidence of community assembly processes. Nevertheless, the composition of regional species pools is somewhat determined by biogeographical and macroevolutionary processes (i.e., speciation, extinction, and dispersal), which probably influence the structure and diversity of communities [38]. Meanwhile, metacommunity processes may affect the size of the regional pool or its composition [38]. Thus, recognition of the dynamic nature of species pools and the processes underlying species pool formation are necessary.
In this study, the Q. wutaishanica forests were growing in a cool and moist climate in the Qinling Mountains and in a warm and semi-arid climate in the Loess Plateau. In addition to climatic differences, the soils (especially soil pH, see Table 1) of the two habitats are different. Therefore, we assembled different regional species pools for the two types of Q. wutaishanica forests (Table S1), which contained 413 woody species in the Qinling Mountains and 166 in the Loess Plateau.
Generally, compared to tropical forests with high diversity, temperate forests with lower diversity are more strongly influenced by environmental filtering [39,40]. Phylogenetic clustering in both the Qinling Mountains and the Loess Plateau Q. wutaishanica forests showed this pattern. In many cases, woody plants are associated with high competition for limiting resources in the Qinling Mountains and on the Loess Plateau. Such conditions are generally expected to exclude many taxa not adapted to such habitats, resulting in phylogenetic convergence of the two communities [41]. Recent research has also reported that the climax communities in Loess Plateau exhibited phylogenetic clustering [42].
Specifically, although Q. wutaishanica is the dominant tree species of the climax community in the Qinling Mountains and the Loess Plateau, we found that there is significant difference between NTI/NRI values for the two areas. The NTI and NRI values of Q. wutaishanica forests in the Qinling Mountains were significantly lower than those on the Loess Plateau. In general, higher NTI/NRI values mean that the communities are phylogenetically clustered, which is usually caused by environment filtering, even though Mayfield and Levine [43] explained that there was no equivalence between competition and phylogenetic overdispersion as commonly assumed in ecological studies, and that competition could also produce phylogenetic clustering. In general, the assemblages of species in different habitats have formed over millions of years, and this is mirrored in the phylogenetic structure of communities which were sampled from those pools [44,45]. The habitat variations between the Qinling Mountains and the Loess Plateau have emerged millions of years ago, and those variations served as distinct evolutionary routes for Q. wutaishanica forest after leaving glacial refugia. Different community assembly processes affected the species composition of local communities, and finally led to the significantly different phylogenetic structure in two types of Q. wutaishanica forests.
Plants with particular adaptations to some environments may be the result of evolutionary history [46]. The Loess Plateau is drier than in the relatively moist Qinling Mountains, and water supply is a major factor limiting plant growth in the Loess Plateau [47]. The semi-arid environment in the Loess Plateau may further shrink the distribution ranges of adapted species, which is likely to lead to more aggregation in phylogenetic structure of the Q. wutaishanica forests on the Loess Plateau than in the Qinling Mountains. Similar results have been found in vascular plants on the Qinghai-Tibetan Plateau, i.e., phylogenetic structure tends to cluster in drier habitats [48]. Also, the warm and moist conditions of the Qinling Mountains are more suitable for Q. wutaishanica forests than the drier conditions of the Loess Plateau, which may reduce the role of environmental filtering but increase biotic interactions. Thus, the NRI/NTI of the Qinling Mountains may tend to be in closer agreement with the null model (Figure 2).
The disturbance level may be another variable related to the phylogenetic structure of the community. Consistent with previous studies, because there has been a long-time logging activity on Loess Plateau, we found Q. wutaishanica forests of the Loess Plateau tended to be more phylogenetically clustered than those of the Qinling Mountains, where disturbance was lower [49].
On the other hand, there is evidence that plant size governs the phylogenetic structure of species [50]. According to our observations and previous findings, not only for the dominant species Q. wutaishanica, but also for companion species, plant size in the Loess Plateau is generally smaller than in the Qinling Mountains. Those morphological differences are likely caused by climate and the lower amounts of available nutrients, and it may have resulted in more phylogenetic clustering in Q. wutaishanica forests of the Loess Plateau than for Q. wutaishanica forests in the Qinling Mountains. The stressful conditions in the Loess Plateau caused the effect of environmental filtering to be more significant in the Loess Plateau than in the Qinling Mountains.

4.2. Phylogenetic Patterns of Phylogenetic Diversity

Elevation is a factor which related to temperature. Qian et al. [30] observed that phylogenetic diversity was negatively correlated with elevation, while the opposite result was demonstrated by Culmsee and Leuschner [51]. In our study, Q. wutaishanica forests at higher elevations in the Qinling Mountains had a wetter and warmer habitat than those on the Loess Plateau. These inconsistent results likely indicate that the relationship between elevation and phylogenetic diversity is dependent on the specific environment. We found that the Qinling Mountains with a cool climate had a higher phylogenetic diversity than the Loess Plateau. This is consistent with the result of Gonzálezcaro et al., that temperature has an obvious relationship with the phylogenetic alpha diversity [52]. Hence, we conclude that the relatively mild environment in the Qinling Mountains led to Q. wutaishanica forests having higher phylogenetic alpha diversity. In addition, many analyses have shown that species diversity decreased with increasing soil pH [53,54]; we found a similar result. The Q. wutaishanica forests with faintly acid soil in Qinling Mountains has higher species diversity than that in Loess Plateau with alkalescent soil (see Table S1), and these differences in species diversity may result in differences in phylogenetic diversity (Figure 3).
The pattern of phylogenetic turnover among communities could be explained by the strength of environmental filtering [55,56]. Quercus wutaishanica forests in both the Qinling Mountains and the Loess Plateau increased in phylogenetic beta diversity with increasing difference of pH, SWC, RAP, and NN, except for AN. Therefore, plots with lower differences in environmental condition have lower phylogenetic compositional turnover, whereas plots with higher differences in environmental condition exhibit higher phylogenetic turnover [17]. However, the variable range of AN and SWC in the Loess Plateau is much less than that in the Qinling Mountains. Thus, it led to a narrower range of phylogenetic turnover on the Loess Plateau than in the Qinling Mountains (Figure 4a–c), though there are more significant increasing beta diversity patterns along environmental differences on Loess Plateau. We also found that Q. wutaishanica forests in Loess Plateau tended to show stronger susceptibility with NN change (Figure 4c) along the same slope. These results explained why the environmental filtering in the Loess Plateau community was more significant than that in Qinling Mountains. Hence, we conclude that variation of the local environment reflects the evolutionary history mediates the relationship between environment and phylogenetic structure, leading to distinct assembly rules for the same community. These phylogenetic-based results may provide an insight into the mechanisms of local community assembly, which may reveal the probable reason of the same community occurring at different habitats, such as Qinling Mountains and Loess Plateau.

Supplementary Materials

The following are available online at https://www.mdpi.com/1999-4907/11/1/43/s1, Table S1: Species in the Qinling Mountains and the Loess Plateau. Bold words means species overlap in both regions.

Author Contributions

M.W. conducted the experiment and wrote the paper. J.X. analyzed the data. Y.C. prepared tables and figures. Y.G. participated in field experiment. X.L. helped identifying the plant species. M.Y. designed the study. All authors have read and agreed to the published version of the manuscript.

Funding

This work was supported by the National Science Foundation of China (41571500, 41871036, 31700348) and Postdoctoral Science Foundation of China (2018M643717).

Conflicts of Interest

The authors declare no conflict of interest.

References

  1. Weiher, E.; Keddy, P.A. Community assembly rules, morphological dispersion, and the coexistence of plant species. Oikos 1998, 81, 309–322. [Google Scholar] [CrossRef]
  2. Cornwell, W.K.; Ackerly, D.D. A link between plant traits and abundance: Evidence from coastal California woody plants. J. Ecol. 2010, 98, 814–821. [Google Scholar] [CrossRef]
  3. Hubbell, S.P. The Unified Neutral Theory of Biodiversity and Biogeography; Princeton University Press: Princeton, NJ, USA, 2001; pp. 32, 76–100. [Google Scholar]
  4. Zobel, M.; Otto, R.; Laanisto, L.; Naranjo-Cigala, A.; Pärtel, M.; Fernández-Palacios, J.M. The formation of species pools: Historical habitat abundance affects current local diversity. Glob. Ecol. Biogeogr. 2011, 20, 251–259. [Google Scholar] [CrossRef]
  5. Kraft, N.J.; Valencia, R.; Ackerly, D.D. Functional traits and niche-based tree community assembly in an Amazonian forest. Science 2008, 322, 580–582. [Google Scholar] [CrossRef] [PubMed] [Green Version]
  6. Kembel, S.W. Disentangling niche and neutral influences on community assembly: Assessing the performance of community phylogenetic structure tests. Ecol. Lett. 2009, 12, 949–960. [Google Scholar] [CrossRef] [PubMed]
  7. Swenson, N.G.; Enquist, B.J. Opposing assembly mechanisms in a neotropical dry forest: Implications for phylogenetic and functional community ecology. Ecology 2009, 90, 2161–2170. [Google Scholar] [CrossRef]
  8. Yang, Z.; Powell, J.R.; Zhang, C.; Du, G. The effect of environmental and phylogenetic drivers on community assembly in an alpine meadow community. Ecology 2012, 93, 2321–2328. [Google Scholar] [CrossRef] [Green Version]
  9. Wang, X.; Swenson, N.G.; Wiegand, T.; Wolf, A.; Howe, R.; Lin, F.; Ye, J.; Yuan, Z.; Shi, S.; Bai, X.; et al. Phylogenetic and functional diversity area relationships in two temperate forests. Ecography 2013, 36, 883–893. [Google Scholar] [CrossRef]
  10. Grandcolas, P. Phylogenetic analysis and the study of community structure. Oikos 1998, 82, 397–400. [Google Scholar] [CrossRef]
  11. Andersen, K.M.; Endara, M.J.; Turner, B.L.; Dalling, J.W. Trait-based community assembly of understory palms along a soil nutrient gradient in a lower montane tropical forest. Oecologia 2012, 168, 519–531. [Google Scholar] [CrossRef]
  12. Kraft, N.J.; Cornwell, W.K.; Webb, C.O.; Ackerly, D.D. Trait evolution, community assembly, and the phylogenetic structure of ecological communities. Am. Nat. 2007, 170, 271–283. [Google Scholar] [CrossRef] [PubMed]
  13. Schleicher, A.; Peppler-Lisbach, C.; Kleyer, M. Functional traits during succession: Is plant community assembly trait-driven? Preslia 2011, 83, 347–370. [Google Scholar]
  14. Krishnadas, M.S.; Beckman, N.G.; Penagos-Zuluaga, J.C.; Zhu, Y. Patterns of community assembly and the relative roles of space, environment, phylogeny, and disturbance in explaining functional diversity in a temperate forest. In Proceedings of the 99th ESA Annual Convention, Sacramento, CA, USA, 10–15 August 2014. [Google Scholar]
  15. Webb, C.O.; Ackerly, D.D.; McPeek, M.A.; Donoghue, M.J. Phylogenies and community ecology. Annu. Rev. Ecol. Syst. 2002, 8, 475–505. [Google Scholar] [CrossRef] [Green Version]
  16. Kembel, S.W.; Hubbell, S.P. The phylogenetic structure of a neotropical forest tree community. Ecology 2006, 87 (Suppl. 7), 86–99. [Google Scholar] [CrossRef]
  17. Cavender-Bares, J.; Kozak, K.H.; Fine, P.V.A.; Kembel, S.W. The merging of community ecology and phylogenetic biology. Ecol. Lett. 2009, 12, 693–715. [Google Scholar] [CrossRef]
  18. Lebrija-Trejos, E.; Meave, J.A.; Bongers, F.; Poorter, L. Functional traits and environmental filtering drive community assembly in a species-rich tropical system. Ecology 2010, 91, 386–398. [Google Scholar] [CrossRef] [Green Version]
  19. Webb, C.O. Exploring the phylogenetic structure of ecological communities: An example for rain forest trees. Am. Nat. 2000, 156, 145–155. [Google Scholar] [CrossRef]
  20. Cavender-Bares, J.; Kitajima, K.; Bazzaz, F.A. Multiple trait associations in relation to habitat differentiation among 17 Floridian oak species. Ecol. Monogr. 2004, 74, 635–662. [Google Scholar] [CrossRef]
  21. Satdichanh, M.; Millet, J.; Heinimann, A.; Nanthavong, K.; Harrison, R.D. Using plant functional traits and phylogenies to understand patterns of plant community assembly in a seasonal tropical forest in Lao PDR. PLoS ONE 2015, 10, e0130151. [Google Scholar] [CrossRef] [Green Version]
  22. Condit, R.; Pitman, N.; Leigh, E.G., Jr.; Chave, J.; Terborgh, J.; Foster, R.B.; Núnez, P.; Aguilar, S.; Valencia, R.; Villa, G.; et al. Beta-diversity in tropical forest trees. Science 2002, 295, 666–669. [Google Scholar] [CrossRef] [Green Version]
  23. Legendre, P.; Borcard, D.; Peres-Neto, P.R. Analyzing beta diversity: Partitioning the spatial variation of community composition data. Ecol. Monogr. 2005, 75, 435–450. [Google Scholar] [CrossRef]
  24. Faith, D.P. Conservation evaluation and phylogenetic diversity. Biol. Conserv. 1992, 61, 1–10. [Google Scholar] [CrossRef]
  25. Petchey, O.L.; Gaston, K.J. Functional diversity: Back to basics and looking forward. Ecol. Lett. 2006, 9, 741–758. [Google Scholar] [CrossRef]
  26. Swenson, N.G. The role of evolutionary processes in producing biodiversity patterns, and the interrelationships between taxonomic, functional and phylogenetic biodiversity. Am. J. Bot. 2011, 98, 472–480. [Google Scholar] [CrossRef] [Green Version]
  27. Gaston, K.J. Global patterns in biodiversity. Nature 2000, 405, 220–227. [Google Scholar] [CrossRef] [PubMed]
  28. Yue, M. Species diversity of higher plant of Quercus liaotungensis forest in Qingling Mountains and the loess plateau. Acta Bot. Bor. Occid. Sin. 1998, 18, 124–131, (In Chinese with English Abstract). [Google Scholar]
  29. Wiens, J.J.; Ackerly, D.D.; Allen, A.P.; Anacker, B.L.; Buckley, L.B.; Cornell, H.V.; Damschen, E.I.; Davies, T.J.; Grytnes, J.A.; Harrison, S.P.; et al. Niche conservatism as an emerging principle in ecology and conservation biology. Ecol. Lett. 2010, 13, 1310–1324. [Google Scholar] [CrossRef]
  30. Xu, J.; Chen, Y.; Wang, G.; Chai, Y.; Wang, M.; Liu, X.; Yue, M. Interspecific Association of Dominant Woody Plant Communities in Qiaoshan Forest Region, Shaanxi. Acta Bot. Bor. Occid. Sin. 2014, 34, 1467–1475, (In Chinese with English Abstract). [Google Scholar]
  31. Zhu, Z. A preliminary study on the Quercus wutaishanica forests in the Qinling mountain and the Loess Plateau of Northern part of the Shaanxi province. Acta Phytoecol. Geobot. Sin. 1982, 6, 11–20, (In Chinese with English Abstract). [Google Scholar]
  32. Xu, J.; Chen, Y.; Zhang, L.; Chai, Y.; Wang, M.; Guo, Y.; Li, T.; Yue, M. Using phylogeny and functional traits for assessing community assembly along environmental gradients: A deterministic process driven by elevation. Ecol. Evol. 2017, 7, 5056–5069. [Google Scholar] [CrossRef] [Green Version]
  33. Webb, C.O.; Donoghue, M.J. Phylomatic: Tree assembly for applied phylogenetics. Mol. Ecol. Notes 2005, 5, 181–183. [Google Scholar] [CrossRef]
  34. Wikström, N.; Savolainen, V.; Chase, M.W. Evolution of the angiosperms: Calibrating the family tree. Proc. R. Soc. B Biol. Sci. 2001, 268, 2211–2220. [Google Scholar] [CrossRef] [PubMed]
  35. Webb, C.O.; Ackerly, D.D.; Kembel, S.W. Phylocom: Software for the analysis of phylogenetic community structure and trait evolution. Bioinformatics 2008, 24, 2098–2100. [Google Scholar] [CrossRef] [PubMed] [Green Version]
  36. Pigot, A.L.; Etienne, R.S. A new dynamic null model for phylogenetic community structure. Ecol. Lett. 2014, 18, 153–163. [Google Scholar] [CrossRef] [Green Version]
  37. Forest, F.; Grenyer, R.; Rouget, M.; Davies, T.J.; Cowling, R.M.; Faith, D.P.; Balmford, A.; Manning, J.C.; Procheş, Ş.; van der Bank, M.; et al. Preserving the evolutionary potential of floras in biodiversity hotspots. Nature 2007, 445, 757–760. [Google Scholar] [CrossRef]
  38. Anderson, M.J.; Crist, T.O.; Chase, J.M.; Vellend, M.; Inouye, B.D.; Freestone, A.L.; Sanders, N.J.; Cornell, H.V.; Comita, L.S.; Davies, K.F.; et al. Navigating the multiple meanings of β diversity: A roadmap for the practicing ecologist. Ecol. Lett. 2011, 14, 19–28. [Google Scholar] [CrossRef]
  39. Myers, J.A.; Chase, J.M.; Jimenez, I.; Jorgensen, P.M.; Araujo-Murakami, A.; Paniagua-Zambrana, N.; Seidel, R. Beta-diversity in temperate and tropical forests reflects dissimilar mechanisms of community assembly. Ecol. Lett. 2013, 16, 151–157. [Google Scholar] [CrossRef]
  40. Siefert, A.; Ravenscroft, C.; Weiser, M.D.; Swenson, N.G. Functional beta-diversity patterns reveal deterministic community assembly processes in eastern North American trees. Glob. Ecol. Biogeogr. 2013, 22, 682–691. [Google Scholar] [CrossRef]
  41. Letten, A.D.; Keith, D.A.; Tozer, M.G. Phylogenetic and functional dissimilarity does not increase during temporal heathland succession. Proc. R. Soc. Lond. B Biol. 2014, 281, 20142102. [Google Scholar] [CrossRef]
  42. Chai, Y.; Yue, M.; Liu, X.; Guo, Y.; Wang, M.; Xu, J.; Zhang, C.; Chen, Y.; Zhang, L.; Zhang, R. Patterns of taxonomic, phylogenetic diversity during a long-term succession of forest on the Loess Plateau, China: Insights into assembly process. Sci. Rep. 2016, 6, 27087. [Google Scholar] [CrossRef] [Green Version]
  43. Mayfield, M.M.; Levine, J.M. Opposing effects of competitive exclusion on the phylogenetic structure of communities. Ecol. Lett. 2010, 13, 1085–1093. [Google Scholar] [CrossRef] [PubMed]
  44. Hooper, D.U.; Chapin, F.S.; Ewel, J.J.; Hector, A.; Inchausti, P.; Lavorel, S.; Lawton, J.H.; Lodge, D.M.; Loreau, M.; Naeem, S.; et al. Effects of biodiversity on ecosystem functioning: A consensus of current knowledge. Ecol. Monogr. 2005, 75, 3–35. [Google Scholar] [CrossRef]
  45. Vivanco, L.; Austin, A.T. Tree species identity alters forest litter decomposition through long-term plant and soil interactions in Patagonia, Argentina. J. Ecol. 2008, 96, 727–736. [Google Scholar] [CrossRef]
  46. Pennington, R.T.; Lavin, M.; Oliveira-Filho, A. Woody plant diversity, evolution, and ecology in the tropics: Perspectives from seasonally dry tropical forests. Ann. Rev. Ecol. Evol. Syst. 2009, 40, 437–457. [Google Scholar] [CrossRef] [Green Version]
  47. Chai, Y.; Yue, M.; Wang, M.; Xu, J.; Liu, X.; Zhang, R.; Wan, P. Plant functional traits suggest a change in novel ecological strategies for dominant species in the stages of forest succession. Oecologia 2015, 180, 771–783. [Google Scholar] [CrossRef] [PubMed]
  48. Yan, Y.; Xian, Y.; Tang, Z. Patterns of species diversity and phylogenetic structure of vascular plants on the Qinghai-Tibetan plateau. Ecol. Evol. 2013, 3, 4584–4595. [Google Scholar] [CrossRef] [PubMed]
  49. Xu, J.; Chai, Y.; Wang, M.; Dang, H.; Guo, Y.; Chen, Y.; Zhang, C.; Li, T.; Zhang, L.; Yue, M. Shifts in Plant Community Assembly Processes across Growth Forms along a Habitat Severity Gradient: A Test of the Plant Functional Trait Approach. Front. Plant Sci. 2018, 9, 180. [Google Scholar] [CrossRef]
  50. Swenson, N.G.; Enquist, B.J.; Thompson, J.; Zimmerman, J.K. The influence of spatial and size scale on phylogenetic relatedness in tropical forest communities. Ecology 2007, 88, 1770–1780. [Google Scholar] [CrossRef] [Green Version]
  51. Culmsee, H.; Leuschner, C. Consistent patterns of elevational change in tree taxonomic and phylogenetic diversity across Malesian mountain forests. J. Biogeogr. 2013, 40, 1997–2010. [Google Scholar] [CrossRef]
  52. Gonzálezcaro, S.; Umaña, M.N.; Álvarez, E.; Stevenson, P.R.; Swenson, N.G. Phylogenetic alpha and beta diversity in tropical tree assemblages along regional-scale environmental gradients in northwest south America. J. Plant Ecol. 2014, 7, 145–153. [Google Scholar] [CrossRef]
  53. Isermann, M. Soil pH and species diversity in coastal dunes. Plant Ecol. 2005, 178, 111–120. [Google Scholar] [CrossRef]
  54. Michalcová, D.; Gilbert, J.C.; Lawson, C.S.; Gowing, D.J.G.; Marrs, R.H. The combined effect of waterlogging, extractable P and soil pH on alpha-diversity: A case study on mesotrophic grasslands in the UK. Plant Ecol. 2011, 212, 879–888. [Google Scholar] [CrossRef]
  55. Dinnage, R. Disturbance alters the phylogenetic composition and structure of plant communities in an old field system. PLoS ONE 2009, 4, e7071. [Google Scholar] [CrossRef] [PubMed]
  56. Helmus, M.R.; Keller, W.B.; Paterson, M.J.; Yan, N.D.; Cannon, C.H.; Rusak, J.A. Communities contain closely related species during ecosystem disturbance. Ecol. Lett. 2010, 13, 162–174. [Google Scholar] [CrossRef] [PubMed]
Figure 1. Distribution range of Quercus wutaishanica forest in China. LP means the site of Loess Plateau, QL means the site of Qinling Mountains. The distribution of Quercus wutaishanica forest outside China is not shown.
Forests 11 00043 g001
Figure 2. The nearest taxon index (NTI) and net relatedness index (NRI) of the Qinling Mountains (QL) and the Loess Plateau (LP). The boxes show the range of values of NTI (a) and NRI (b) in each region. The dotted lines at 0 level represent the null expectation of NTI or NRI. The letters “a” and “b” indicate significant differences between boxes.
Forests 11 00043 g002
Figure 3. The phylogenetic diversity (PD) of the Qinling Mountains (QL) and the Loess Plateau (LP). The boxes show the range of values of PD in each region. The letters “a” and “b” indicate significant differences between boxes.
Forests 11 00043 g003
Figure 4. Phylogenetic beta diversity based on ammonia nitrogen (AN) (a), soil water content (SWC) (b), nitrate nitrogen (NN) (c), pH (d), rapid available phosphorus (RAP) (e). Black dots represent the Qinling Mountains (QL) while red dots represent the Loess Plateau (LP). The black line is the linear regression line of phylogenetic beta diversity in the Qinling Mountains, and the red line is the linear regression line of phylogenetic beta diversity on the Loess Plateau.
Forests 11 00043 g004
Table 1. The environmental conditions of each plot. Soil water content (SWC), rapidly available phosphorus (RAP), nitrate nitrogen (NN), ammonia nitrogen (AN). QL indicates the Qinling Mountain plots, and LP indicates the Loess Plateau plots.
PlotSWC (%)pHRAP (mg/kg)NN (mg/kg)AN (mg/kg)
QL-122.0176.21526.53012.3507.570
QL-221.0006.3305.1106.9305.550
QL-327.5005.8589.6203.69011.150
QL-423.6006.13413.7537.6578.090
QL-530.5005.92013.7202.54014.690
QL-620.0005.5348.3602.64018.170
QL-720.2005.3595.5501.95027.600
QL-823.5675.6049.2102.37720.153
QL-938.0006.0858.2902.93023.250
QL-1031.1005.1638.4104.89029.710
QL-1122.6006.0906.84010.71010.320
QL-1230.5675.7797.8476.17721.093
QL-1320.2005.4104.9603.95011.220
QL-1422.0005.5157.0402.5109.510
QL-1518.5005.0505.4001.84014.190
QL-1620.2335.3255.8002.76711.640
QL-1715.7005.3944.6002.0309.060
QL-1814.7004.5723.8602.01011.700
QL-1916.3005.1862.3101.5907.460
QL-2015.5675.0513.5901.8779.407
LP-118.4347.99011.67015.78012.760
LP-217.0888.30019.26021.5907.050
LP-320.5948.11512.76019.5906.580
LP-416.8027.9606.08012.9803.710
LP-516.6308.3303.1009.9903.560
LP-617.7888.3703.49017.7006.110
LP-718.0608.3302.5408.6604.810
LP-817.4498.6772.8807.1603.160
LP-917.5458.3974.1604.80014.190
LP-1017.7518.3255.9404.5908.980
LP-1116.2598.2384.8903.5706.640
LP-1218.5948.42715.5705.5009.450
LP-1317.7538.6386.83013.7106.960
LP-1417.9548.5507.43013.2505.340
LP-1515.8918.6289.08027.9705.910
LP-1620.3068.42042.63019.0604.530
LP-1718.5008.49514.93010.3736.710
LP-1818.5008.4954.80318.8805.050
LP-1916.6008.5445.8078.3305.117
LP-2014.0008.6954.4305.5075.040

