Article

Relationships between Structural Indices and Conventional Stand Attributes in an Old-Growth Forest in Southeast Europe

1
Faculty of Forestry, University of Agriculture in Krakow, al. 29-Listopada 46, 31-425 Krakow, Poland
2
Department of Forest Ecology, Faculty of Forestry and Wood Sciences, Czech University of Life Sciences, Kamýcka 129, 165 00 Praha-Suchdol, Czech Republic
3
Department of Forestry and Renewable Forest Resources, Biotechnical Faculty, University of Ljubljana, Vecna pot 83, 1000 Ljubljana, Slovenia
*
Author to whom correspondence should be addressed.
Forests 2020, 11(1), 4; https://doi.org/10.3390/f11010004
Submission received: 29 November 2019 / Revised: 13 December 2019 / Accepted: 16 December 2019 / Published: 18 December 2019
(This article belongs to the Section Forest Ecology and Management)

Abstract

:
Structural indices are often proposed as guiding measures for increasing structural heterogeneity. However, few studies have examined the association between such indices and conventional stand attributes. The primary objectives of this study were to evaluate changes in structural heterogeneity and tree species diversity at different plot sizes and to quantify the relationships between conventional stand attributes (mean tree diameter, absolute tree density, basal area, species proportion) and structural indices in a mixed old-growth forest in Southeast Europe. Paired tests were used to identify significant changes in structural heterogeneity with increased plot area, while the relationships between stand attributes and analyzed indices (Gini, diameter differentiation, species mingling, and Shannon’s index) were evaluated with Pearson’s correlations. The index values of Gini, diameter differentiation, and tree species mingling were rather stable with the increase of plot size, whereas tree species diversity increased significantly with the increase of plot area from 200 m2 to 1500 m2. The measures of tree species mingling and tree species diversity were strongly associated with each other, while their association with diameter variability was weak to moderately strong. Tree species mingling index was strongly associated with the changes in tree species proportions. However, conventional stand attributes were generally not strongly correlated with the examined indices. For restoring and maintaining old-growth characteristics, forest managers may use structural indices to increase small-scale structural heterogeneity, tree species mingling, and diversity, but only as an additional set of measures, not as surrogates for conventional stand attributes.

1. Introduction

For both conservation and commercial reasons, the characteristics of forest stand structure are of great interest to various groups of stakeholders, including forest managers, scientists, ecologists, and decision makers. Depending on the purpose of the research, stand structure is usually described by structural attributes and their empirical distributions, or by structural complexity indices [1,2]. In particular, the distribution of trees based on diameter at breast height (DBH) has been conventionally used to describe stand structure, including that of unmanaged forests [3,4,5,6,7]. However, conventional stand attributes, such as DBH distribution, mean tree size, tree density, and basal area, are considered to be insufficient to distinguish how stands are structured “from within”, that is, at the small-scale level [8,9]. This includes very small areas in which the interactions among neighboring trees occur. Such scales often correspond to the sizes of small inventory plots (e.g., up to several hundred square meters) depending on the research interests [10]. Quantifying small-scale structure is of importance to forestry practitioners when the goal is to manage a forest by emulating the small-scale DBH variability and tree species mingling patterns found in old-growth (reference) forests. In addition, forest researchers are often interested in scrutinizing DBH variability at the small-scale level within a stand for the purpose of examining its potential association with tree species diversity. Such investigations have mostly been conducted in managed forests [11,12] and are lacking for old-growth forests.
Recent studies have indicated that intermediate to severe disturbances play an important role in shaping the structure and composition of some European old-growth forests [13,14]. However, in many cases, the mid-sized and large trees in these forests are persistent over long periods of time. Consequently, in the old-growth forests of the Dinaric Mountains, small trees of European beech (Fagus sylvatica L.), silver fir (Abies alba Mill.), and Norway spruce (Picea abies (L.) H. Karst.) often endure long periods in shaded conditions before they reach the upper story [15,16,17]. It is thus important to investigate the small-scale interactions between neighboring trees of different sizes and/or different species in forests regulated by small-scale gaps to better understand the mechanisms of their coexistence. For this purpose, structural indices have often been used to quantify and describe local tree-size variety and the interactions between neighboring trees of different species [18,19,20]. There are a number of structural indices used in forest research, but the most applied indices seem to be the Gini index [21] and DBH differentiation index [10]. The mingling index [22] and the Shannon’s index [23] are typically used to assess small-scale tree species mingling and diversity, respectively.
When the goal is to use structural indices as independent modeling variables, researchers can test and present indices that have a significant impact on the response variable [24]. However, when the goal is to quantify and characterize small-scale stand structure, there is still a great deal of uncertainty and varied outcomes as to what extent different structural indices are correlated with each other [25] and if they are associated with species diversity indices [11]. Structural indices have been widely accepted as sound measures for biodiversity conservation purposes [19]. However, information on the associations between different indices is still rather scarce. Thus, the practical question of high relevance to forest managers is whether conventional stand attributes could be used as surrogates for structural indices.
In the present study, we focused on quantifying small-scale structural heterogeneity and local interactions between tree species in a mixed beech-fir-spruce old-growth forest in the central Dinaric Mountains. The specific objectives of the study were to (i) evaluate structural heterogeneity, species mingling patterns, and tree species diversity at different plot sizes; and to (ii) examine the relationships between conventional stand attributes, structural indices, and species diversity indices.

2. Materials and Methods

2.1. Study Area

The study was conducted in the Perućica old-growth forest, which is located in Sutjeska National Park, Bosnia-Herzegovina. The altitude of our sample plots ranged from 1050 m to 1450 m above sea level. The mean annual air temperature is between 5.9 °C and 8.6 °C, and the mean annual precipitation ranges from 1400 mm to 1900 mm (Suha and Cemerno stations, 690 m and 1329 m a.s.l., respectively). Due to specific historical events in this part of Europe [26,27], Perućica has remained intact as one of the largest (1434 ha) old-growth forests in Southeast Europe. Different forest associations developed in this area, but most of the reserve is occupied by mixed beech-fir-spruce forests between 1000 m and 1600 m a.s.l. [28]. Although Perućica was officially set aside as a strict forest reserve in 1954, the history of nature protection in this area dates back to 1893, during the Austro-Hungarian Empire [29]. In contrast to some other European old-growth forests, Perućica has not experienced chronic overbrowsing during the last three decades, as ungulate densities were reduced due to the Bosnian civil war and intensive hunting. The mean number of living trees with DBH ≥ 6.0 cm is 771 ha−1. The mean and maximum DBH are 24.4 cm and 134.5 cm, respectively. DBH distribution cumulatively for all species at the stand level is rotated-sigmoid. Species composition, with respect to the number of trees, favors beech (56%), followed by fir (38%) and spruce (3%). The basal area amounts to 68.5 m2·ha−1, of which fir comprises 53%, beech 37%, and spruce 6%. The share of other species is below 2%, including Acer pseudoplatanus (L.), Fraxinus excelsior (L.), and Ulmus glabra (Huds.).
Even though Perućica is a unique old-growth forest in Southeast Europe, its structural characteristics, even at the stand level, were rarely studied during the 20th century [30]. It was only at the onset of the 21st century that studies began to shed light on its disturbance regime [17], species population dynamics [31], and deadwood structure [32]. Nevertheless, research is still scarce, and the present study is the first to explicitly focus on small-scale structural heterogeneity in this old-growth forest.

2.2. Field Measurements

A network of 10-ha polygons was created using the ArcView 9.3 Environment (ESRI ArcGIS, 2011). Within each 10-ha polygon, two sample plots were set. In this way, a total of 48 plots were randomly superimposed in the study area (for details, see [33]). Each established plot was divided into three circularly fixed nested plots: An inner plot (radius 7.98 m, area 200 m2), a middle plot (radius 17.84 m, area 1000 m2), and an outer plot covering whole plot area (radius 21.85 m, area 1500 m2). On each plot, the tree species were distinguished, and the diameters of all trees with DBH ≥ 6.0 cm were cross-measured in two perpendicular directions at 1.30 m above the ground. In order to calculate DBH differentiation (T) and species mingling (M) indices, x and y coordinates were recorded for each tree on each of the 48 plots.

2.3. Data Analysis

We evaluated the Gini coefficient (GC) due to its wide application in forest research [21,34,35]. This index was computed using the following formula:
G C = j = 1 n ( 2 j 1 n ) b a j j = 1 n b a j ( n 1 )
where j is a rank of tree in ascending order from 1 to n, n is total number of trees in a plot, and baj stands for basal area (m2) of tree with rank j.
Theoretically, the GC has a maximum value of 1.0 in case of absolute inequality. However, in practice its maximum value in forest stands may reach up to 0.8, whereas its minimum value equals 0 when all the trees have the same DBH on the observed plot area.
In the next step, we examined the DBH differentiation index [20,24,36], which was calculated by applying the following formula:
T = 1 1 n j = 1 n min ( D B H i , D B H j ) max ( D B H i , D B H j )
where T represents DBH differentiation index; thereby, i stands for a reference tree, j refers to closest neighbor trees, where n = 1, 2, 3, 4, …, 7. Thus, the DBH differentiation index was computed by using from one to seven closest neighbor trees around each reference tree.
The DBH differentiation index has a minimum value of 0 when a reference tree and its nearest neighbors (considered for computation) have exactly the same DBH, whereas its value increases with the increase in DBH difference between a reference tree and its neighbors, and theoretically, its maximum value is 1.0.
Tree species mixing patterns were determined by tree species mingling index [37,38], which was also computed on the basis of each central (reference) tree and its closest neighbor trees [20,37] using the following formula:
M = 1 n j = 1 n m i j ,       m i j = { 1   if   s p e c i e s j s p e c i e s i 0   otherwise
where M stands for tree species mingling index. Thereby, i stands for a reference tree, j refers to closest neighbor trees, where n = 1, 2, 3, 4, …, 7. Thus, the mingling index was computed using between one and seven closest neighbor trees around each reference tree.
Tree species mingling index has a minimum value of 0 when a reference tree and its nearest neighbors are of the same tree species. This index proportionally increases with the increase of the number of trees of another species around a reference tree (for details, see [10]). The maximum value of tree species mingling index is also 1.0.
Finally, the Shannon’s H′ index [23] was used to evaluate tree species diversity at different plot sizes. Its computation was performed by employing the following equation:
H = s = 1 k p s ln p s
where p represents the s-th species’ proportion of the total tree number per (sub)plot and k is the number of species. If there is only one species recorded on the subplot, the Shannon’s index H′ is equal to zero. For k species with equal proportions, H′ corresponds to ln(k). It is also important to notice that this index differs from the above-described indices in that it can take values higher than 1.0.
GC and H′ were calculated for nested plot areas of 200 m2, 1000 m2, and 1500 m2, while T and M were first calculated for each tree, and then the average index values were computed at the mentioned nested plot levels. Consequently, these average values of T and M indices were used in the analysis. In order to avoid potential issues related to edge effects, for the computation of these indices, we used only those trees within the 1500 m2 plot for which all neighbors were known/recorded. If the distance from the plot boundary was shorter than that from the nth neighbor, then the nearest trees to tree i may occur outside of the plot. In this case, the trees close to the plot boundary for which the closest neighbors were not known were excluded from the analysis in order to avoid edge effect bias [39,40].
We tested all calculated indices for normality with the Shapiro–Wilk test, while the equality of variances was tested with Levene’s test. To check if the values of a particular index changed significantly with plot size, multiple paired t-tests were used. This approach was relevant for the designed experiment, as each pair of tested plots had exactly the same geographical position, while they differed in the observed area. Where indices exhibited non-normal frequency distributions and/or heteroscedasticity, multiple paired Wilcoxon tests were conducted to determine between which plot areas the index values differed significantly. All statistical tests were conducted at α = 0.05.
Since different studies have used (and will probably continue to use) a different number of neighbor trees for computation of T and M indices of reference (central) trees, we ran Pearson’s correlations and conducted paired tests to check for significant differences between the DBH differentiation indices and species mingling indices with a different number of neighbors (one to seven). The relationships between conventional stand attributes (tree number, mean DBH, basal area, species proportion) and all analyzed indices (GC, T4, M4, H′) in this study were also evaluated by running a set of Pearson’s correlations to gain insight into how strongly these variables might be associated. In the latter case, strong linear relationships could potentially enable more straightforward usage of structural indices in forestry practice. Complete data analysis was performed in the R statistical package, Version 3.5.1 [41].

3. Results

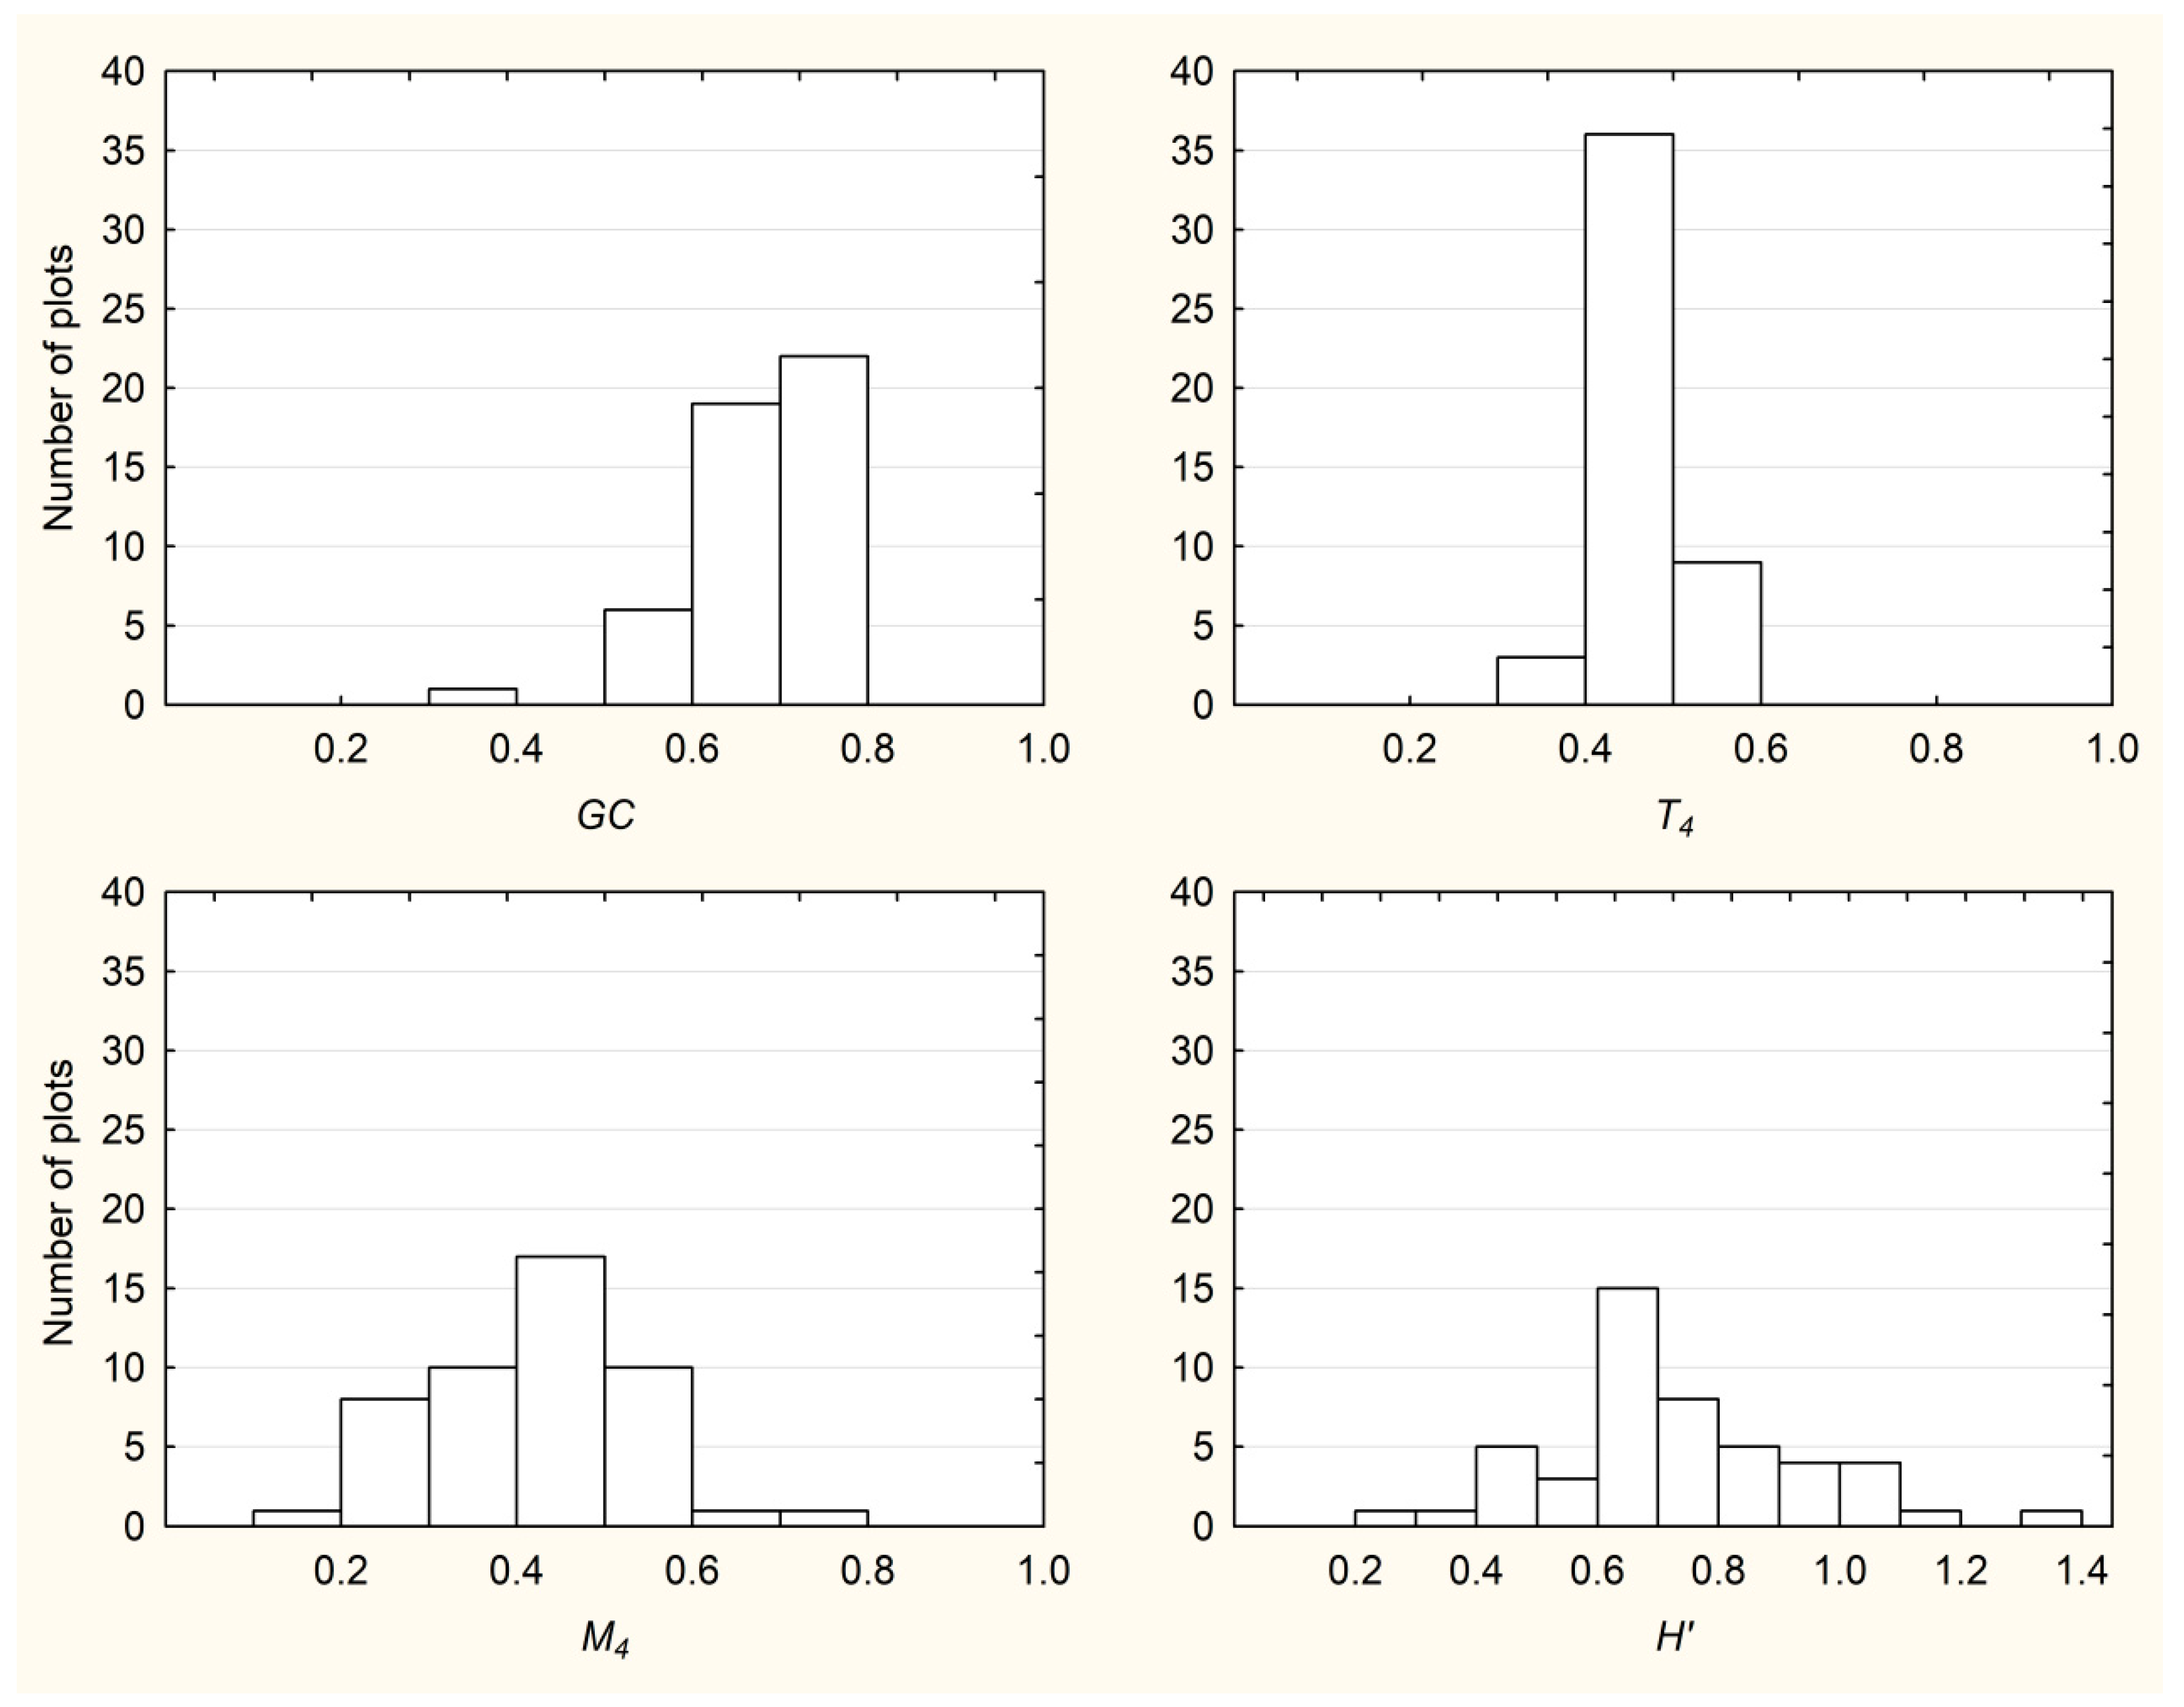
3.1. Descriptive Statistics and Frequency Distributions of All Examined Indices

Very strong correlations between T indices (and likewise M indices) with one to four neighbor trees were determined, whereby the indices based on four neighbors were slightly higher than those based on a lower number of neighbors. The analysis further showed that using a greater number (five to seven) of neighbor trees for computation yielded almost the same index values as when four neighbors were used. Consequently, in this and other sections, we present only T and M values computed based on the four closest neighbors. Hereafter we use the symbols T4 for DBH differentiation index and M4 for tree species mingling index.
The mean values of GC and T4 on plots ranging from 200 m2 to 1500 m2 were constant, amounting to 0.67 and 0.47, respectively. Likewise, the mean values of M4 (0.41–0.42) were also stable across plots of different sizes. The values of H′ index increased with plot size (Table 1). GC was characterized by left-skewed frequency distributions regardless of plot size (for the largest 1500 m2 plots, p < 0.001). On the other hand, T4 and M4, as well as the Shannon index (H′) for tree species diversity, exhibited normal frequency distributions regardless of plot size. However, heteroscedasticity was significant for GC (p < 0.001), T4 (p = 0.015) and M4 (p = 0.010), whereas H′ index had equal variances between plots of different size.
Because the frequency distributions of the analyzed indices (for all tree species combined) were rather similar on plots of different sizes, we graphically illustrated only those from the largest plots in this study (Figure 1). However, it is important to emphasize that when the frequency distributions of the M index were analyzed separately per single tree species, all three examined species exhibited significant deviation from normal distribution regardless of plot size or number of neighbor trees (in all cases, p < 0.001). Namely, the distribution of the M index was significantly right-skewed for beech, significantly left-skewed for spruce, and exhibited heavy-tailed kurtosis for silver fir.
Based on the calculated measures of the central tendency for the M index at the species level (Table 2), spruce locally mingled most intensively with other species, fir was moderately inclined toward mingling, and beech mingled least with other species. These outcomes should be treated with caution, considering the overall tree species composition of the Perućica forest described in the Section 2.1. Namely, the mingling of a tree species can be expected to increase to a certain extent with a decrease in the overall tree species composition.

3.2. Behavior of Indices with the Change of Plot Size

GC values did not change significantly with the increase of plot size, whereas their association with tree number was weak to moderate (r = 0.37; p = 0.022). The T4 and M4 indices were not significantly correlated either with plot size or tree number. The Shannon index (H′) for tree species diversity was similar between the 1000 m2 and 1500 m2 plots, whereas significant differences were found when the smallest 200 m2 plots were compared to the 1000 m2 (p = 0.021) and 1500 m2 (p = 0.011) plots (Figure 2).

3.3. Associations among Indices and Their Correlations with Stand Attributes

The correlations between T4, M4, and GC were significant only on the 1000 m2 and 1500 m2 plots, but the strength of these correlations was weak to moderate. The Shannon index for tree species diversity (H′) correlated significantly and strongly only with M4 (Table 3).
Regarding the relationships between stand attributes and the analyzed indices on the smallest plots of 200 m2, the species mingling index M was positively associated with the relative share of conifers/broadleaves by tree number (r = 0.62; p < 0.001) and with the relative share of conifers/broadleaves by basal area (r = 0.47; p < 0.001). On the 1000 m2 and 1500 m2 plots, the species mingling index M was even better related to the relative share of conifers/broadleaves by tree number (r = 0.71; p < 0.001).
The absolute plot densities of broadleaved trees were moderately associated with the M4 index (r = 0.46; p = 0.001). Similarly, the values of T4 index on the 1000 m2 and 1500 m2 plots were positively associated with the absolute densities of broadleaved trees (r = 0.51; p < 0.001), as well as with the absolute densities of all trees (r = 0.49; p < 0.001). In addition, the basal area of broadleaves showed a moderate correlation with GC values (r = 0.42; p = 0.003). However, except for M4 index, it is important to notice that the associations of basal area and species proportions with GC, T4, and H′ were weak to moderately strong at different plot sizes (Pearson’s r values ranged from 0.30 and 0.54). Likewise, independent of plot size, only moderate associations of mean DBH with T4 and M4 were determined. Mean DBH had a relatively strong correlation only with GC values on the 1000 m2 (r = 0.57; p < 0.001) and 1500 m2 (r = 0.66; p < 0.001) plots.

4. Discussion

4.1. Local DBH Differentiation, Species Mingling, and Diversity in Perućica

The GC, T, and M indices in the mixed beech-fir-spruce old-growth forest Perućica were stable across a range of plot sizes, while only H′ index increased with the plot size. The behavior of different indices at different plot sizes may depend on their mathematical design, but the same index may also vary depending on the small-scale DBH variability, species mingling, and diversity of the forest under study. It is important to note that in the Perućica forest, the strong DBH differentiation was determined among nearest neighbor trees, and likewise, strong single-tree mingling of different species in the closest neighborhood. Consequently, even small plots of 200 m2 seem sufficient to capture DBH differentiation and tree species mingling in this forest. However, in forest stands that may exhibit spatial autocorrelation [10], such as by creating cohorts of trees with very similar DBHs or cohorts composed of the same tree species, then larger plot areas might be needed to detect changes in DBH differentiation and species mingling. Consequently, future studies may try to include forest stands that exhibit positive spatial autocorrelation. Regarding Shannon’s H′ index, in this study, even a small increase in the plot size resulted in higher tree species diversity. However, we could expect that the larger the species spatial autocorrelation, that is, the larger the cohorts of one species, the larger the plot area would be required to “capture” additional tree species. This also remains an important task for future studies.
The mean GC value of 0.67 was at the upper range or higher than the GC values reported for several uneven-aged managed forests across Europe [21,34,42]. Two Chilean old-growth forests exhibited GC values above 0.70 [43], but other studies in old-growth forests reported fairly low values of this index [44,45]. These contradictory findings regarding GC should be noted, as they indicate that this index may be sensitive to the intrinsic eco-physiological traits of constituent tree species or the unique disturbance history of a given plot or stand. Therefore, although a number of studies used GC to characterize forest structure, the discussion about the variability of this coefficient in different forest types (see also [2,42]) still remains open.
The diameter differentiation index has been evaluated in a number of studies in managed forests, but rarely in old-growth forests. The average T index value of 0.47 in the old-growth forest of Perućica was higher than that in some other unmanaged [2,44] and managed [25] forests in Europe and was similar compared to some other mixed old-growth forests in Bosnia-Herzegovina and Slovakia [45,46]. Based on the classification of T index values proposed by Peck et al. [25], the Perućica old-growth forest exhibited strong DBH differentiation at small-scale levels, since the index values on most plots (regardless of their size) ranged between 0.41 and 0.60.
Regarding the tree species mingling index M, its average value of 0.42 in our study indicated fairly strong single-tree species mingling. Comparable outcomes were reported in two other Dinaric old-growth forests [46], as well as in managed uneven-aged forests in Europe [19,20]. The distribution of the M index values in Perućica was normal, whereas Balanda [44] in a similar forest type, and Seidling et al. [47] in different forest types, reported right-skewed distributions of this index. Obviously, in the case of a non-normal distribution of the M index, its median value would be a better measure of species mingling than its usually reported mean value.
However, perhaps even more important is the frequency distribution of M index for individual tree species within a mixed forest. We can assume based on our results that the frequency distribution, and therefore mingling tendency of a particular tree species, will depend, to a large extent, on its share in the tree species composition at the stand level (see also [48]).

4.2. Relationships between the Evaluated Indices and Conventional Stand Attributes

Strong correlations between different structural indices were found in homogeneous even-aged forests [49] and, likewise, Sterba und Zingg [35] reported a strong positive correlation between the GC and T indices in Swiss plenter forests. However, Peck et al. [25] found that GC and T were significantly correlated only in even-aged stands. Likewise, our results indicated that correlations between the GC and T indices were rather weak (see also [50]). The reason for such an outcome may lie in the different mathematical design of each index. Thus, the comparison between two or more forest sites regarding structural heterogeneity seems to be reasonable only if the same structural index and similar or identical sampling procedures are used.
T was the only index for which the strength of the correlations with GC and M increased with plot size. Most correlations among these indices, however, could be classified as weak to moderately strong. Consequently, none of the evaluated structural indices should be replaced with each other. In the case of weak correlations among structural indices, Sterba [50] stated that each of the analyzed indices is expected to provide additional information about the examined forest ecosystem. However, despite the ever-larger number of studies employing structural indices, the discussion still remains open with regard to the ecological meaning of different structural indices. In this context, Neumann and Starlinger [11] determined only weak associations between the indices of stand structure and species diversity in different forest types in Austria, whereas in the Perućica old-growth forest, the correlations between the T and M indices were weak to moderately strong. Seidling et al. [47] obtained similar results for the correlation between these two indices for a large set of different forest types across Europe.
With respect to the relationships of conventional stand attributes with the measures of small-scale structural heterogeneity, Schall et al. [2] reported a decrease in GC with increasing mean DBH. In our study, mean DBH had a moderately strong positive correlation with GC on plots of 1000 m2 and 1500 m2. We also found that the absolute densities of broadleaved trees were moderately associated with T4. Strong correlations were found only between tree species mingling index M4 and tree species proportions (see also [2]). Namely, it can be expected that the species with a small share will exhibit high tendency toward mingling with other species, whereas its mingling pattern will probably change with its increased share in the species composition. To verify this statement, additional studies from different forest types would be needed. It would therefore be valuable for future studies to analyze forest stands where two or more species have approximately equal shares in the tree species composition at stand or plot scales. The information from such studies could reveal the true mingling tendency of each constituent tree species.

5. Conclusions

The Perućica old-growth forest exhibited high DBH differentiation and single-tree mingling of different tree species at the small-scale level. The values of all evaluated indices in this study were at the upper range or higher compared to available sources from uneven-aged managed forests. However, it was difficult to make comparisons with old-growth forests due to the small number of corresponding studies. Based on the GC and T4 indices, small-scale structural heterogeneity was similar between plots of different sizes (200 m2, 1000 m2, and 1500 m2). The tree species mingling index (M4) was also rather stable across plots of different sizes. The probability of finding additional tree species (hence diversity) increased with plot size.
The measures of tree species mingling and diversity (M4 and H′) were strongly associated with each other. On the other hand, the associations between structural indices GC and T4 were rather weak. Thus, the comparison of structural heterogeneity between different sites will only be reasonable using the same index and a similar or the same sampling procedure. The GC was also weakly associated with tree species mingling and diversity, while a moderate association was determined between T4 and M4 indices.
Among all evaluated indices, only M4 correlated fairly strongly with the changes in tree species proportions. However, mean DBH, absolute tree density, and basal area were weakly to moderately associated with all analyzed indices (GC, T4, M4, H′). Consequently, for restoring and maintaining old-growth characteristics, forest managers may use structural indices to increase local structural heterogeneity, tree species mingling, and diversity, but only as an additional set of measures, not as surrogates for conventional stand attributes. Therefore, future studies will need to include additional stand attributes and perhaps even environmental factors in order to better explain the local variability of structural indices.
Finally, because the mingling intensity of single tree species in our study increased with its decrease in the overall tree species composition, our recommendation for future studies that may investigate small-scale species mingling is to make an effort to find and analyze such stands (or reasonably sized plots) that have approximately equal shares of each tree species in the overall tree species composition at stand (or plot) scales. Such studies may have the strongest potential to reveal the true mingling tendency of each constituent tree species.

Author Contributions

Data curation, all authors; Formal analysis, S.K.; Investigation, S.K., P.J. and T.A.N.; Methodology, S.K.; Project administration, M.S.; Writing—original draft, S.K.; Writing—review & editing, all authors. All authors have read and agreed to the published version of the manuscript.

Funding

Czech researchers were supported by the institutional project “EVA 4.0”, No. CZ.02.1.01/0.0/0.0/16_019/0000803 and MSMT project LTC17055 (Czech Republic). Polish and Slovenian researchers were supported by the project Innovative forest MAnagEment STrategies for a Resilient biOeconomy under climate change and disturbances (I-MAESTRO) under the umbrella of ForestValue ERA-NET Cofund, among others by the National Science Centre in Poland (NCN) and Slovenian Ministry of Education, Science and Sport (MIZS). ForestValue has received funding from the European Union’s Horizon 2020 research and innovation programme under grant agreement Nr 773324.

Conflicts of Interest

The authors declare no conflict of interest.

References

  1. McElhinny, C.; Gibbons, P.; Brack, C.; Bauhus, J. Forest and woodland stand structural complexity: Its definition and measurement. For. Ecol. Manag. 2005, 218, 1–24. [Google Scholar] [CrossRef]
  2. Schall, P.; Schulze, E.D.; Fischer, M.; Ayasse, M.; Ammer, C. Relations between forest management, stand structure and productivity across different types of Central European forests. Basic Appl. Ecol. 2018, 32, 39–52. [Google Scholar] [CrossRef]
  3. Keeton, W.S. Managing for late-successional/old-growth characteristics in northern hardwood-conifer forests. For. Ecol. Manag. 2006, 235, 129–142. [Google Scholar] [CrossRef]
  4. Korpel, S. Die Urwälder der Westkarpaten; Gustav Fischer Verlag: Stuttgart, Germany; Jena: New York, NY, USA, 1995. [Google Scholar]
  5. Vrška, T.; Adam, D.; Hort, L.; Kolář, T.; Janík, D. European beech (Fagus sylvatica L.) and silver fir (Abies alba Mill.) rotation in the Carpathians—A developmental cycle or a linear trend induced by man? For. Ecol. Manag. 2009, 258, 347–356. [Google Scholar] [CrossRef]
  6. Jaworski, A.; Kołodziej, Z.; Łapka, M. Mortality, recruitment, and increment of trees in the Fagus-Abies-Picea stands of a primeval character in the lower mountain zone. Dendrobiology 2007, 57, 15–26. [Google Scholar]
  7. Diaci, J.; Rozenbergar, D.; Anic, I.; Mikac, S.; Saniga, M.; Kucbel, S.; Visnjic, C.; Ballian, D. Structural dynamics and synchronous silver fir decline in mixed old-growth mountain forests in Eastern and Southeastern Europe. Forestry 2011, 84, 479–491. [Google Scholar] [CrossRef] [Green Version]
  8. Zenner, E.K.; Peck, J.L.E. Floating neighborhoods reveal contribution of individual trees to high sub-stand scale heterogeneity. For. Ecol. Manag. 2018, 412, 29–40. [Google Scholar] [CrossRef]
  9. Mauro, F.; Haxtema, Z.; Hailemariam, T. Comparison of sampling methods for estimation of nearest-neighbor index values. Can. J. For. Res. 2017, 47, 703–7015. [Google Scholar] [CrossRef] [Green Version]
  10. Pommerening, A.; Grabarnik, P. Individual-Based Methods in Forest Ecology and Management, 1st ed.; Springer International Publishing: Berlin/Heidelberg, Germany, 2019. [Google Scholar]
  11. Neumann, M.; Starlinger, F. The significance of different indices for stand structure and diversity in forests. For. Ecol. Manag. 2001, 145, 91–106. [Google Scholar] [CrossRef]
  12. Li, Y.; Hui, G.; Yu, S.; Luo, Y.; Yao, X.; Ye, S. Nearest neighbour relationships in Pinus yunnanensis var. Tenuifolia forests along the Nanpan River, China. iForest 2017, 10, 746–753. [Google Scholar] [CrossRef] [Green Version]
  13. Nagel, T.A.; Mikac, S.; Dolinar, M.; Klopcic, M.; Keren, S.; Svoboda, M.; Diaci, J.; Boncina, A.; Paulic, V. The natural disturbance regime in forests of the Dinaric Mountains: A synthesis of evidence. For. Ecol. Manag. 2017, 388, 29–42. [Google Scholar] [CrossRef]
  14. Szwagrzyk, J.; Maciejewski, Z.; Maciejewska, E.; Tomski, A.; Gazda, A. Forest recovery in set-aside windthrow is facilitated by fast growth of advance regeneration. Ann. For. Sci. 2018, 75, 80. [Google Scholar] [CrossRef] [Green Version]
  15. Nagel, T.A.; Svoboda, M. Gap disturbance regime in an old-growth FagusAbies forest in the Dinaric Mountains, Bosnia-Herzegovina. Can. J. For. Res. 2008, 38, 2728–2737. [Google Scholar] [CrossRef] [Green Version]
  16. Nagel, T.A.; Svoboda, M.; Rugani, T.; Diaci, J. Gap regeneration and replacement patterns in an old-growth Fagus-Abies forest of Bosnia-Herzegovina. Plant Ecol. 2010, 208, 307–318. [Google Scholar] [CrossRef]
  17. Nagel, T.A.; Svoboda, M.; Kobal, M. Disturbance, life history traits, and dynamics in an old-growth forest landscape of southeastern Europe. Ecol. Appl. 2014, 24, 663–679. [Google Scholar] [CrossRef]
  18. Gadow, K.; Zhang, C.Y.; Wehenkel, C.; Pommerening, A.; Corral-Rivas, J.; Korol, M.; Myklush, S.; Hui, G.Y.; Kiviste, A.; Zhao, X.H. Forest structure and diversity. In Continuous Cover Forestry; Pukkala, T., Gadow, K., Eds.; Springer Science + Business Media: Berlin/Heidelberg, Germany, 2012; pp. 29–84. [Google Scholar]
  19. Motz, K.; Sterba, H.; Pommerening, A. Sampling measures of tree diversity. For. Ecol. Manag. 2010, 260, 1985–1996. [Google Scholar] [CrossRef]
  20. Pretzsch, H. Forest Dynamics, Growth and Yield; Springer: Berlin/Heidelberg, Germany, 2009. [Google Scholar]
  21. O’Hara, K.L.; Hasenauer, H.; Kindermann, G. Sustainability in multi-aged stands: An analysis of long-term plenter systems. Forestry 2007, 80, 163–181. [Google Scholar] [CrossRef] [Green Version]
  22. Pukkala, T.; von Gadow, K. Continuous Cover Forestry; Springer: Dordrecht, The Netherlands, 2012. [Google Scholar]
  23. Shannon, C.E.; Weaver, W. The Mathematical Theory of Communication; University of Illinois Press: Urbana, IL, USA, 1949. [Google Scholar]
  24. Pommerening, A. Evaluating structural indices by reversing forest structural analysis. For. Ecol. Manag. 2006, 224, 266–277. [Google Scholar] [CrossRef]
  25. Peck, J.E.; Zenner, E.K.; Brang, P.; Zingg, A. Tree size distribution and abundance explain structural complexity differentially within stands of even-aged and uneven-aged structure types. Eur. J. For. Res. 2014, 133, 335–346. [Google Scholar] [CrossRef]
  26. Bončina, A. History, current status and future prospects of uneven-aged forest management in the Dinaric region: An overview. Forestry 2011, 84, 467–478. [Google Scholar] [CrossRef]
  27. O’Hara, K.L.; Bončina, A.; Diaci, J.; Anić, I.; Boydak, M.; Curovic, M.; Govedar, Z.; Grigoriadis, N.; Ivojevic, S.; Keren, S.; et al. Culture and Silviculture: Origins and Evolution of Silviculture in Southeast Europe. Int. For. Rev. 2018, 20, 130–143. [Google Scholar] [CrossRef]
  28. Fukarek, P.; Stefanović, V. Prasuma Perucica i njena vegetacija. Rad. Poljopr. Fak. 1958, 3, 93–146. [Google Scholar]
  29. Stupar, V.; Milanović, Đ. Istorijat Zaštite Prirode Na Području Nacionalnog Parka Sutjeska. Glas. Sumar. Fak. Univ. Banjoj Luci 2017, 113–128. [Google Scholar] [CrossRef] [Green Version]
  30. Drinić, P. Taksacioni Elementi Sastojina Jele, Smrce i Bukve Prasumskog Tipa u Bosni. Rad. Poljopr. Fak. Sarajevo B 1956, 1, 107–160. [Google Scholar]
  31. Keren, S.; Motta, R.; Govedar, Z.; Lucic, R.; Medarevic, M.; Diaci, J. Comparative structural dynamics of the Janj mixed old-growth mountain forest in Bosnia and Herzegovina: Are conifers in a long-term decline? Forests 2014, 5, 1243–1266. [Google Scholar] [CrossRef] [Green Version]
  32. Motta, R.; Garbarino, M.; Berretti, R.; Bjelanovic, I.; Borgogno Mondino, E.; Čurović, M.; Keren, S.; Meloni, F.; Nosenzo, A. Structure, spatio-temporal dynamics and disturbance regime of the mixed beech–silver fir–Norway spruce old-growth forest of Biogradska Gora (Montenegro). Plant Biosyst. Int. J. Deal. Asp. Plant Biol. 2015, 149, 966–975. [Google Scholar] [CrossRef]
  33. Kozák, D.; Mikolá, M.; Svitok, M.; Ba, R.; Paillet, Y.; Larrieu, L.; Nagel, T.A.; Diku, A.; Frankovic, M.; Janda, P.; et al. Profile of tree-related microhabitats in European primary beech-dominated forests. For. Ecol. Manag. 2018, 429, 363–374. [Google Scholar] [CrossRef]
  34. Lexerød, N.L.; Eid, T. An evaluation of different diameter diversity indices based on criteria related to forest management planning. For. Ecol. Manag. 2006, 222, 17–28. [Google Scholar] [CrossRef]
  35. Sterba, H.; Zingg, A. Abstandsabhängige und abstandsunabhängige Bestandesstrukturbeschreibung. Allg. Forst Jagdztg. 2006, 177, 169–176. [Google Scholar]
  36. Füldner, K. Zur Strukturbeschreibung in Mischbeständen. Forstarchiv 1995, 66, 235–240. [Google Scholar]
  37. Füldner, K. Die “Strukturelle Vierergruppe”—Ein Stichprobenverfahren zur Erfassung von Strukturparametern in Wäldern. In Beiträge zur Waldinventur; von Gadow, K., Beisch, T., Eds.; Cuvillier Verlag: Göttingen, Germany, 1996; pp. 13–30. [Google Scholar]
  38. Pommerening, A.; Uria-Diez, J. Do large forest trees tend towards high species mingling? Ecol. Inform. 2017, 42, 139–147. [Google Scholar] [CrossRef]
  39. Kuuluvainen, T.; Leinonen, K.; Nygren, M.; Penttinen, A. Statistical opportunities for comparing stand structural heterogeneity in managed and primeval forests: An example from boreal spruce forest in southern Finland. Silva Fenn. 1996, 30, 315–328. [Google Scholar] [CrossRef] [Green Version]
  40. Pommerening, A.; Stoyan, D. Edge-correction needs in estimating indices of spatial forest structure. Can. J. For. Res. 2006, 36, 1723–1739. [Google Scholar] [CrossRef] [Green Version]
  41. R Core Team. A Language and Environment for Statistical Computing; Foundation for Statistical Computing: Vienna, Austria, 2018. [Google Scholar]
  42. Sterba, J.; Sterba, H. The semi-logarithmic stem number distribution and the Gini-index—Structural diversity in “balanced” dbh-distributions. Austrian J. For. Sci. 2018, 135, 19–31. [Google Scholar]
  43. Ponce, D.B.; Donoso, P.J.; Salas-Eljatib, C. Differentiating structural and compositional attributes across successional stages in chilean temperate rainforests. Forests 2017, 8, 329. [Google Scholar] [CrossRef] [Green Version]
  44. Balanda, M. Spatio-temporal structure of natural forest: A structural index approach. Beskydy 2012, 5, 163–172. [Google Scholar] [CrossRef] [Green Version]
  45. Parobeková, Z.; Pittner, J.; Kucbel, S.; Saniga, M.; Filípek, M.; Sedmáková, D.; Vencurik, J.; Jaloviar, P. Structural diversity in a mixed spruce-fir-beech old-growth forest remnant of the Western Carpathians. Forests 2018, 9, 379. [Google Scholar] [CrossRef] [Green Version]
  46. Keren, S.; Diaci, J.; Motta, R.; Govedar, Z. Stand structural complexity of mixed old-growth and adjacent selection forests in the Dinaric Mountains of Bosnia and Herzegovina. For. Ecol. Manag. 2017, 400, 531–541. [Google Scholar] [CrossRef]
  47. Seidling, W.; Travaglini, D.; Meyer, P.; Waldner, P.; Fischer, R.; Granke, O.; Chirici, G.; Corona, P. Dead wood and stand structure—Relationships for forest plots across Europe. iForest 2014, 7, 269–381. [Google Scholar] [CrossRef]
  48. Szmyt, J.; Dobrowolska, D. Spatial diversity of forest regeneration after catastrophic wind in northeastern Poland. iForest 2016, 9, 414–421. [Google Scholar] [CrossRef] [Green Version]
  49. Barbeito, I.; Cañellas, I.; Montes, F. Evaluating the behaviour of vertical structure indices in Scots pine forests. Ann. For. Sci. 2009, 66, 710. [Google Scholar] [CrossRef] [Green Version]
  50. Sterba, H. Diversity indices based on angle count sampling and their interrelationships when used in forest inventories. Forestry 2008, 81, 587–597. [Google Scholar] [CrossRef] [Green Version]
Figure 1. Frequency distributions of the Gini coefficient (GC), diameter differentiation index (T4), species mingling index (M4), and Shannon index (H′) in the Perućica old-growth forest based on 48 plots, each with an area of 1500 m2.
Forests 11 00004 g001
Figure 2. Boxplots of the Gini coefficient (GC), diameter differentiation index (T4), tree species mingling index (M4), and Shannon index (H′) for different plot sizes. The small inner box represents the median, the large box represents the interquartile range, and the whiskers extend to the lowest and highest values below and above the first and third quartile. Small circles stand for outliers that are more than 1.5-times the interquartile range.
Forests 11 00004 g002
Table 1. Statistical summary for the Gini coefficient (GC), diameter differentiation index (T4), species mingling index (M4), and Shannon index for tree species diversity (H′) on plots of different sizes in the Perućica old-growth forest.
Plot sizeIndexMeanMedianMin. Max.St. Dev.
200 m2GC0.670.700.320.880.14
T40.470.470.330.620.06
M40.410.430.060.750.17
H0.590.640.001.200.27
1000 m2GC0.670.680.400.780.08
T40.470.470.380.550.04
M40.420.440.150.700.12
H0.720.690.341.380.22
1500 m2GC0.670.690.370.770.08
T40.470.470.370.540.04
M40.420.420.100.700.12
H0.730.690.251.340.21
Table 2. Mean and median values of species mingling index with one (M1), two (M2), three (M3), and four (M4) neighbor trees on 1500 m2 plots in the Perućica old-growth forest.
Tree SpeciesEuropean BeechSilver FirNorway Spruce
Mingling IndicesMeanMedianMeanMedianMeanMedian
M10.300.000.450.000.741.00
M20.310.000.460.500.791.00
M30.310.330.460.330.811.00
M40.310.250.470.500.811.00
Table 3. Pearson’s r coefficients for correlations between the Gini coefficient (GC), diameter differentiation index (T4), tree species mingling index (M4), and Shannon index for tree species diversity (H′) for different plot sizes.
Plot Size 200 m2
IndexT4M4H
GC0.250.090.15
T4-0.190.08
M4--0.87 ***
Plot Size 1000 m2
IndexT4M4H
GC0.32 *0.050.05
T4-0.36 *0.11
M4--0.85 ***
Plot Size 1500 m2
IndexT4M4H
GC0.32 **0.150.16
T4-0.43 ***0.14
M4--0.86 ***
Significance: (*) p < 0.05; (**) p < 0.01; (***) p < 0.001.

