1. Introduction
Plants respond to various natural stimuli, including light, temperature, sound, wind and rain [
1,
2,
3]. The environment in which plants live has many different types of sounds, including bird chirping, wind blowing through leaves and flowing water. Plant leaves can reduce and respond to various sounds by vibration.
Urban tree belts can reduce traffic noise. In Europe, green space coverage varies significantly and ranges from 1.9% (Reggio di Calabria, Italy) to 46% (Ferrol, Spain) with an average of 18.6% [
4]. The proportion of green space in most Chinese cities is 25%–42% (General Administration of Mass Supervision, Inspection and Quarantine of the People’s Republic of China, 2002). In the studies on noise reduction by tree belts, it has been found that the width, length, height and visibility of tree belts all contributed to the noise reduction effect. In one study, the noise reduction efficacy of 35 tree belts was tested. It was found that visibility was negatively correlated with noise attenuation, whereas width, height and length were positively correlated with it [
5]. Measurement of the reduction of noise at different frequencies by tree belts showed that the attenuation effect increased with noise frequency [
6]. Recent reports by Renterghem et al. [
7,
8] showed that tree belts most effectively attenuated noise when the gaps in them were <3 m wide and the tree diameters were >0.11 m. Pathak et al. [
9] found that of all the trees belts they studied, banyan and mango most effectively reduced noise. The arrangement density was proportional to the attenuation in different arrangement modes. However, excessively high density had the adverse effect of attenuating low-frequency sound [
10]. For interlaced arrangements at the same planting density, the effect of noise reduction was the strongest, followed by alignment and scatter point. When the planting density was very low, the noise reduction effect of the scatter point was the strongest, whilst that of the alignment type was the weakest. Renterghem et al. [
8,
11] investigated the noise reduction efficacy of pseudorandom tree belt planting patterns. When all plants had the same physical properties, interlaced Ficus were the most effective at noise reduction. Recent studies have explored the relative influences of tree belt physical properties (length, width and visibility), tree planting pattern and tree species on noise reduction.
Research has also been carried out in terms of responses of plants to sound at the scale of individual plants. Yang et al. [
12] found that soil depth and vegetation coverage were directly proportional to the sound absorption coefficient. It has been proposed but not yet confirmed that leaf size also affects the sound absorption coefficient. Tree crown size may be the most important factor influencing noise reduction. The presence of plant leaves increased noise attenuation at high frequencies [
13]. Horoshenkov et al. [
14] found that the leaf area density and the dominant leaf orientation angle were two key morphological characteristics that could be used in the accurate prediction of plant flow resistivity and tortuosity. The ground effect was also the main factor influencing plant noise reduction. Perforated soil tended to reduce low-frequency noise. The ground effect strongly attenuated noise at frequencies <500 Hz and >1000 Hz by trunk, branch, and leaf scattering and by branch and leaf absorption. Liu [
15] found that oval leaves more strongly attenuated noise than long narrow leaves. Renterghem et al. [
16] reported that the canopy substantially attenuated high-frequency noise, whereas the trunk markedly attenuated medium-frequency noise. However, neither structure had any obvious effect on low-frequency noise.
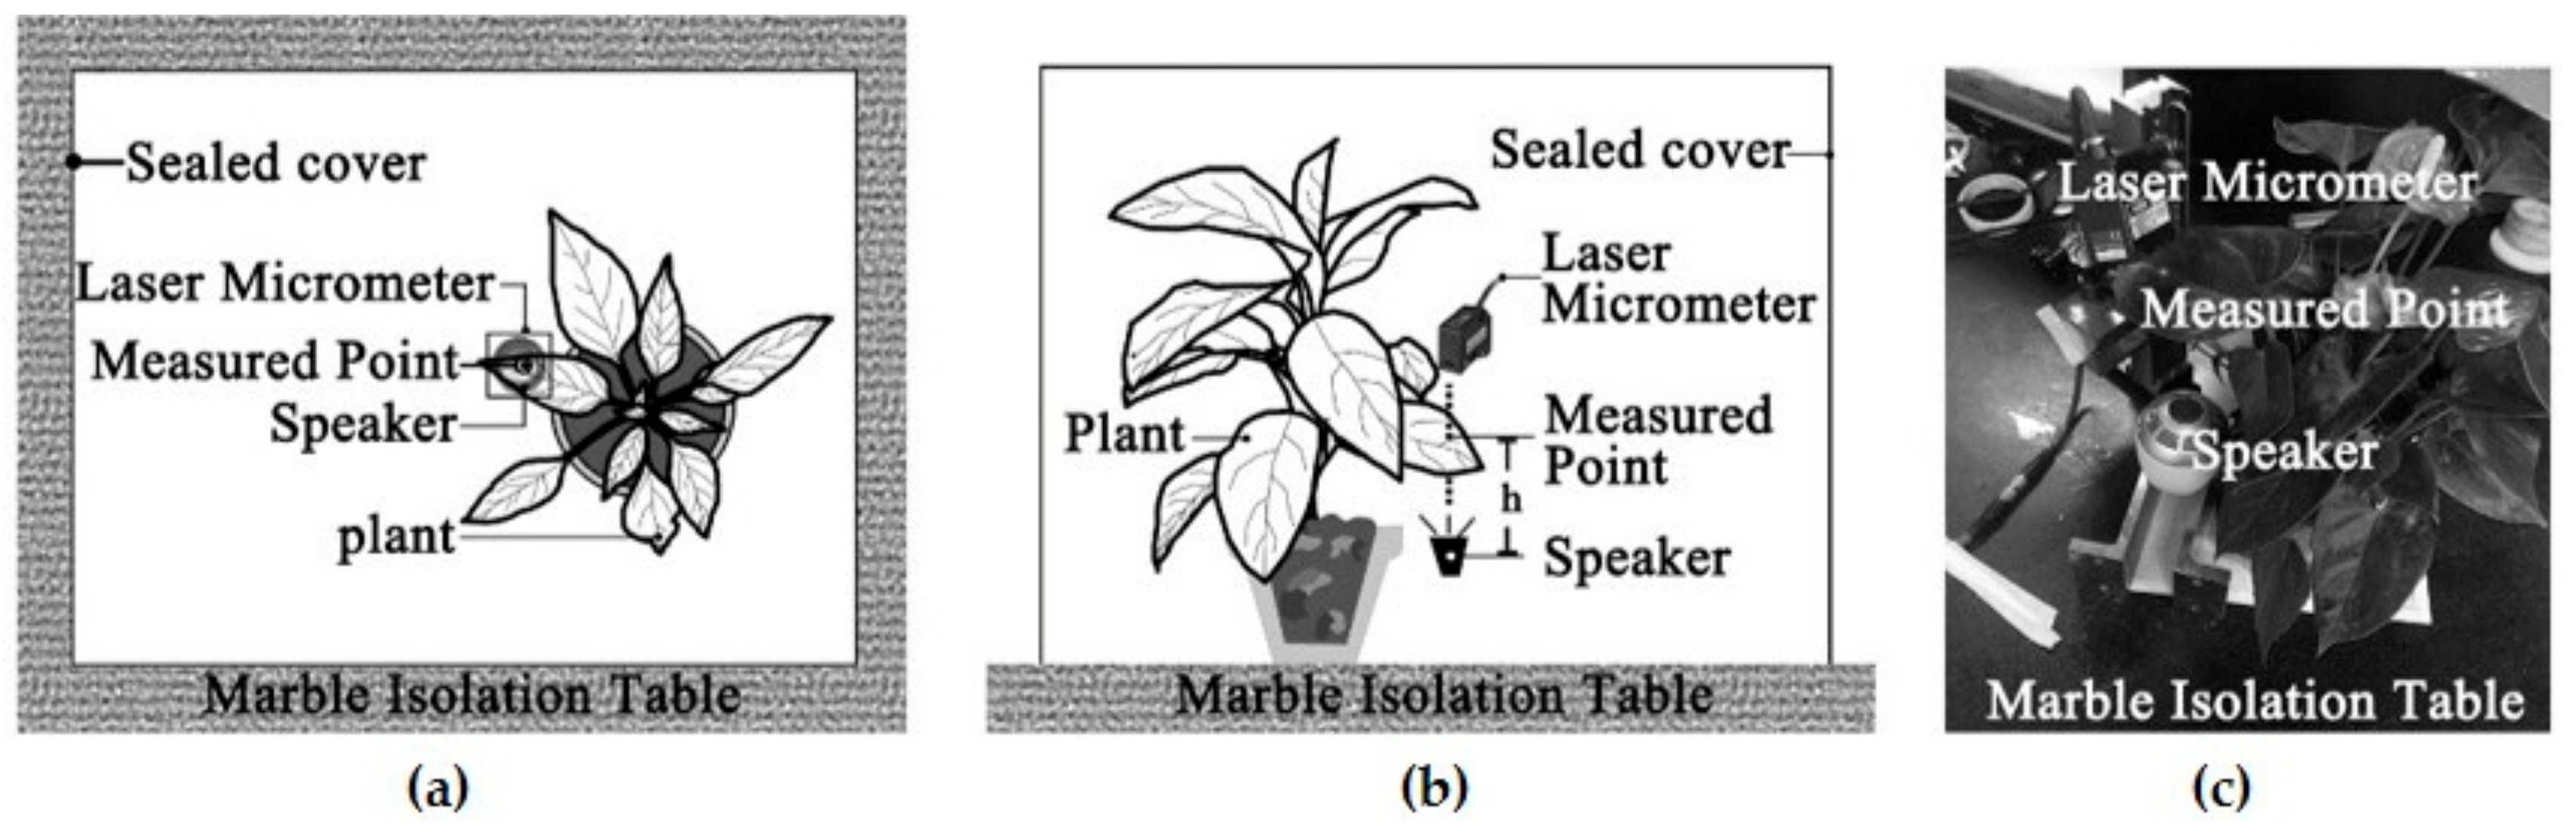
To determine how plants respond to sound, researchers examined plant sound scattering paths, sound absorption coefficients and vibrations. It was found that plants respond to sound mainly through friction between the leaves and the air and by leaf vibrations. Martens [
17] used a laser-Doppler-vibrometer system to measure acoustic energy absorption by plant leaves. All leaves behaved as linear mechanical systems in response to sound fields. Moreover, vibrational velocities were lower at the leaf veins than the leaf areas immediately adjacent to them. In that study, however, the leaves were excised from the plants and cut into discs to accommodate the measuring equipment [
18]. Luan and Hou [
19] found that the vibrational frequency of plants after sound stimulation produced a spectral peak at both the frequency of the external stimulus and at twice that frequency. Moreover, the irrigation time of the plants was correlated with the spectral peak of the vibrational frequency. To the best of our knowledge, there has been no previous study on the responses of complete, intact leaves to sound stimuli. In addition, earlier researches focused only on high- or medium-frequency noise reduction by leaves.
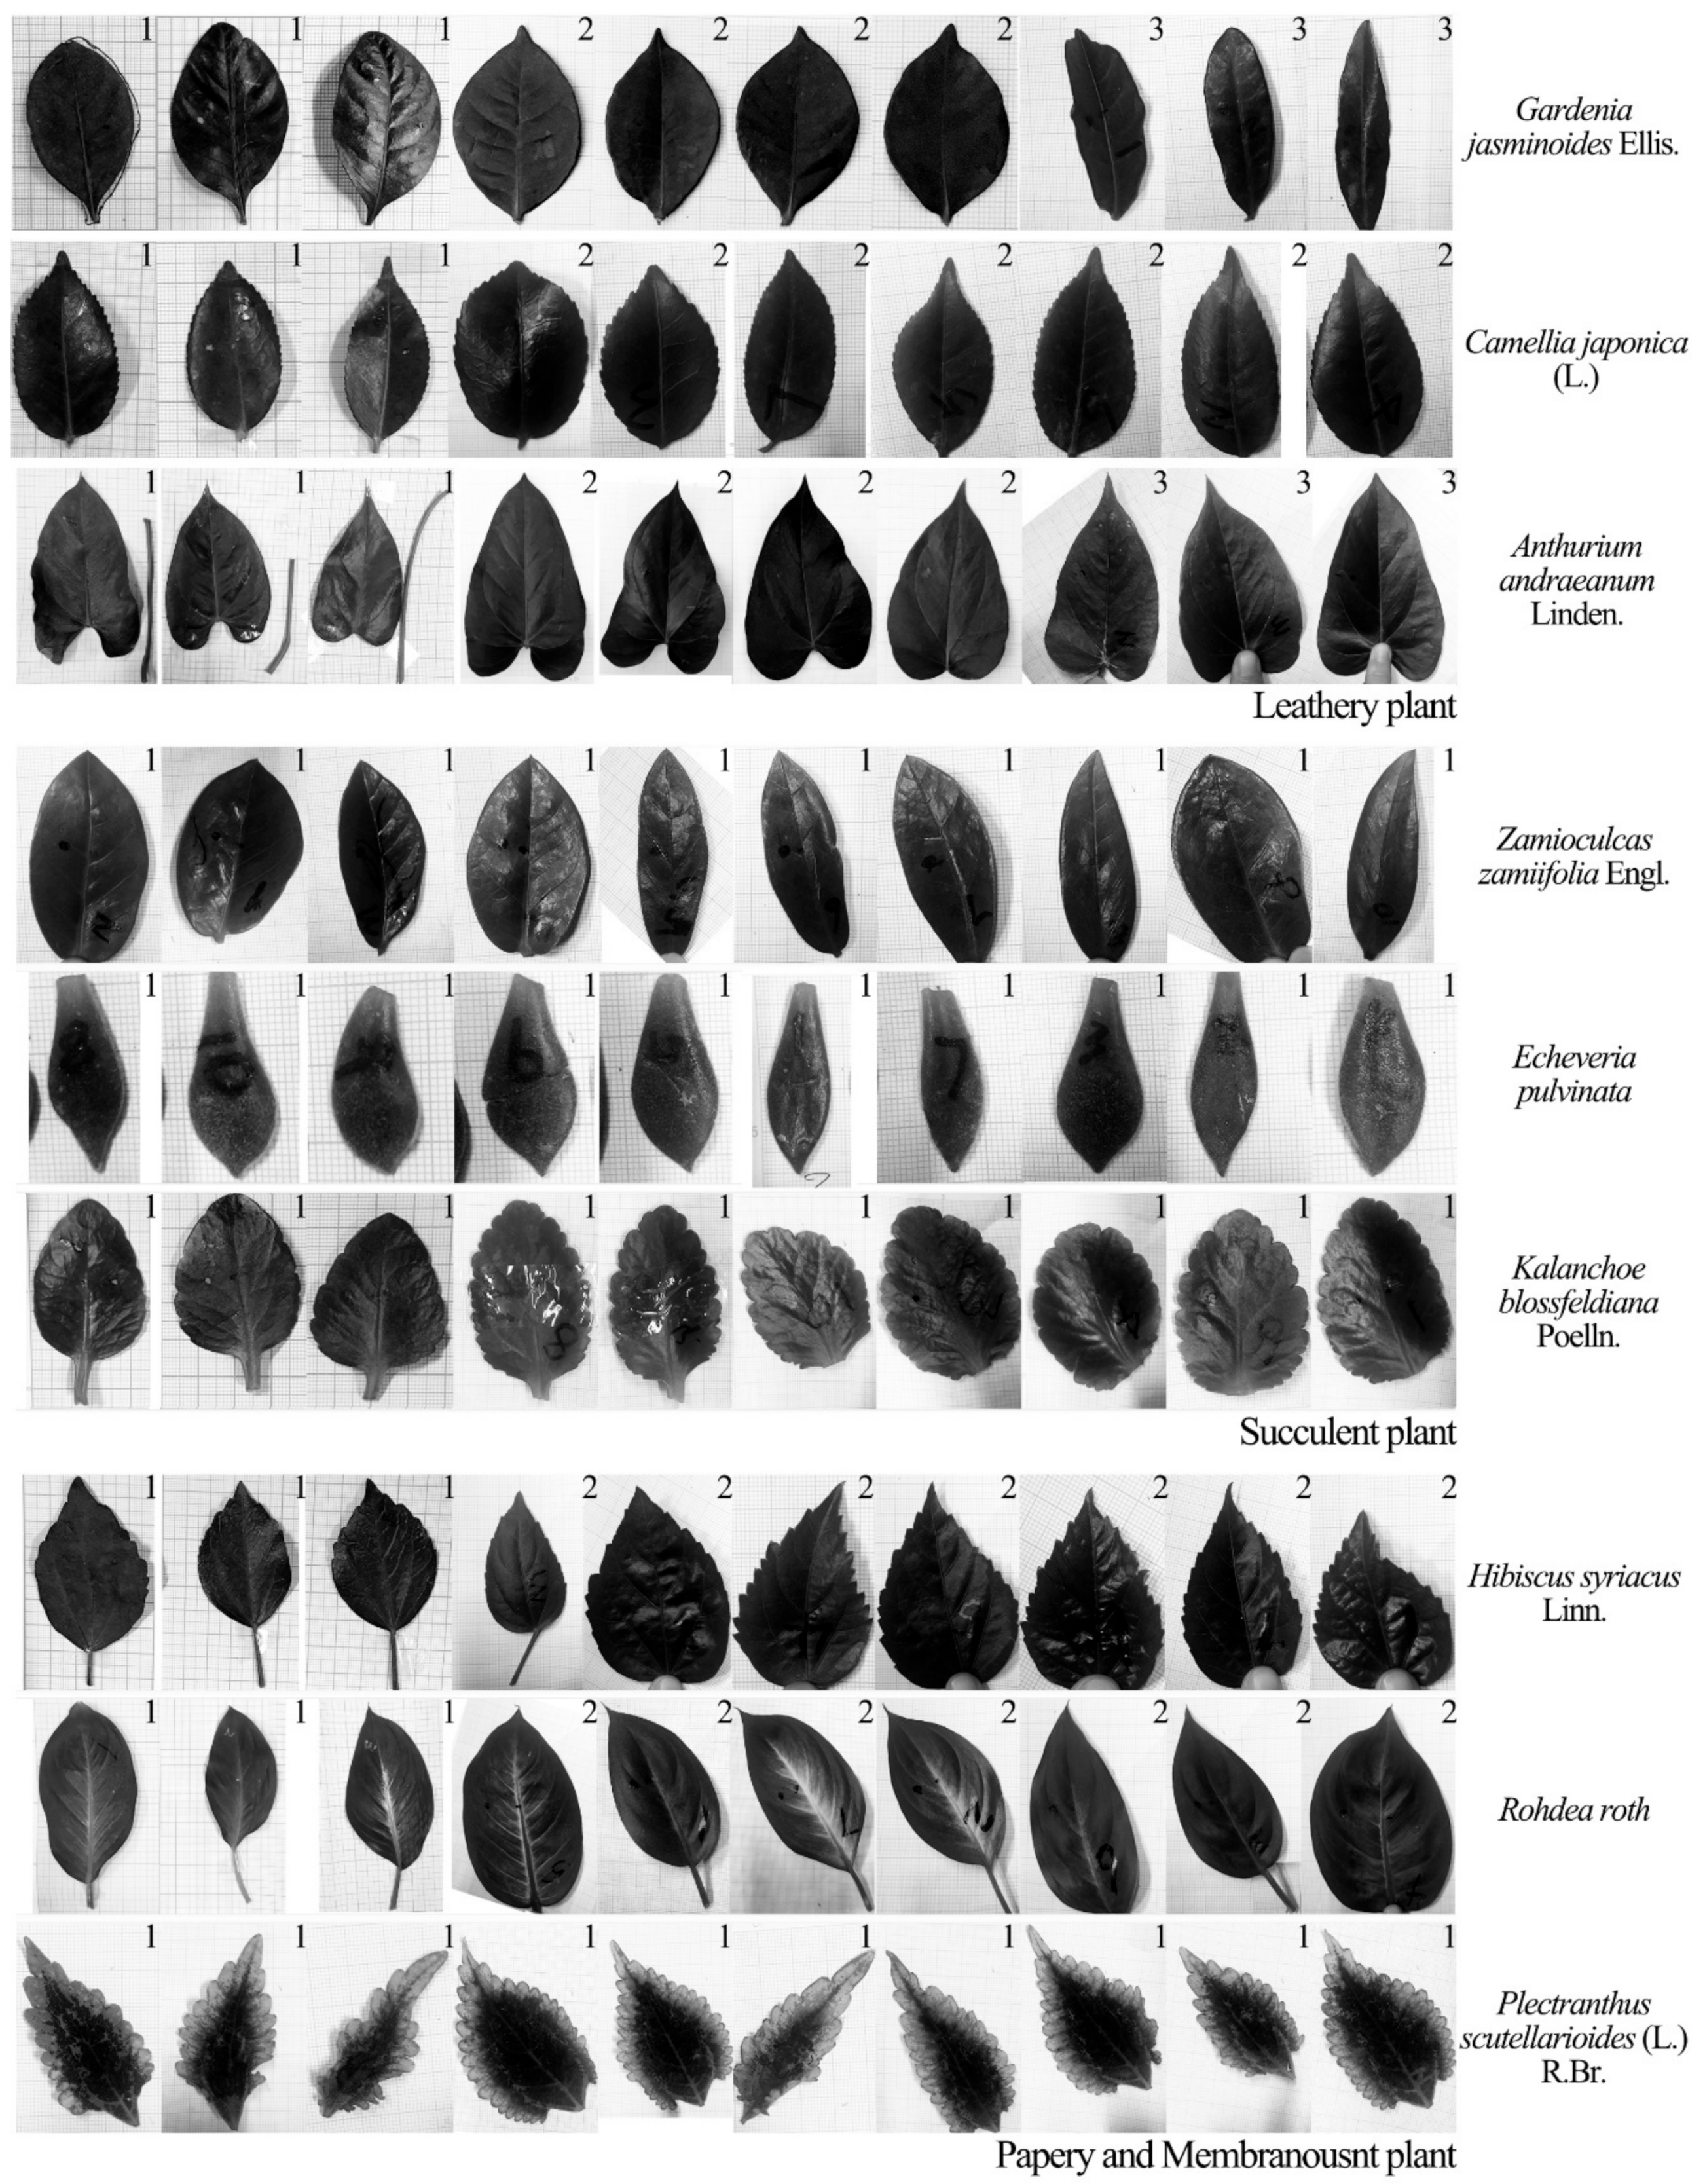
The aim of this study was to examine a single leaf responses to sound vibrations by assessing the influences of leaf physical properties on leaf vibrational amplitude, velocity and frequency before and during sound stimulation, and to explore the reduction of noise by leaf vibration. Ninety complete, intact leaves of nine plant species with a wide range of leaf sizes, qualities and thicknesses and petiole lengths, widths and thicknesses were selected to test the influencing factor of leaf vibration. Five complete leaves were cut from one live tree to measure the effect of noise reduction by a single leaf.
3. Results
3.1. Vibrational Amplitude
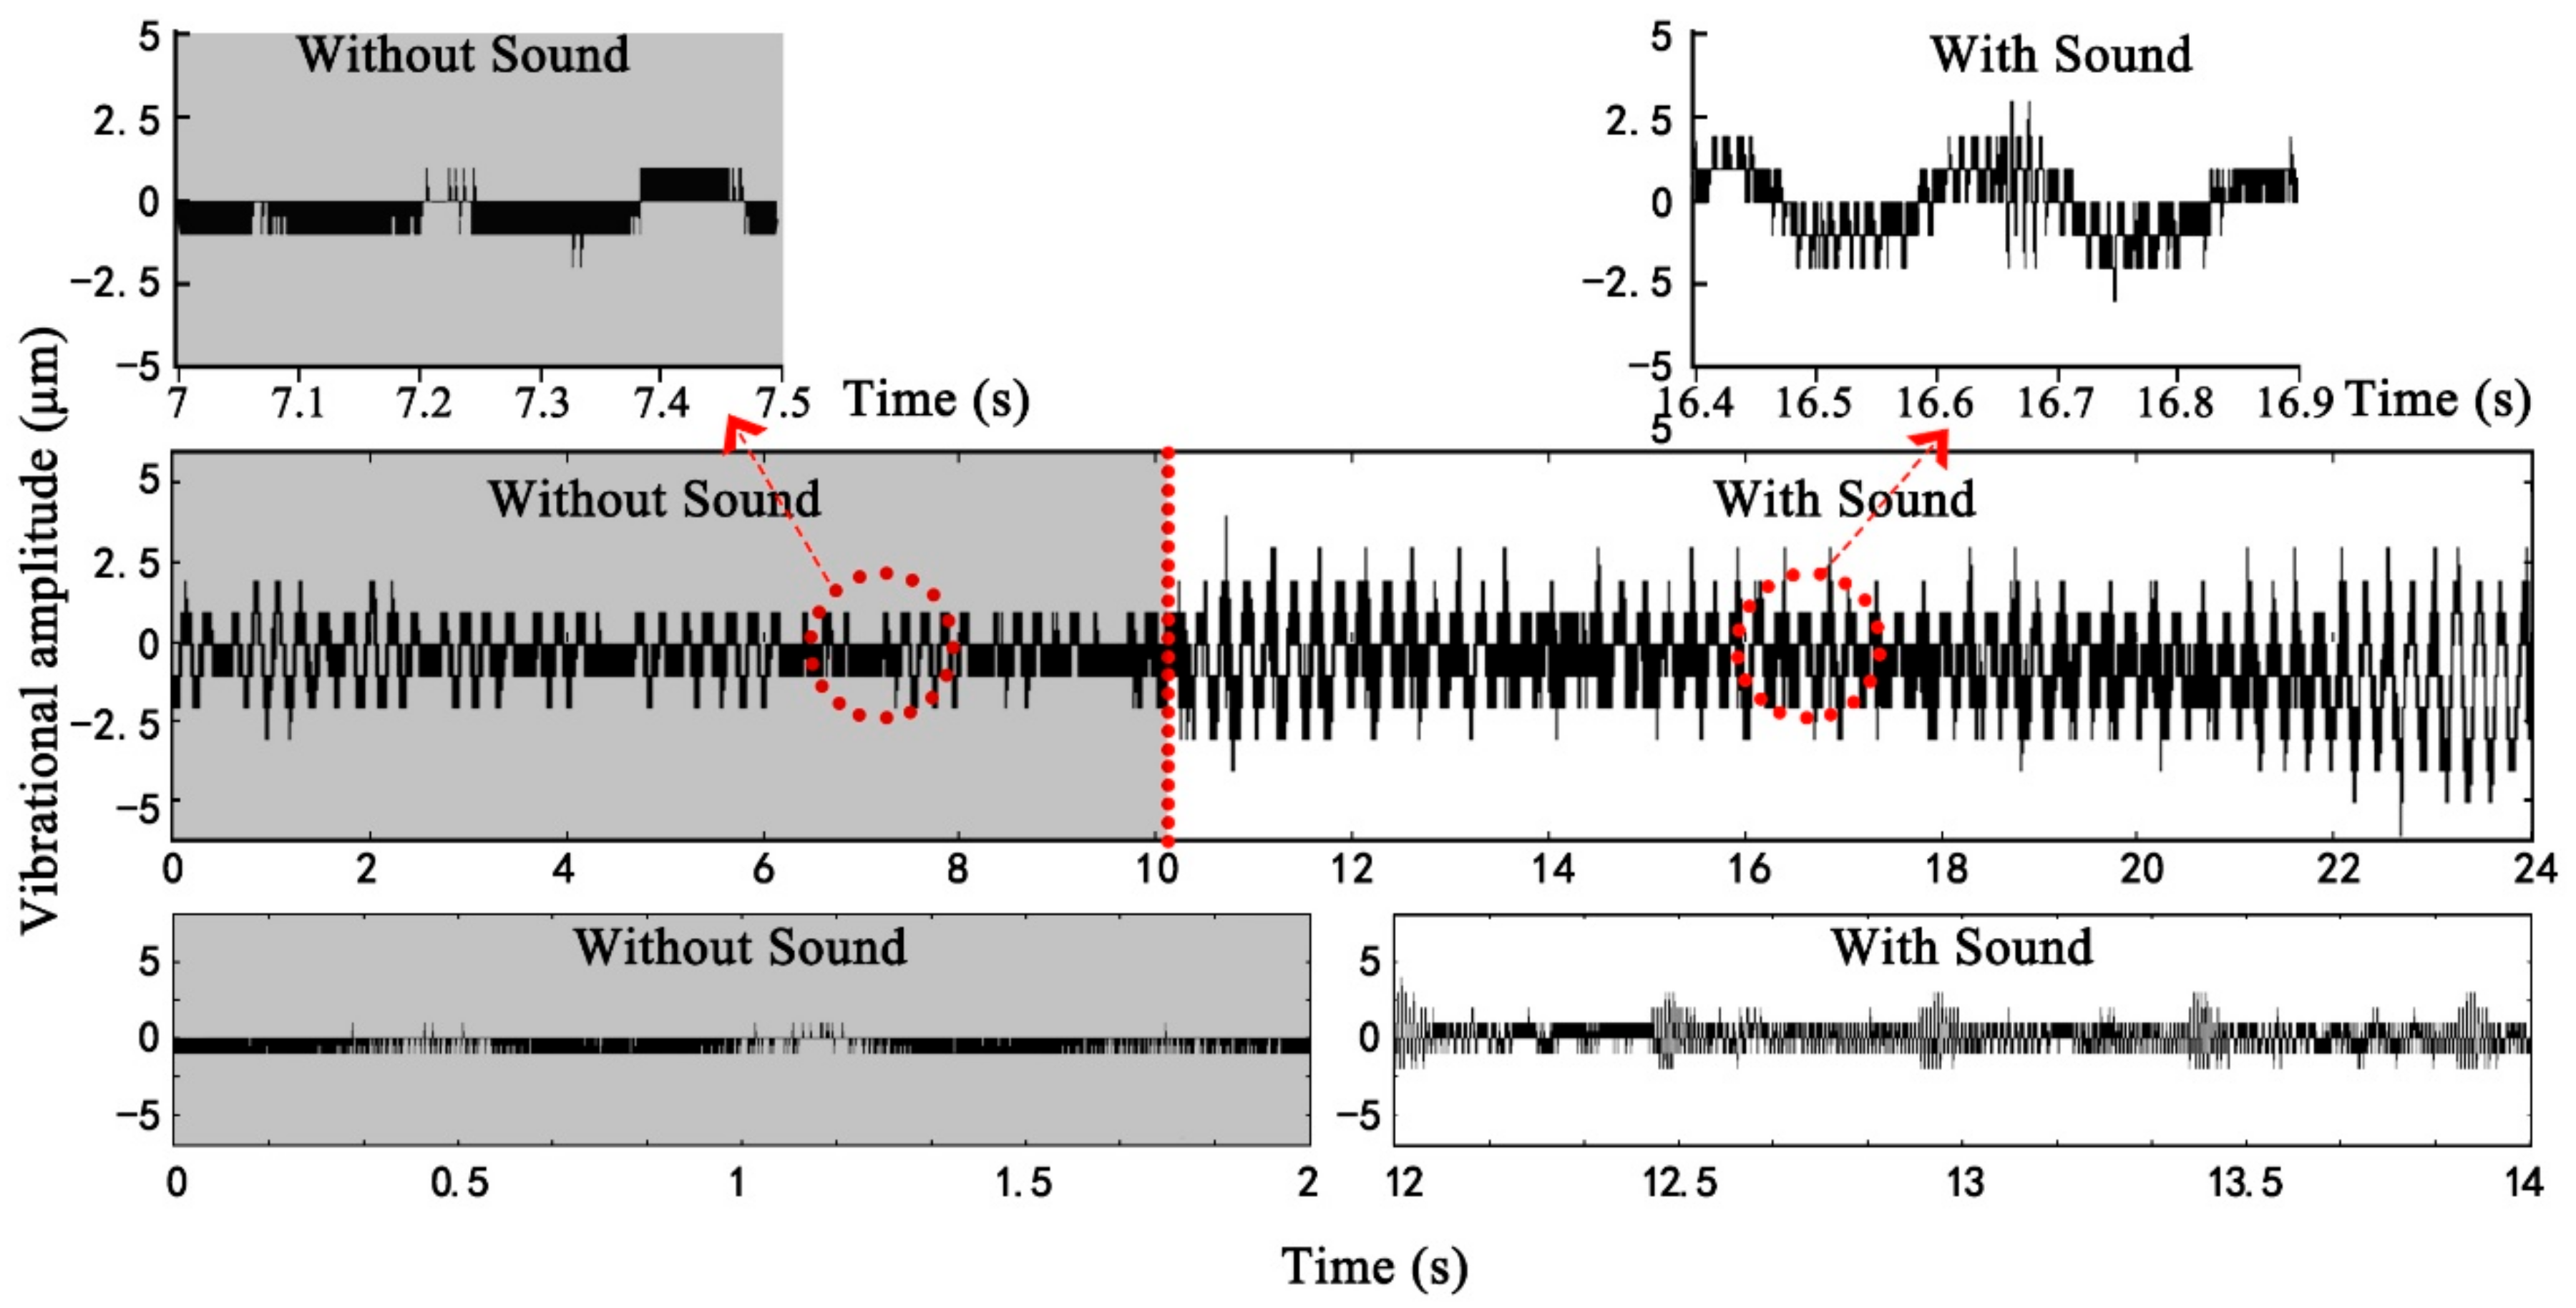
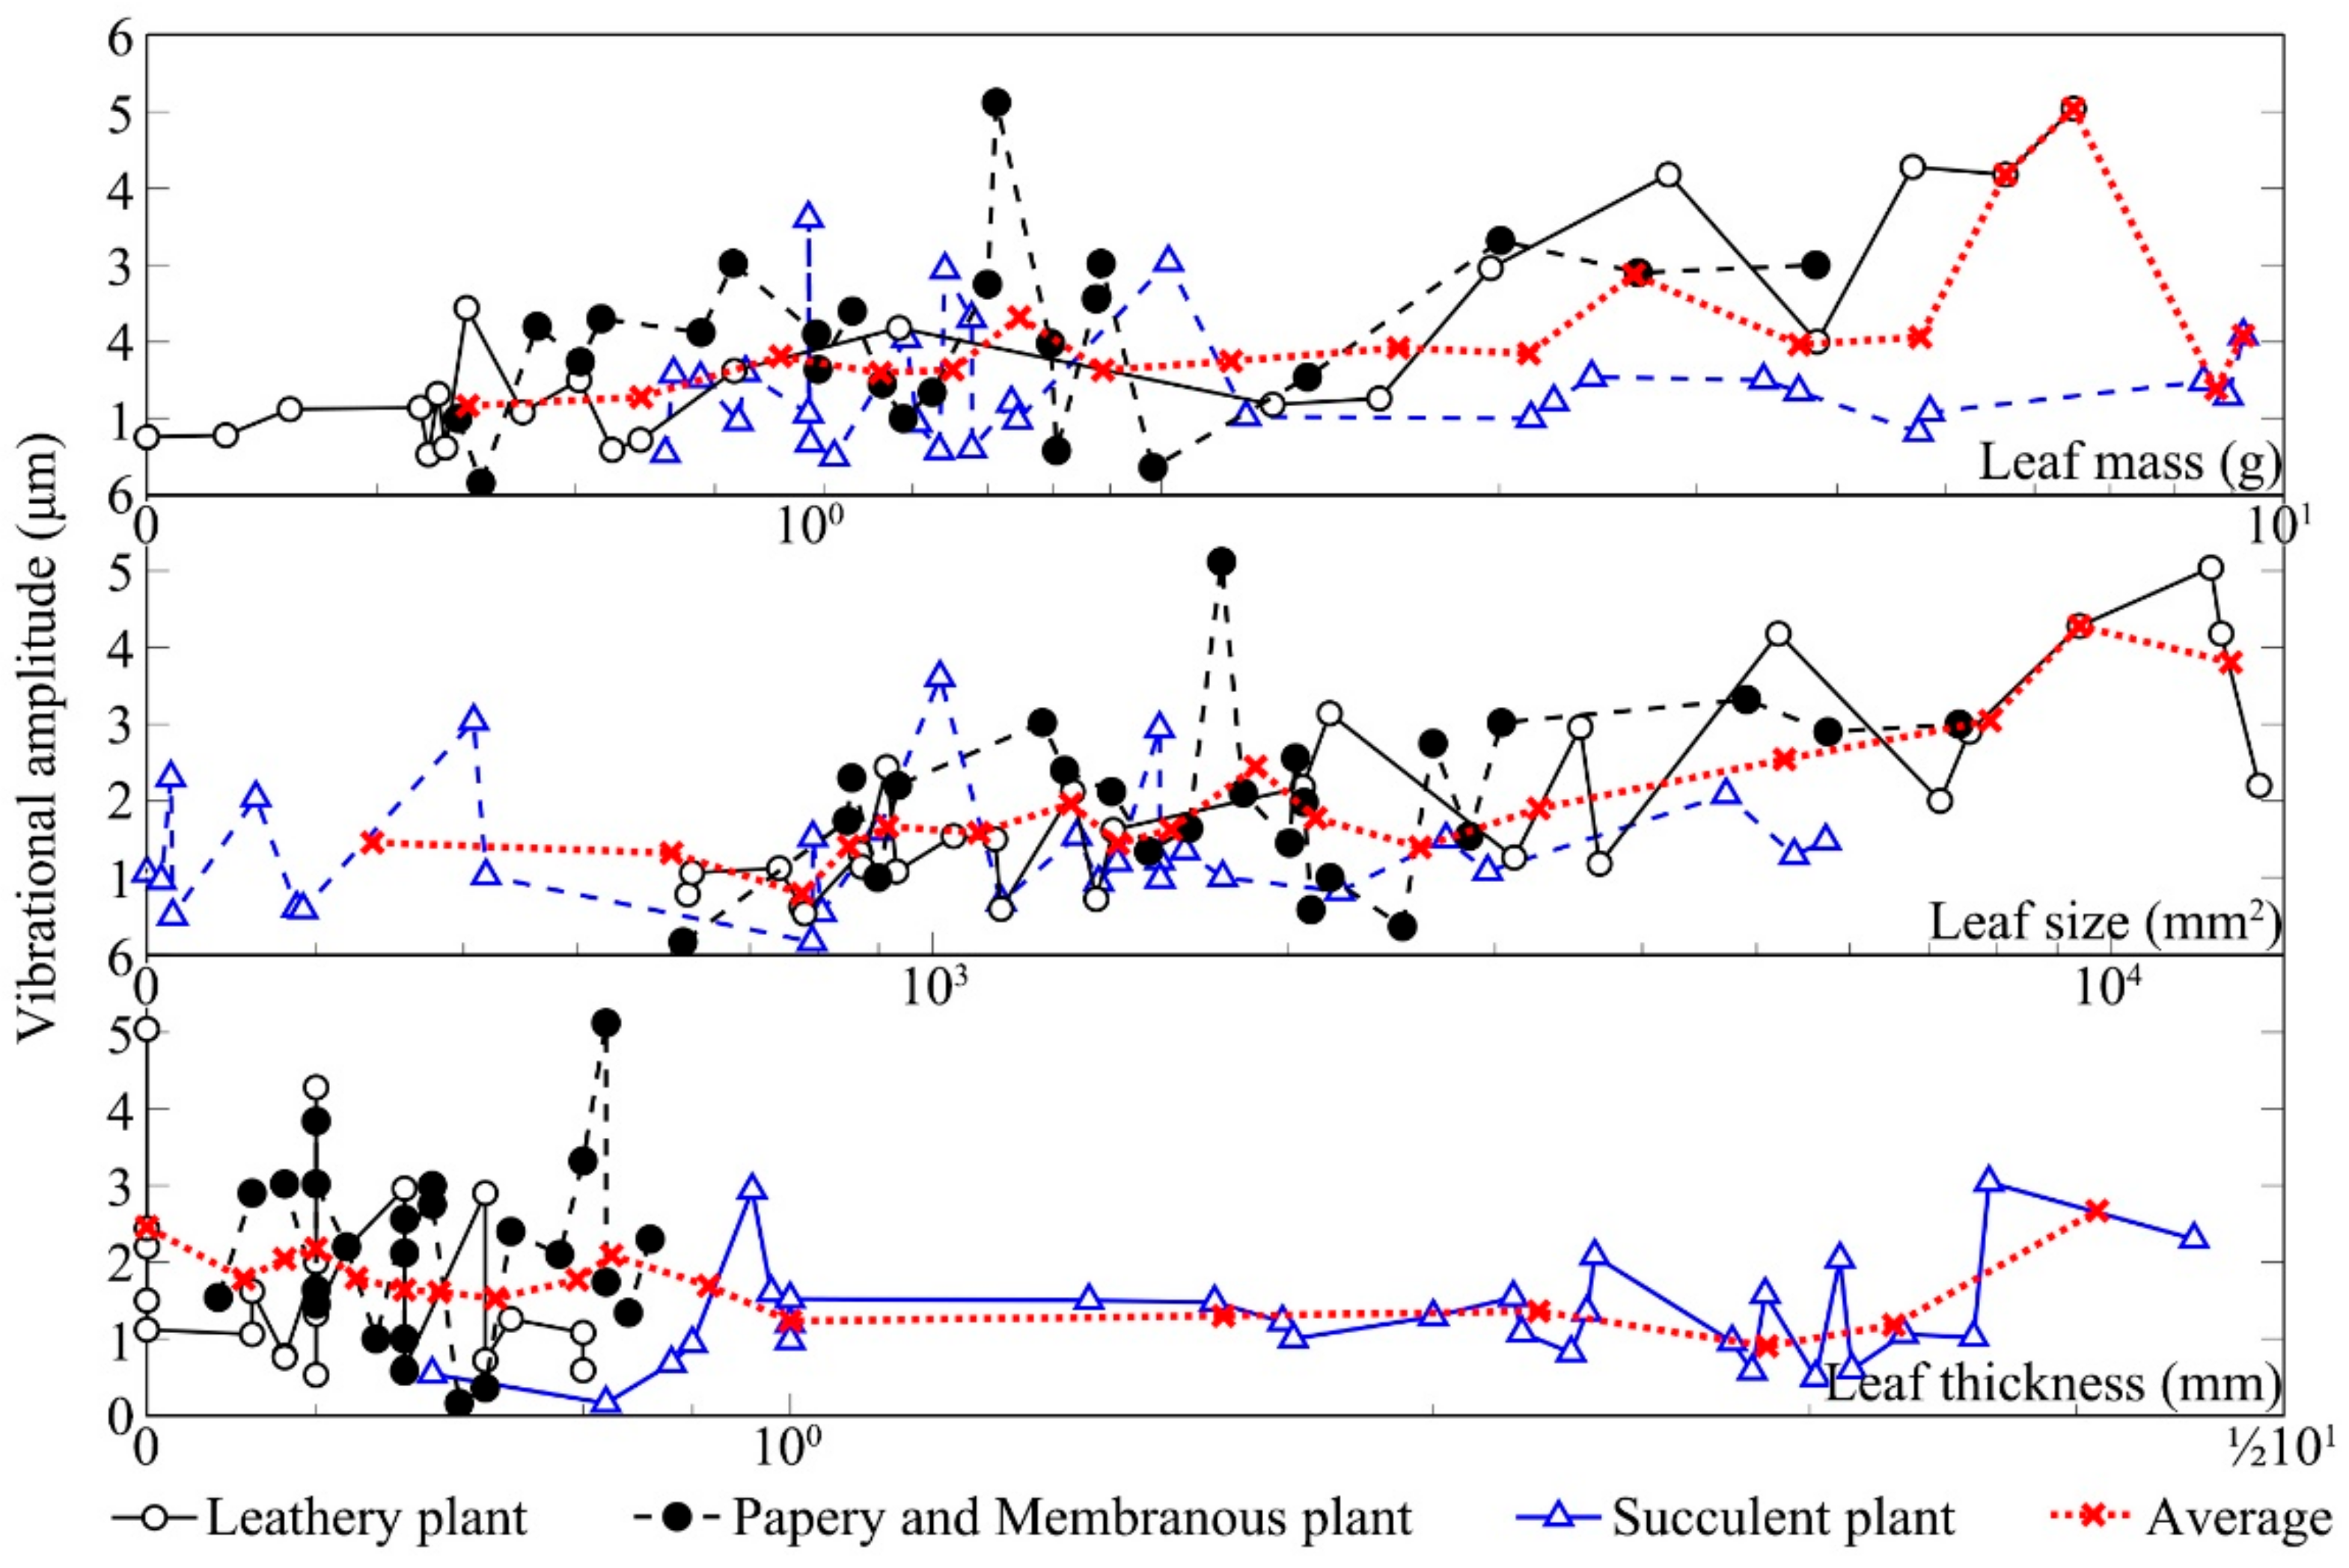
Figure 6 shows the changes in vibrational amplitudes of the leaves from three kinds of leaf textures after being stimulated by sound. The vibrational amplitude of a plant leaf in the absence of any sound stimulus was ~1 μm. Compared with the unstimulated condition, the leaf vibrational amplitude increased by 1–5.4× in response to the sound field. Under the same sound field, the leaf vibrational amplitudes of different plants varied several fold mainly because of relative differences in leaf texture. The size of leathery leaves and the thickness of succulent leaves were large, leading to higher amplitudes. After sound stimulus, the vibrational amplitudes of leathery leaves and papery and membranous leaves significantly increased compared with those for the unstimulated leaves. The vibrational amplitudes of the succulent leaves in the sound field were only slightly higher than those of the unstimulated because they contained more water and have greater thickness. Note that the
Zamioculcas zamiifolia Engl. leaf was a unique succulent resembling a leathery plant, which might be the reason that some succulent leaves had a clear increase in vibrational amplitude. Except for succulent leaves, the vibrational amplitude increased with the increase in leaf size and mass whilst it decreased with the increase in leaf thickness.
Leaf vibrational amplitude varied with texture and physical properties. Measurement of the vibrational amplitudes of 90 leaves from nine plants in the sound field indicated that leaf size, thickness and mass, and petiole length, width and thickness all influenced the increase in leaf vibrational amplitude, as shown in
Table 3. According to the analysis of the vibrations of leaves with different textures, none of the six factors was significantly correlated with the increase in the vibrational amplitude of the papery and membranous leaves (
p < 0.05). Moreover, there was no significant difference in the Kendall correlation coefficients between leaf physical characteristics and increased vibration amplitude of succulent plants without petioles. For leathery plants, there were significant correlations between leaf vibrational amplitude increase and leaf size, leaf mass, petiole length and petiole thickness (
p < 0.01). For all plant leaves, leaf size, leaf mass, petiole length and petiole thickness were weakly positively correlated with leaf vibrational amplitude increase (
p < 0.05).
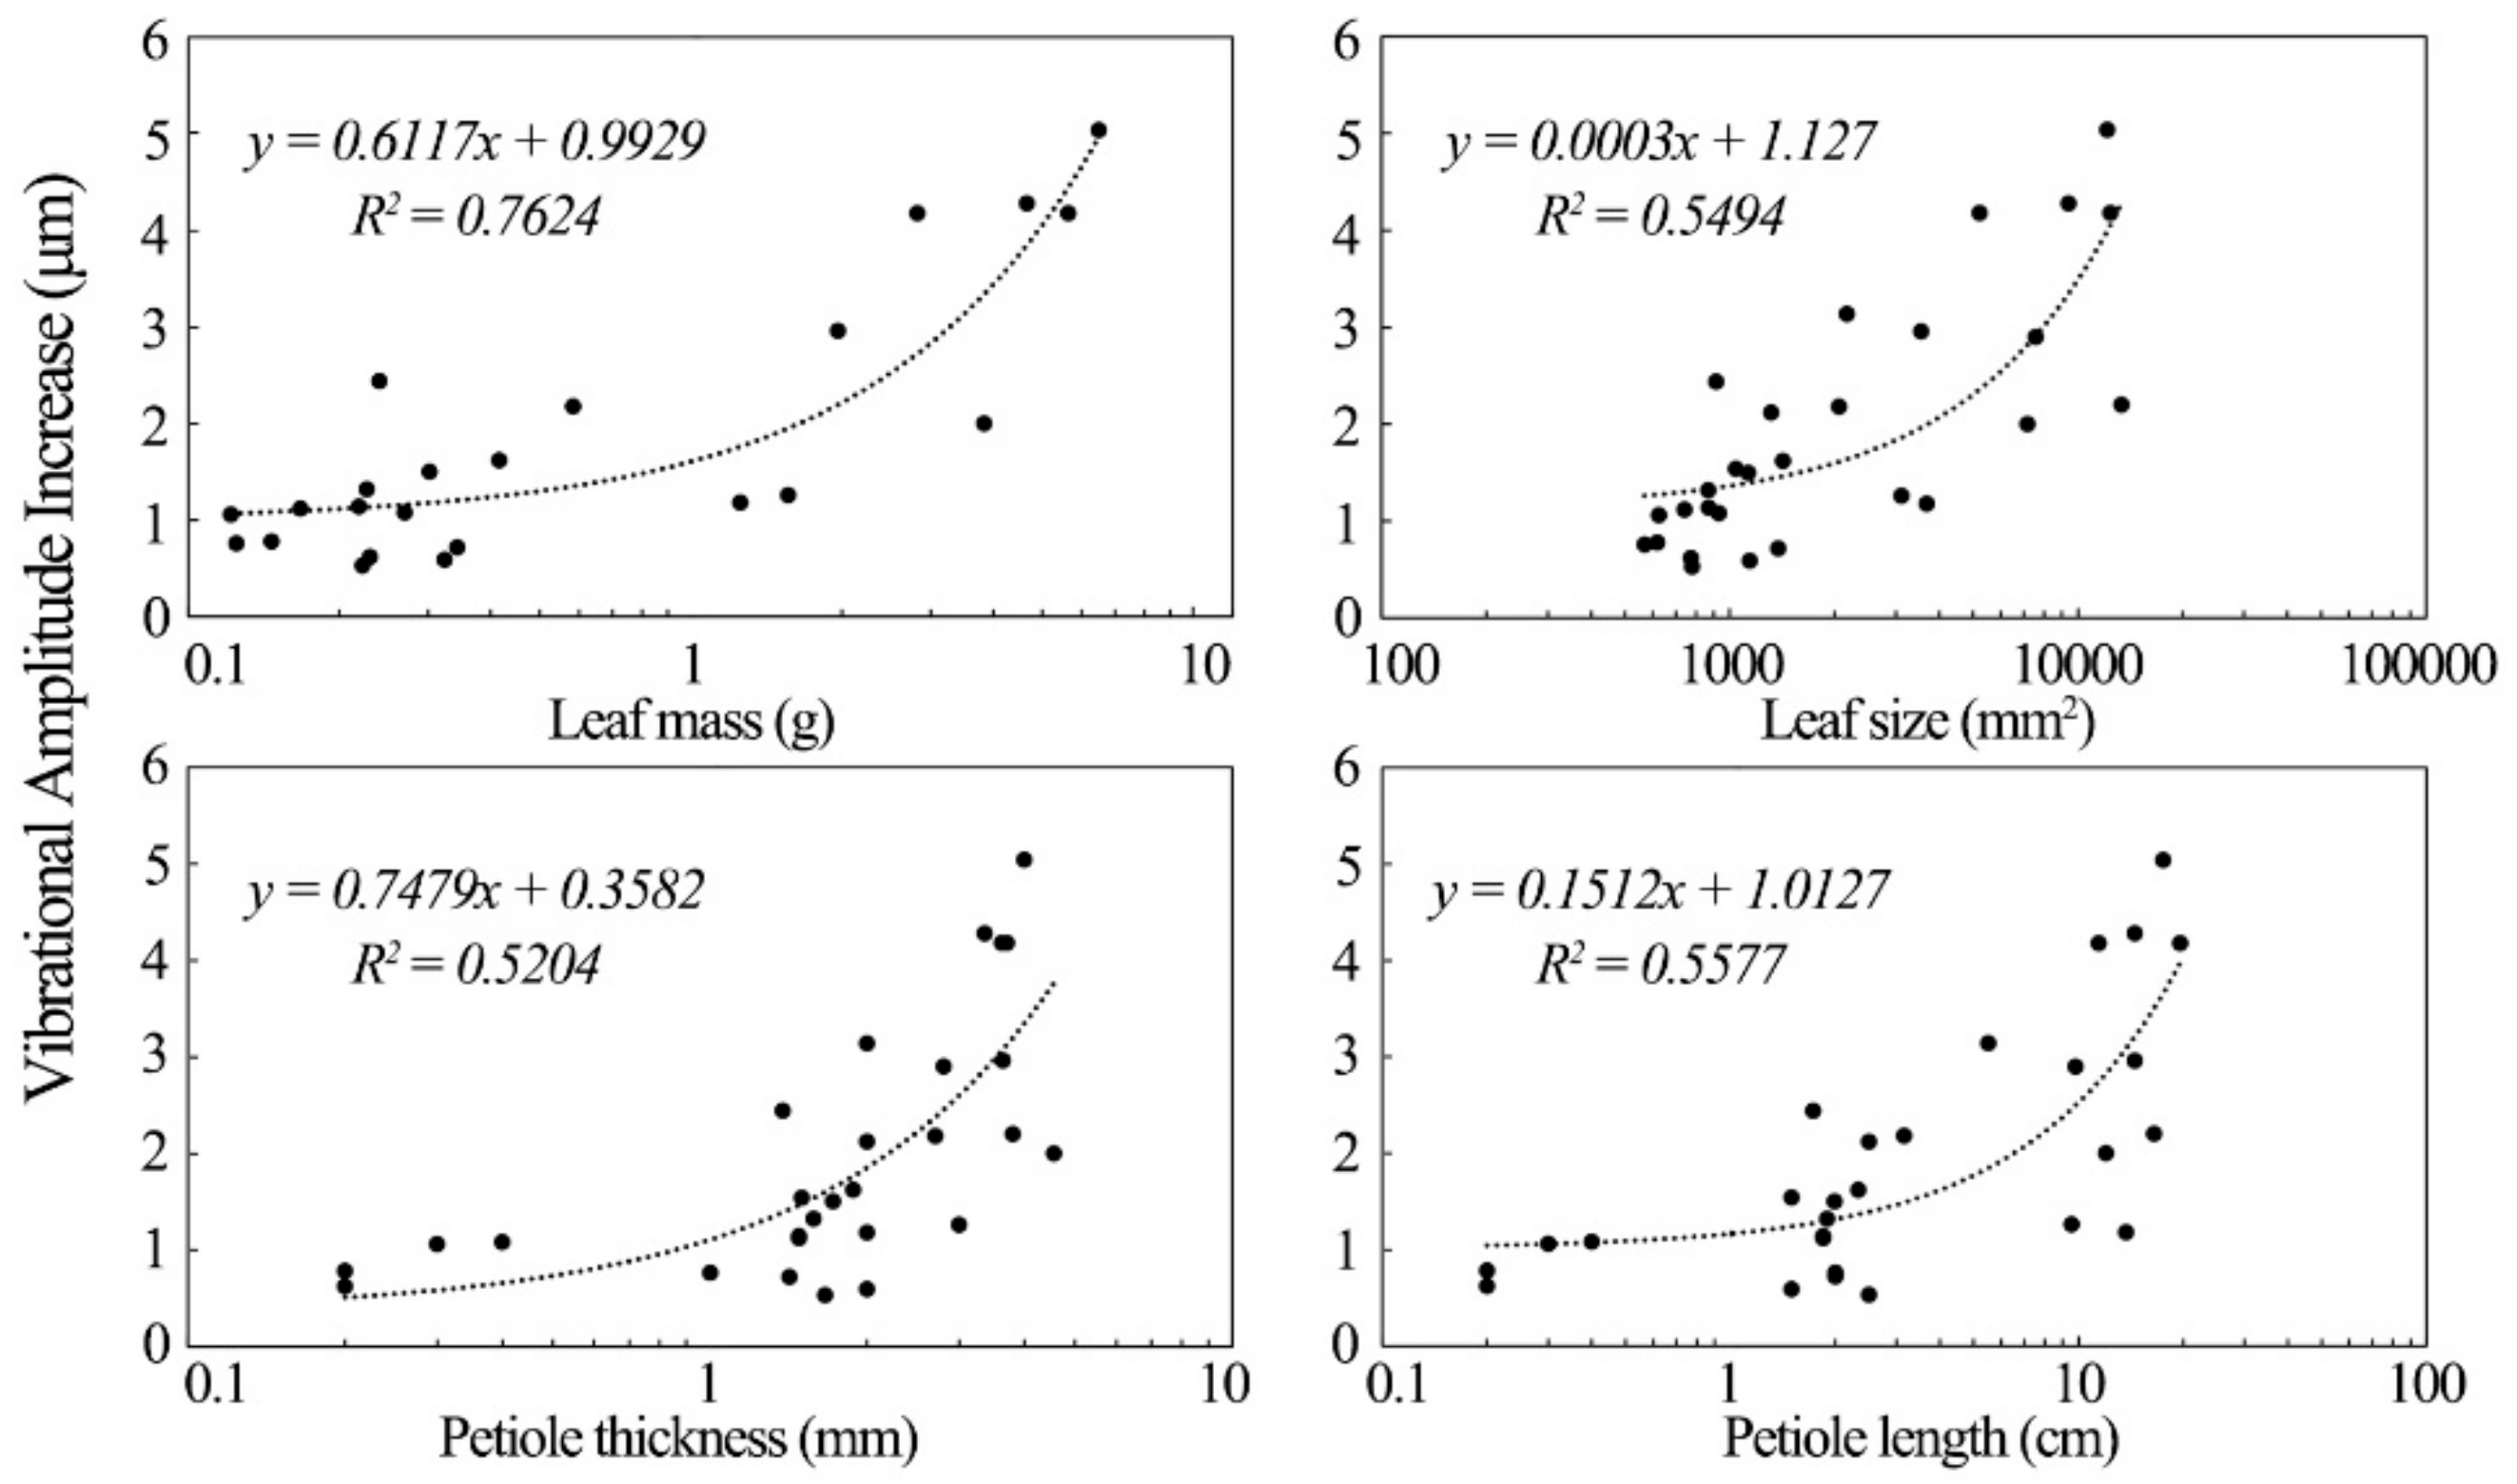
The increase in the vibrational amplitude of the leathery leaves exposed to sound was significantly correlated with their physical properties.
Figure 7 shows the factors influencing the increases in the vibration of leathery plant leaves. Leathery leaf vibrational amplitude varied directly with leaf mass. The latter was the most important factor affecting the increase in vibrational amplitude of leathery leaves in the sound field. Leaf size, petiole length and thickness were also positively correlated with the increase in leaf vibrational amplitude of leathery plants. Although leathery petiole width was also positively correlated with vibrational amplitude, its R
2 was small, and no further analysis was conducted on it.
3.2. Vibrational Velocity
Similar to vibrational amplitude, leaf vibrational velocity was also influenced by the leaf texture and physical property.
Figure 8 shows the changes in leaf vibrational velocity from three different textures after sound stimulation. Both leathery leaves and papery and membranous leaves significantly increased with sound stimulation relative to those measured in the absence of sound. The vibrational velocity of all plant leaves was ~0.05 mm s
−1 when there was no sound stimulus. When the leaves were exposed to sound, however, the vibrational velocity increased to 1–2 mm s
−1. Nevertheless, the vibrational velocity of the leaves of succulent plants did not markedly increase after sound stimulation compared to that measured in the absence of sound. As shown in
Figure 7, the vibrational velocity of leathery leaves and papery and membranous leaves increased with the increase in leaf size and mass. Except for succulent leaves, with the increase in leaf thickness, the leaf vibrational velocity decreased.
To evaluate the influence of leaf texture on the increases in vibrational velocity, measurements were taken on leathery leaves, succulent leaves and papery and membranous leaves before and during sound stimulation.
Table 4 shows the influencing factors on the increase in leaf vibrational velocity analysed by Kendall correlation. For leathery plants, except for leaf thickness, all the other physical properties were positively correlated with the increase in vibrational velocity at the 5% statistical significance level (
p < 0.01). The increase in vibrational velocities of papery and membranous leaves had no connection with all these six factors. In contrast, for succulent plants, only leaf size had a moderate correlation with the increase in vibrational velocity, while leaf mass and thickness had no correlation with the increase in vibrational velocity (
p < 0.05).
3.3. Vibrational Frequency
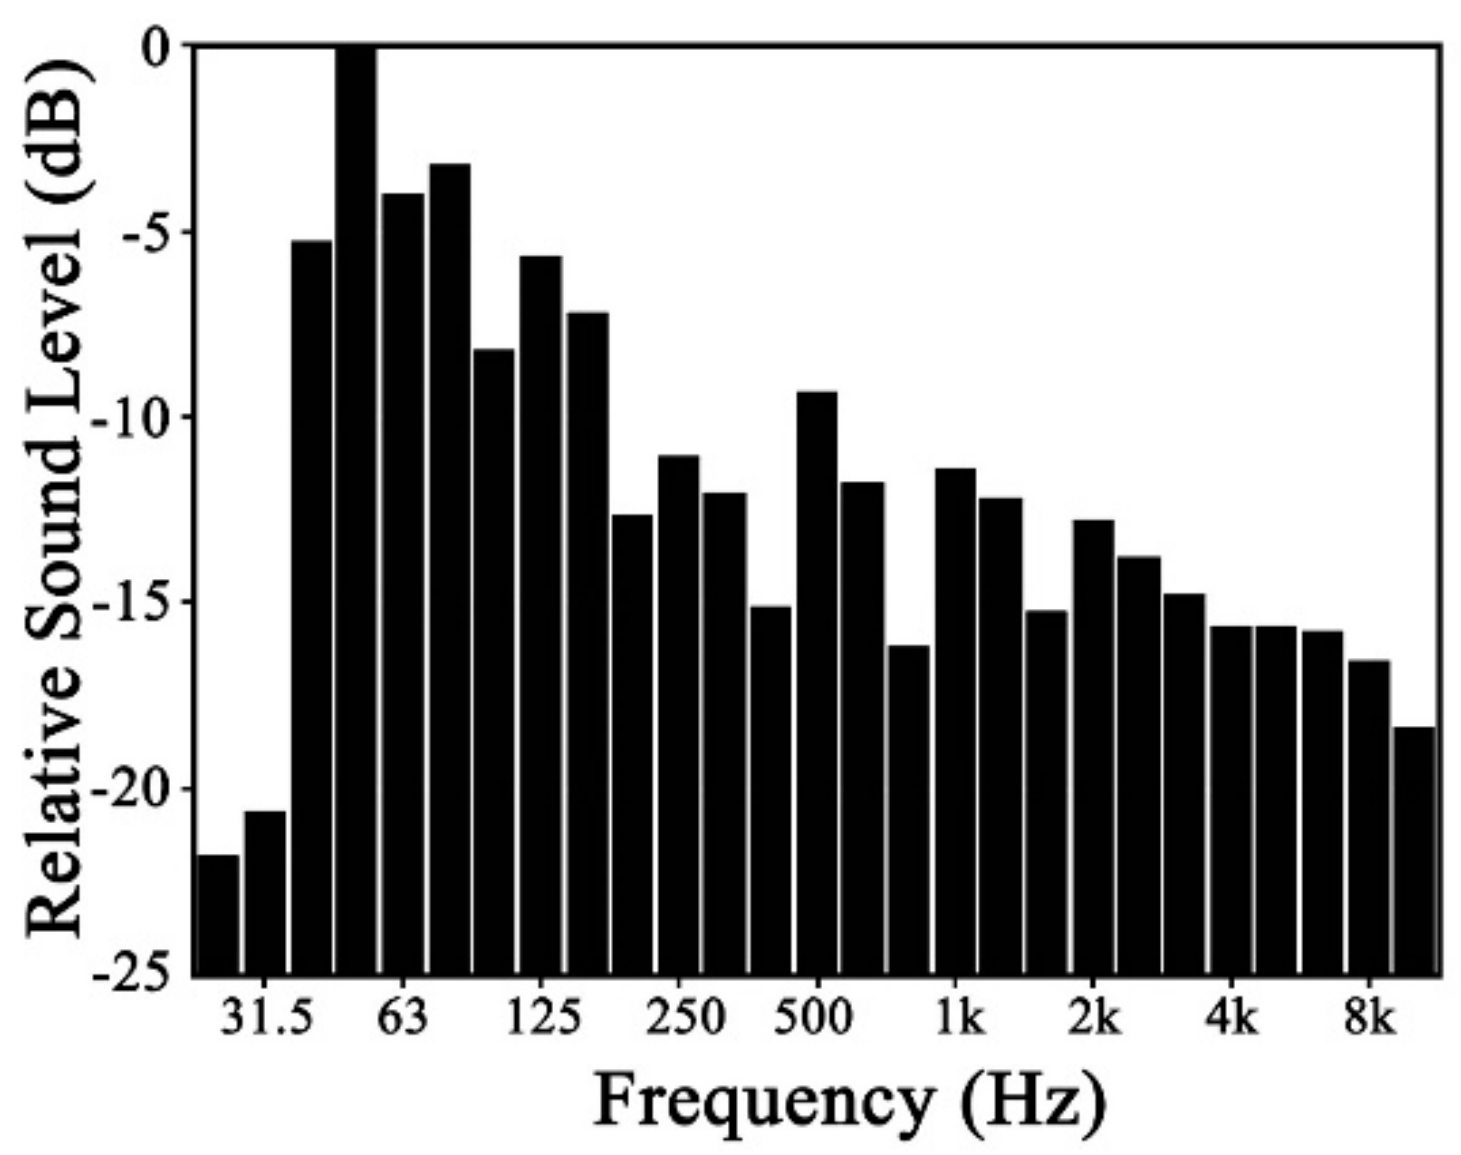
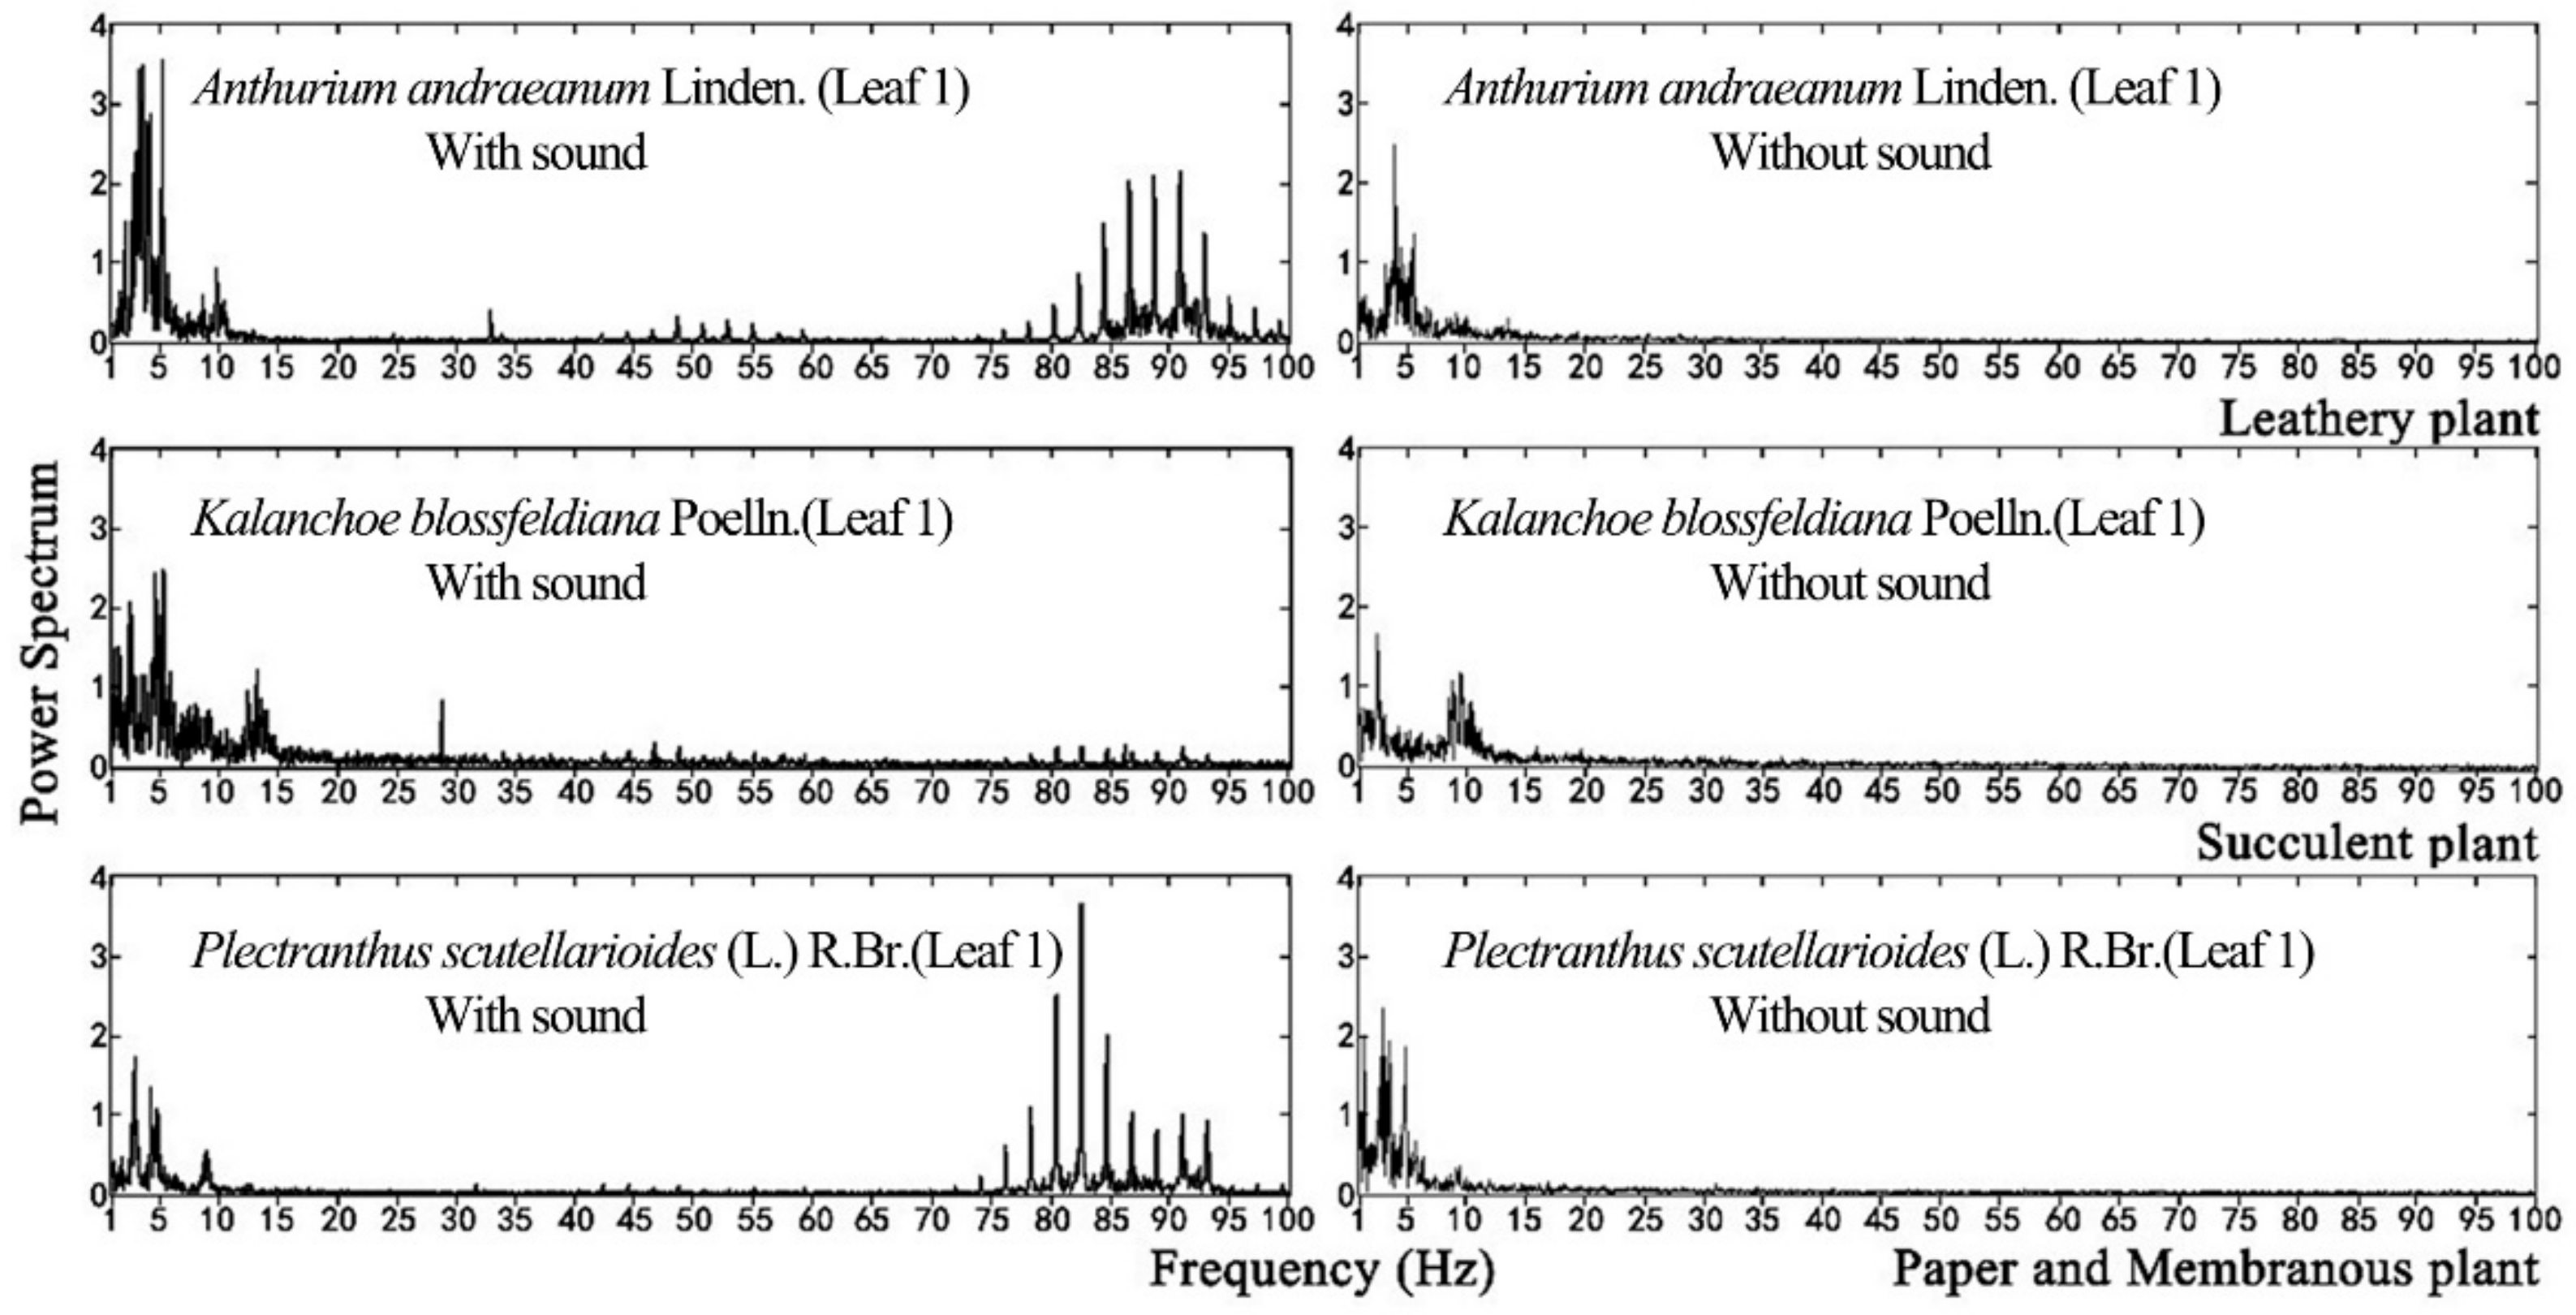
For plant leaf, it can only respond to a specific range of frequencies, which is not correlated to the sound source. In this study, a wide frequency range between 0 Hz and 8K Hz sound source was used to test leaf vibration, which will not miss any important frequencies that leaves can respond to. Plant leaf vibration before and during sound stimulation was concentrated in the low-frequency range, as shown in
Figure 9. Although vibrational frequencies differed among various plant species without stimuli, they tended to be concentrated in the range of 0 to15 Hz. During sound stimulation, however, their vibrational frequencies increased, producing another peak in the range of 80 to 95 Hz.
Within the same sound field, leaf vibrational frequency varied with the physical properties of the leaf. The leaf amplitude, vibrational velocity and vibrational frequency differed among plant species exposed to sound stimuli because their leaves had different textures. The physical properties of leaves with the same texture were the main factors affecting their vibration.
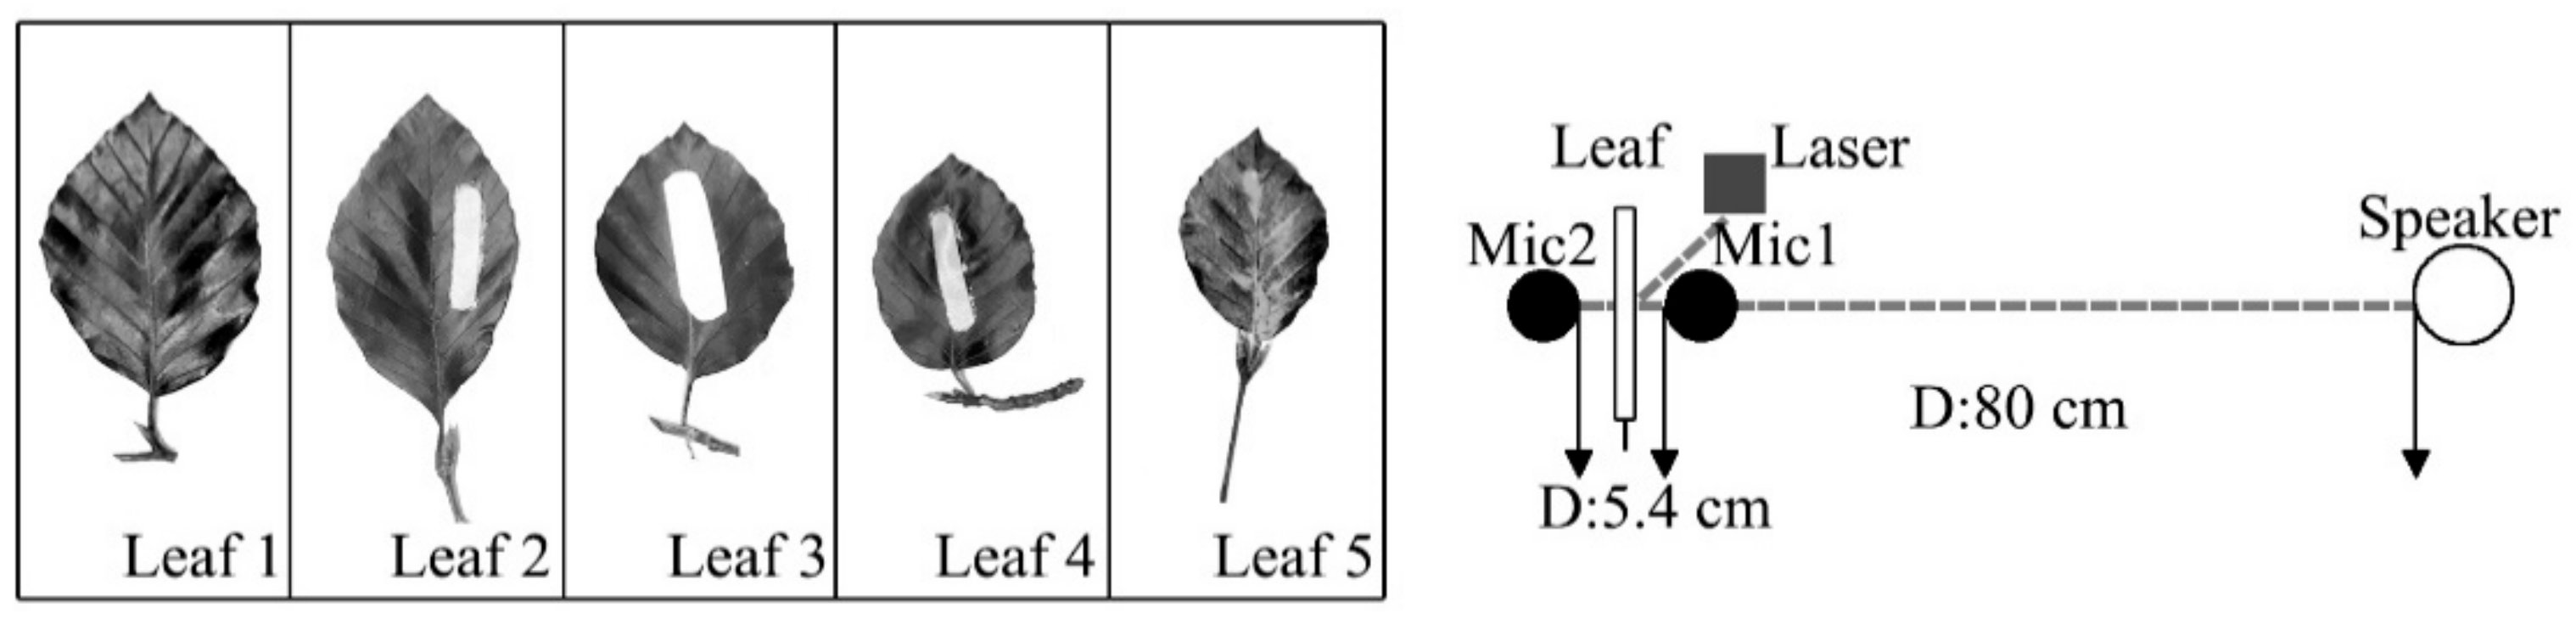
3.4. Noise Reduction by a Single Leaf
In addition to the influencing factors of leaf vibration, it is also important to know the relationship between leaf vibration and noise reduction. A one-way analysis of variance (ANOVA) was used to analyse the difference of the microphones, and the results showed that there was a significant difference between the mean values of microphone 1 and microphone 2, with the statistical significance level of 1% (p = 0.000). While there was no statistical significance in the repeated test of microphone 1 (p = 0.168) and microphone 2 (p = 0.347). To eliminate the influence of the sound pressure level difference between two microphones caused by the sound barrier (leaf), the method of the comparative experiment was adopted under the same setup as the situation of noise reduction experiment. The sound level of the compared test was determined by continuously decreasing the level of sound until the leaf nearly stopped vibrating (v < 0.1 mm s−1). SPL1 was the difference of sound level between two microphones in the situation that the leaf was stimulated to vibrate by sound. SPL2 was the difference of sound level between two microphones in the compared test, which meant that leaf was not stimulated to vibrate as the sound level decreased. The SPLdiff was the difference, namely SPL2 − SPL1, which indicates the SPL effect caused by leaf vibration.
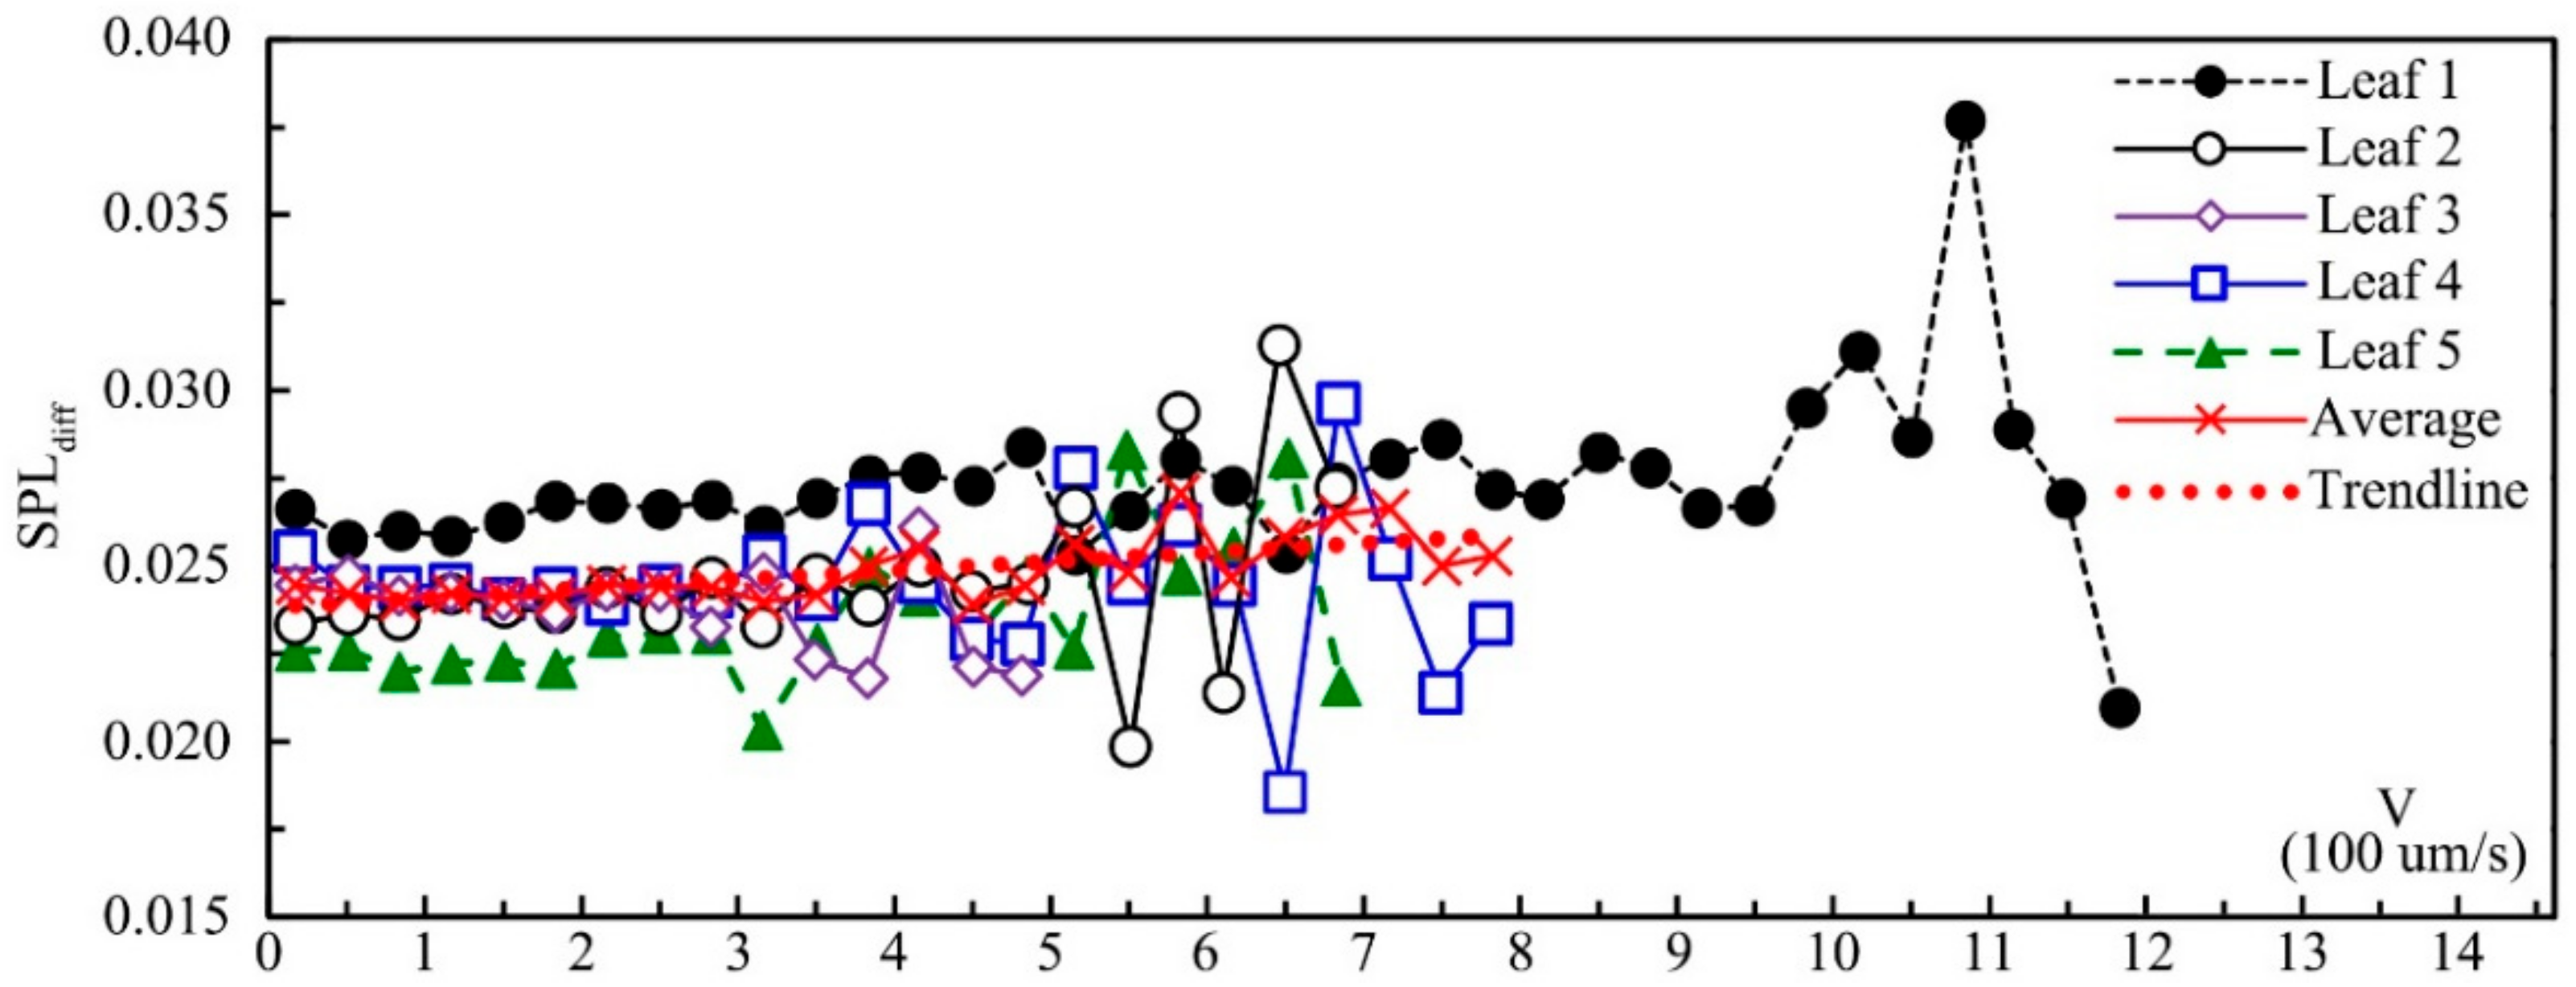
Figure 10 shows the SPL
diff of five leaves influenced by leaf velocity. SPL
diff had a significantly positive correlation with leaf velocity according to Pearson correlation analysis (0.335 **;
p = 0.004), which meant that the effect of noise reduction by leaf vibration increased with the increase in leaf velocity. Other factors, such as leaf textures and physical properties, may also impact SPL
diff. Leaf 1–5 came from the same tree, and the leaf size and mass decreased from leaf 1 to leaf 5. The SPL
diff of leaf 1 was the greatest, and the SPL
diff of leaf 5 was the smallest, which might be caused by the difference in leaf size and mass. Under the same velocity, the difference of SPL
diff between these five leaves was mainly caused by leaf physical properties because for leaf 1–5, leaf texture and physiology properties were the same. Compared with leaf velocity, leaf physical properties (leaf size, thickness and mass) had a greater influence on SPL
diff. For all five leaves, the SPL
diff started to fluctuate and decrease when the vibrational velocity approached the maximum value. According to the relationship between the average value of both velocity and SPL
diff, when the velocity was less than about 0.6 mm s
-1, SPL
diff increased with the increase in velocity and decreased after that threshold. This phenomenon might mainly be caused by the fact that leaves vibrating with higher velocity can also make additional noise.
While noise reduction by a single leaf might be insignificant, as there are thousands of leaves in a tree, the overall effect of noise reduction by leaf vibration could be considerable, for which, in addition to leaf properties, the leaf density and the porosity, for example, should also be taken into account.
4. Conclusions and Discussion
In the present study, vibrational experiments were conducted on the intact leaves of different plants in the sound field to identify leaf responses to sound stimuli. The parameters evaluated were leaf vibrational amplitude, velocity and frequency. The following observations were made:
(1) Without sound stimulation, leaf vibrational amplitude was small (~1 μm). When various plant species were stimulated by the same sound, their leaf vibrational amplitudes increased to ~2–6 μm. The main factor affecting this increase was leaf texture. The leaf vibrational amplitudes of succulent plants did not significantly increase in response to sound stimuli, whereas those of papery and membranous plants increased irregularly. The leaf vibrational amplitudes of leathery plants significantly increased with leaf size, leaf mass, petiole length, and petiole thickness (p < 0.01).
(2) The vibrational velocity of a plant leaf was ~0.05 mm s−1 in the absence of a sound stimulus. For all plants exposed to the same sound field, the leaf vibrational velocity significantly increased to 1–2 mm s−1. The main factor affecting the increase in leaf vibrational velocity was texture. The increase in vibrational velocities of papery and membranous leaves had no connection with leaf physical properties. Whereas, the increase in succulent leaf vibrational velocity in response to sound stimulation was negligible, it was significant in leathery leaves. Leaf size, leaf mass, petiole length, petiole width and petiole thickness were positively correlated with the increase in leaf vibrational velocity.
(3) Without sound stimulation, the vibrational frequency of a plant leaf was concentrated in the range of 0 to 15 Hz. Under the same sound stimulation, the leaf vibrational frequency of various plants had another peak in the vicinity of 80–95 Hz. Comparisons of the vibrational frequencies of leaves before and during sound stimulation indicated that all leaves emit vibrations within the same frequency range as that of the sound source used for the stimulation. Nevertheless, a vibrational frequency within the range of 0 to 15 Hz of the plant leaf remained constant.
In addition, noise reduction by leaf vibration differed significantly between leaves, which may be caused by different leaf physical properties, especially leaf size and mass. When the vibrational velocity was below 0.6 mm s−1, there was a positive correlation between noise reduction and leaf velocity. The noise reduction effect started to fluctuate and decrease when the vibrational velocity approached the maximum value.
In this study, some shortcomings still need to be mentioned. Only directed sound was taken into consideration, which is rare in real life. For a whole tree, the sound would repeatedly scatter between leaves, which may increase noise reduction values. In this study, the sound source used for the experiment was 93.5 dBA, which was high enough, but still failed to significantly stimulate succulent plant leaves. In the future study, it may be possible to raise the sound level of the experimental sound sources to study how succulent plants respond to the sound.
In addition, the plant specimen tested in this study were randomly selected from common plant species in northern China. This study provides a method to identify plants with higher noise reduction potential. To elucidate plant responses to sound, it would be reliable to apply the test method to other plant species. Yang’s [
13] research indicated that the presence of leaves has an influence at high frequencies compared with no leaves, above about 2 kHz, which is mainly caused by the scattering between leaves. While this phenomenon also appeared at a low frequency below 160 Hz, which was mainly caused by leaf vibration. In addition, the sound response of a single whole plant should be assessed to expand our knowledge and understanding of plant acoustics.


