Uncertainty Simulation of Wood Chipping Operation for Bioenergy Based on Queuing Theory


Abstract
1. Introduction
2. Materials and Methods
2.1. Chip Production Time
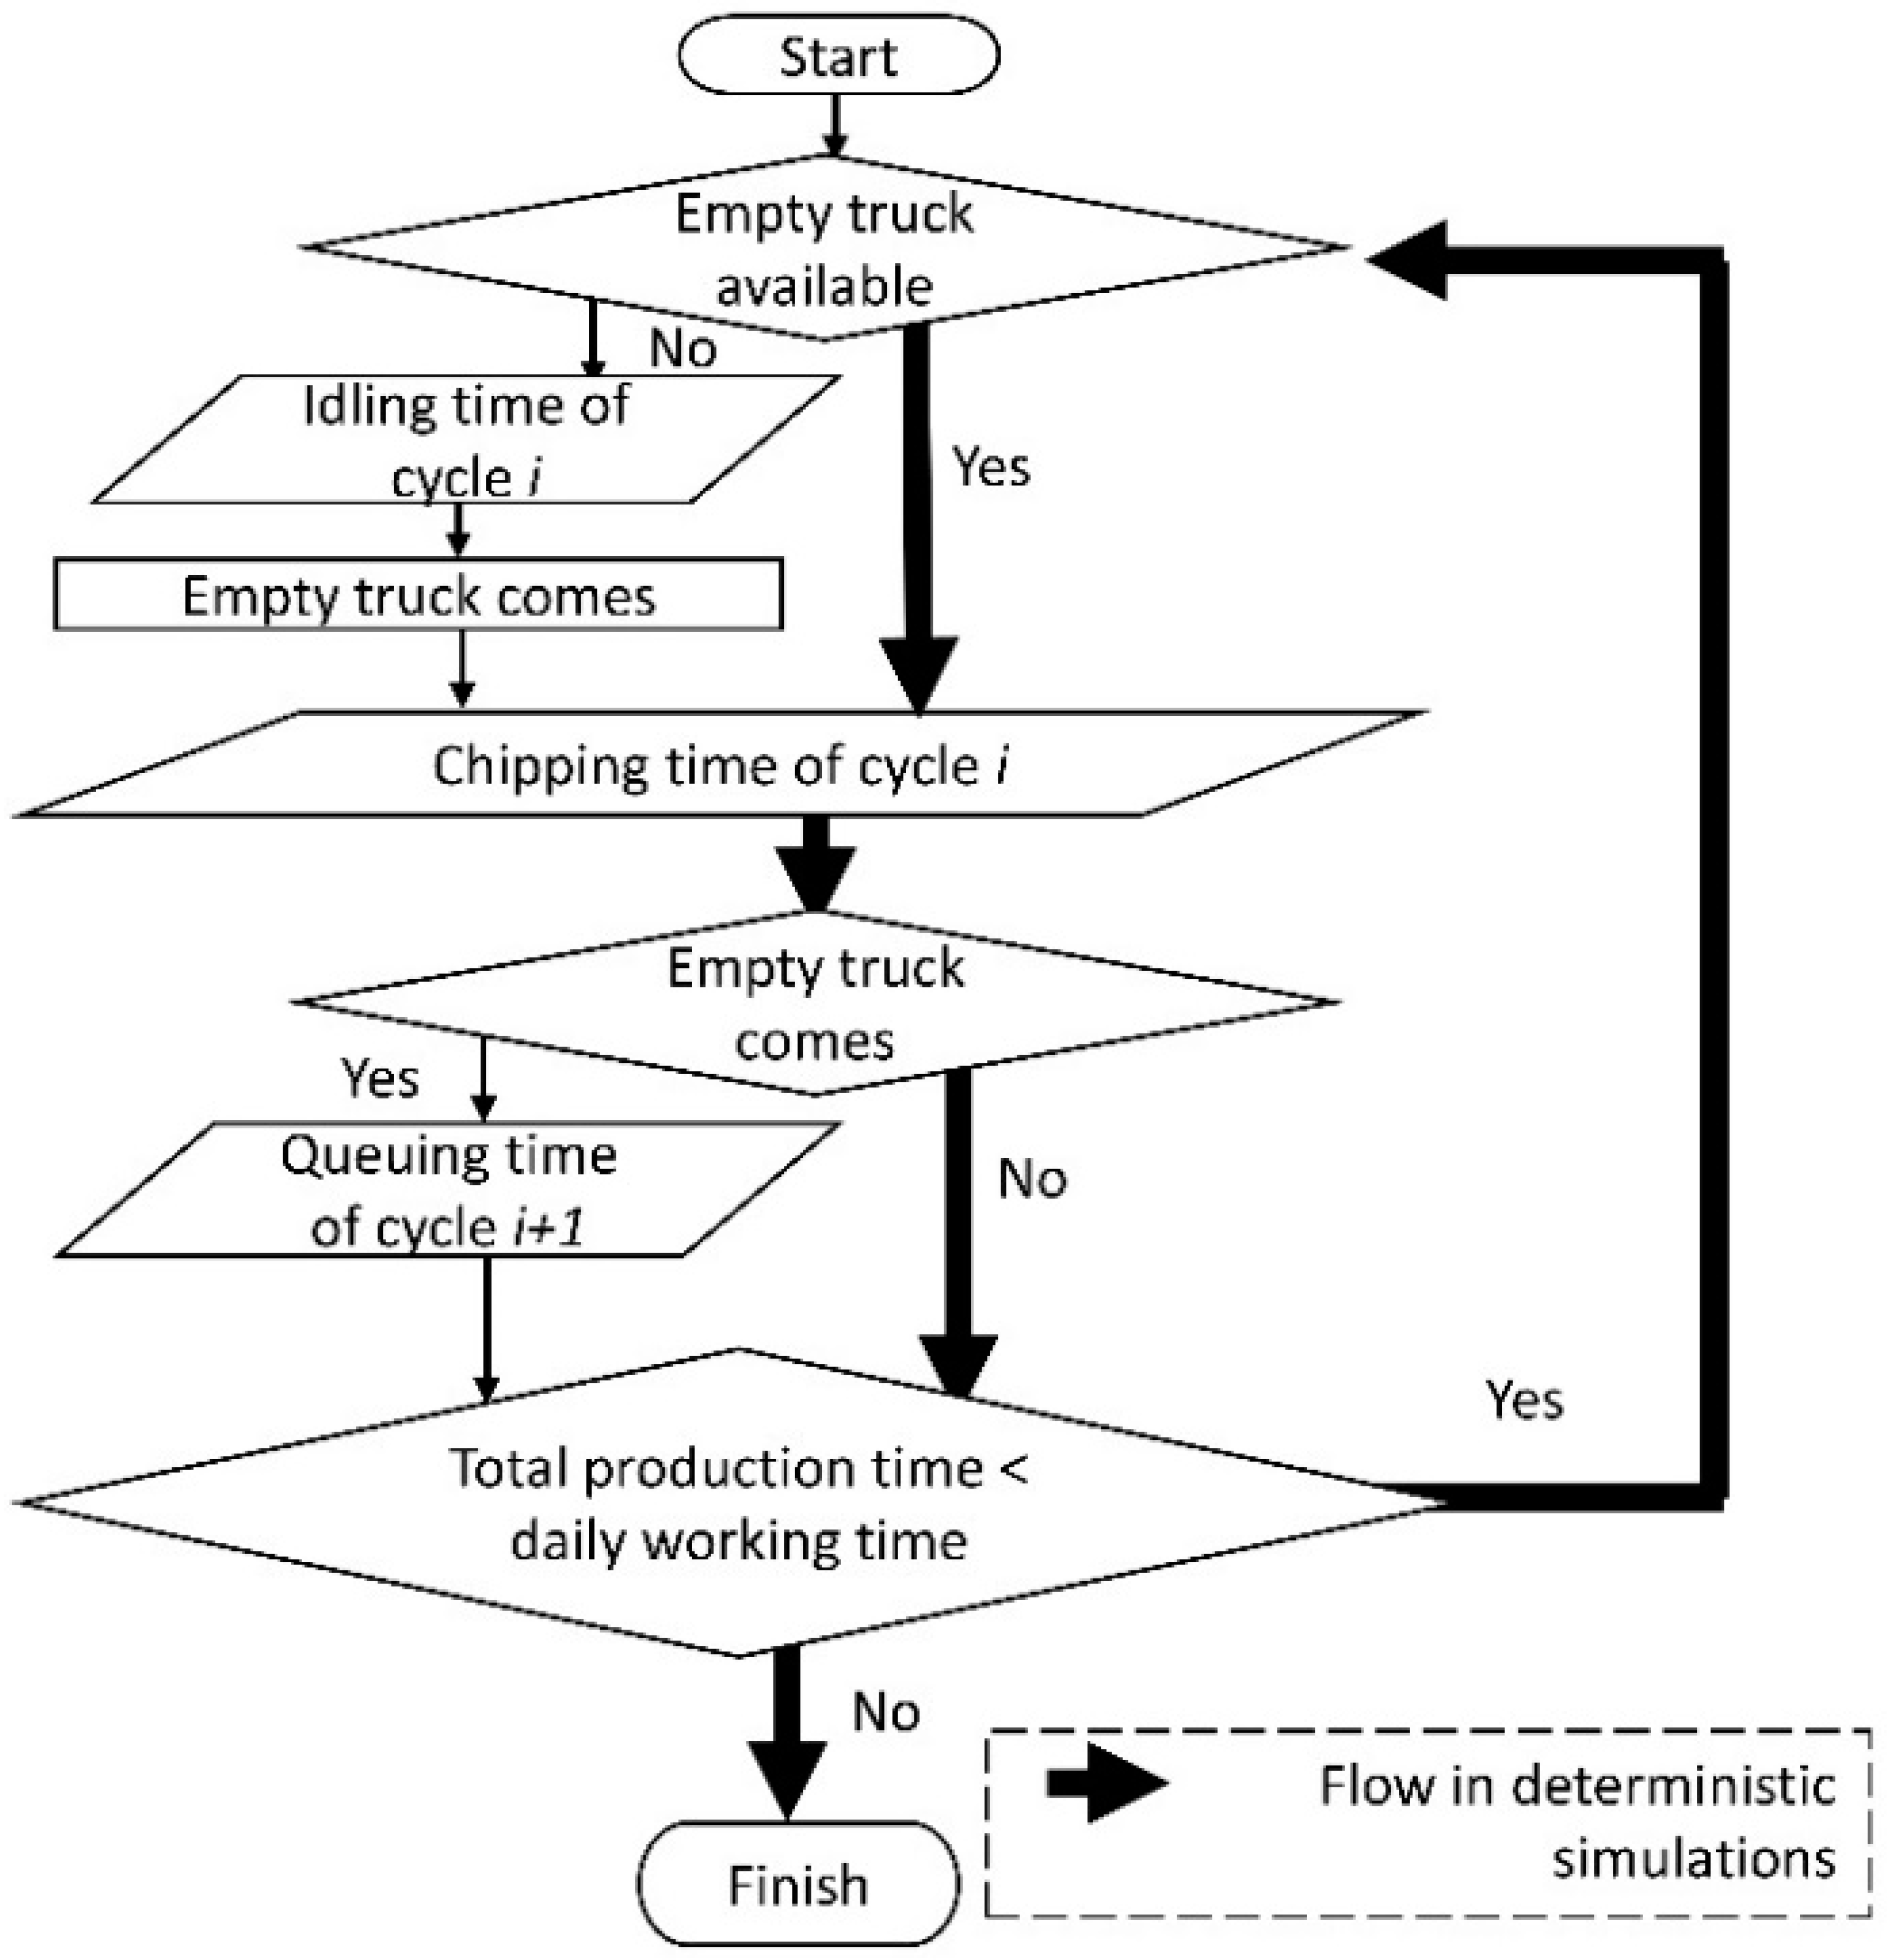
2.2. Idling Time of the Chipper and Queuing Time of a Truck
2.3. Evaluation
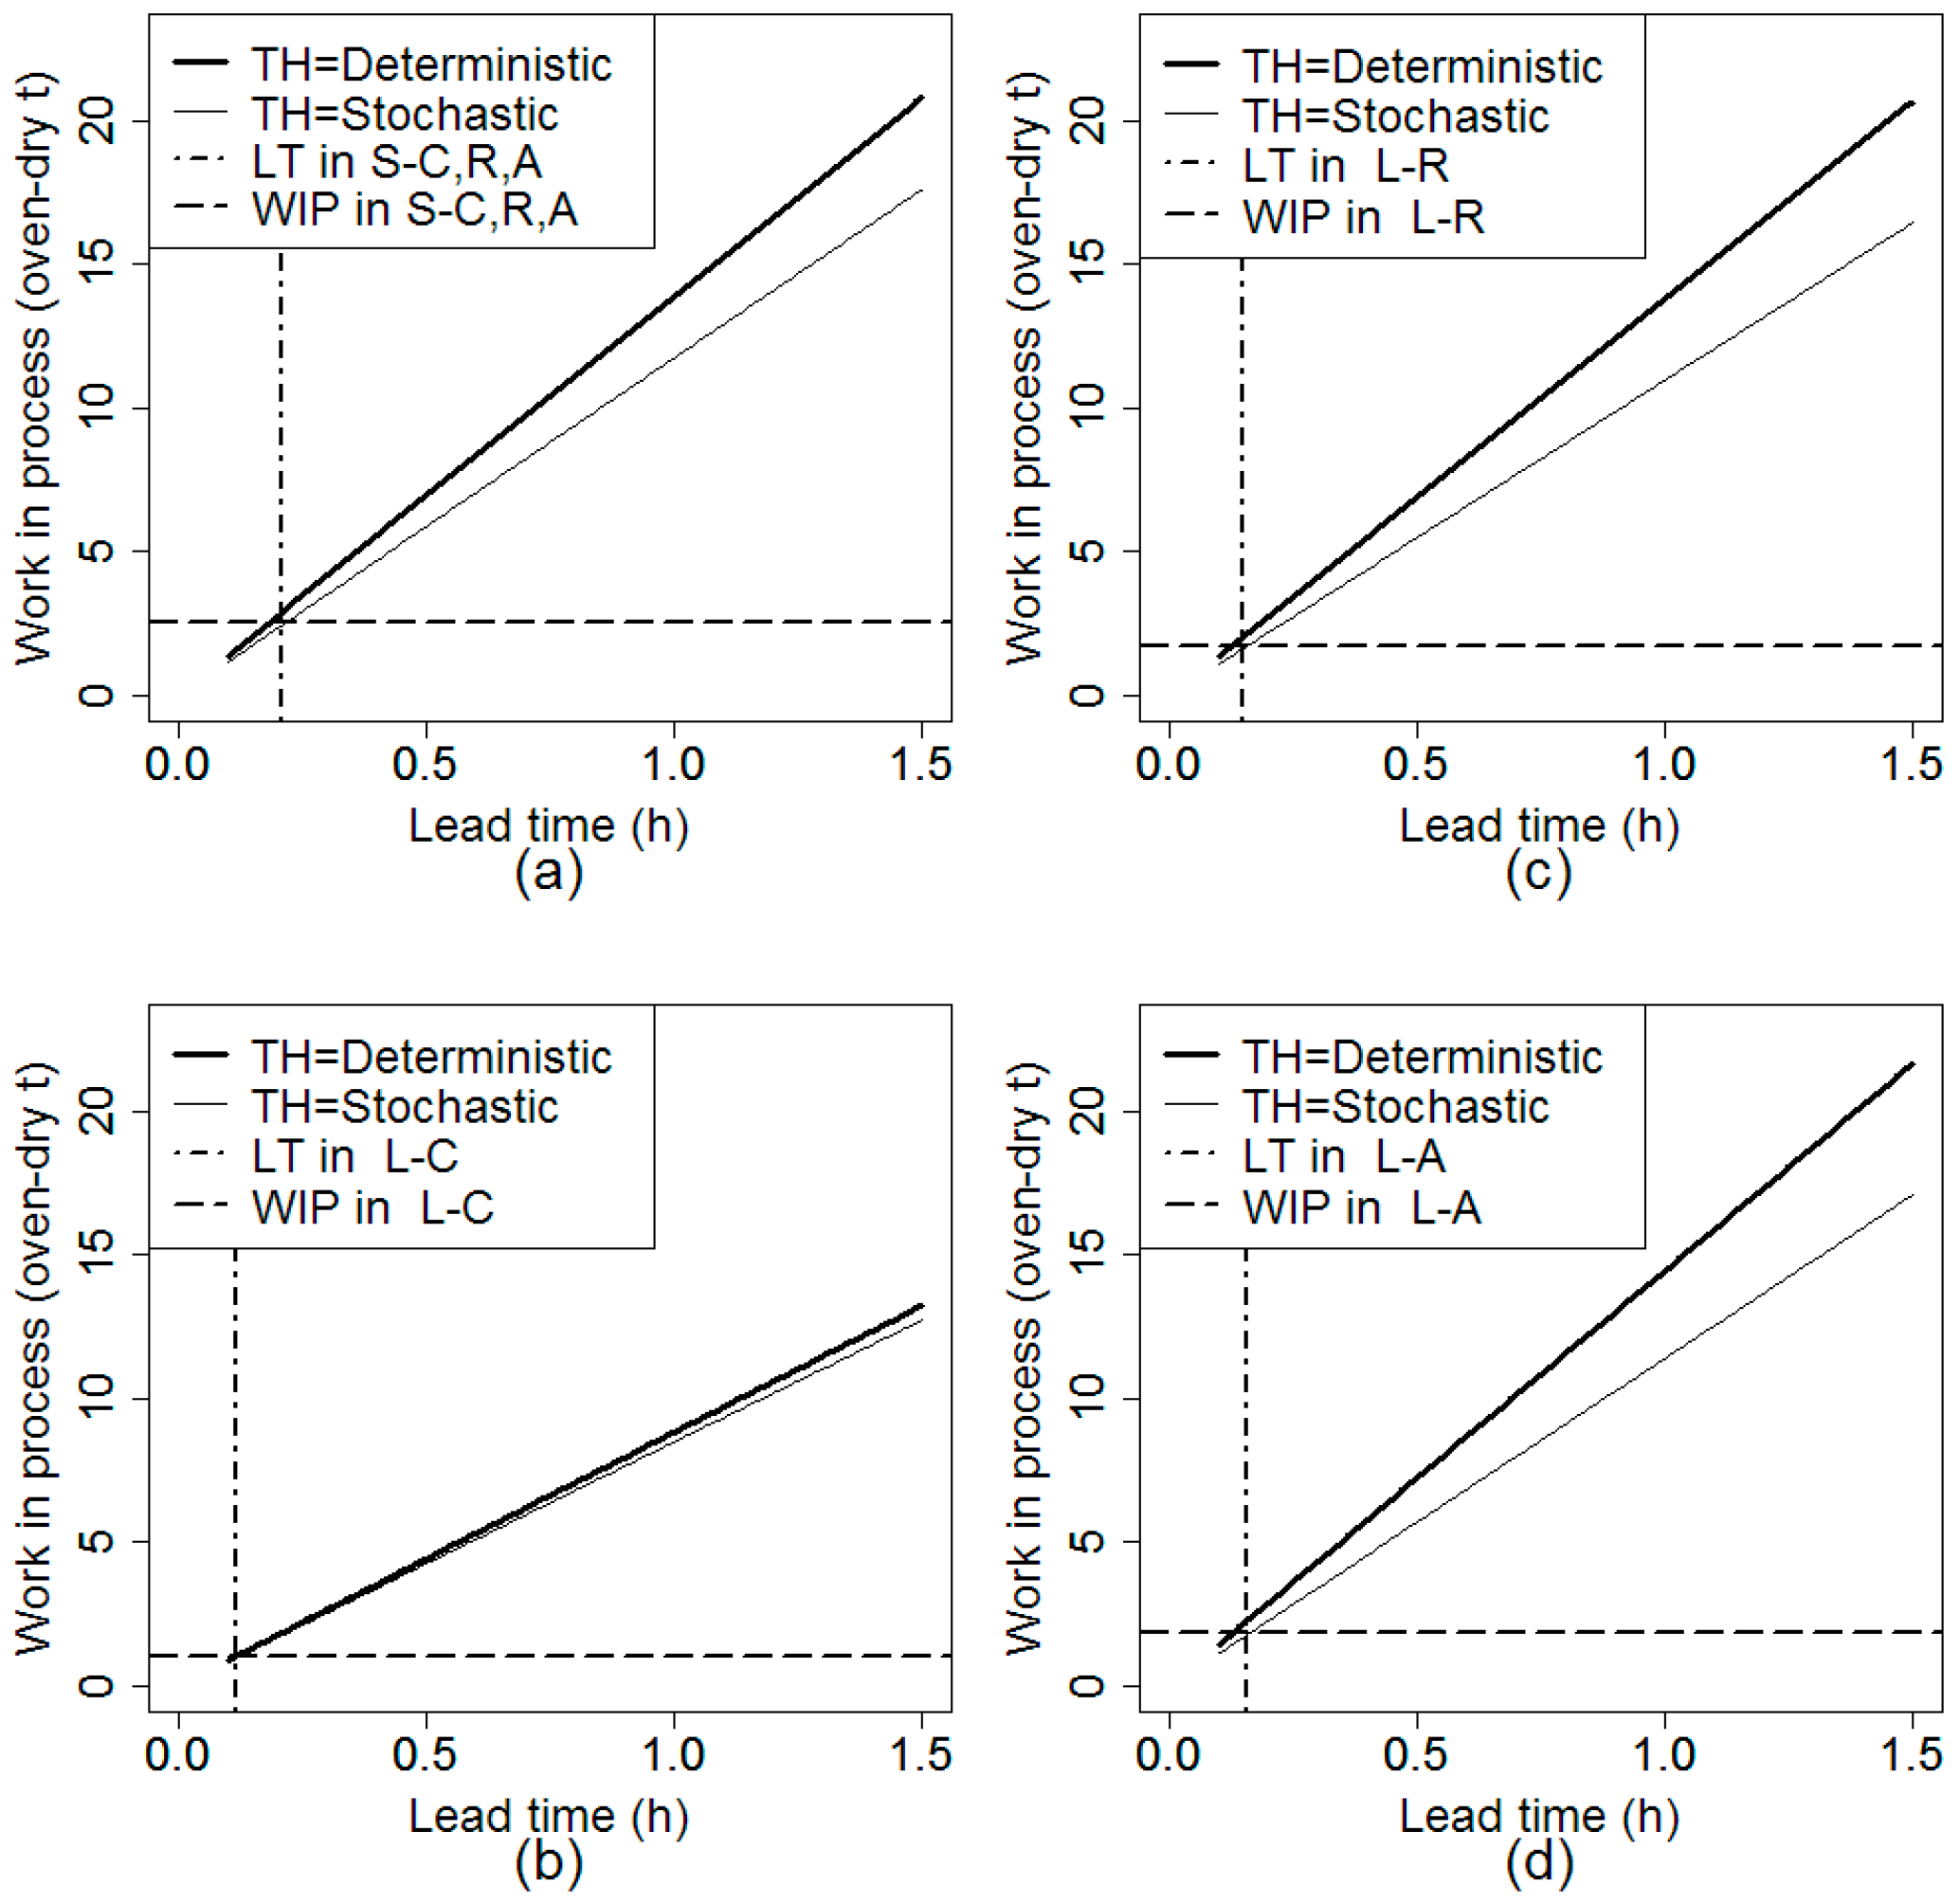
3. Results
4. Discussion
5. Conclusions
Author Contributions
Funding
Conflicts of Interest
References
- Lautala, P.T.; Hilliard, M.R.; Webb, E.; Busch, I.; Richard Hess, J.; Roni, M.S.; Hilbert, J.; Handler, R.M.; Bittencourt, R.; Valente, A.; et al. Opportunities and Challenges in the Design and Analysis of Biomass Supply Chains. Environ. Manag. 2015, 56, 1397–1415. [Google Scholar] [CrossRef] [PubMed]
- Japanese Forestry Agency. Annual Report on Forest and Forestry in Japan, Fiscal Year 2018; Japanese Forestry Agency: Tokyo, Japan, 2019.
- Japanese Ministry of the Envieronment. Kankyo, Junkangata Shakai, Seibutsu Tayousei Hakusho Reiwa Gannendo [Annual Report on the Environment, the Sound Material-Cycle Society and Biodiversity in Japan 2019]; Japanese Ministry of the Envieronment: Tokyo, Japan, 2019.
- Zandi Atashbar, N.; Labadie, N.; Prins, C. Modeling and optimization of biomass supply chains: A review and a critical look. IFAC PapersOnLine 2016, 49, 604–615. [Google Scholar] [CrossRef]
- Acuna, M.; Sessions, J.; Zamora-Cristales, R.; Boston, K.; Brown, M.; Ghaffariyan, M.R. Methods to manage and optimize forest biomass supply chains: A review. Curr. For. Rep. 2019, 5, 1–18. [Google Scholar] [CrossRef]
- Zandi Atashbar, N.; Labadie, N.; Prins, C. Modelling and optimisation of biomass supply chains: A review. Int. J. Prod. Res. 2018, 56, 3482–3506. [Google Scholar] [CrossRef]
- Rönnqvist, M.; D’Amours, S.; Weintraub, A.; Jofre, A.; Gunn, E.; Haight, R.G.; Martell, D.; Murray, A.T.; Romero, C. Operations Research challenges in forestry: 33 open problems. Ann. Oper. Res. 2015, 232, 11–40. [Google Scholar] [CrossRef]
- Schuëller, G.I.; Jensen, H.A. Computational methods in optimization considering uncertainties—An overview. Comput. Methods Appl. Mech. Eng. 2008, 198, 2–13. [Google Scholar] [CrossRef]
- Ghaderi, H.; Pishvaee, M.S.; Moini, A. Biomass supply chain network design: An optimization-oriented review and analysis. Ind. Crops Prod. 2016, 94, 972–1000. [Google Scholar] [CrossRef]
- Wolfsmayr, U.J.; Rauch, P. The primary forest fuel supply chain: A literature review. Biomass Bioenergy 2014, 60, 203–221. [Google Scholar] [CrossRef]
- Erber, G.; Kühmaier, M. Research trends in European forest fuel supply chains: A review of the last ten years (2007–2017)—Part two: Comminution, Transport & Logistics. Croat. J. For. Eng. 2018, 38, 269–278. [Google Scholar]
- Asikainen, A. Chipping terminal logistics. Scand. J. For. Res. 1998, 13, 386–392. [Google Scholar] [CrossRef]
- Flodén, J.; Williamsson, J. Business models for sustainable biofuel transport: The potential for intermodal transport. J. Clean. Prod. 2016, 113, 426–437. [Google Scholar] [CrossRef]
- Röser, D.; Mola-Yudego, B.; Prinz, R.; Emer, B.; Sikanen, L. Chipping operations and efficiency in different operational environments. Silva Fenn. 2012, 46, 275–286. [Google Scholar] [CrossRef]
- Yoshida, M.; Berg, S.; Sakurai, R.; Sakai, H. Evaluation of Chipping Productivity with Five Different Mobile Chippers at Different Forest Sites by a Stochastic Model. Croat. J. For. Eng. 2016, 37, 309–318. [Google Scholar]
- Ghaffariyan, M.R.; Brown, M.; Acuna, M.; Sessions, J.; Gallagher, T.; Kühmaier, M.; Spinelli, R.; Visser, R.; Devlin, G.; Eliasson, L.; et al. An international review of the most productive and cost effective forest biomass recovery technologies and supply chains. Renew. Sustain. Energy Rev. 2017, 74, 145–158. [Google Scholar] [CrossRef]
- Acuna, M.; Anttila, P.; Sikanen, L.; Prinz, R.; Asikainen, A. Predicting and controlling moisture content to optimise forest biomass logistics. Croat. J. For. Eng. 2012, 33, 225–238. [Google Scholar]
- Watanabe, K.; Korai, H.; Kobayashi, I.; Yanagida, T.; Toba, K.; Mitsui, K. Estimation of Drying Time for Air-drying of Logs and Evaluation of Log Properties Affecting Drying Characteristics of Logs Using a Hierarchical Bayesian Model. Mokuzai Gakkaishi 2017, 63, 63–72. [Google Scholar] [CrossRef][Green Version]
- Spinelli, R.; Visser, R.J.M. Analyzing and estimating delays in wood chipping operations. Biomass Bioenergy 2009, 33, 429–433. [Google Scholar] [CrossRef]
- Enkawa, T. Gendai Operations Management—IoT Jidai no Hinshitsu, Seisansei Koujyo to Kokyaku Kachi Souzou [Modern Operations Management, Improvement of Quality and Productivity for Customers Value in the Era of IoT]; Asakura Shoten: Tokyo, Japan, 2017; ISBN 9784254275704. [Google Scholar]
- Talbot, B.; Suadicani, K. Analysis of two simulated in-field chipping and extraction systems in spruce thinnings. Biosyst. Eng. 2005, 91, 283–292. [Google Scholar] [CrossRef]
- Zamora-Cristales, R.; Boston, K.; Sessions, J.; Murphy, G. Stochastic simulation and optimization of mobile chipping and transport of forest biomass from harvest residues. Silva Fenn. 2013, 47, 1–47. [Google Scholar] [CrossRef]
- Japanese Forestry Agency. Heisei 12 Nendo Biomass Shigen no Riyou Shuhou ni Kansuru Tyosa Houkoku Sho [The Report on the Utilization of Biomass Resource in the FISCAL Year of Heisei 12]; Japanese Forestry Agency: Tokyo, Japan, 2001.
- Yoshida, M.; Sakai, H. Selection of chipper engine size based on business scale and optimised cost of chipping and transportation. J. For. Res. 2017, 22, 265–273. [Google Scholar] [CrossRef]
- Team, R.C. R: A Language and Environment for Statistical Computing; R Foundation for Statistical Computing: Vienna, Austria, 2019. [Google Scholar]
- Yoshida, M.; Son, J.; Sakai, H. Biomass transportation costs by activating upgraded forest roads. Bull. Transilv. Univ. Brasov. Spec. Issue Ser. II For. Wood Ind. Agric. Food Eng. 2017, 10, 81–88. [Google Scholar]
- Laurén, A.; Asikainen, A.; Kinnunen, J.P.; Palviainen, M.; Sikanen, L. Improving the financial performance of solid forest fuel supply using a simple moisture and dry matter loss simulation and optimization. Biomass Bioenergy 2018, 116, 72–79. [Google Scholar] [CrossRef]
- Gendek, A.; Nurek, T.; Zychowicz, W.; Moskalik, T. Effects of Intentional Reduction in Moisture Content of Forest Wood Chips during Transport on Truckload Price. BioResources 2018, 13, 4310–4322. [Google Scholar] [CrossRef]
- Erber, G.; Kühmaier, M. Research trends in European forest fuel supply chains: A review of the last ten years (2007–2017)—Part one: Harvesting and storage. Croat. J. For. Eng. 2017, 38, 269–278. [Google Scholar]
- Acuna, M.; Mirowski, L.; Ghaffariyan, M.R.; Brown, M. Optimising transport efficiency and costs in Australian wood chipping operations. Biomass Bioenergy 2012, 46, 291–300. [Google Scholar] [CrossRef]
- Amrouss, A.; El Hachemi, N.; Gendreau, M.; Gendron, B. Real-time management of transportation disruptions in forestry. Comput. Oper. Res. 2017, 83, 95–105. [Google Scholar] [CrossRef]
- Acuna, M. Timber and biomass transport optimization: A review of planning issues, solution techniques and decision support tools. Croat. J. For. Eng. 2017, 38, 279–290. [Google Scholar]
- Scholz, J.; De Meyer, A.; Marques, A.S.; Pinho, T.M.; Boaventura-Cunha, J.; Van Orshoven, J.; Rosset, C.; Künzi, J.; Kaarle, J.; Nummila, K. Digital Technologies for Forest Supply Chain Optimization: Existing Solutions and Future Trends. Environ. Manag. 2018, 62, 1108–1133. [Google Scholar] [CrossRef]
- Lehoux, N.; D’Amours, S.; Langevin, A. Inter-firm collaborations and supply chain coordination: Review of key elements and case study. Prod. Plan. Control 2014, 25, 858–872. [Google Scholar] [CrossRef]
- D’Amours, S.; Rönnqvist, M.; Weintraub, A. Using operational research for supply chain planning in the forest products industry. INFOR Inf. Syst. Oper. Res. 2009, 46, 265–281. [Google Scholar] [CrossRef]
- Sosa, A.; Acuna, M.; McDonnell, K.; Devlin, G. Controlling moisture content and truck configurations to model and optimise biomass supply chain logistics in Ireland. Appl. Energy 2015, 137, 338–351. [Google Scholar] [CrossRef]
- Laitila, J.; Asikainen, A.; Ranta, T. Cost analysis of transporting forest chips and forest industry by-products with large truck-trailers in Finland. Biomass Bioenergy 2016, 90, 252–261. [Google Scholar] [CrossRef]
- Nati, C.; Spinelli, R.; Eliasson, L. Effect of chipper type, biomass type and blade wear on productivity, fuel consumption and product quality. Croat. J. For. Eng. 2014, 35, 1–7. [Google Scholar]
- Marques, A.; Rasinmäki, J.; Soares, R.; Amorim, P. Planning woody biomass supply in hot systems under variable chips energy content. Biomass Bioenergy 2018, 108, 265–277. [Google Scholar] [CrossRef]


| Type | Symbol | Definition | Explanation |
|---|---|---|---|
| Conventional | No drying. The average MC is 54 WB% and no variance. | ||
| Recommended | Three-months drying. The average MC varied and assumed to follow the normal distribution with wider variance (mean = 30, SD = 10) | ||
| Advanced | One-year drying. The average MC slightly varied. By setting the coefficient of variation at the half of that in Recommended type, it assumed to follow the normal distribution (mean = 16, SD = 2.56) |
| Case | Truck Size | Drying Type | Definition |
|---|---|---|---|
| S-C | Small | Conventional | No drying. Material was chipped and transported by small trucks. |
| S-R | Small | Recommended | After three-months drying, material was chipped and transported by small trucks. |
| S-A | Small | Advanced | After one-year drying, material was chipped and transported by small trucks. |
| L-C | Large | Conventional | No drying. Material was chipped and transported by large trucks. |
| L-R | Large | Recommended | After three-months drying, material was chipped and transported by large trucks. |
| L-A | Large | Advanced | After one-year drying, material was chipped and transported by large trucks. |
| Value | Symbol | Stochastic Simulation | Deterministic Model |
|---|---|---|---|
| Time of chipping operation at cycle i | |||
| Chipping productivity | ~Normal [66.37, 7.79] | =66.37 | |
| Interval of a truck arrival | |||
| Moisture content |
| Case | S-C | S-R | S-A | L-C | L-R | L-A | |
|---|---|---|---|---|---|---|---|
| Productive working time of a chipper (h) | Average | 6.06 | 6.04 | 6.07 | 4.36 | 5.59 | 5.81 |
| SD | 0.8 | 0.81 | 0.8 | 1.11 | 1.13 | 1.1 | |
| Deterministic | 8 | 8 | 8 | 8 | 8 | 8 | |
| Number of trucks (trucks) | Average | 20.06 | 20.02 | 20.11 | 11.48 | 10.04 | 9.63 |
| SD | 2.66 | 2.67 | 2.65 | 2.91 | 2.04 | 1.81 | |
| Deterministic | 26.55 | 26.55 | 26.55 | 13.27 | 13.27 | 13.27 | |
| Total amount of daily production (oven-dry t) | Average | 80.64 | 80.43 | 80.83 | 58.07 | 74.41 | 77.39 |
| SD | 10.68 | 10.73 | 10.66 | 14.71 | 15.1 | 14.59 | |
| Deterministic | 106.72 | 106.72 | 106.72 | 67.16 | 102.2 | 106.72 | |
| Throughput (oven-dry t h−1) | Average | 11.73 | 11.7 | 11.74 | 8.48 | 10.97 | 11.39 |
| SD | 1.5 | 1.5 | 1.5 | 2.16 | 2.1 | 1.97 | |
| Deterministic | 13.86 | 13.86 | 13.86 | 9.08 | 13.82 | 14.43 | |
| Queuing time (h truck−1) | Average | 0.54 | 0.53 | 0.55 | 0.2 | 0.54 | 0.63 |
| SD | 0.35 | 0.35 | 0.35 | 0.18 | 0.41 | 0.46 | |
| Deterministic | 0 | 0 | 0 | 0 | 0 | 0 | |
| Idling time (h) | Average | 1.13 | 1.15 | 1.12 | 3.13 | 1.82 | 1.6 |
| SD | 0.83 | 0.84 | 0.83 | 1.27 | 1.25 | 1.19 | |
| Deterministic | 0 | 0 | 0 | 0 | 0 | 0 |
© 2019 by the authors. Licensee MDPI, Basel, Switzerland. This article is an open access article distributed under the terms and conditions of the Creative Commons Attribution (CC BY) license (http://creativecommons.org/licenses/by/4.0/).
Share and Cite
Yoshida, M.; Takata, K. Uncertainty Simulation of Wood Chipping Operation for Bioenergy Based on Queuing Theory. Forests 2019, 10, 822. https://doi.org/10.3390/f10090822
Yoshida M, Takata K. Uncertainty Simulation of Wood Chipping Operation for Bioenergy Based on Queuing Theory. Forests. 2019; 10(9):822. https://doi.org/10.3390/f10090822
Chicago/Turabian StyleYoshida, Mika, and Katsuhiko Takata. 2019. "Uncertainty Simulation of Wood Chipping Operation for Bioenergy Based on Queuing Theory" Forests 10, no. 9: 822. https://doi.org/10.3390/f10090822
APA StyleYoshida, M., & Takata, K. (2019). Uncertainty Simulation of Wood Chipping Operation for Bioenergy Based on Queuing Theory. Forests, 10(9), 822. https://doi.org/10.3390/f10090822