Article

How Much Forest Persists Through Fire? High-Resolution Mapping of Tree Cover to Characterize the Abundance and Spatial Pattern of Fire Refugia Across Mosaics of Burn Severity

1
School of Environment and Sustainability, Western Colorado University, 600 S Adams Street, Gunnison, CO 81231, USA
2
Department of Forest Ecosystems and Society, Oregon State University, 321 Richardson Hall, Corvallis, OR 97331, USA
3
Department of Biological Sciences, Florida International University, 11200 S.W. 8th Street, Miami, FL 33199, USA
*
Author to whom correspondence should be addressed.
Forests 2019, 10(9), 782; https://doi.org/10.3390/f10090782
Submission received: 29 July 2019 / Revised: 31 August 2019 / Accepted: 4 September 2019 / Published: 8 September 2019

Abstract

:
Wildfires in forest ecosystems produce landscape mosaics that include relatively unaffected areas, termed fire refugia. These patches of persistent forest cover can support fire-sensitive species and the biotic legacies important for post-fire forest recovery, yet little is known about their abundance and distribution within fire perimeters. Readily accessible 30-m resolution satellite imagery and derived burn severity products are commonly employed to characterize post-fire landscapes; however, coarse image resolution, generalized burn severity thresholds, and other limitations can constrain accurate representation of fire refugia. This study quantifies the abundance and pattern of fire refugia within 10 fires occurring in ponderosa pine and dry mixed-conifer forests between 2000 and 2003. We developed high-resolution maps of post-fire landscapes using semi-automated, object-based classification of 1-m aerial imagery, conducted imagery- and field-based accuracy assessments, and contrasted these with Landsat-derived burn severity metrics. Fire refugia area within burn perimeters ranged from 20% to 57%. Refugia proportion generally decreased with increasing Landsat-derived burn severity, but still accounted for 3–12% of areas classified as high severity. Patch size ranged from 1-m2 isolated trees to nearly 8000 ha, and median patch size was 0.01 ha—substantially smaller than a 30-m Landsat pixel. Patch size was negatively related to burn severity; distance to fire refugia from open areas was positively related to burn severity. Finally, optimized thresholds of 30-m post-fire normalized burn ratio (NBR) and relative differenced normalized burn ratio (RdNBR) delineated fire refugia with an accuracy of 77% when validated against the 1-m resolution maps. Estimations of fire refugia abundance based on Landsat-derived burn severity metrics are unlikely to detect small, isolated fire refugia patches. Finer-resolution maps can improve understanding of the distribution of forest legacies and inform post-fire management activities including reforestation and treatments.

1. Introduction

Wildfire is an essential ecological process that promotes heterogeneity in forest structure, composition, and landscape pattern [1,2]. As remotely sensed measures of wildfire activity and effects have become increasingly available, abundant research has focused on evaluating landscape patterns of burn severity, especially the extent and distribution of stand-replacing, high-severity components [3,4,5]. Less is known about fire refugia, which are defined as “landscape elements that remain unburned or minimally affected by fire, thereby supporting post-fire ecosystem function, biodiversity, and resilience to disturbances” [6]. The term has been adapted from the ecological concept of refugia as habitats in which biota persist, retreat to, and potentially expand from under changing biotic and abiotic conditions [7]. In forested landscapes, fire refugia can be delineated as locations that are unburned or only lightly impacted by fire and retain live forest cover [8,9,10].
Fire refugia can provide vital ecological functions in post-fire landscapes. In particular, fire refugia can provide seed sources necessary for the re-establishment of obligate seeding species, facilitating the recovery of the surrounding landscape [11,12,13]. Despite increasing interest in the role of fire refugia across burn mosaics, little is known about their distribution and abundance, particularly at fine spatial scales. In historically surface-fire driven systems, such as ponderosa pine (Pinus ponderosa Lawson & C. Lawson) and dry mixed-conifer forests in the interior western USA, critical ecosystem functions and forest-dependent biota may be at risk where large, severe fires can lead to landscape-scale conversion from forested to non-forested states [14,15,16,17,18,19]. However, such losses may be buffered where fire refugia provide both short- and long-term potential for forest persistence and recovery. As such, the identification, characterization, and quantification of fire refugia within contemporary burned landscapes can inform targeted post-fire research and restoration activity, supporting adaptive management strategies where forests are vulnerable to stand-replacing fire effects.
Remote sensing data, particularly multispectral satellite-derived indices, are frequently used to map burn perimeters, estimate the ecological effect of fire on soils and vegetation, and examine the spatial variability of disturbance patterns [20,21]. The Landsat-derived Normalized Burn Ratio (NBR) [22] provides the basis for the most widely used burn severity indices among both managers and researchers in recent decades. Pre- to post-fire differenced NBR (dNBR) and relative dNBR (RdNBR) provide metrics of burn severity proportional to the degree of fire-driven environmental change over time [23,24]. The U.S. federal interagency Monitoring Trends in Burn Severity (MTBS) [25] program has utilized these indices to map and classify the severity of fires across the United States from 1984 to present. This easily accessible and comprehensive database provides a valuable record of fire effects, but the MTBS burn severity products and classifications have limitations for addressing specific ecological questions [26] such as precise identification of fire refugia locations.
Combined with microclimate-indicative terrain metrics and fire weather conditions, dNBR-derived indices have been used to predict the probability of fire refugia and to examine the spatial neighborhoods in which refugia exist—advancing our understanding of the deterministic and stochastic factors contributing to the variable patterns of refugia at the landscape scale [9,27,28]. Kolden et al. (2012) [29] used dNBR to delineate the extent and spatial pattern of unburned patches in relation to fire size and severity. Meddens et al. (2016) [30] built on fire refugia characterization efforts by delineating unburned patches using Landsat-derived spectral indices in combination with ancillary data, advancing a classification model that improved on the commonly used MTBS thresholds. Despite overall high classification accuracy when validated against a field dataset, the authors acknowledged that the pixel grain of moderate resolution spectral data (e.g., Landsat) can hinder the detection of sub-pixel patches, suggesting that the inclusion of higher resolution and hyperspectral data could significantly improve the delineation of unburned remnants [30].
The ability to detect fire refugia using Landsat imagery is fundamentally constrained by the 30-m (0.09-ha) spatial resolution, which could preclude accounting for small surviving forest patches within pixels of moderate to high burn severity. Additional constraints of Landsat-based burn severity metrics include generalized severity class thresholds, sometimes-weak empirical relationships with ecological metrics, and highly variable performance across different vegetation types [26]. A potential fine-grain dataset for fire refugia assessment is the systematic, 1-m resolution orthoimagery that has been publicly available across the continental U.S. through the National Agricultural Imagery Program (NAIP) since 2003. Numerous studies have demonstrated the utility and improved accuracy of using NAIP imagery to monitor and classify land cover and vegetation, especially when object-based, rather than pixel-based, classification methods are employed [31,32,33]. For example, Chambers et al. (2016) [15] used NAIP imagery in the classification and mapping of fire refugia to develop a predictive map of conifer regeneration after high-severity wildfire. However, such techniques have not yet been broadly applied to the characterization and spatial analysis of fire refugia.
The purpose of this study is to characterize the relative abundance and spatial distribution of fire refugia within contemporary fire perimeters in dry-forest ecosystems. Fundamentally, we asked: what is the abundance and spatial pattern of fire refugia containing persistent tree cover with recent large wildfires? Our specific objectives were to: (1) develop high-resolution fire refugia maps for 10 fires across the intermountain western USA via semi-automated object-based image classification and delineation; (2) analyze fire refugia abundance, size, and spatial patterns (including distance to nearest fire refugium) in relation to common, coarser-grained burn severity metrics and classifications; and (3) assess the utility of using widely available 30-m resolution reflectance data for the identification of surviving forest.

2. Materials and Methods

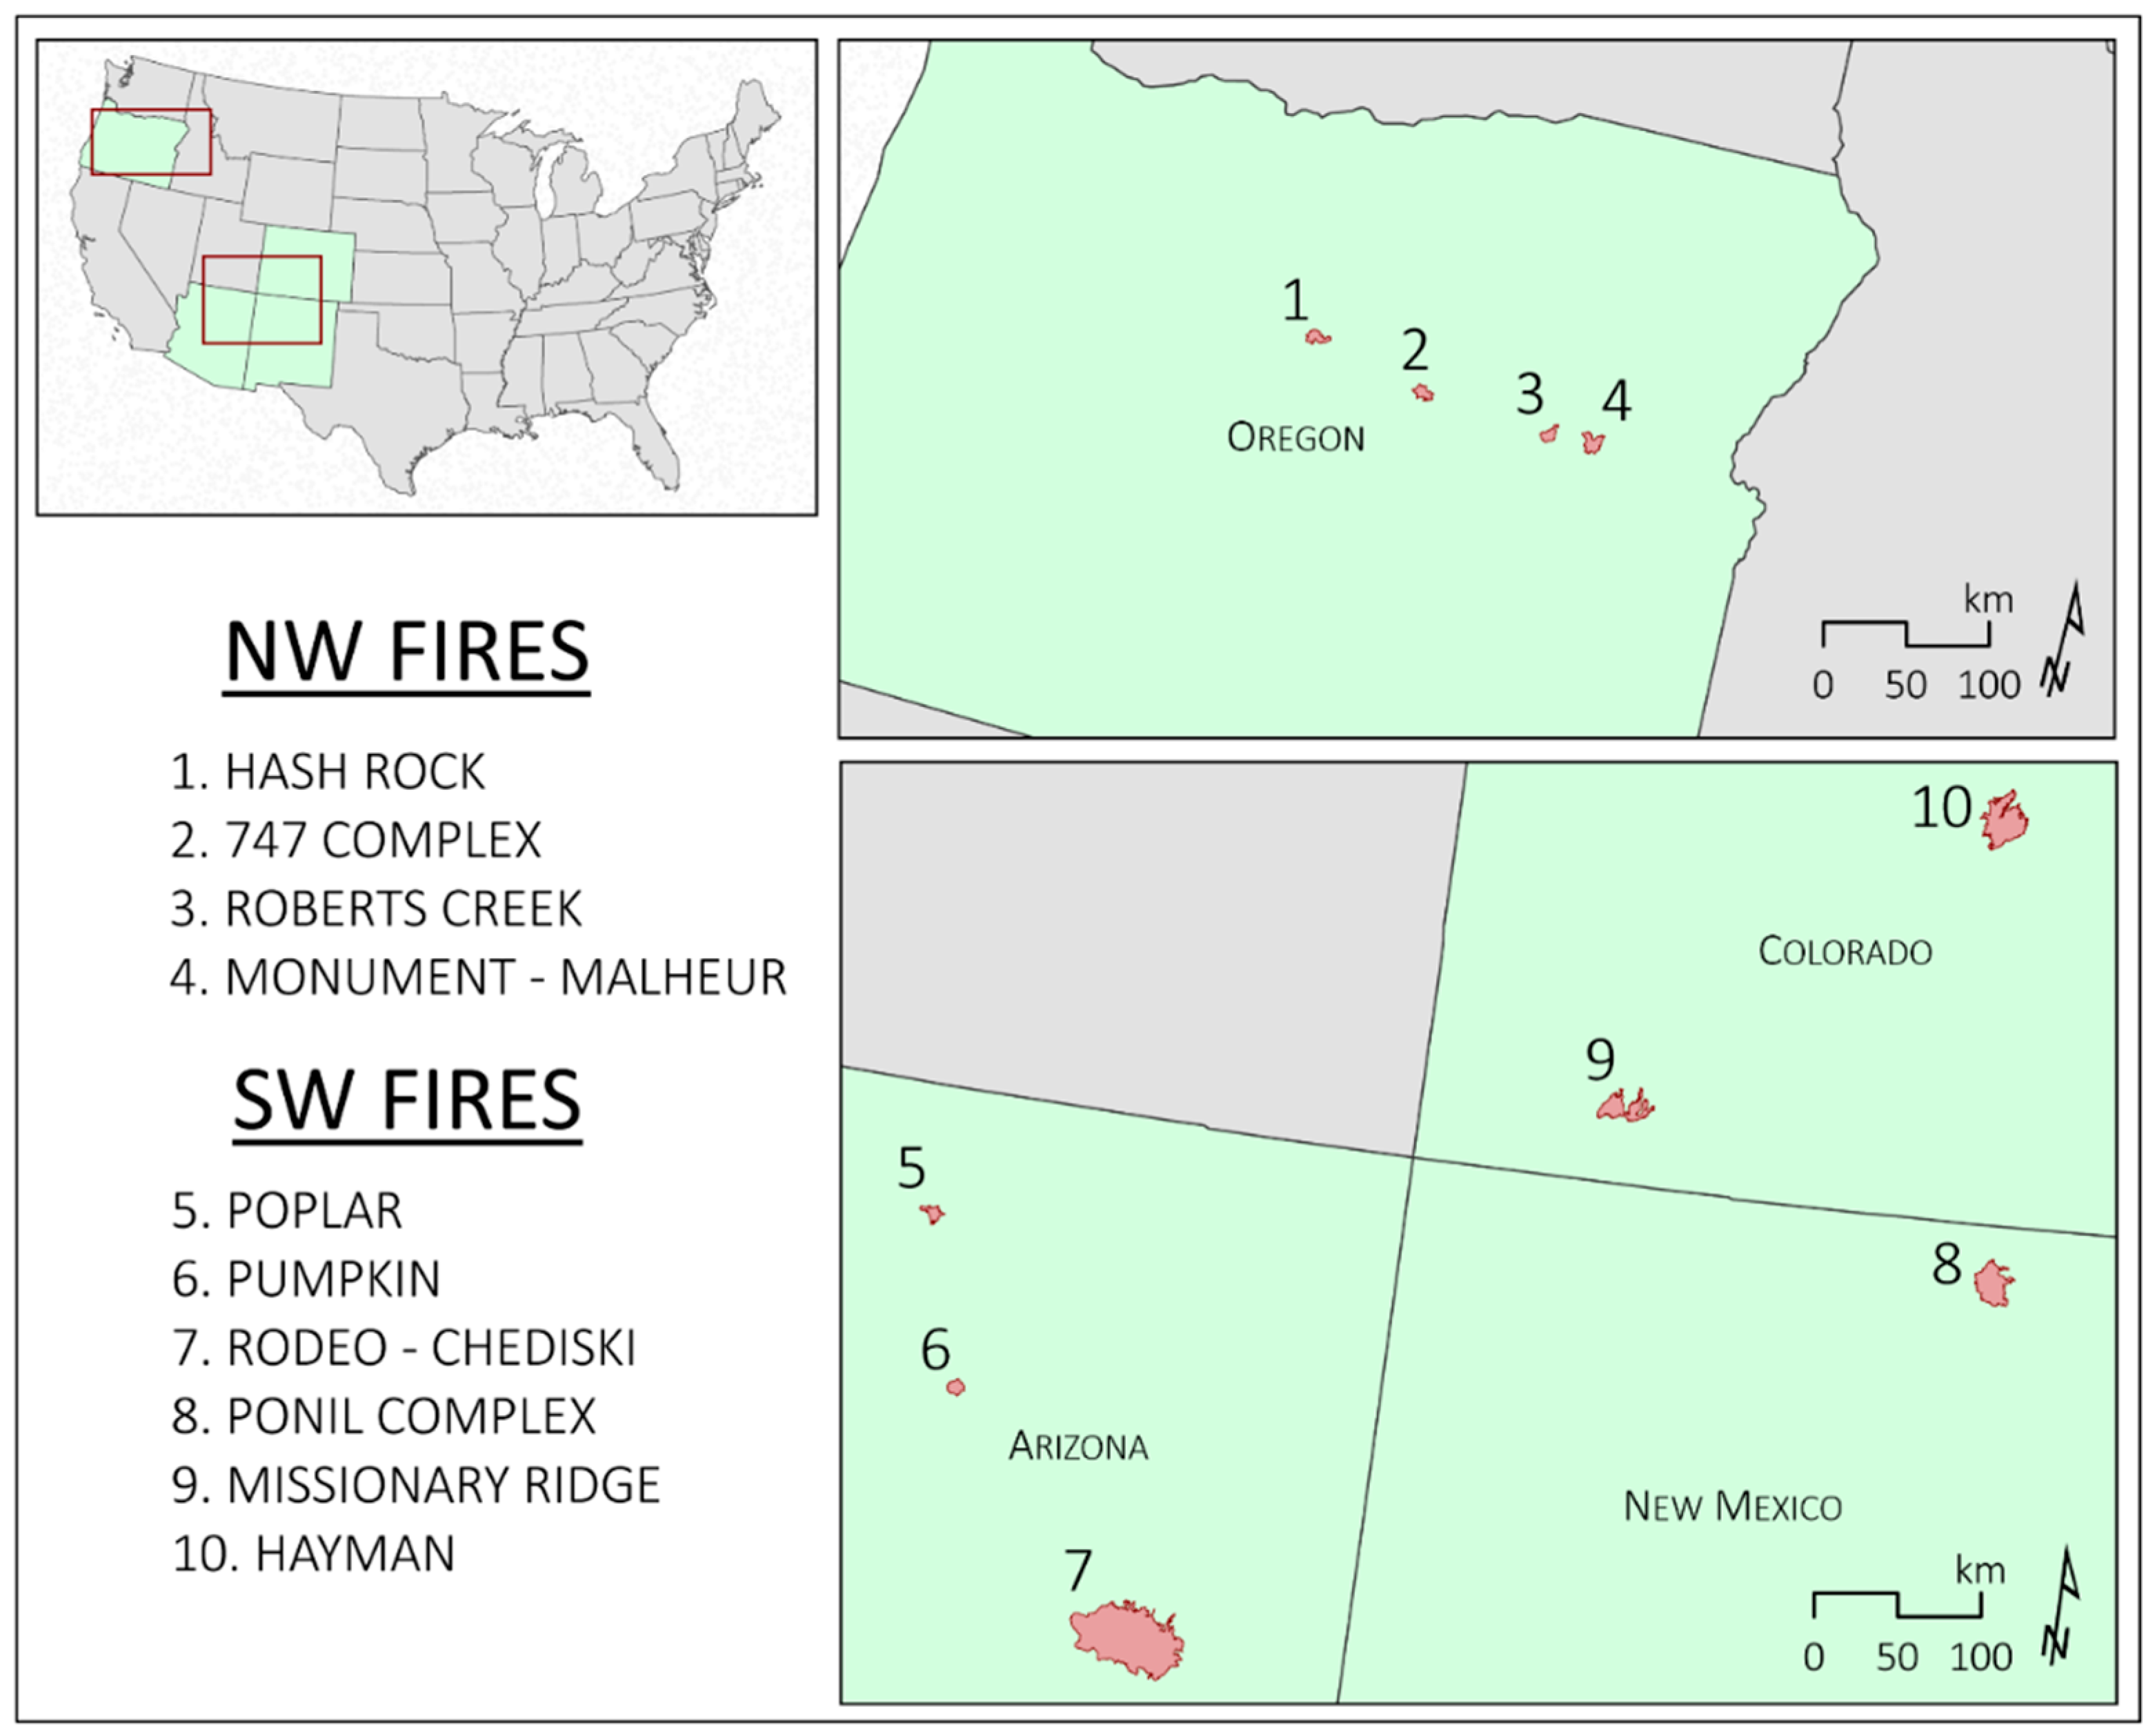
2.1. Study Area and Fire Selection

We mapped and analyzed 10 large wildfires that occurred between 2000 and 2003 and ranged in size from the 6584 ha Roberts Creek fire to the 189,651 ha Rodeo-Chediski fire (not mapped in full due to access limitations (Table 1, Table S1). The study fires were located across the U.S. Intermountain West (i.e., Arizona, Colorado, New Mexico, and Oregon; Figure 1) and selected to meet the criteria described below. We focused on fires that occurred primarily within interior ponderosa pine and dry mixed-conifer forests because these forest types are considered highly vulnerable to wildfire-driven conversion to non-forested states following high-severity fire. Most fires contained relatively large proportions of high-severity fire effects (7–43%, mean = 26%; according to MTBS-classified dNBR data) and could be considered uncharacteristic relative to the low to moderate severity regimes historically associated with these forest types [34,35]. Pre-fire forest cover for the selected fires ranged between 67% and 98% (mean = 89%) based on analysis of the 1992 Landsat-derived National Land Cover Dataset (NLCD; Table S2) [36].

2.2. Image Classification and Fire-Refugia Mapping

Given the focus on forested systems in this study, our operational definition of fire refugia is any patches of live tree cover persisting within study fire perimeters. These patches were mapped as follows. For each fire, we accessed four-band, 1-m resolution NAIP imagery through the U.S. Geological Survey EarthExplorer data acquisition interface [37]. NAIP scenes were selected based on their quality for subsequent ease of classification (e.g., free from excessive shadows and visual obstruction). Scenes were also required to have a minimum time since the last fire of five years to allow for the full realization of second-order fire effects (e.g., delayed mortality) and a maximum time since the last fire of 15 years to limit the presence and possible misclassification of post-fire tree establishment. While the protracted patterns of forest recovery (or lack thereof) in our study burns allowed us to confidently utilize imagery with this range of post-fire intervals, we suggest that any systematic effort to map persistent forest cover using the approaches described below, particularly across more productive forest types, could ideally take advantage of imagery acquired 2–3 years post fire. Fire perimeter polygons were acquired from the Monitoring Trends in Burn Severity (MTBS) project [38].
Image classification and refugia delineation processes were carried out for each post-fire scene using ArcGIS Desktop 10.4.1 [39]. Post-fire NAIP images were segmented to group pixels with similar spectral and spatial properties into homogenous units, resulting in an intermediate object-based representation (Figure 2a,b). These image segments, or objects, became the classification processing unit [40,41]. Objects representing fire refugia (i.e., tree canopy) and open areas (i.e., areas lacking tree canopy) within each fire perimeter were selected as training samples and were merged into two respective classes, with each class containing at least 100 samples. The training sample dataset was used to perform a supervised maximum likelihood classification of the segmented image. The output product consisted of a raster with two discrete cover classes: fire refugia and open areas. A focal majority filter was applied to the output raster to reduce the presence of misclassified isolated pixels, a common source of error when classifying high-resolution imagery. The moving window-based focal majority filter computes the class of each pixel by assigning it the majority class of the surrounding pixels within a specified neighborhood. After experimenting with neighborhood size and number of iterative filter applications, a single filter application using a 7 × 7-pixel neighborhood achieved the desired noise reduction and boundary smoothing, while still preserving some single-pixel patches representing the smallest individual trees, thus establishing the minimum mapping unit. Pixels classified as fire refugia were extracted from the raster and converted to polygon layers.
Following Chambers et al. (2016) [15], polygon boundaries within 20 m of each other were aggregated, and holes less than 50 m2 were closed. After experimenting with many parameter combinations, we found that the 20-m aggregation distance best represented contiguous fire refugia patches where canopy density was relatively low. Similarly, closing holes of 50 m2 or less effectively captured “within-patch” tree canopy missed during classification, while also preserving relatively small inter-canopy gaps. Together, these parameters provided an optimal estimation of discrete fire refugia patches and open areas for subsequent spatial pattern analysis. Any remaining inaccuracies identified through final visual inspections were largely reduced by minimally editing the fire refugia layer to include areas where canopy was missed and to remove misclassified patches [15]. To create the final fire refugia map (described below), edited polygons were converted back to raster format, and all regions not occupied by fire refugia were classified as open areas (Figure 2c).
Subsequent accuracy assessments and analyses make use of the entire mapped region within each fire perimeter, which in all cases necessarily included some areas that were not forested prior to wildfire. However, we determined that any attempt to remove or mask such pre-fire non-forested areas would have produced considerable artefacts in analyses including the removal of areas containing forested refugia, the focus of our study. We explored utilizing 30-m resolution maps (e.g., the 1992 National Land Cover Dataset) [36] to remove pre-fire non-forested vegetation from the analysis, but due to the resolution mismatch (1- vs. 30-m), this dataset would exclude many of the small fire refugia patches we sought to map. Specifically, 10% on average of the area mapped as fire refugia occurred within NLCD 30-m pixels classified as a non-forest cover type (Table S2). Areas classified as pre-fire non-forest within the NLCD map only accounted for 13% of our mapped open areas across all fires, indicating that the inclusion of these areas was unlikely to substantially influence key inferences (Table S2). Because 4-band NAIP imagery was not uniformly acquired prior to our study fires, it would not have been possible to develop pre-fire 1-m resolution maps of tree cover and open areas (nor could such maps have been subject to field-based accuracy assessment).
Imagery-based accuracy assessments of the fire refugia maps were carried out using equalized stratified random sampling to distribute 100 validation points per cover class [42,43]. Following the methods of Chambers et al. (2016) [15] and Davies et al. (2010) [31], we used the source NAIP imagery to visually assign each validation point to the fire refugia cover class if within tree canopy, or the open area cover class if outside of tree canopy. A confusion matrix was computed using the point validation dataset to assess errors of commission and omission, overall accuracy, and the Kappa coefficient (κ) [44] for each fire refugia map.
Field samples collected during the summer of 2017 provided ground truth data for nine of the 10 fire refugia maps (the Monument-Malheur fire was not field-sampled). Ground-truthing was done in conjunction with field data collection for a broader array of fire refugia-related research questions. Accordingly, field plots were stratified along a distance-weighted density (DWD) [11] gradient of fire refugia abundance, whereby DWD values were computed for each fire refugia map pixel based on the number and proximity of surrounding pixels representing fire refugia. Low DWD values indicated areas with little or no fire refugia, and high values indicated high fire refugia density. Continuous DWD values were binned into four classes along natural breaks within both cover classes. Specifically, field sampling plots were stratified such that (1) 25% of plots targeted fire refugia and the remaining 75% targeted open areas, and (2) each DWD-based density class was equally represented. Field technicians confirmed or negated live residual tree canopy cover within randomly selected, 100-m2 (5.64-m radius) plots. As such, the ground truth accuracy assessment reflects a comparison between the mapped presence/absence of trees to the presence/absence of trees within plot. The 100-m2 area was intended to account for any potential NAIP registration error and horizontal accuracy limitations of our handheld GPS units, and also to allow for the efficient collection of vegetation data for analyses not presented here. Fifty field plots were sampled for most fires; 100 were sampled in the two largest burns (Hayman and Rodeo-Chediski). Confusion matrices were computed from the ground truth validation dataset to complement the imagery-based accuracy assessments and further appraise the performance of the classification and delineation methodology.

2.3. Refugia Abundance, Size, and Spatial Distribution

Patch-, class-, and landscape-level spatial pattern metrics were computed for the fire refugia and open area classes using FRAGSTATS (University of Massachusetts Amherst, MA, USA): the Spatial Pattern Analysis Program for Categorical and Continuous Maps [45]. Patches were defined using an 8-pixel neighborhood rule such that pixels sharing a corner node would be considered part of the same patch. Metrics included total class area, class landscape proportion, patch count, patch density, summary of patch sizes, largest patch index (proportion of the landscape occupied by the largest patch), total edge, edge density, and mean shape index (infinitely increasing from one as shape complexity deviates from square). Unless noted otherwise, the remaining statistical analyses were carried out using R software (R Core Team 2016; R Foundation for Statistical Computing, Vienna, Austria, www.r-project.org).
We selected MTBS-distributed products to assess the abundance and spatial patterns of fire refugia because our high-resolution refugia maps provide an opportunity to evaluate these widely available and utilized maps of burn severity. Despite increasing recognition of limitations constraining the use of MTBS-classified datasets these products are commonly used to evaluate fire effects, warranting their comparison with alternative representations of post-fire landscape mosaics. We began by assigning a MTBS burn severity classification to each fire refugia patch based on the class of the Landsat 30-m pixel that it intersected. When a patch spanned numerous 30-m pixels, burn severity context was estimated by assigning it the majority severity class from across all intersected pixels. The relationship between burn severity and refugia patch size was examined by summarizing and plotting the distribution of patch sizes within each burn severity class.
To examine distances to potential tree seed sources within fire perimeters, we used our maps to compute a continuous 1-m resolution Euclidean distance surface from fire refugia patch edges into open areas. MTBS burn severity class and distance values were extracted from 100,000 randomized points across the open area class. Mean distances to nearest fire refugium patch edge and maximum observed distance were determined for each fire. Additionally, the distributions of distance values to nearest fire refugium patch within each burn severity class were plotted to examine how distance varied among classes.
To investigate the distribution of fire refugia across the continuous burn severity gradient, cover class (i.e., refugia vs. open areas), dNBR, and RdNBR values were extracted from the center of every 30-m pixel within each burn perimeter. Burn severity values were segregated by cover class, and their frequencies were plotted as overlapping histograms. To provide additional context, we included MTBS-determined dNBR thresholds of unburned-low, low, moderate, and high-severity, which varied among fires. Burn severity thresholds for RdNBR, established by Miller and Thode (2007) [24], were also included in each RdNBR distribution plot. These RdNBR thresholds were chosen because they are the most widely applied; other RdNBR-based burn severity thresholds have been developed for Washington and Oregon [20,46]. The relatively minor differences between these thresholds were determined to have no influence on key interpretations. The proportions of each burn severity class that were composed of fire refugia and open area cover classes were quantified for both the dNBR and RdNBR indices.

2.4. Optimal Threshold Determination and Classification Assessments

Because classified burn severity products are not expressly intended to detect fire refugia, their use may lead to inaccurate estimates of fire refugia abundance or pattern. We thus explored an alternative classification technique intended to delineate fire refugia by evaluating optimal thresholds of widely available 30-m resolution spectral indices, determined using the known fire refugia locations provided by our high-resolution maps. We assessed two pre- to post-fire differenced indices: dNBR and RdNBR, as well as three post-fire indices: post-fire NBR, post-fire near infrared (NIR), and post-fire shortwave near infrared (SWIR). NBR values were derived from the initial post-fire Landsat scenes used to calculate dNBR and RdNBR that were included in each fire-specific MTBS data bundle. Reflectance values of post-fire NIR and SWIR were extracted from the Landsat Thematic Mapper (TM) and Enhanced Thematic Mapper Plus (ETM+) bands 4 and 7, respectively. Table 1 provides imagery acquisition dates from each fire. Values from each spectral index, as well as the presence or absence of tree cover based on our high-resolution fire refugia maps, were extracted for every 30-m pixel within each fire perimeter, and subsequently used in optimal threshold identification.
Using the presence or absence of fire refugia as the dichotomous outcome, logistic regression was employed to quantify the probability of tree cover for observed burn severity and reflectance values, with individual models for each predictor (i.e., dNBR, RdNBR, post-fire NBR, NIR, or SWIR). These probability values were used to plot the receiver operating characteristic (ROC) curve and calculate the associated area under the curve (AUC) with R package pROC [47] R package PresenceAbsence [48] was used to determine the optimal threshold value of each spectral index that maximized Kappa when predicting the presence of fire refugia. Confusion matrices were utilized to assess the classification performance of each spectral index’s optimal threshold value by using the threshold to segregate index values into predicted fire refugia or open area classes and comparing with the actual condition according to the original high-resolution fire refugia map. The percent correctly classified (PCC) and Kappa coefficients were computed from each statistical model’s confusion matrix. Finally, the classification performance of each spectral index and its optimal threshold were ranked according to AUC, PCC, and Kappa.

3. Results

3.1. Map Accuracy

Imagery-based accuracy assessments of our high-resolution fire refugia maps ranged from 91% to 95% total accuracy (mean = 94%), returning Kappa coefficients between 0.82 and 0.90 (mean = 0.87; see Table 2 for producer’s and user’s accuracy percentages). Ground truth accuracy assessments of fire refugia maps produced results similar to the imagery-based assessments, with total accuracy percentages ranging from 90% to 97% (mean = 95%) and Kappa coefficients between 0.80 and 0.95 (mean = 0.89; see Table 3 for producer’s and user’s accuracy percentages).

3.2. Refugia Abundance, Size, and Spatial Distribution

Collectively, fire refugia accounted for an average of 39% of the overall post-fire landscape within fire perimeters based on our high-resolution fire refugia maps. However, this varied considerably among fires: Poplar (57%) and Pumpkin (51%) post-fire landscapes were dominated by fire refugia, followed by 747 Complex (46%), Hash Rock and Ponil Complex (40%), Missionary Ridge and Rodeo-Chediski (35%), Roberts Creek (33%), Monument-Malheur (30%), and Hayman (20%) (Figure 3). Fire refugia patch sizes were highly variable, ranging from isolated trees as small as 1 m2 (0.0001 ha) to the largest contiguous patch covering 7955.18 ha (Table S1). Mean refugia patch sizes ranged from 0.56 ha to 6.02 ha (overall mean = 2.19 ha), and the area-weighted mean was 2254 ha (Figure S1). The median patch size was 0.01 ha, due to a high frequency of small patches (Figure S1). Though abundant, these small patches accounted for only a small proportion of the all fire refugia; patches less than 0.09 ha (equivalent to one Landsat pixel) accounted for 0.8% of the total mapped area of fire refugia.
Mean fire refugia patch densities were between 0.14 and 0.39 patches ha−1 (Table S1). The largest patch index was highly variable among burns, with each burn’s largest contiguous patch accounting for 5.71% to 55.81% of the total landscape (overall mean of 24.5%; Table S1). The number of patches smaller than 0.09 ha, the minimum classification unit for Landsat-derived burn severity maps, accounted for 11% of the total patch count. Patch size decreased with increasing burn severity, except for within the unburned-low severity class, where median patch sizes were marginally less than those found in low severity regions (Figure 4). Patches that persisted within regions classified as having burned at high-severity tended to be the smallest (mean = 0.01 ha), while average patch sizes were larger in areas classified as low burn severity (mean = 4.68 ha).
Median distances to nearest fire refugia patch edge across all fires ranged from 11.1 m to 67.2 m, with an average median distance of 36.83 m (Table S3). The mean maximum distance across all fires was 784.45 m, with a maximum distance of 1424 m, observed within the Hayman burn (Table S3). Distances varied predictably across dNBR (Figure 5; Table S4) and RdNBR (Figure 5; Table S5) burn severity classes, with the greatest mean distances consistently occurring in regions of high severity, followed by moderate mean distances in regions of moderate severity, and the lowest mean distances in unburned regions and regions of low severity. Across all fires, the median distance to nearest fire refugia edge was 81.39 m in dNBR high-severity regions, 25.61 m in moderate-severity regions, 9.22 m in low-severity regions, and 10.20 m in unburned-low regions (Table S4). A nearly identical pattern of distance variability occurred across RdNBR severity classes (Table S5).
The distribution of dNBR and RdNBR burn severity values extracted from mapped fire refugia and open areas were highly variable among burns. While the fire refugia class was more narrowly distributed than the open areas class, and generally occupied the lower end of the severity gradient, considerable proportions were found across higher severity portions of the gradient (Figure 6, Figure S2). Specifically, across dNBR classes, 1–12% of samples classified as high-severity among fires were composed of fire refugia, with an overall mean of 5% (Table 4). An increasing proportion of the landscape was classified as fire refugia in moderate, low, and unburned-low dNBR severity classes, with fire refugia comprising an average of 30%, 57%, and 62%, respectively (Table 4). RdNBR distributions were nearly identical those of dNBR, with 3–11% of high-severity samples containing forest and generally increasing refugia abundance with decreasing burn severity (Table S6).

3.3. Optimal Threshold Determination and Assessment

The optimal threshold values of RdNBR (threshold = 440) and post-fire NBR (threshold = 0) ranked highest in their ability to predict fire refugia at a finer spatial scale (PPC = 0.77, κ = 0.53; Figure 7). Post-fire NBR (AUC = 0.85) and RdNBR (AUC = 0.84; Figure 7) performed similarly as predictors. Post-fire SWIR ranked third in classification performance (PCC = 0.75, AUC = 0.82, κ = 0.47) followed by dNBR (PCC = 0.72, AUC = 0.79, κ = 0.43; Figure 7). The threshold value of post-fire NIR exhibited almost no ability to predict the presence of trees (PCC = 0.48, AUC = 0.53, κ = 0.06; Figure 7).

4. Discussion

4.1. Refugia Abundance and Burn Severity Context

High-resolution maps of post-fire forest mosaics revealed that fire refugia retaining live trees are generally abundant within fire perimeters and occurred even in regions classified as having burned at high-severity according to two different 30-m Landsat-derived indices. The persistence of fire refugia as part of the mosaic of fire effects represents an important component of post-disturbance landscape complexity, especially in places where disturbance was most severe. The omission of these patches from post-fire assessments, which can occur when relying on 30-m resolution datasets alone, could result in underestimates of tree survival and the associated capacity of forests to recover from high-severity fire effects. While the widely available MTBS database provides a consistently produced and broadly transferrable tool for wildfire trend monitoring and analysis of moderately coarse fire effects, a growing body of literature has highlighted the limitations of these data [20,26,30,49]. In addition to the constraints discussed by these authors, our work highlights another key limitation: spatial resolution.
Our analyses indicated that fire refugia abundance and patch size decreased with increasing burn severity, while distance to nearest refugia patch increased. These results are consistent with the expectations that remotely sensed spectral change is associated with tree canopy mortality; however, our finer-grain characterization of refugia distribution and abundance yields novel insights into sub-30-m pixel spatial variability that can help refine our understanding of the ecological forms and functions of refugia in post-fire systems. Importantly, refugia may provide important islands of residual habitat and seed sources necessary for the natural recovery of the surrounding matrix [50] even in locations mapped as high-severity by Landsat-based change detection.
The quantity and pattern of tree cover along gradients of burn severity and within commonly used severity classification schemes are likely among the most meaningful measures of fire effects for both managers and researchers. Although the extent of tree cover varied considerably across fires, it accounted for an average of 39% of the post-fire landscape. In contrast, a recent Landsat-based study of over 2300 fires across the interior Northwest reported that unburned patches comprised an average of 9.6% of sampled burns [50]. Relative to their quantification of these truly unburned areas, our comparably large average proportion of refugia suggests that much of the surviving forest is likely to have endured some degree of low severity underburn or surface fire exposure. We contrasted our maps with two Landsat-based burn severity classifications, a dNBR-based classification produced by MTBS, which employs threshold values subjectively, and an RdNBR-based classification that employed consistent thresholds [24]. Proportions of fire refugia and open areas show broadly similar patterns using either approach. The application of slightly different RdNBR-based thresholds [46] would yield a similar pattern. These findings demonstrate the challenges posed to end users of these burn severity classifications, especially if they are interested in forest loss, retention, or the capacity for regeneration.

4.2. Refugia Patch Size and Spatial Distribution

The size and configuration of refugia within burn perimeters may provide a range of habitat, seed sources, and support for ecological processes that collectively contribute to post-fire resilience often overlooked after large and/or uncharacteristically severe fire events [6,8,9,11,12,13]. While areas of stand-replacing fire can enhance biodiversity in some systems by giving rise to early seral communities and providing habitat important to a wide variety of biota [51] fire refugia represent habitat islands for forest-dependent species within a highly disturbed matrix. Ecologically optimal patch sizes and distributions are likely dependent on system-, process-, or species-specific dynamics [52,53]. For example, we expect larger patches to harbor more species and support biota that require more contiguous forest habitat. Conversely, numerous small fire refugia, while potentially prone to loss through exposure to the sometimes-harsh conditions of the surrounding matrix (e.g., increased winds), may better preserve ecologically important landscape heterogeneity, patchiness, and complexity [54]. Moreover, many small patches may act as recovery nuclei, attracting dispersers and facilitating enhanced forest regeneration via concentrically expanding recruitment of tree seedlings [55,56]. Coop et al. (2019) [11] found that, for any given proportion of the landscape occupied by forested refugia, small patches produced disproportionately greater areas of forest regeneration. Although a small patch of trees surrounded by widespread mortality may provide less spatially contiguous habitat required by some species, subsequent cohort establishment emanating from these isolated focal areas could significantly increase the rate of reforestation over time relative to inward recruitment from the perimeter of treeless patches alone [57,58]. Accordingly, we expect that optimal fire refugia patch size and configuration will depend largely on the ecological process or function for which optimization is desired (e.g., contiguous forest habitat in the short-term versus long-term forest regeneration).
The spatial distribution of fire refugia patches found in high-severity regions tended to be more isolated, as distance to the nearest fire refugia patch across open areas increased predictably as a function of burn severity. Each fire contained locations where the distance to nearest fire refugia patch, and thus, live seed source, likely was far enough to prohibit adequate recruitment, especially the largest and most severe fires (e.g., the Hayman fire, where the maximum observed distance was 1424 m). Recent studies [15,59] demonstrated that the density of post-fire regeneration for obligate seeding tree species is best explained by variability in distance to live seed source, and they identified distance thresholds beyond which regeneration is unlikely (50 m and 95 m, respectively). While the relative abundance of fire refugia resulted in an overall median distance below the identified thresholds (36.83 m, Table S3), given the large areas of severely burned patches >100 m from a forest patch, it remains likely that a substantial proportion of these landscapes will lack the proximate seed sources necessary to facilitate natural recruitment for many generations. Fine-resolution fire refugia maps, such as those produced for this study, can be used to estimate seed source distance distributions within burn perimeters, thereby contributing to efforts that have sought to identify places were regeneration is most and least likely and serving as an indicator of a forest’s natural recovery potential [15,60]. However, it is important to note that these maps do not account for a wide range of factors important to seed production, including tree age and size, health, and species composition—all of which contribute to variation of post-fire regeneration patterns.
Understanding pre- and post-fire land cover context plays an important role in the characterization of fire refugia mosaics [49]. Our focus in this study was quantifying and characterizing the spatial patterns of trees that persisted through wildfire. A complete accounting of these trees required considering the entire area within study fire perimeters, which included areas that were not completely forested prior to wildfire. Based on the 1992 NLCD classification, an average of 12% of the area within our study fires, and 13% of the areas we mapped as post-fire open areas, was classified at the 30-m resolution as a non-forested land cover type prior to fire (Table S2). As noted earlier, areas that were not classified as forest also contained 10% of our mapped fire refugia, and as such were retained within our analyses. However, many canopy gaps smaller than 30-m were also undoubtedly present prior to our study fires, and pre-fire variability in canopy density and continuity is certain to have shaped patterns of post-fire tree persistence. For example, we found that median seed source distances tended to be slightly higher in regions classified as unburned-low severity compared to low-severity regions. This may be due to low canopy density, larger inter-canopy gaps, and more non-forested area (e.g., meadows, bare soil, scree fields) within this classification. Similarly, persistent tree cover accounted for only 62% and 57% of the total area within portions of fires classified as unburned-low and low-severity, respectively, likely due to lower pre-fire canopy cover in these regions, highlighting how locations with minimal spectral change do not necessarily indicate forest survival [49].

4.3. Optimal Threshold Determination and Assessment

Estimating pre- to post-fire changes with Landsat-derived burn severity indices is an effective method for detecting and monitoring wildfire effects at moderate spatial resolution [24,61,62,63] and Landsat severity assessments have yielded insights into relevant trends, patterns, and processes from a perspective that was previously unavailable. However, our study illustrates that map users should understand the intended purpose and limitations of Landsat-based datasets to avoid inaccurate inferences and interpretations [21,26,49]. The quantification of residual forest is a post-fire attribute that burn severity indices are not intended to capture explicitly, and these challenges largely can be attributed to insufficient spatial resolution of most “off the shelf” products for the detection of small patches and the incompatibility of applying generalized thresholds across geographically broad and heterogeneous regions where variable reflectance values may represent disparate surficial conditions.
By deconstructing Landsat-derived differenced indices into their component temporal and spectral parts, we were able to identify and assess the performance of thresholds specifically intended to detect fire refugia rather than burn severity. These methods align with the recommendations of Kolden et al. (2015) [26], who called for developing burn severity classifications based on ecological metrics important to land management, provide alternative thresholds for classification based on such metrics, and utilize field data to develop these metrics. We identified threshold values of both post-fire NBR and RdNBR suitable for mapping surviving trees within our study burns. The post-fire NBR threshold, with an accuracy of 77%, suggests that it may be superior to differenced indices for predicting the probability of surviving forest in dry mixed-conifer systems when finer-resolution data are not available. The threshold value identified for this spectral index (NBR = 0.00) is likely a function of the typical response of NBR values to the surface reflectance characteristics across recently burned areas. Specifically, the NIR band (TM/ETM+ Band 4) positively reacts to plant productivity, while the SWIR band (TM/ETM+ Band 7) reacts positively to drying or non-vegetated surfaces and is absorbed by live vegetation. Since NBR incorporates the difference of NIR minus SWIR, positive values of NBR are associated with healthy vegetation, while negative values indicate non-living or burned vegetation, bare soil, and rock [23]. Because the NBR value of zero represents the transition between these two states, it serves as a logical threshold for detecting surviving forest with imagery acquired soon after a fire.
Using a post-fire NBR threshold for fire refugia classification may provide a slight advantage over the differenced indices because NBR simply infers the vegetated state of any given post-fire pixel, reducing the likelihood of omitting surviving vegetation and misclassifying non-vegetated pixels. Conversely, because differenced indices (i.e., dNBR and RdNBR) estimate the degree of vegetative change from pre- to post-fire, surfaces that were non-vegetated pre-fire would likely be unchanged and misclassified as surviving forest under a binary scheme, illustrating the utility of incorporating pre-fire vegetation data to address this challenge [49]. Similarly, areas that burned at moderate severity but retained some residual trees may still register as changed beyond a given severity threshold, increasing the probability of being interpreted as lacking live trees. Furthermore, employing an optimal threshold-based classification cannot overcome the constraint of spatial resolution when precise classification and fine-scale maps are desired—as indicated by the overall low values of Kappa (i.e., κ ≈ 0.5 or less) for all Landsat-derived indices when validated against the high-resolution fire refugia maps.
Improved classification in forest systems could be achieved by complementing burn severity data with more advanced remote sensing techniques. Tools such as NAIP-imagery, very-high resolution (VHR) multispectral data, light detection and ranging (LiDAR), and spectral unmixing of remotely sense images have shown promise in precision detection and characterization of the sub-30 m spatial variability of fire effects [64,65,66]. Although these high-resolution data are being collected more frequently, access to commercially acquired VHR imagery can be prohibitively expensive, and airborne LiDAR datasets are currently limited in their spatial and temporal coverage. Accordingly, Landsat-based spectral indices will continue to be the most widely applicable fire mapping tool, particularly for assessments of fire patterns across large spatial and temporal domains.

5. Conclusions

The ability to accurately identify, quantify, and characterize fire refugia that may sustain vulnerable biota is of increasing importance to land managers and conservation planners faced with an uncertain future [67]. The resilience-supporting capacity of fire refugia may be of critical importance in ponderosa pine and dry mixed-conifer systems, where disturbance regimes have been altered by direct and indirect human influences [68] and even small refugia can promote tree regeneration within a severely burned matrix [11,12]. Identifying and characterizing these post-fire ecosystem legacies can help resource managers anticipate potential ecosystem shifts and develop targeted management interventions that promote forest persistence [69].
Our study utilized high-resolution datasets to provide new insights into the abundance and spatial patterns of fire refugia in ponderosa pine and dry mixed-conifer forests, emphasizing the value of accompanying commonly employed tools for analyzing post-fire landscapes with finer-resolution forest mapping techniques. Our findings add to a growing consensus that Landsat-based burn severity products have important limitations and underscore that ecologically important components of the post-fire landscape may go largely undetected by Landsat-derived burn severity indices. As advanced remote sensing technology and imagery products become more widely available, researchers and resource managers will have new tools and capabilities to complement existing burn severity products and better detect and monitor fire refugia. High-resolution fire refugia maps can inform management efforts to conserve these remnant habitats and nuclei of forest regeneration. These maps also could enable forest restoration practitioners to optimize limited reforestation resources by targeting burned regions farthest from fire refugia patches, where natural tree regeneration is least likely and forest recovery is most constrained. However, while recent work has highlighted how fire refugia may promote post-fire forest regeneration [11,12,13], their capacity to support a wide range of other essential ecological processes has been the subject of little quantitative research. Fine-scale mapping efforts, such as those developed here, may facilitate further exploration of a host of associated questions. For example, refugia size, shape, and neighborhood configuration may affect their importance as habitat for a wide range of forest-dependent biota and ecological communities, as well as their long-term dynamics (e.g., expansion or contraction). Beyond developing such an understanding, however, effective management and conservation efforts will also depend on identifying the limitations of refugia in mitigating ongoing environmental change [67].

Supplementary Materials

The following are available online at https://www.mdpi.com/1999-4907/10/9/782/s1, Figure S1: Size distribution of mapped fire refugia patches. Figure S2: Distributions of RdNBR values by cover class. Vertical lines indicate Miller and Thode (2007) thresholds for unburned-low (U-L; RdNBR < 69), low (L; RdNBR 69–315;), moderate (M; RdNBR 316–640), and high (H; RdNBR ≥ 641) severity classes. Note: y-axis scale varies among fires. Table S1: Spatial pattern metrics for fire refugia patches summarized by burn. Table S2: Percent of pre-fire landscapes composed of non-forest land cover types (from the 30-m National Land Cover Dataset; Vogelmann et al. 2001), percent of post-fire open areas (from the 1-m fire refugia maps) that were classified as pre-fire non-forest land cover, and the percent of fire refugia (from the 1-m fire refugia maps) that occurred in areas classified as a pre-fire non-forest land cover. Table S3: Summary of distances to nearest seed source (m) across open areas and maximum observed distance. Table S4: Distances to nearest seed source (m) across open areas, as inferred by Euclidean distance to nearest fire refugia patch edge, partitioned by dNBR burn severity class. Values are mean ± one standard deviation. Table S5: Distances to nearest seed source across open areas, as inferred by Euclidean distance to nearest fire refugia patch edge, partitioned by RdNBR burn severity class (Miller and Thode 2007). Table S6: Proportion of each RdNBR burn severity class (based on Miller and Thode 2007) composed of fire refugia and open areas.

Author Contributions

Conceptualization, R.B.W, J.D.C., W.M.D, M.A.K., and G.W.M., Methodology, R.B.W., J.D.C., W.M.D., M.A.K., G.W.M., and S.L.M.; Analysis, R.B.W., Writing—Original Draft Preparation, R.B.W. and J.D.C.; Writing—Review & Editing, R.B.W., J.D.C., W.M.D., M.A.K., S.L.M., and G.W.M.; Funding Acquisition, J.D.C. and M.A.K.

Funding

This research was funded by the National Fire Plan, through agreements between the USFS Rocky Mountain Research Station Aldo Leopold Wilderness Research Institute, Oregon State University (JVA 16-JV-11221639-101), and Western Colorado University (16-JV-11221639-107).

Acknowledgments

We thank Taylor Applewhite, Timothy DeLory, Conrad Kaul, Johnathan Kelley, Owen Richman, Jean McCalmont, Julie VanSant, and Claire Tortorelli for assistance with field sampling. Access to field sites was greatly facilitated by staff at the Philmont Scout Ranch, Grand Canyon National Park, and the following US National Forests: Carson, Coconino, Navajo, Pike-San Isabel, San Juan, Santa Fe, Ochoco, Umatilla, and Malheur. We also thank members of the fire refugia team, including Sandra Haire, Marc André Parisien, Ellen Whitman, Marie-Pierre Rogeau, Carol Miller, and Geneva Chong, for abundant and useful feedback and discussion.

Conflicts of Interest

The authors declare no conflict of interest.

References

  1. Agee, J.K. The landscape ecology of western forest fire regimes. Northwest Sci. 1998, 72, 24–34. [Google Scholar]
  2. Whitlock, C.; Shafer, S.L.; Marlon, J. The role of climate and vegetation change in shaping past and future fire regimes in the northwestern US and the implications for ecosystem management. For. Ecol. Manag. 2003, 178, 5–21. [Google Scholar] [CrossRef]
  3. Collins, B.M.; Stephens, S.L. Stand-replacing patches within a “mixed severity” fire regime: Quantitative characterization using recent fires in a long-established natural fire area. Landsc. Ecol. 2010, 25, 927–939. [Google Scholar] [CrossRef]
  4. Keyser, A.; Westerling, A. Climate drives inter-annual variability in probability of high severity fire occurrence in the western United States. Environ. Res. Lett. 2017, 12, 065003. [Google Scholar] [CrossRef]
  5. Parks, S.; Holsinger, L.; Panunto, M.; Jolly, W.M.; Dobrowski, S.; Dillon, G. High severity fire: Evaluating its key drivers and mapping its probability across western US forests. Environ. Res. Lett. 2018, 13, 044037. [Google Scholar] [CrossRef]
  6. Meddens, A.J.; Kolden, C.A.; Lutz, J.A.; Smith, A.M.; Cansler, C.A.; Abatzoglou, J.T.; Meigs, G.W.; Downing, W.M.; Krawchuk, M.A. Fire Refugia: What Are They, and Why Do They Matter for Global Change? BioScience 2018, 68, 944–954. [Google Scholar] [CrossRef]
  7. Keppel, G.; Van Niel, K.P.; Wardell-Johnson, G.W.; Yates, C.J.; Byrne, M.; Mucina, L.; Schut, A.G.T.; Hopper, S.D.; Franklin, S.E. Refugia: Identifying and understanding safe havens for biodiversity under climate change. Glob. Ecol. Biogeogr. 2012, 21, 393–404. [Google Scholar] [CrossRef]
  8. Camp, A.; Oliver, C.; Hessburg, P.; Everett, R. Predicting late-successional fire refugia pre-dating European settlement in the Wenatchee Mountains. For. Ecol. Manag. 1997, 95, 63–77. [Google Scholar] [CrossRef]
  9. Krawchuk, M.A.; Haire, S.L.; Coop, J.; Parisien, M.-A.; Whitman, E.; Chong, G.; Miller, C. Topographic and fire weather controls of fire refugia in forested ecosystems of northwestern North America. Ecosphere 2016, 7, e01632. [Google Scholar] [CrossRef]
  10. Ouarmim, S.; Paradis, L.; Asselin, H.; Bergeron, Y.; Ali, A.; Hély, C. Burning potential of fire refuges in the boreal mxedwood forest. Forests 2016, 7, 246. [Google Scholar] [CrossRef]
  11. Coop, J.D.; DeLory, T.J.; Downing, W.M.; Haire, S.L.; Krawchuk, M.A.; Miller, C.; Perisient, M.-A.; Walker, R.B. Contributions of fire refugia to resilient ponderosa pine and dry mixed-conifer forest landscapes. Ecosphere 2019, 10, e02809. [Google Scholar] [CrossRef]
  12. Downing, W.M.; Krawchuk, M.A.; Meigs, G.W.; Haire, S.L.; Coop, J.D.; Walker, R.B.; Whitman, E.; Chong, G.; Miller, C. Influence of fire refugia spatial pattern on post-fire forest recovery in Oregon’s Blue Mountains. Landsc. Ecol. 2019, 34, 771–792. [Google Scholar] [CrossRef]
  13. Landesmann, J.B.; Morales, J.M. The importance of fire refugia in the recolonization of a fire-sensitive conifer in northern Patagonia. Plant Ecol. 2018, 219, 455–466. [Google Scholar] [CrossRef]
  14. Barton, A.M.; Poulos, H.M. Pine vs. oaks revisited: Conversion of Madrean pine-oak forest to oak shrubland after high-severity wildfire in the Sky Islands of Arizona. For. Ecol. Manag. 2018, 414, 28–40. [Google Scholar] [CrossRef]
  15. Chambers, M.E.; Fornwalt, P.J.; Malone, S.L.; Battaglia, M.A. Patterns of conifer regeneration following high severity wildfire in ponderosa pine—Dominated forests of the Colorado Front Range. For. Ecol. Manag. 2016, 378, 57–67. [Google Scholar] [CrossRef]
  16. Coop, J.D.; Parks, S.A.; McClernan, S.R.; Holsinger, L.M. Influences of prior wildfires on vegetation response to subsequent fire in a reburned Southwestern landscape. Ecol. Appl. 2016, 26, 346–354. [Google Scholar] [CrossRef] [PubMed]
  17. Haffey, C.; Sisk, T.D.; Allen, C.D.; Thode, A.E.; Margolis, E.Q. Limits to ponderosa pine regeneration following large high-severity forest fires in the Unites States Southwest. Fire Ecol. 2018, 14, 143–163. [Google Scholar]
  18. Savage, M.; Mast, J.N. How resilient are southwestern ponderosa pine forests after crown fires? Can. J. For. Res. 2005, 35, 967–977. [Google Scholar] [CrossRef] [Green Version]
  19. Tepley, A.J.; Thompson, J.R.; Epstein, H.E.; Anderson-Teixeira, K.J. Vulnerability to forest loss through altered postfire recovery dynamics in a warming climate in the Klamath Mountains. Glob. Chang. Biol. 2017, 23, 4117–4132. [Google Scholar] [CrossRef]
  20. Cansler, C.A.; McKenzie, D. How robust are burn severity indices when applied in a new region? Evaluation of alternate feld-based and remote-sensing methods. Remote Sens. 2012, 4, 456–483. [Google Scholar] [CrossRef]
  21. French, N.H.F.; Kasischke, E.S.; Hall, R.J.; Murphy, K.A.; Verbyla, D.L.; Hoy, E.E.; Allen, J.L. Using Landsat data to assess fire and burn severity in the North American boreal forest region: An overview and summary of results. Int. J. Wildland Fire 2008, 17, 443. [Google Scholar] [CrossRef]
  22. López-García, M.J.; Caselles, V. Mapping burns and natural reforestation using thematic Mapper data. Geocarto Int. 1991, 6, 31–37. [Google Scholar] [CrossRef]
  23. Key, C.H.; Benson, N.C. Landscape assessment: Remote sensing of severity, the Normalized Burn Ratio; and Ground measure of severity, the Composite Burn Index. In FIREMON: Fire Effects Monitoring and Inventory System; General Technical Report RMRS-GTR-164-CD:LA1-LA51 2005; Lutes, D.C., Keane, R.E., Caratti, J.F., Key, C.H., Benson, N.C., Gangi, L.J., Eds.; U.S. Department of Agriculture, Forest Service, Rocky Mountain Research Station: Ogden, UT, USA, 2006. [Google Scholar]
  24. Miller, J.D.; Thode, A.E. Quantifying burn severity in a heterogeneous landscape with a relative version of the delta Normalized Burn Ratio (dNBR). Remote Sens. Environ. 2007, 109, 66–80. [Google Scholar] [CrossRef]
  25. Eidenshink, J.; Schwind, B.; Brewer, K.; Zhu, Z.-L.; Quayle, B.; Howard, S. A Project for Monitoring Trends in Burn Severity. Fire Ecol. 2007, 3, 3–21. [Google Scholar] [CrossRef]
  26. Kolden, C.A.; Smith, A.M.S.; Abatzoglou, J.T. Limitations and utilisation of Monitoring Trends in Burn Severity products for assessing wildfire severity in the USA. Int. J. Wildland Fire 2015, 7, 1023–1028. [Google Scholar] [CrossRef]
  27. Berry, L.E.; Driscoll, D.A.; Stein, J.A.; Blanchard, W.; Banks, S.C.; Bradstock, R.A.; Lindenmayer, D.B. Identifying the location of fire refuges in wet forest ecosystems. Ecol. Appl. 2015, 25, 2337–2348. [Google Scholar] [CrossRef] [Green Version]
  28. Haire, S.; Coop, J.D.; Miller, C. Characterizing Spatial Neighborhoods of Refugia Following Large Fires in Northern New Mexico USA. Land 2017, 6, 19. [Google Scholar] [CrossRef]
  29. Kolden, C.A.; Lutz, J.A.; Key, C.H.; Kane, J.T.; van Wagtendonk, J.W. Mapped versus actual burned area within wildfire perimeters: Characterizing the unburned. For. Ecol. Manag. 2012, 286, 38–47. [Google Scholar] [CrossRef]
  30. Meddens, A.J.H.; Kolden, C.A.; Lutz, J.A. Detecting unburned areas within wildfire perimeters using Landsat and ancillary data across the northwestern United States. Remote Sens. Environ. 2016, 186, 275–285. [Google Scholar] [CrossRef]
  31. Davies, K.W.; Petersen, S.L.; Johnson, D.D.; Davis, D.B.; Madsen, M.D.; Zvirzdin, D.L.; Bates, J.D. Estimating juniper cover from National Agriculture Imagery Program (NAIP) Imagery and evaluating relationships between potential cover and environmental variables. Rangel. Ecol. Manag. 2010, 63, 630–637. [Google Scholar] [CrossRef]
  32. Liknes, G.C.; Perry, C.H.; Meneguzzo, D.M. Assessing tree cover in agricultural landscapes using high-resolution aerial imagery. J. Terr. Obs. 2010, 2, 38–55. [Google Scholar]
  33. Meneguzzo, D.M.; Liknes, G.C.; Nelson, M.D. Mapping trees outside forests using high-resolution aerial imagery: A comparison of pixel- and object-based classification approaches. Environ. Monit. Assess. 2013, 185, 6261–6275. [Google Scholar] [CrossRef] [PubMed]
  34. Everett, R.L.; Schellhaas, R.; Keenum, D.; Spurbeck, D.; Ohlson, P. Fire history in the ponderosa pine/Douglas-fir forests on the east slope of the Washington Cascades. For. Ecol. Manag. 2000, 129, 207–225. [Google Scholar] [CrossRef]
  35. Veblen, T.T.; Kitzberger, T.; Donnegan, J. Climatic and human influences on fire regimes in ponderosa pine forests in the Colorado Front Range. Ecol. Appl. 2000, 10, 1178–1195. [Google Scholar] [CrossRef]
  36. Vogelmann, J.E.; Howard, S.M.; Yang, L.; Larson, C.R.; Wylie, B.K.; Van Driel, J.N. Completion of the 1990’s National Land Cover Data Set for the conterminous United States. Photogramm. Eng. Remote Sens. 2001, 67, 650–662. [Google Scholar]
  37. EarthExplorer. Available online: https://earthexplorer.usgs.gov/ (accessed on 20 August 2016).
  38. Monitoring Trends in Burn Severity (MTBS). Available online: https://mtbs.gov/ (accessed on 20 August 2016).
  39. Esri. ArcGIS Desktop: Release 10.4.1; Environmental Systems Research Institute: Redlands, CA, USA, 2016. [Google Scholar]
  40. Cho, H.K.; Lee, W.K.; Lee, S.H. Mapping of vegetation cover using segment based classification of IKONOS imagery. Korean J. Ecol. 2003, 26, 75–81. [Google Scholar] [CrossRef]
  41. Kim, S.R.; Lee, W.K.; Kwak, D.A.; Biging, G.; Gong, P.; Lee, J.H.; Cho, H.K. Forest Cover Classification by Optimal Segmentation of High Resolution Satellite Imagery. Sensors 2011, 11, 1943–1958. [Google Scholar] [CrossRef] [Green Version]
  42. Congalton, R.G. A review of assessing the accuracy of classifications of remotely sensed data. Remote Sens. Environ. 1991, 37, 35–46. [Google Scholar] [CrossRef]
  43. Stehman, S.V.; Czaplewski, R.L. Design and analysis for thematic map accuracy assessment: fundamental principles. Remote Sens. Environ. 1998, 64, 331–344. [Google Scholar] [CrossRef]
  44. Cohen, J. A coefficient of agreement for nominal scales. Edu. Psychol. Meas. 1960, 20, 37–46. [Google Scholar] [CrossRef]
  45. McGarigal, K.; Cushman, S.A.; Ene, E. FRAGSTATS v4: Spatial Pattern Analysis Program for Categorical and Continuous Maps. Computer Software Program Produced by the Authors at the University of Massachusetts, Amherst. 2012. Available online: http://www.umass.edu/landeco/research/fragstats/fragstats.html (accessed on 1 February 2017).
  46. Reilly, M.J.; Dunn, C.J.; Meigs, G.W.; Spies, T.A.; Kennedy, R.E.; Bailey, J.D.; Briggs, K. Contemporary patterns of fire extent and severity in forests of the Pacific Northwest, USA (1985–2010). Ecosphere 2017, 8, e01695. [Google Scholar] [CrossRef]
  47. Robin, X.; Turck, N.; Hainard, A.; Tiberti, N.; Lisacek, F.; Sanchez, J.-C.; Müller, M. pROC: An open-source package for R and S+ to analyze and compare ROC curves. BMC Bioinform. 2011, 12, 77. [Google Scholar] [CrossRef] [PubMed]
  48. Freeman, E.A.; Moisen, G. PresenceAbsence: An R Package for Presence Absence Analysis. J. Stat. Softw. 2008, 23, 31. [Google Scholar] [CrossRef]
  49. Meigs, G.W.; Krawchuk, M.A. Composition and structure of forest fire refugia: What are the ecosystem legacies across burned landscapes? Forests 2018, 9, 243. [Google Scholar] [CrossRef]
  50. Meddens, A.J.H.; Kolden, C.A.; Lutz, J.A.; Abatzoglou, J.T.; Hudak, A.T. Spatiotemporal patterns of unburned areas within fire perimeters in the northwestern United States from 1984 to 2014. Ecosphere 2018, 9, e02029. [Google Scholar] [CrossRef]
  51. Hanson, C.T.; Sherriff, R.L.; Hutto, R.L.; DellaSala, D.A.; Veblen, T.T.; Baker, W.L. Setting the stage for mixed-and high-severity Fire. In The Ecological Importance of Mixed-Severity Fires; Elsevier: Amsterdam, The Netherlands, 2015. [Google Scholar]
  52. Robert, A. The effects of spatially correlated perturbations and habitat configuration on metapopulation persistence. Oikos 2009, 118, 1590–1600. [Google Scholar] [CrossRef]
  53. Simberloff, D.; Abele, L.G. Refuge Design and Island Biogeographic Theory: Effects of Fragmentation. Am. Nat. 1982, 120, 41–50. [Google Scholar] [CrossRef]
  54. Kane, V.R.; North, M.P.; Lutz, J.A.; Churchill, D.J.; Roberts, S.L.; Smith, D.F.; McGaughey, R.J.; Kane, J.T.; Brooks, M.L. Assessing fire effects on forest spatial structure using a fusion of Landsat and airborne LiDAR data in Yosemite National Park. Remote Sens. Environ. 2014, 151, 89–101. [Google Scholar] [CrossRef]
  55. Schlawin, J.R.; Zahawi, R.A. “Nucleating” succession in recovering neotropical wet forests: The legacy of remnant trees. J. Veg. Sci. 2008, 19, 485–492. [Google Scholar] [CrossRef]
  56. Yarranton, G.A.; Morrison, R.G. Spatial Dynamics of a Primary Succession: Nucleation. J. Ecol. 1974, 62, 417–428. [Google Scholar] [CrossRef]
  57. Corbin, J.D.; Holl, K.D. Applied nucleation as a forest restoration strategy. For. Ecol. Manag. 2012, 265, 37–46. [Google Scholar] [CrossRef]
  58. Toh, I.; Gillespie, M.; Lamb, D. The Role of Isolated Trees in Facilitating Tree Seedling Recruitment at a Degraded Sub-Tropical Rainforest Site. Restor. Ecol. 1999, 7, 288–297. [Google Scholar] [CrossRef]
  59. Kemp, K.B.; Higuera, P.E.; Morgan, P. Fire legacies impact conifer regeneration across environmental gradients in the U.S. northern Rockies. Landsc. Ecol. 2016, 31, 619–636. [Google Scholar] [CrossRef]
  60. Haire, S.L.; McGarigal, K. Effects of landscape patterns of fire severity on regenerating ponderosa pine forests in New Mexico and Arizona, USA. Landsc. Ecol. 2010, 25, 1055–1069. [Google Scholar] [CrossRef]
  61. Escuin, S.; Navarro, R.; Fernández, P. Fire severity assessment by using NBR (Normalized Burn Ratio) and NDVI (Normalized Difference Vegetation Index) derived from LANDSAT TM/ETM images. Int. J. Remote Sens. 2008, 29, 1053–1073. [Google Scholar] [CrossRef]
  62. Parks, S.; Dillon, G.; Miller, C. A New Metric for Quantifying Burn Severity: The Relativized Burn Ratio. Remote Sens. 2014, 6, 1827–1844. [Google Scholar] [CrossRef] [Green Version]
  63. Van Wagtendonk, J.W.; Root, R.R.; Key, C.H. Comparison of AVIRIS and Landsat ETM+ detection capabilities for burn severity. Remote Sens. Environ. 2004, 92, 397–408. [Google Scholar] [CrossRef]
  64. Alonzo, M.; Morton, D.C.; Cook, B.D.; Andersen, H.-E.; Babcock, C.; Pattison, R. Patterns of canopy and surface layer consumption in a boreal forest fire from repeat airborne lidar. Environ. Res. Lett. 2017, 12, 065004. [Google Scholar] [CrossRef]
  65. Bolton, D.K.; Coops, N.C.; Wulder, M.A. Characterizing residual structure and forest recovery following high-severity fire in the western boreal of Canada using Landsat time-series and airborne lidar data. Remote Sens. Environ. 2015, 163, 48–60. [Google Scholar] [CrossRef]
  66. Meng, R.; Wu, J.; Schwager, K.L.; Zhao, F.; Dennison, P.E.; Cook, B.D.; Brewster, K.; Green, T.M.; Serbin, S.P. Using high spatial resolution satellite imagery to map forest burn severity across spatial scales in a Pine Barrens ecosystem. Remote Sens. Environ. 2017, 191, 95–109. [Google Scholar] [CrossRef] [Green Version]
  67. Keppel, G.; Wardell-Johnson, G.W. Refugia: keys to climate change management. Glob. Chang. Biol. 2012, 18, 2389–2391. [Google Scholar] [CrossRef]
  68. Allen, C.D.; Savage, M.; Falk, D.A.; Suckling, K.F.; Swetnam, T.W.; Schulke, T.; Stacey, P.B.; Morgan, P.; Hoffman, M.; Klingel, J.T. Ecological Restoration of Southwestern Ponderosa Pine Ecosystems: A Broad Perspective. Ecol. Appl. 2002, 12, 1418–1433. [Google Scholar] [CrossRef]
  69. Johnstone, J.F.; Allen, C.D.; Franklin, J.F.; Frelich, L.E.; Harvey, B.J.; Higuera, P.E.; Mack, M.C.; Meentemeyer, R.K.; Metz, M.R.; Perry, G.L.; et al. Changing disturbance regimes, ecological memory, and forest resilience. Front. Ecol. Environ. 2016, 14, 369–378. [Google Scholar] [CrossRef]
Figure 1. Study fires (indicated by red fire perimeters) across the northwestern and southwestern study regions.
Forests 10 00782 g001
Figure 2. Image processing and classification flow, as follows: (a) 1-m resolution post-fire NAIP image, (b) object-based result of image segmentation, and (c) final classified product (transparent map displayed over original source image).
Forests 10 00782 g002
Figure 3. Fire refugia map for each fire and landscape proportions of each cover class. Note: map scale varies among burns.
Forests 10 00782 g003
Figure 4. Summary of fire refugia patch sizes partitioned by burn severity for (a) Monitoring Trends in Burn Severity (MTBS) differenced normalized burn ratio (dNBR)-based severity classes and (b) relative differenced normalized burn ratio (RdNBR)-based severity classes (Miller and Thode 2007). Note: y-axis is log-scaled.
Forests 10 00782 g004
Figure 5. Distances to nearest live tree within open areas, as inferred by Euclidean distance to nearest fire refugia patch edge, partitioned by (a) dNBR- and (b) RdNBR-based burn severity classes. Note: y-axis is log-scaled.
Forests 10 00782 g005
Figure 6. Distributions of dNBR values by cover class. Vertical lines indicate MTBS thresholds for unburned-low (U-L), low (L), moderate (M), and high (H) severity classes (threshold values vary by fire). Note: y-axis scale varies among burns.
Forests 10 00782 g006
Figure 7. Distribution of spectral index values partitioned by cover class, logistic regression curves, optimal threshold values, and binary classification performance metrics for (a) post-fire NBR, (b) RdNBR, (c) post-fire shortwave near infrared (SWIR), (d) dNBR, and (e) and post-fire near infrared (NIR).
Forests 10 00782 g007
Table 1. Summary of fire start dates and imagery acquisition dates used for mapping and analysis. Imagery was obtained from the National Agricultural Imagery Program (NAIP), Landsat Thematic Mapper (TM) and the Enhanced Thematic Mapper Plus (ETM+).
NAIP Acquisition DateLandsat Acquisition Date (Sensor)
FireStateYearFire Start DayPost-FirePre-FirePost-Fire
747 ComplexOregon200213 July2012-07-232002-06-13 (ETM+)2003-07-10 (TM5)
Hash RockOregon200023 August2014-07-052000-08-01 (ETM+)2001-08-20 (ETM+)
HaymanColorado20028 June2013-09-262001-08-24 (TM5)2003-08-14 (TM5)
Missionary RidgeColorado20029 June2011-08-082002-06-06 (TM5)2003-06-25 (TM5)
Monument-MalheurOregon200212 July2012-07-112001-08-06 (ETM+)2003-08-20 (TM5)
Ponil ComplexNew Mexico20028 June2011-05-312001-05-20 (TM5)2003-10-17 (TM5)
PoplarArizona200330 September2013-06-202002-06-28 (ETM+)2004-07-11 (TM5)
PumpkinArizona200025 May2013-06-071998-06-25 (TM5)2001-06-09 (ETM+)
Roberts CreekOregon200212 July2012-07-212001-08-06 (ETM+)2003-08-20 (TM5)
Rodeo-ChediskiArizona200218 June2007-09-222001-05-01 (ETM+)2003-04-29 (TM5)
Note: Sensor denotes Landsat sensor generation.
Table 2. Imagery-based accuracy assessments from confusions matrices computed for each fire.
Producer’s AccuracyUser’s AccuracyTotal
FireOpen AreasFire RefugiaOpen AreasFire RefugiaAccuracyK
747 Complex0.940.940.940.940.940.88
Hash Rock0.900.940.940.900.920.84
Hayman0.930.960.960.930.950.89
Missionary Ridge0.980.900.910.980.940.88
Monument-Malheur0.960.940.940.960.950.90
Ponil Complex0.950.920.920.950.940.87
Poplar0.890.930.930.890.910.82
Pumpkin0.880.990.990.890.940.87
Roberts Creek1.000.910.901.000.950.90
Rodeo-Chediski0.930.940.940.930.940.87
Overall mean0.940.940.940.940.940.87
Table 3. Ground truth accuracy assessments from confusions matrices computed for each fire.
Producer’s AccuracyUser’s AccuracyTotal
FireOpen AreasFire RefugiaOpen AreasFire RefugiaAccuracyK
747 Complex0.980.880.960.950.950.88
Hash Rock0.951.001.000.850.960.89
Hayman0.980.880.960.950.950.88
Missionary Ridge1.000.920.971.000.980.95
Monument-Malheur------
Ponil Complex1.000.800.921.000.940.85
Poplar0.970.870.950.930.940.86
Pumpkin0.970.920.970.920.960.90
Roberts Creek0.940.860.940.860.920.80
Rodeo-Chediski1.000.890.961.000.970.92
Overall mean0.980.890.960.940.950.89
Note: Ground-truthing was not conducted for the Monument-Malheur Fire.
Table 4. Proportion of each MTBS dNBR burn severity class composed of fire refugia and open areas.
HighModerateLowUnburned-Low
FireFire refugiaOpen AreasFire RefugiaOpen AreasFire RefugiaOpen AreasFire RefugiaOpen Areas
747 Complex0.120.880.420.580.610.390.380.62
Hash Rock0.010.990.130.870.520.480.720.28
Hayman0.050.950.190.810.370.630.440.56
Missionary Ridge0.040.960.210.790.510.490.600.40
Monument-Malheur0.050.950.300.700.560.440.590.41
Ponil Complex0.070.930.360.640.550.450.680.32
Poplar0.050.950.340.660.710.290.760.24
Pumpkin0.030.970.360.640.720.280.740.26
Roberts Creek0.040.960.310.690.520.480.600.40
Rodeo-Chediski0.060.940.400.600.680.320.650.35
Overall mean0.050.950.300.700.570.430.620.38

