Article

Size Effect on the Elastic Mechanical Properties of Beech and Its Application in Finite Element Analysis of Wood Structures

1
Co-Innovation Center of Efficient Processing and Utilization of Forest Resources, Nanjing Forestry University, Nanjing 210037, China
2
College of Furnishings and Industrial Design, Nanjing Forestry University, Nanjing 210037, China
3
Department of sustainable Bioproducts, Mississippi State University, Mississippi State, MS 39762-9820, USA
*
Author to whom correspondence should be addressed.
Forests 2019, 10(9), 783; https://doi.org/10.3390/f10090783
Submission received: 7 August 2019 / Revised: 28 August 2019 / Accepted: 30 August 2019 / Published: 9 September 2019
(This article belongs to the Section Forest Ecophysiology and Biology)

Abstract

:
Elastic constants of wood are fundamental parameters used in finite element analysis of wood structures. However, few studies and standards regulate the dimensions of sample used to measure elastic constants of wood. The size effect on mechanical properties (i.e., elastic constants and proportional limit stresses) of European beech (Fagus sylvatica L.) wood was studied with five different sizes samples. The data of experiments were inputted into a finite element model of self-designed chair and the loading capacity of chair was investigated by finite element method (FEM) and experiment. The results showed that nonlinear relationships were found between proportional limit stresses, cross-sectional area, and height of specimen by response surface method with R2 greater than 0.72 in longitudinal, radial, and tangential directions. Elastic moduli and shear moduli increased with the height of specimen when cross-sectional area was kept constant, and decreased with an increased cross-sectional area of specimen, when the height was a constant, while the trends of Poisson’s ratio were not as expected. The comparisons between experiment and FEM suggested that the accuracy of FEM simulation increase with the raise of width-height ratio (≤1) of specimens used to determine the elastic constants. It is recommended to use small cubic wood specimen to determine the elastic mechanical properties used for finite element analysis of beech wood structures. Further research to find optimized wood specimen dimensions to get mechanical properties for FEM is quite necessary.

1. Introduction

The influence of size on strength is well-known for various materials and testing methods, but not enough data and knowledge of the effect on wood elastic mechanical properties under compression were studied [1], such as proportional limits and elastic constants. The elastic mechanical properties are basic characteristics of wood that play an important role in wood construction and engineering design. Elastic constants and proportional limit strength of wood are prerequisites for establishing the numerical model of wood products and wooden constructions. However, there is no standard to regulate the method of measuring the elastic constants of wood, which leads researchers to use different methods and different dimensions of specimens to determine them. This may not help the development of wood science and technology profession.
Among different methods, the method of electric resistance strain gauge is widely used in measuring the elastic constants of wood. Nonetheless, there is no standard to be referred to, especially the dimensions of so-called small clear specimen, for the test, which causes inconsistent results of elastic constants determined by different sizes of specimens [2]. Generally, the dimensions of wood blocks used to determine the elastic constants were 20 × 20 × 30 mm (length × width × height) [3,4,5], 20 × 20 × 60 mm [6,7], and 30 × 30 × 60 mm [8,9]. Nevertheless, Liu et al. [10] determined the 12 elastic constants of larch forest using the specimens referring to ASTM D1990 [11] with 25 × 25 × 100 mm specimens for longitudinal compression and 50 × 50 × 150 mm specimens for transverse compression.
It is known that the size effect causes the mechanical properties of wood not to be constant, but variables with changes of dimensions of specimens. Best known in wood science is the weakest link theory (WLT), formulated and experimentally verified by Weibull based on the theory of perfectly brittle materials, which fails at the initiation of macro-cracking [1]. Many studies have been reported on size effect on wood mechanical properties. For example, the size effect on bending strength of wood has been studied. Straže and Gorišek [12] determined the modulus of bending elasticity MOE (stat) and maximum bending strength by the three-point bending method and showed varying results of squared cross-section (a = 20...45...70 mm) of the same specimens. Free-free flexural vibration tests were carried out additionally to determine dynamic modulus of elasticity (MOE (dyn)). Results showed that a positive and strong correlation existed between MOE (stat) and MOE (dyn) at larger wood members (a > 45 mm). Clear wood specimens are suggested to be used at mechanical testing of small-size wood. Madsen and Tomoi [13] studied the size effect on the bending strength of spruce (Picea sp. A. Dietr.), pine (Pinus sp. L.) and fir (Abies sp. Mill.). Their results indicated that the length effects were very pronounced, while thickness did not affect the strength quality. Zhou et al. [14] investigated the dependence between the flexural strength and the size of Chinese fir (Cunninghamia lanceolata (Lamb.) Hook.). Their results showed that the length size effects by the slope method [15] were 0.43 and 0.33, respectively for 5th and 50th percentiles of flexural strength that were higher than the foreign study results [16,17] and the specified value (0.14) in ASTM D1990 [11]. Fotsing and Foudjet [18] studied the size effect of two Cameroonian hardwoods in compression and bending strength parallel to the wood grain. The behavior of wood at failure was modeled by the Weibull’s law of three parameters for compression and of two parameters for bending. Their experiments have been conducted to determine all the Weibull’s law parameters. Zauner and Niemz [1] also determined the influences of the samples size on the compression strength and deformation of Norway spruce (Picea abies (L.) Karst.) wood. Their results showed the existence of a possible size effect during compression, while digital image correlation illustrated the expected differences in deformation due to the shape and dependence of the strain distribution on the structure of wood. Zhou et al. [19] investigated the effect of size on the bending, tensile and compression strength of Chinese larch (Larix gmelinii K.) lumber by using nonparametric estimates method. The results showed that the size effect on bending strength, tensile strength parallel to the grain and compression strength parallel to the grain were significant.
Other researchers studied the size effect on wood strength at the micro-scale. Yu et al. [20] measured the longitudinal MOE of Chinese fir on sections ranging in thickness from 70 to 200 µm and compared the MOE data with the values of normal size (10 × 10 × 10 mm) samples. Their results indicated that the MOE of wood sections increased with thickness from 70 to 200 µm, which was significantly smaller than that of the normal size samples. A size effect coefficient of 2.63 was inferred based on statistical data for normal size samples and 200 µm thick sections. Karakoc and Freund [21] presented a simulation model comprising an input generation method, micromechanical model, and a method minimizing the boundary artifacts through micropolar elasticity. They conducted simulation experiments to understand the size effect and measurement domain selection on the in-plane elasticity of wood-like cellular materials. Their results showed that it was possible to gather reliable information and compute the compliance matrix in terms of the relationship between the strain of the cell collection and the external stress. Buyuksari et al. [22] investigated the tensile and compression strength of Scots pine (Pinus sylvestris Lipsky) wood using micro-sized and standard-sized test specimens. Their results showed that the compression strength of the micro- sized specimens (3 × 3 × 5 mm) was lower as compared to the standard-sized specimens (20 × 20 × 30 mm), while the tensile strength was higher in the micro- sized specimens.
Although the influence of the size effect on some wood strength had been studied, the size effect on the elastic constants and proportional limit stress of wood and these parameters used in numerical analysis of wood constructions have never been reported. Therefore, the aim of this study was to investigate the size effect on the elastic constants and proportional limit stress of European beech (Fagus sylvatica) by compression tests with five different sizes of small clear specimens (10 × 10 × 10 mm, 10 × 10 × 20 mm, 10 × 10 × 30 mm, 20 × 20 × 30 mm, and 30 × 30 × 30 mm). The specific objectives were to 1) evaluate the proportional limit stress measured by five different dimensional samples; 2) evaluate the elastic constants determined by five different sizes of samples; 3) predict the loading capacity of a self-designed chair based on finite element method (FEM) inputted the parameters (i.e., proportional limit and elastic constants) measured by the five types of samples; and 4) validate the FEM experimentally by testing loading capacity with nine self-designed chairs. With the best result from the experiments, it was expected to improve the accuracy of applying FEM in structure design of wood products and wooden constructions.

2. Materials and Methods

2.1. Materials and Equipment

European beech (Fagus sylvatica) lumber imported from Switzerland with dimensions of 3000 × 200 × 50 mm (length × width × thickness) was purchased from a local commercial wood supplier (Nanjing, China). A universal testing machine (AGS-X, SHIMADZU, Nakagyo-ku, Japan) and data logger (TDS530, TML, Tokyo, Japan) were used to measure the elastic constants and proportional limit stress of European beech wood samples.

2.2. Specimens Preparation

The specimens used to determine the elastic constants were six types of defect-free European beech blocks with different grain orientations cut from the same lumber shown in Figure 1. The samples posted with strain gauges were shown in Figure 2. Five different dimensions of specimens are shown in Table 1, which were used to investigate the size effect on the elastic constants and proportional limit stress of beech. The specimens 1-3 were used to study the effect of height on elastic constants, while the specimens 3-5 were used to investigate the effect of cross-sectional area on elastic constants. Proportional limit stresses in three-grain orientations were measured before determining the elastic constants. In addition, nine pieces of mortise-and-tenon joint self-designed chair joined by poly (vinyl acetate) (PVAc) resin, shown in Figure 3, were tested to verify the effects of elastic constants determined with different dimensions of specimens on the accuracy of FEM analysis. The dimensions of legs, side rails and side stretchers of chair were 30 × 20 × 300 mm, 20 × 15 × 124 mm (width × thickness × length), and 30 × 30 × 124 mm (width × thickness × length) respectively All samples were conditioned in a humidity chamber controlled at 20 ± 2 °C and 50 ± 5% relative humidity (RH) for two weeks.

2.3. Testing Methods

2.3.1. Physical Properties of European Beech Wood

The density and moisture content were measured according to the ASTM D4442-92 [23] and ASTM D2395-93 [24] respectively. In addition, the width of annual ring was determined by vernier caliper with small defect-free samples.

2.3.2. Proportional Limit Stress and Elastic Constants

All elastic constants tests were performed on a universal testing machine equipped with the data logger in accordance with the procedures outlined in the literature [5]. The testing setup is shown in Figure 4 with the loading rate of 1 mm/min. Besides, the proportional limit stresses of five types of specimens in longitudinal (L), radial (R), and tangential (T) directions were determined before measuring the elastic constants, which were used to select the load range, i.e., initial load (P0) and end load (Pn) were 50% and 80% P respectively, to keep it in the linear range of beech. In order to determine the proportional limit stress, 150 measurements were tested at three-grain orientations and five dimensions samples with 10 replications. For testing elastic constants, 150 samples were tested for five different dimensions of specimens. In total, 300 specimens were prepared. The equations used to calculate the proportional limit stress and elastic constants are described in Equation 1 (proportional limit stress), Equation 2 (elastic moduli), Equation 3 (Poisson’s ratio), and Equation 4 (shear moduli) respectively. Figure 5 shows the method to obtain proportional limit load (P), and the value of P can be read by software (Origin 9.1, Origin Lab, Starkville, MS, USA).
σ P L S = P / A 0 ,
E i = Δ σ i / Δ ε i = P n P 0 [ A 0 ( ε n ε 0 ) ] ,   ( i   =   L ,   R ,   T ) ,
u i j = Δ ε j / Δ ε i ,   ( i ,   j =   L ,   R ,   T ) ,
G i j = Δ P 45 ° / [ 2 A 0 ( Δ ε x 45 ° + Δ ε y 45 ° ) ] ,   ( i ,   j =   L ,   R ,   T ) ,
where σ P L S refers to proportional limit stress (MPa), P infers to proportional limit load (N), A 0 indicates cross-sectional area of specimen (mm2), Ei is elastic modulus in direction i (MPa), Δ σ i refers to the difference between of end stress and initial stress (MPa), Δ ε i infers to the difference between strains of end load and initial load in loading direction, Δ ε j represents the difference between strains of end load and initial load in direction perpendicular to loading direction, P 0 infers initial load (N), which was set as 50% P, P n is end load (N) set as 80% P, ε n is end strain, ε 0 refers to initial strain, u i j refers to Poisson’s ratio, G i j represents shear modulus (MPa), Δ P 45 ° is the difference between end load and initial load (N), Δ ε x 45 ° infers to the difference between end strain and initial strain in transverse direction, Δ ε y 45 ° refers to the difference between end strain and initial strain in vertical direction.

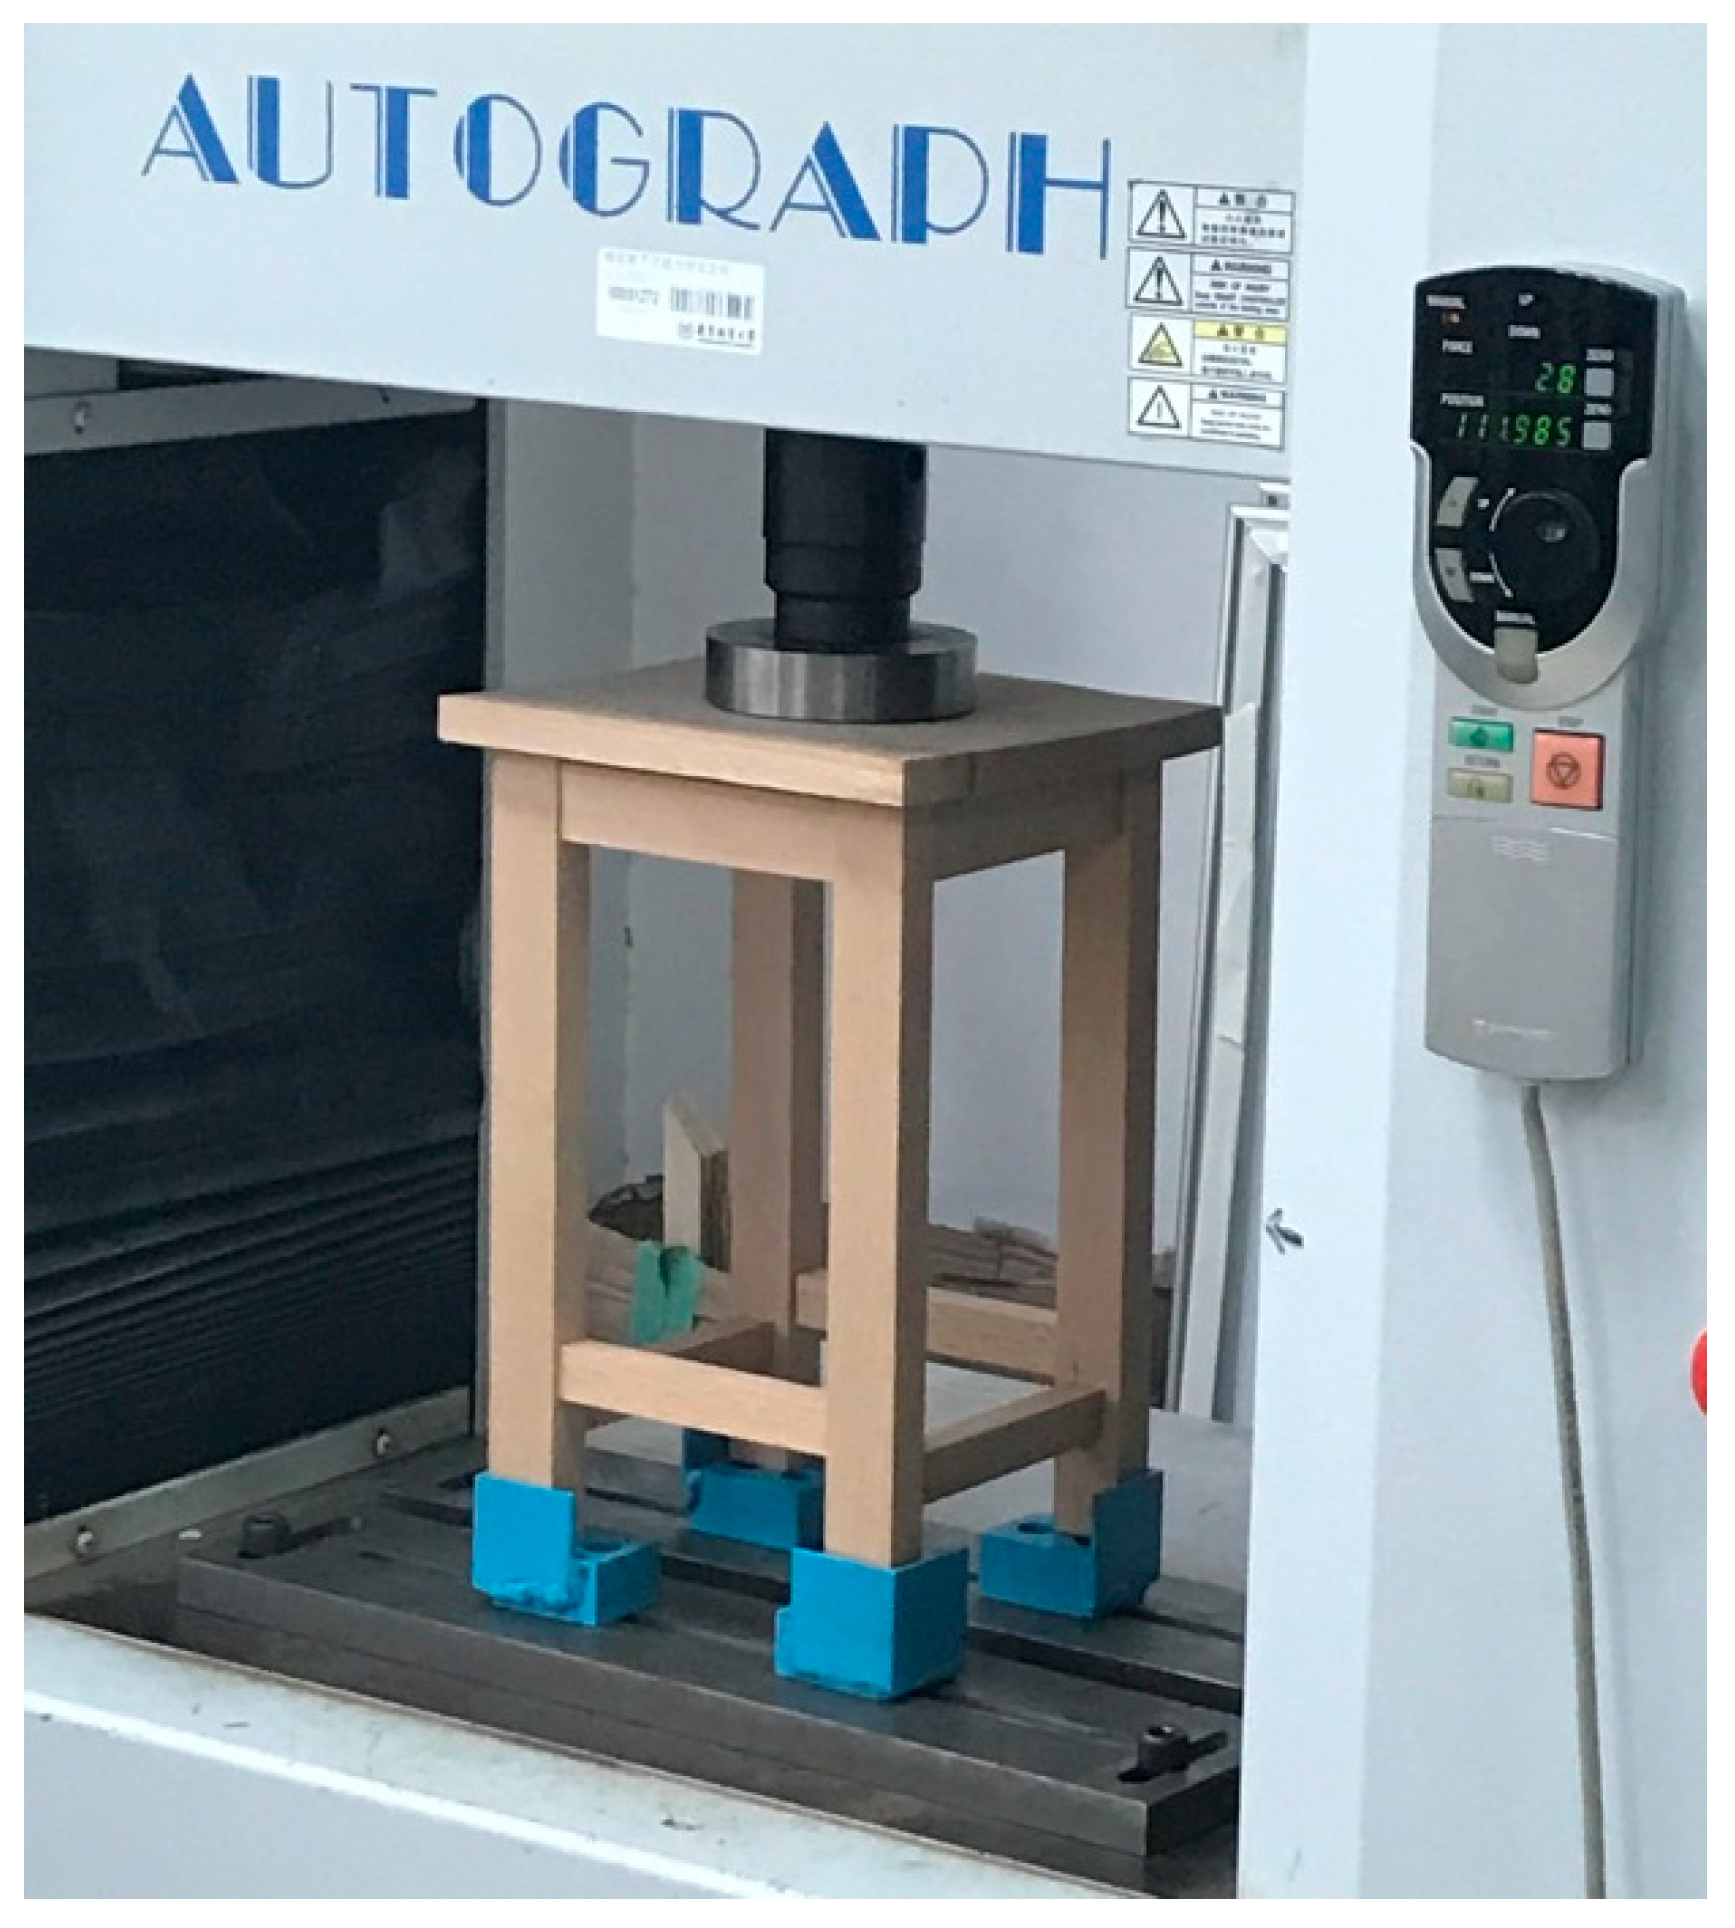
2.3.3. Load Capacity of Chair

In order to verify the simulated results of FEM, experiments were carried out to measure the load capacity of a chair. The testing setup is shown in Figure 6. The legs of a chair in test were constrained by fixtures (i.e., blue parts in Figure 6), while the load was imposed on the center of the chair seat with a loading rate 1 mm/min until the displacement reaching 3 mm. This is because the pre-tests showed that a chair were broken when loading displacement was greater than 3 mm. Nine pieces of chair produced in the same way were tested to determine the loading capacities.
All experimental results were analyzed by the analysis of variance (ANOVA) using IBM SPSS 22, and all mean comparisons were performed at the 1% significance level using the protected least significant difference (LSD) multiple comparisons procedure.

2.4. Modeling

The method of establishing the FEM model of a chair followed the one by Hu and Guan [25,26] and Hu et al. [27]. The required inputs for elastic properties of European beech wood were three moduli of elasticity, three moduli of rigidity, and three Poisson’s ratios as orthotropic material, and for glue line in joint, they were one modulus of elasticity and one Poisson’s ratio as isotropic material. Material strength properties required for inputs were compressive proportional limit stress in longitudinal, tangential, and radial directions, respectively, and the shear strength of glue bonding. Elastic properties of beech wood were measured in this experiment, whereas elastic properties of PVAc glue line were obtained from the literature [28], such as the elastic modulus was 460 MPa and Poisson’s ratio was 0.3. The elastic constants determined by five types of specimens were specified to a quarter-chair finite element model created by ABAQUS6.14-1, respectively, shown in Figure 7. The dimensions and boundary constraints of the chair model are shown in Figure 3 and Figure 6, respectively, and symmetry boundary conditions were used. The 8-node linear brick (C3D8) element was used for the chair, and 8-node three-dimensional cohesive element (COH3D) was employed for the glue. In total 17,863 elements were used in the chair model. The elastic moduli determined by five types of samples were put into the finite element model successively. After analyzing, the results were used to compare with those of the chair tests.

3. Results and Discussion

3.1. Physical Properties of European Beech Wood

The average density of European beech lumber was 0.629 g/cm3, and the moisture content was conditioned to and held at 10.8% before and during experiments. The width of the annual ring was 1.3 mm, and the ratio of latewood to earlywood was 1/3.

3.2. Size Effect on Proportional Limit Stresses of European Beech

The results of proportional limit stresses of five types of specimens are shown in Figure 8. The comparisons results between specimens 1–3 suggest that the proportional limit stresses decrease with the increasing of the height of specimens with the same cross-sectional area. Comparing the results of specimens 3–5 indicate that the relationship between proportional limit stress and cross-sectional area was nonlinear within a constant height of the specimens.
Thus, the relationships between proportional limit stress, cross-sectional area, and height of the specimen in three wood grain orientations (L, R, and T) were modeled using the nonlinear regression method. The response surfaces were shown in Figure 9 and the corresponding regression equations are Equation (5), Equation (6), and Equation (7) with R2 0.7217, 0.8086 and 0.7262 respectively. Since Chin [29] recommended R2 values for endogenous latent variables based on: 0.67 (substantial), 0.33 (moderate), and 0.19 (weak), thus, these equations can be used to predict the proportional limit stresses with the varieties of cross-sectional area and height of the specimens.
σ L = 3.97 + 1.79 e x p ( 3 ) A 0.052 H 1.584 e x p ( 6 ) A 2 + 9.7 e x p ( 4 ) H 2 ,   R 2 = 0.7217
σ R = 12.12 + 0.013 A 0.33 H 1.174 e x p ( 5 ) A 2 + 3.37 e x p ( 3 ) H 2 ,   R 2 = 0.8086
σ T = 9.36 + 8.31 e x p ( 3 ) A 0.46 H 8.90 e x p ( 6 ) A 2 + 9.35 e x p ( 3 ) H 2 , R 2 = 0.8086
where σ L , σ R , and σ T refers to proportional limit stresses in L, R and T directions (MPa), A is cross-sectional area of specimen in (mm2), H is the height of specimen in (mm).
Previous studies reported that the grain orientations influence the mechanical properties of beech lumber [5,30]. To the knowledge of the authors, only a few selected works existed for the weakest link theory (WLT) for wood under compression [18,31], showing either no size effect [18] or a small effect [31] on the mechanical properties of wood. The influences of cross-sectional area and height of specimen on the proportional limit stresses were determined with an analysis of variance (ANOVA) and Fisher’s F-test by IBM SPSS statistics 22. Table 2 shows the results of ANOVA that the cross-sectional area and height are all considered statistically significant with P-value less than 0.01, while the two-factorial analysis suggests that there were no interactions between height with cross-sectional area.

3.3. Size Effect on Elastic Constants of Beech

Table 3 shows the results of elastic constants of five types of specimens, which are reasonably similar to those of previous studies [2,30,32]. It indicates that elastic moduli (EL, ER, and ET) and shear moduli (GL, GR, and GT) increased with the height based on the comparisons of specimen 1–3 with the same cross-sectional area. Comparing the results of specimens 3-5, the elastic moduli (EL, ET, and ER) and shear moduli (GL, GR, and GT) decreased with the increase of the cross-sectional area at the same height. Xavier et al. [33] evaluated the longitudinal modulus of elasticity (EL) of maritime pine (Pinus pinaster Ait) by compression tests parallel to grain with 3D digital imagine correlation method (3D DIC). The samples with cross-sectional area (20 × 20, 30 × 30, and 40 × 40 mm) and height (30, 60, and 120 mm) were chosen, but the results showed opposite trends with this study. In accordance with the equation (3) and compression strengths of wood in L, R and T grain orientations, the Poisson’s ratio should decrease with the increase of height within the same cross-sectional area, and increase with an increase of cross-sectional area with the same height. However, due to the error of tests, four observed values of Poisson’s ratios were not in consistence with this trend, thus, further studies are needed to find out the reasons.
Two-factor (height and cross-sectional area) ANOVA was conducted to assess the size effect on the elastic constants of beech. It suggests that the effect of cross-sectional area, height and interaction of them on elastic constants were considered statistically significant. Table 4 only shows the ANOVA of interaction of cross-sectional area and height. This confirms that further research to find optimized beech specimen dimension to get mechanical properties data for FEM model is necessary.

3.4. Load Capacity of Chair and Failure Mode

Figure 10 shows the typical load-displacement curve and failure mode of a chair under compression, which indicates that the maximum load value can be obtained at displacement about 3 mm. Therefore, in this study, the load at 3 mm displacement were extracted and compared with those of FEM. The loading capacity of a chair at displacement of 3 mm was 13,055.06 N with a COV of 5.50. The typical failure of a chair at maximum load occurred at the joint of the rail and leg.

3.5. Comparison and Analysis

Figure 11 shows the stress distributions of a chair from the initial loading state to the end loading state where the loading displacement reached 3mm. The elastic constants determined by five types of specimens were put into the chair model and analyzed by FEM respectively. The reaction forces of the loading head were outputted by ABAQUS6.14-1 and compared with those of experiments.
Figure 12 shows the loading capacities of self-designed chairs based on FEM and experiments. The stress increased with the load and concentrated at the joint of the stretcher and leg, which was consistent with the failure mode shown in Figure 10.
Based on Figure 12, the loading capacities of self-designed chairs based on FEM used the elastic constants determined by specimens 1–3 with the same cross-sectional area were compared with experimental results. This indicates that the results of the FEM inputted by the elastic constants determined by specimen 1 were more accurate than those determined by the other two specimens. Secondly, the same way was used to compare the results of FEM inputted parameters determined by specimens 3–5 with the same height, the results of FEM inputted the parameters measured by specimen 3 was more precise than the other two specimens. Thirdly, the results of FEM inputted the parameters measured by specimen 1 and specimen 5 with the same width-height ratio (i.e., equal to 1) were compared, the accuracy of the former was better than that of the later. In other words, the specimen 1 was more appropriate to be used to measure the elastic constants of beech wood compared with other specimens.
In summary, the data show that the smaller the specimen used to measure the elastic constants of wood with width (length)-height ratio equal to 1, the more accurate of the result the finite element model predicted. This might be similar to the finite element theory that the finer the element is, the more accurate the result of finite element model predicts [34]. It can also be explained by following three reasons that 1) the smaller the specimen, the more accurate the grain orientation, and less error; 2) The smaller the specimen, the less defects it contains, and the more precisely the mechanics it reflects [12], which is based on the idea that in a larger volume, the probability to encounter an element with lower strength is higher than in smaller volumes. In the end, this weakest element leads to the collapse of the structure [35]; and 3) it is assumed that the volumes might have a different expressed curvature of the annual rings, so that the very small specimen can be regarded as quasi orthotropic whereas the largest specimen size has to be considered as cylindrically anisotropic. Nevertheless, if one thinks about different wood species having different microstructures, based on what has been explained, finding optimized wood element dimensions of different wood species to obtain mechanical property data for FEM model for engineering applications is very necessary.

4. Conclusions

In conclusion, the results of the experiments and ANOVA output all suggested that the size effect on elastic mechanics of European beech wood be statistically significant. The proportional limit stress decreased with the growth of the height of specimens at a constant cross-sectional area. Nonlinear relationship between proportional stress, cross-sectional area, and height of specimens was regressed. The elastic moduli (EL, ER, and ET) and shear moduli (GL, GR, and GT) increased with the raise of height with the same cross-sectional area, but decreased with the increasing of cross-sectional area with the same height. However, four observed values of Poisson’s ratio were not consistent with this trend. Thus, further studies are needed to be conducted. A comparison of loading capacity of chairs between experiment and FEM suggested that small cubic defect-free wood specimens are to be used to determine the elastic constants, and the results of finite element model are more accurate. Finding optimized wood element dimensions of different wood species to obtain mechanical property data for finite element model for engineering applications is necessary.

Author Contributions

Conceptualization, H.G., H.W. and W.H.; methodology, W.H.; software, W.H.; validation, W.H., H.G. and H.W.; formal analysis, W.H.; investigation, W.H.; resources, H.G.; data curation, H.G.; writing—original draft preparation, W.H.; writing—review and editing, W.H., H.W. and H.G.; supervision, H.G.; funding acquisition, H.G.

Funding

This work was supported by Scientific Research Foundation of Nanjing Forestry University (GXL2019074), A Project Funded by the National First-class Disciplines (PNFD), and A Priority Academic Program Development of Jiangsu Higher Education Institutions (PAPD).

Acknowledgments

The authors would like to express my heartfelt gratitude to Edward D. Entsminger from Department of Sustainable Bioproducts of Mississippi State University for his help in revising the grammar of the manuscript. We also would like to thank the anonymous reviewers and editor for their valuable comments and suggestions for improving the quality of this paper.

Conflicts of Interest

The authors declare no conflict of interest.

References

  1. Zauner, M.; Niemz, P. Uniaxial compression of rotationally symmetric Norway spruce samples: Surface deformation and size effect. Wood Sci. Technol. 2014, 48, 1019–1032. [Google Scholar] [CrossRef]
  2. Zhang, F.; Li, L.; Zhang, L.; Xu, Z. Study of the determination of the elastic constants and mechanical property parameters of five kinds of wood commonly used in furniture. For. Mach. Woodwork. Equip. 2012, 40, 16–19. [Google Scholar]
  3. Wang, L.Y.; Lu, Z.Y.; Shen, S.J. Study on twelve elastic constant values of Betula platyphylla Suk. wood. J. Beijing For. Univ. 2003, 25, 64–67, (In Chinese with English Summary). [Google Scholar]
  4. CNS GB/T 1935. Method of Testing in Compressive Strength Parallel to Grain of Wood; Chinese National Standard: Beijing, China, 2009. (In Chinese) [Google Scholar]
  5. Hu, W.G.; Guan, H.Y. Study on elastic constants of beech in different stress states. J. For. Eng. 2017, 2, 31–36, (In Chinese with English Summary). [Google Scholar]
  6. Aira, J.R.; Arriaga, F.; González, G.L. Determination of the elastic constants of scots pine (Pinus sylvestris L.) wood by means of compression tests. Biosyst. Eng. 2014, 126, 12–22. [Google Scholar] [CrossRef]
  7. Aydin, Y.; Aydin, M. Comparison of temperature dependent Young’s modulus of oriental beech (Fagus orientalis L.) that determined by ultrasonic wave propagation and compression test. Turk. J. For. 2018, 19, 185–191. [Google Scholar] [CrossRef]
  8. Shao, Z.P.; Zhou, S. Study on determining the elastic constants of wood of Cunninghamia lanceolata by means of electric resistance-strain gauges. J. Anhui Agri. Univ. 2001, 28, 32–35, (In Chinese with English Summary). [Google Scholar]
  9. Murata, K.; Tanahashi, H. Measurement of Young’s modulus and Poisson’s ratio of wood specimens in compression test. J. Soc. Mater. Sci. Jpn. 2010, 59, 285–290. [Google Scholar] [CrossRef]
  10. Liu, F.L.; Jiang, F.; Zhang, J.Z.; Zhang, H.J.; Wang, X.P.; Yang, Z.H. Twelve elastic constants values of larch forest. J. North. For. Univ. 2015, 30, 227–231, (In Chinese with English Summary). [Google Scholar]
  11. ASTM D143-94. Standard Test Methods for Small Clear Specimens of Timber; ASTM International: West Conshohocken, PA, USA, 2010. [Google Scholar]
  12. Straže, A.; Gorišek, Z. Analysis of size effect on determination of mechanical properties of Norway spruce wood. In Proceedings of the 22nd International Scientific Conference on Wood is Good-EU Preaccession Challenges of the Sector, Zagreb, Croatia, 21 October 2011; pp. 183–190. [Google Scholar]
  13. Madsen, B.; Tomoi, M. Size effects occurring in defect-free spruce-pine-fir bending specimens. Can. J. Civil Eng. 2011, 18, 637–643. [Google Scholar] [CrossRef]
  14. Zhou, H.B.; Ren, H.Q.; Lu, J.X. Size effect of length on flexural strength of Chinese fir dimension lumber used in wood structure. J. Build. Mater. 2009, 12, 501–504, (In Chinese with English Summary). [Google Scholar]
  15. Madsen, B.; Buchanan, A.H. Size effect in timber explained by a modified weakest link theory. Can. J. Civil Eng. 1986, 13, 218–2232. [Google Scholar] [CrossRef]
  16. Madsen, B.; Nielsen, P.C. In-Grade Testing: Size Investigation on Lumber Subjected to Bending; Structural Research Series, Report No. 15; Department of Civil Engineering; University of British Columbia: Vancouver, BC, Canada, 1976; p. 10. [Google Scholar]
  17. ASTM D1990-07. Standard Practice for Establishing Allowable Properties for Visually-Grade Dimension Lumber from in Grade Tests of Full-Size Specimens; ASTM International: West Conshohocken, PA, USA, 2016. [Google Scholar]
  18. Fotsing, J.A.; Foudjet, A. Size effect of two Cameroonian hardwoods in compression and bending parallel to the Grain. Holzforsch.-Int. J. Biol. Chem. Phys. Technol. Wood 1995, 49, 376–378. [Google Scholar] [CrossRef]
  19. Zhou, H.B.; Han, L.Y.; Ren, H.Q.; Lu, J.X. Size effect on strength properties of Chinese larch dimension lumber. BioResources 2015, 10, 3790–3797. [Google Scholar] [CrossRef]
  20. Yu, Y.; Jiang, Z.H.; Tian, G.L. Size effect on longitudinal MOE of microtomed wood sections and relevant theoretical explanation. For. Stud. China 2009, 11, 243–248. [Google Scholar] [CrossRef]
  21. Karakoc, A.; Freund, J. Effect of size and measurement domain on the in-plane elasticity of wood-like cellular materials. J. Mater. Sci. 2016, 51, 1490–1495. [Google Scholar] [CrossRef]
  22. Buyuksari, U.; As, N.; Dundar, T.; Sayan, E. Micro-tensile and compression strength of scots pine wood and comparison with standard-size test results. Drvna. Ind. 2017, 68, 129–136. [Google Scholar] [CrossRef]
  23. ASTM D4442-92. Standard Test Methods for Direct Moisture Content Measurements of Wood and Wood-Based Materials; ASTM International: West Conshohocken, PA, USA, 2010. [Google Scholar]
  24. ASTM D 2395-93. Standard Test Methods for Specific Gravity of Wood and Wood-Based Materials; ASTM International: West Conshohocken, PA, USA, 2010. [Google Scholar]
  25. Hu, W.G.; Guan, H.Y. Experimental and numerical study on optimization design of stretcher positions. Wood Res. 2017, 62, 575–586. [Google Scholar]
  26. Hu, W.G.; Guan, H.Y. Investigation on withdrawal force of mortise and tenon joint based on friction properties. J. For. Eng. 2017, 02, 158–162, (In Chinese with English Summary). [Google Scholar]
  27. Hu, W.G.; Guan, H.Y.; Zhang, J.L. Finite element analysis of tensile load resistance of mortise-and-tenon joints considering tenon fit effects. Wood Fiber Sci. 2018, 50, 121–131. [Google Scholar] [CrossRef]
  28. Kasal, A.; Smardzewski, J.; Kuskun, T.; Erdil, Y.Z. Numerical analysis of various sizes of mortise and tenon furniture joints. BioResources 2016, 11, 6836–6853. [Google Scholar] [CrossRef]
  29. Chin, W.W. Commentary: Issues and opinion on structural equation modeling. MIS Quart. 1988, 22, 7–16. [Google Scholar]
  30. Hearmon, R.F.S.; Barkas, W.W. The effect of grain direction on the Young’s moduli and rigidity moduli of beech and sitka spruce. Proc. Phys. Soc. 1941, 53, 674–680. [Google Scholar] [CrossRef]
  31. Madsen, B. Structural Behaviour of Timber; Timber Engineering LTD: Vancouver, BC, Canada, 1992. [Google Scholar]
  32. Hering, S.; Keunecke, D.; Niemz, P. Moisture-dependent orthotropic elasticity of beech wood. Wood Sci. Technol. 2011, 46, 927–938. [Google Scholar] [CrossRef] [Green Version]
  33. Xavier, J.; De Jesus, A.M.P.; Morais, J.J.L.; Pinto, J.M.T. Stereovision measurements on evaluating the modulus of elasticity of wood by compression tests parallel to the grain. Constr. Build. Mater. 2012, 26, 207–215. [Google Scholar] [CrossRef]
  34. Ghavidel, A.; Mousavi, S.R.; Rashki, M. The effect of FEM mesh density on the failure probability analysis of structures. KSCE. J. Civil Eng. 2017, 00, 1–13. [Google Scholar] [CrossRef]
  35. Weibull, W. A statistical distribution function of wide applicability. J. Appl. Mech-T. ASME. 1951, 18, 293–297. [Google Scholar]
Figure 1. Cutting method of samples used to measure elastic constants, (a) to (f) correspond to those in Figure 2. (L, R, and T are longitudinal, radial, and tangential grain orientations of European been).
Forests 10 00783 g001
Figure 2. Configurations of specimens used to determine the elastic constants of beech (a): EL, μLR and μLT; (b): ER and μRT; (c): ET; (d): GLR; (e): GLT; (f): GRT.
Forests 10 00783 g002
Figure 3. Dimensions of chair used to determine the loading capacity. (unit: mm).
Forests 10 00783 g003
Figure 4. Setup for measuring elastic constants of beech.
Forests 10 00783 g004
Figure 5. Method used to obtain proportional limit load (P).
Forests 10 00783 g005
Figure 6. Setup for measuring loading capacity of chair.
Forests 10 00783 g006
Figure 7. A quarter finite element model of chair.
Forests 10 00783 g007
Figure 8. Proportional limit stresses of five types of specimens.
Forests 10 00783 g008
Figure 9. Relationships between proportional limits stress, cross-sectional area and height of specimens in longitudinal (a), radial (b) and tangential (c) grain orientations.
Forests 10 00783 g009
Figure 10. Typical load and displacement curve (a) and failure mode (b) of chair under compression.
Forests 10 00783 g010
Figure 11. Stress distributions of chair based on FEM (a) initial state, (b) state at 1 mm-displacement, (c) state at 2 mm-displacement, (d) state at 3 mm-displacement.
Forests 10 00783 g011
Figure 12. Comparisons of experiments and finite element methods (FEMs) (Errors are shown in parentheses).
Forests 10 00783 g012
Table 1. Configurations of specimens used to measure elastic mechanical properties of beech.
Specimen TypesDimensionsNumber
Cross-Sectional Area (mm2)Height (mm)Elastic ConstantsProportional Limit StressTotal
Width (mm)Length (mm)
1101010303060
2101020303060
3101030303060
4202030303060
5303030303060
Table 2. The ANOVA of proportional limit stresses of beech.
Monitor FactorSum of SquaresDegree of FreedomMean SquaresFisher’s F-TestSignificance
Intercept17,851.842117,851.8426394.165p < 0.01
Height (a)219.4442109.72239.300p < 0.01
Cross-sectional Area (b)181.119290.55932.437p < 0.01
a × b00
Error167.514602.792
Table 3. Averages and coefficient of variances (COVs) of elastic constants.
Specimen TypeEL (MPa)ER (MPa)ET (MPa)μLRμLTμRTGL (MPa)GR (MPa)GT (MPa)
11344910277640.6970.7200.444527399173
COV (%)4.85.84.51.09.40.86.42.710.3
21528411618630.6430.5490.644729462265
COV (%)0.32.70.73.01.33.51.05.513.1
317980153710410.3980.6250.515945499373
COV (%)2.46.82.01.90.52.81.514.44.5
41407514827070.7100.3380.465832444259
COV (%)1.12.84.77.714.12.83.07.81.3
51261713376420.4080.3680.588828398169
COV (%)1.93.16.80.910.10.310.43.818.6
Table 4. ANOVA of interaction of cross-sectional area with height.
Monitored FactorDependent VariableSum of SquaresDegree of FreedomMean SquaresFisher’s F-TestSignificance
Cross-sectional Area × HeightEL176,983,729.639444,245,932.410237.704p < 0.01
ER899,669.4794224,917.37039.344p < 0.01
ET195,869.174448,967.29430.436p < 0.01
νLR0.29340.07351.594p < 0.01
νLT0.31840.07924.222p < 0.01
νRT0.08240.02165.324p < 0.01
GLR293,182.023473,295.50619.698p < 0.01
GLT21,512.83945378.2106.430p < 0.01
GRT84,329.602421,082.40019.736p < 0.01

