Dynamics and Management of Rising Outbreak Spruce Budworm Populations


Abstract
1. Introduction
2. Materials and Methods
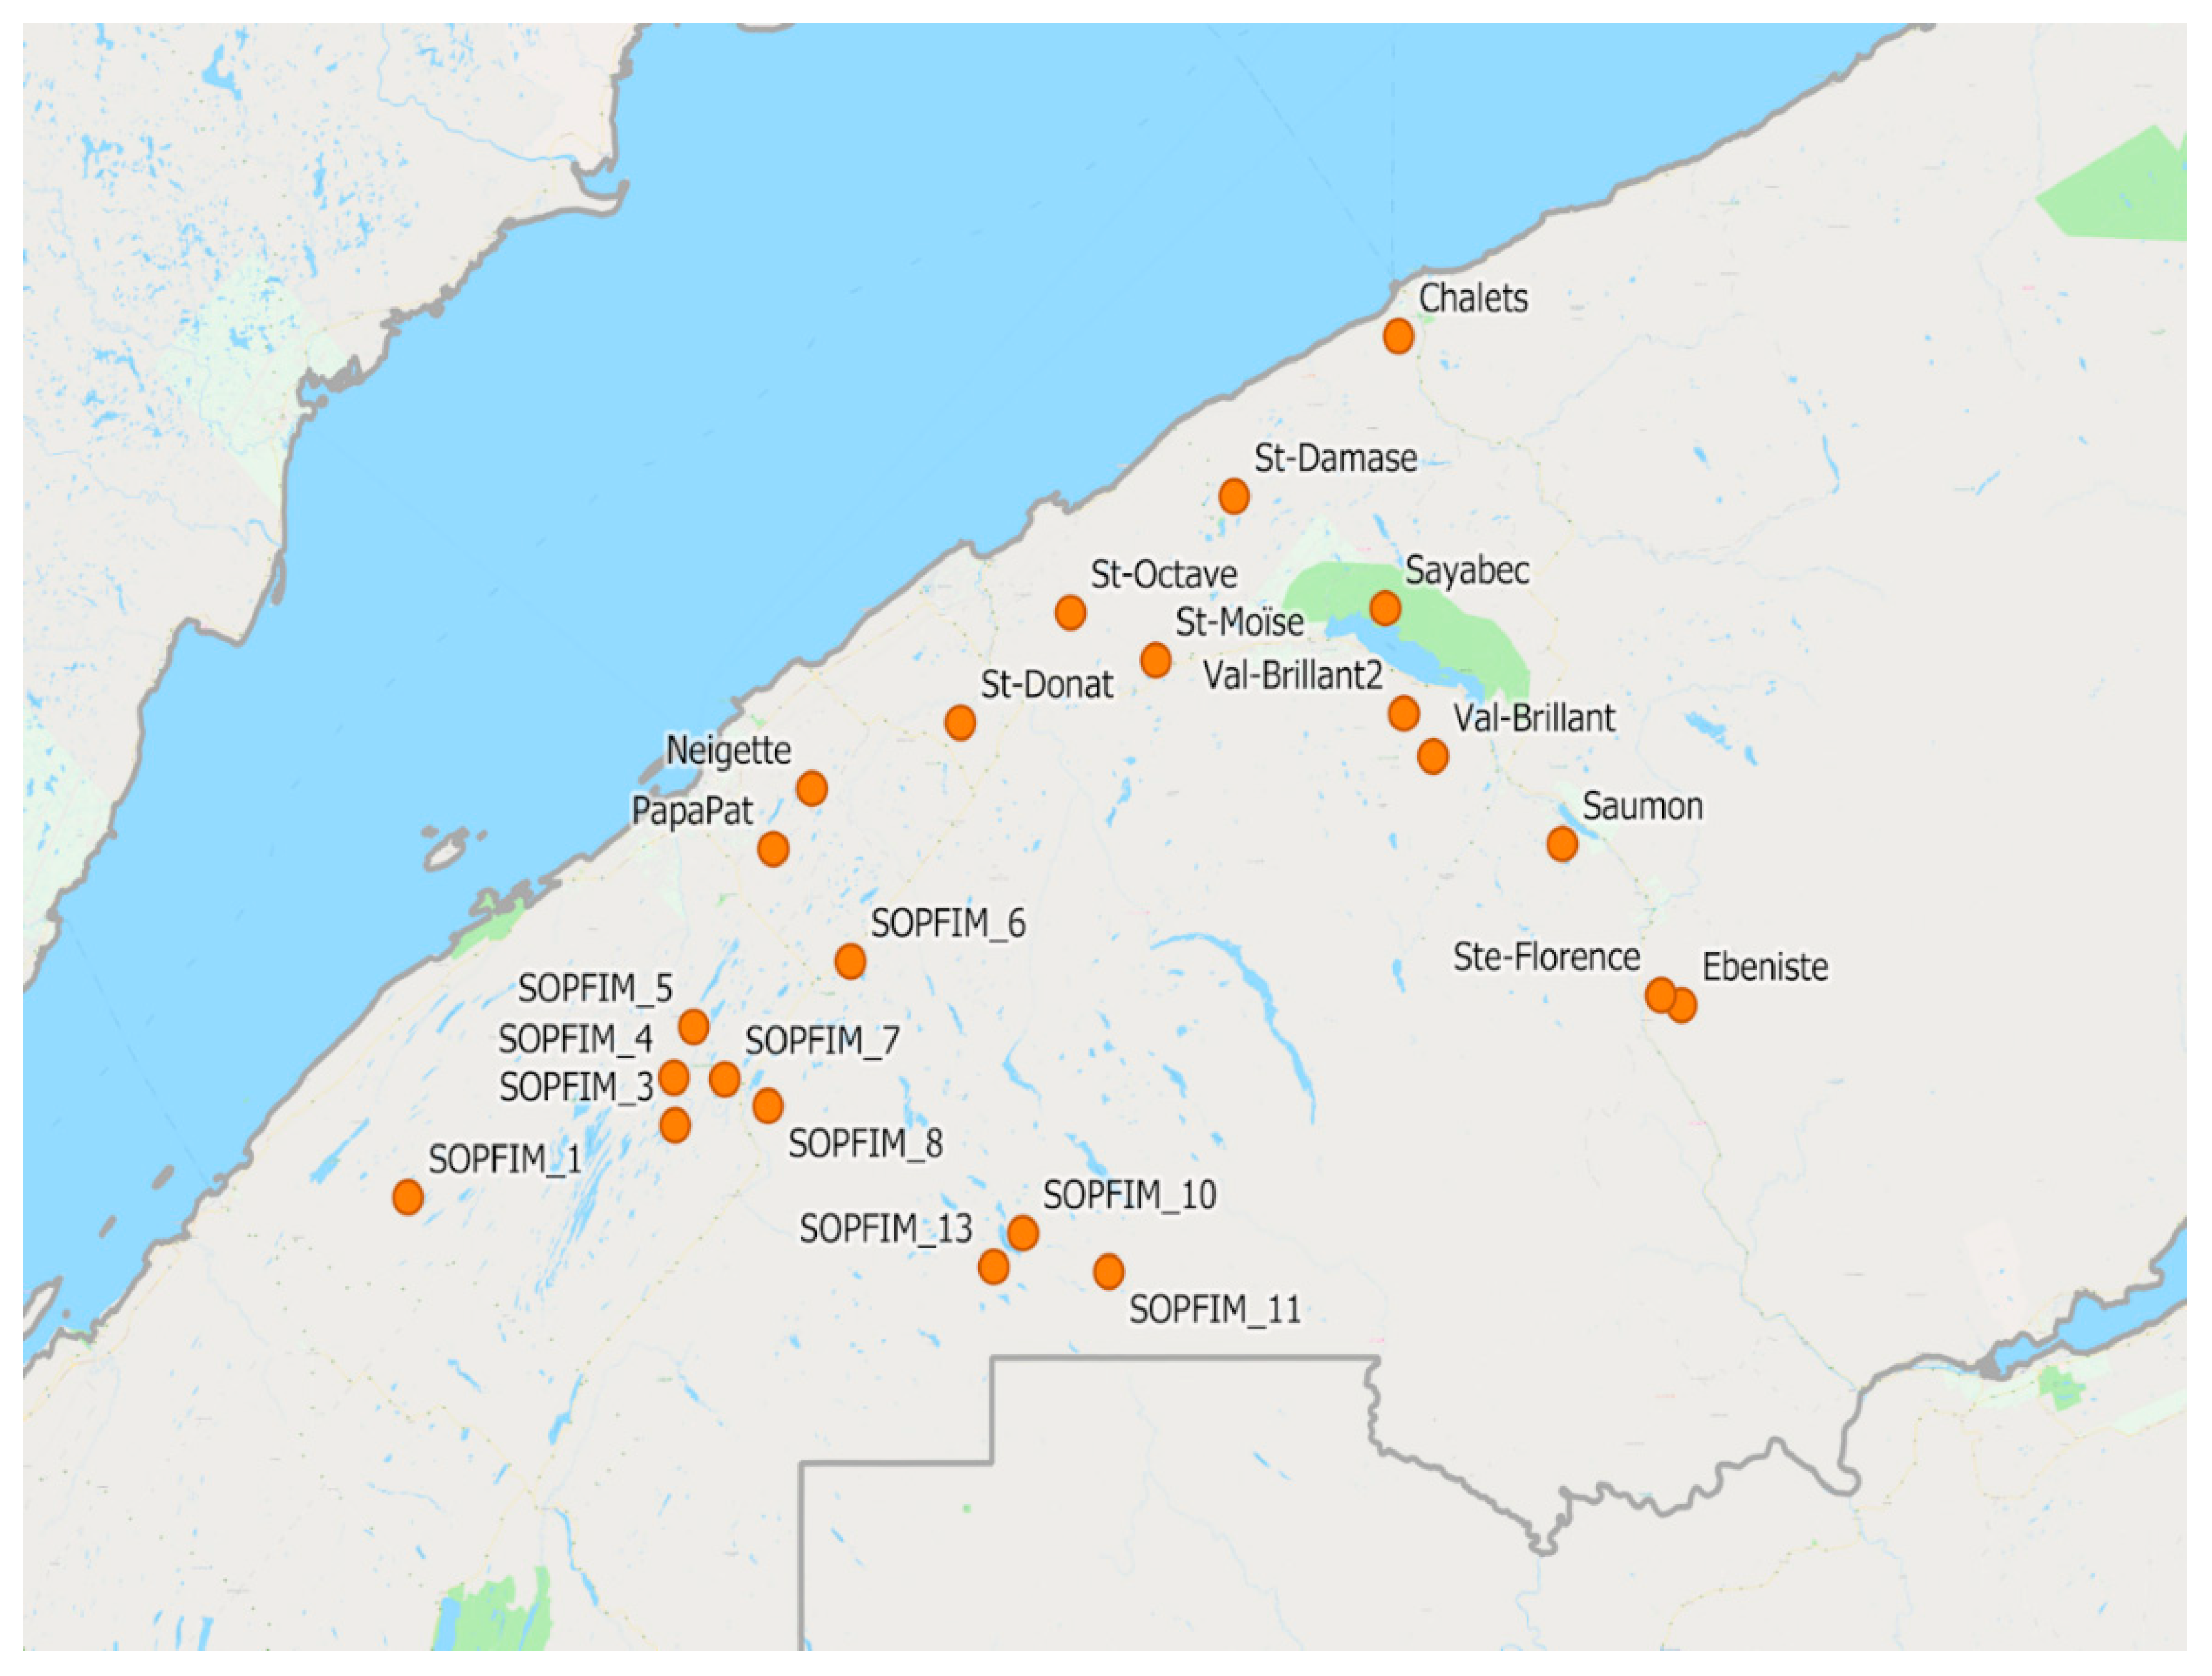
2.1. Plots
2.2. Treatments
2.3. Foliage Sampling
2.4. Survival in Rearing
2.5. Data Analysis
2.5.1. Field Survival
2.5.2. Defoliation
2.5.3. Survival in Rearing
2.5.4. Recruitment to the Egg Stage
2.5.5. Annual Population Growth Rate
3. Results
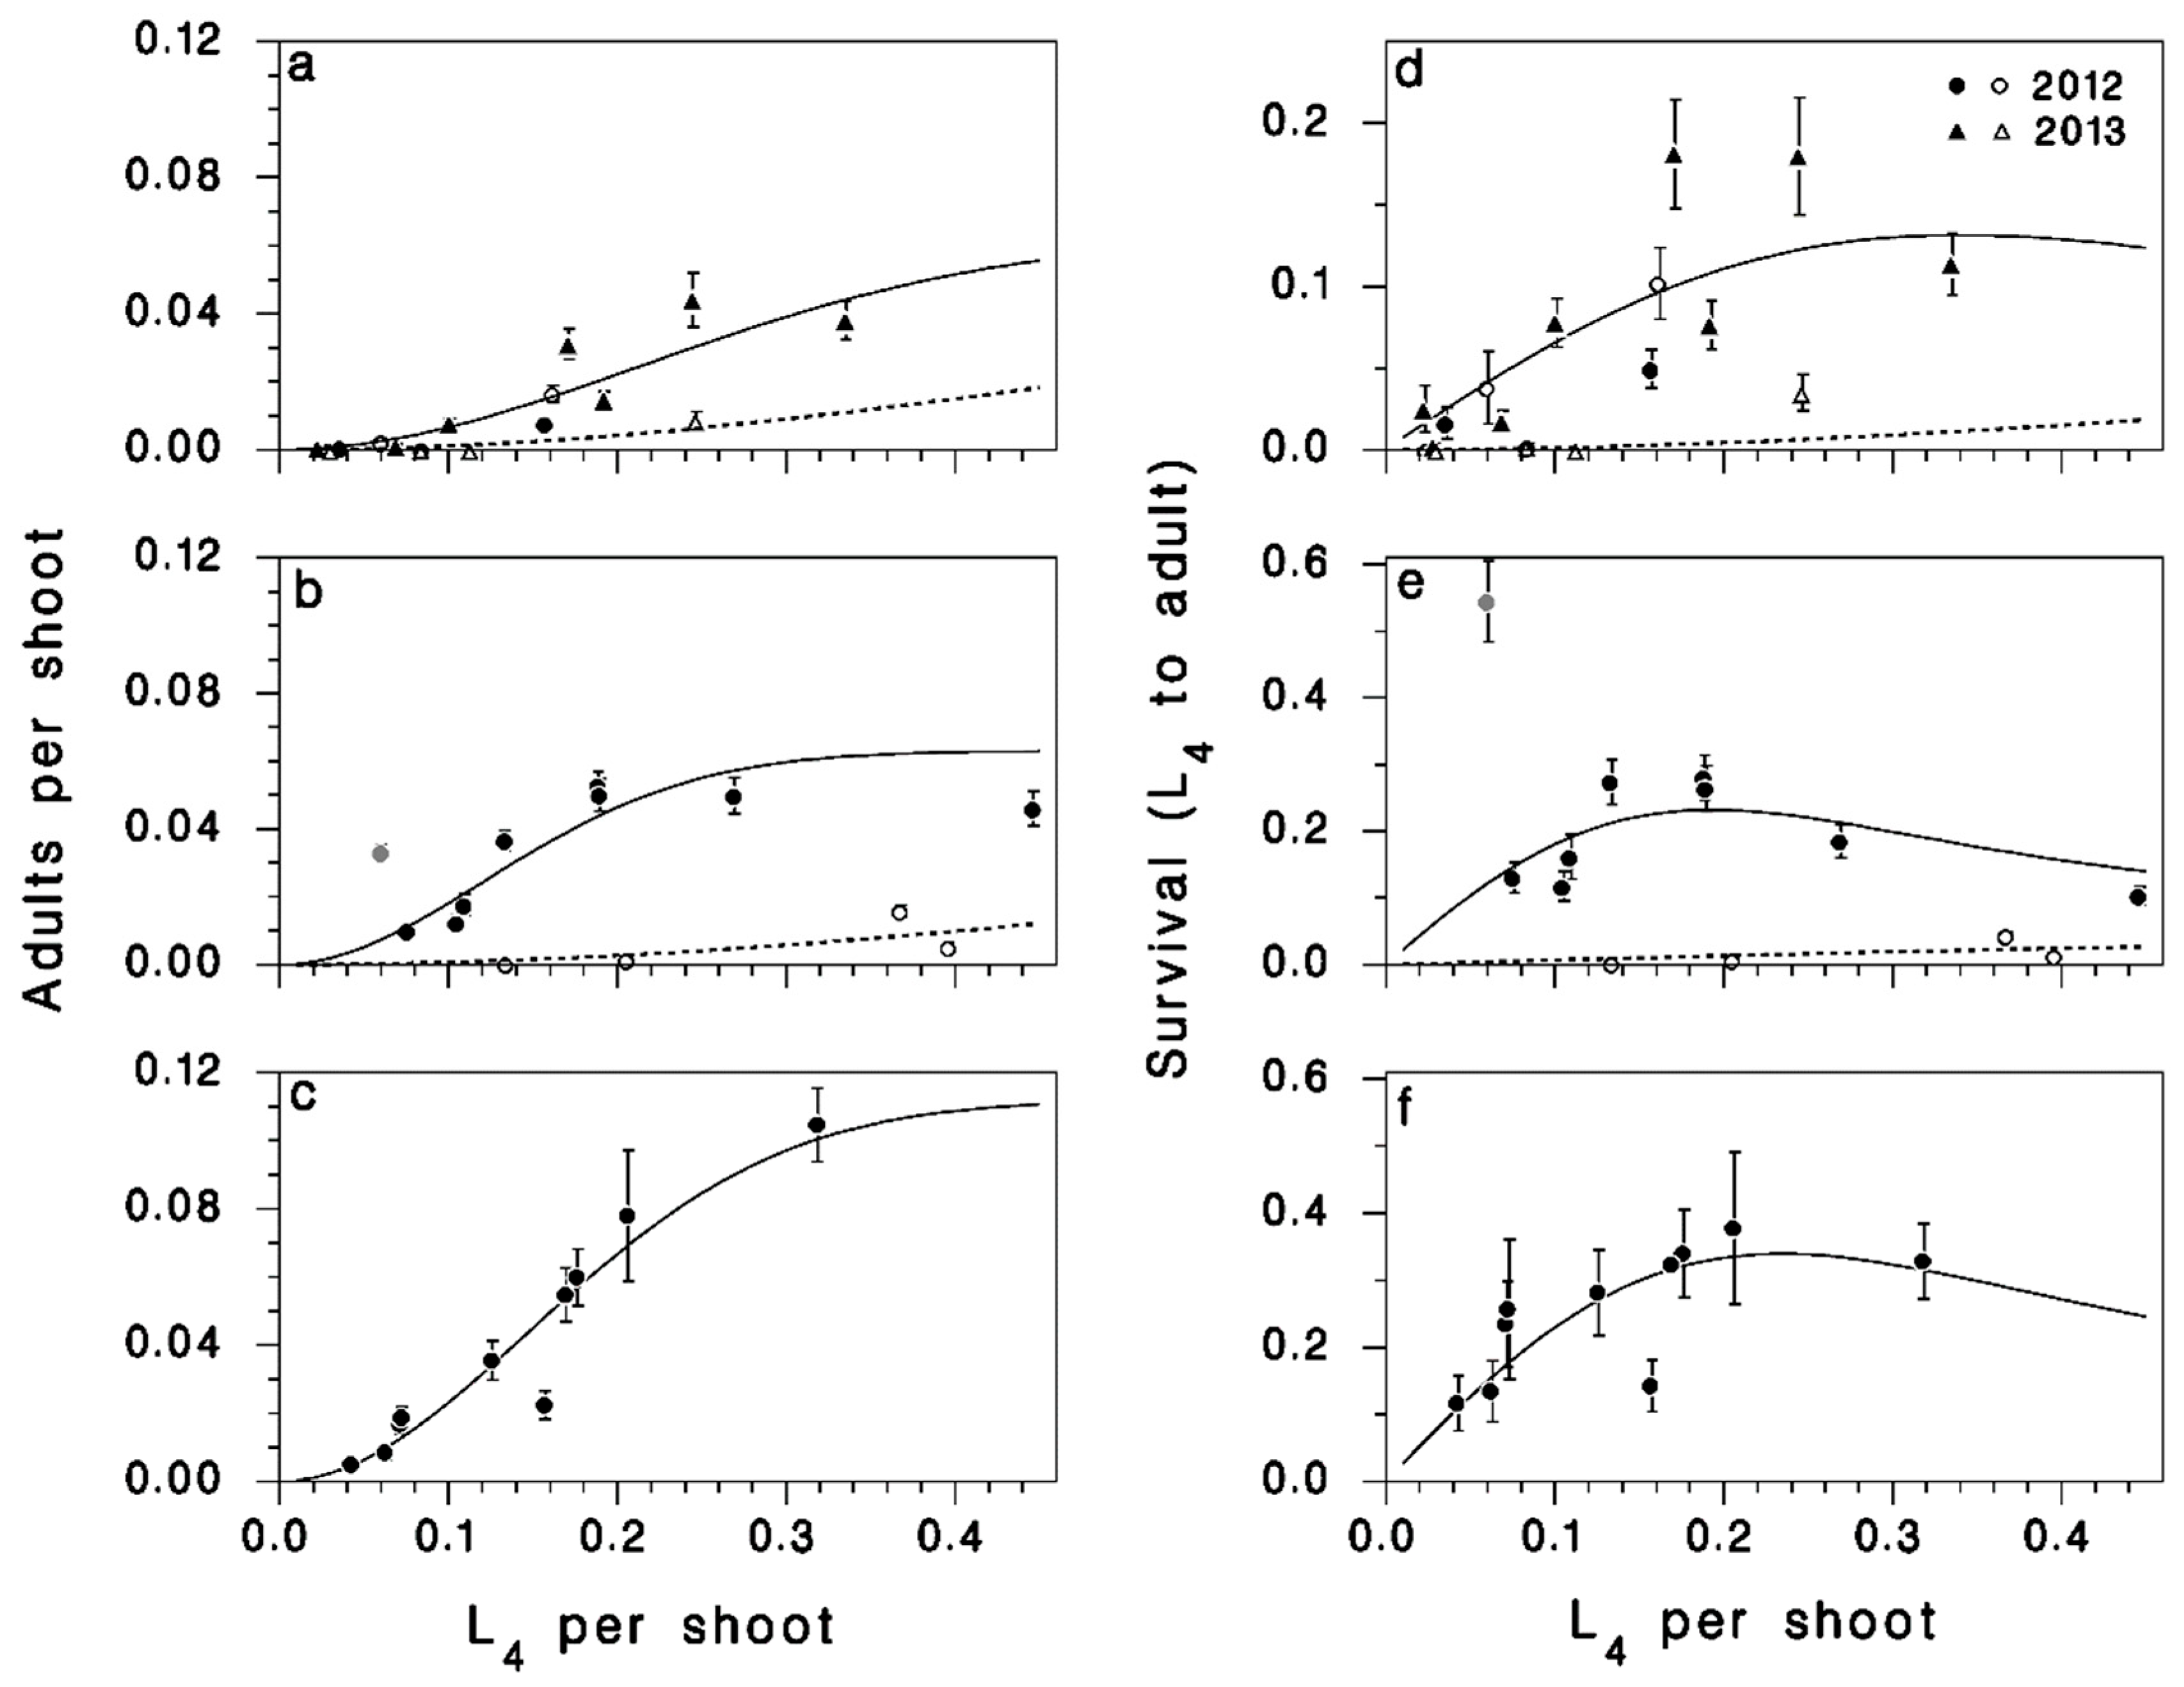
3.1. Population Density and Survival
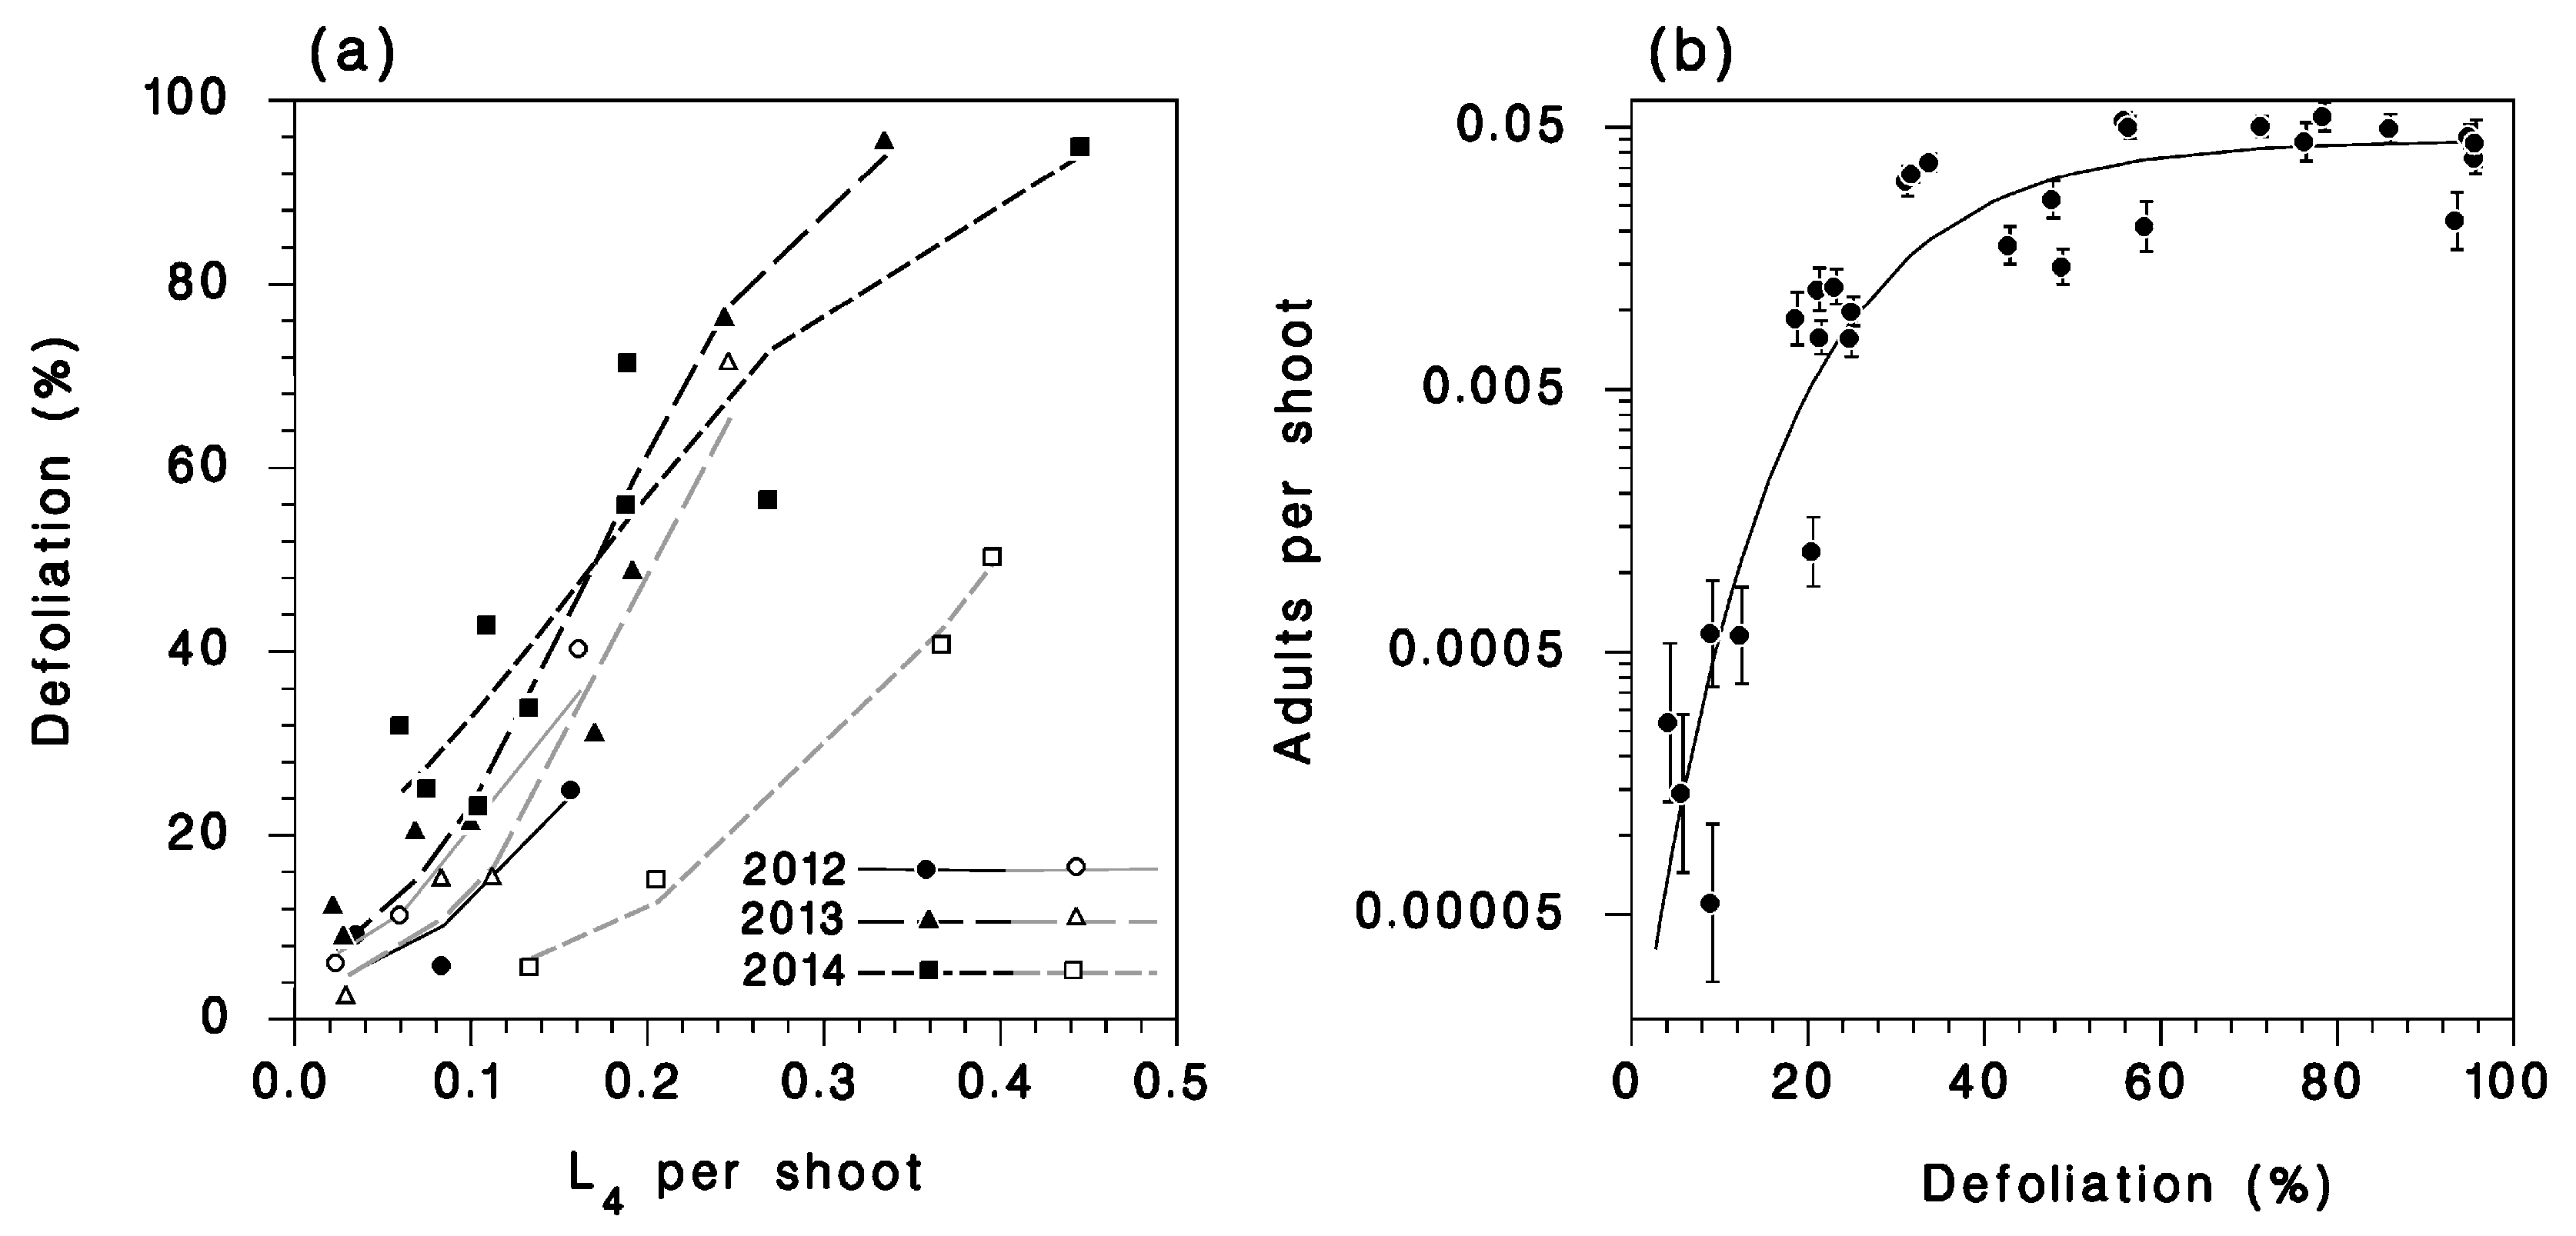
3.2. Defoliation
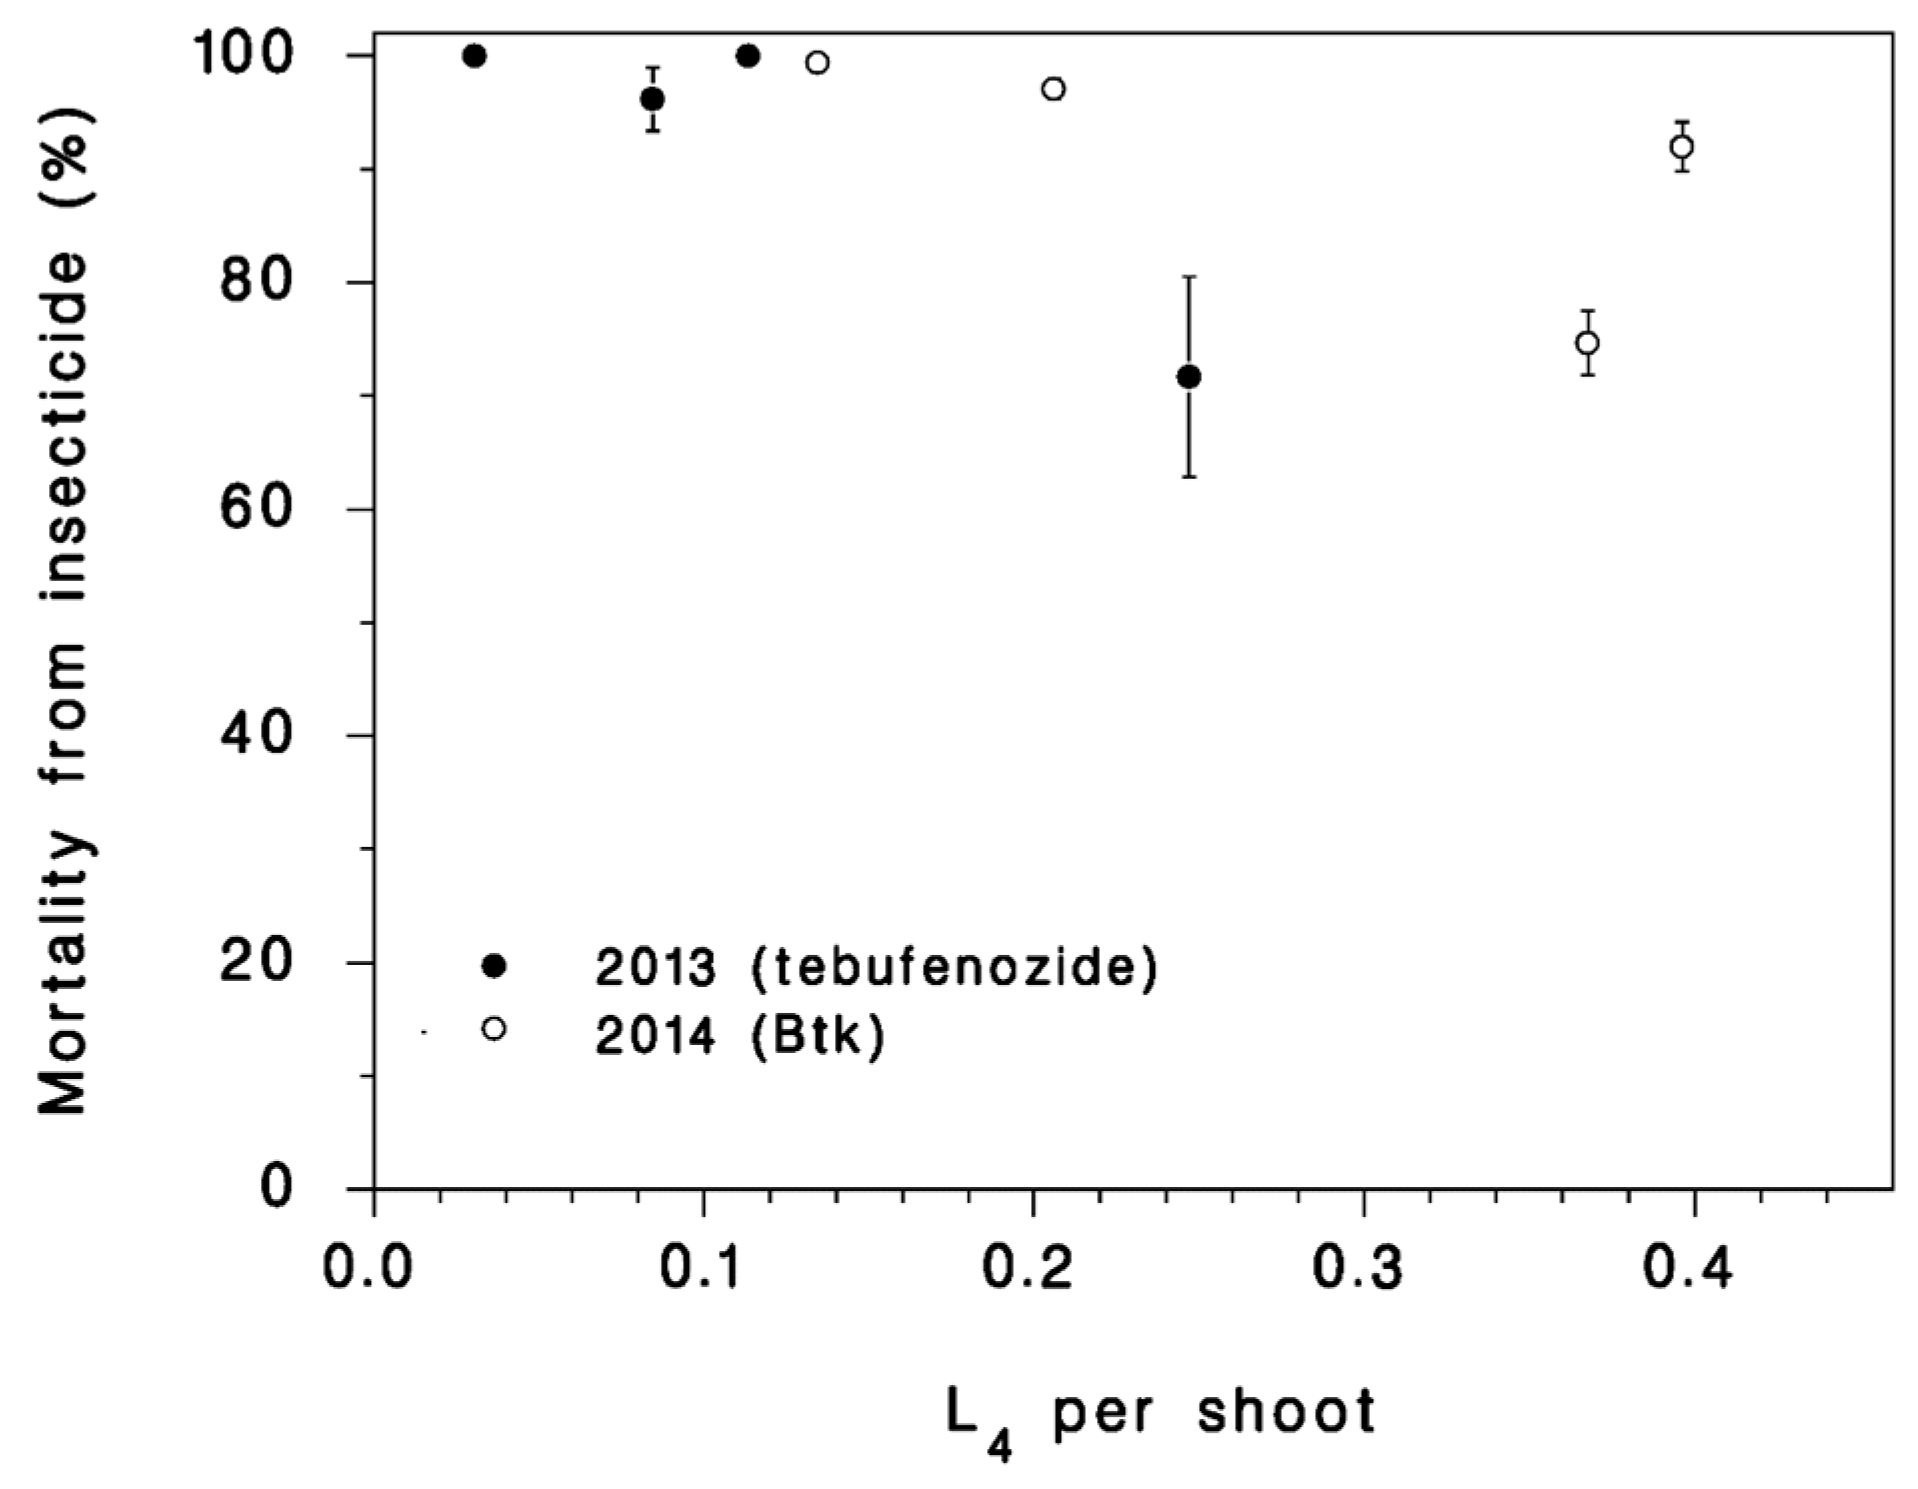
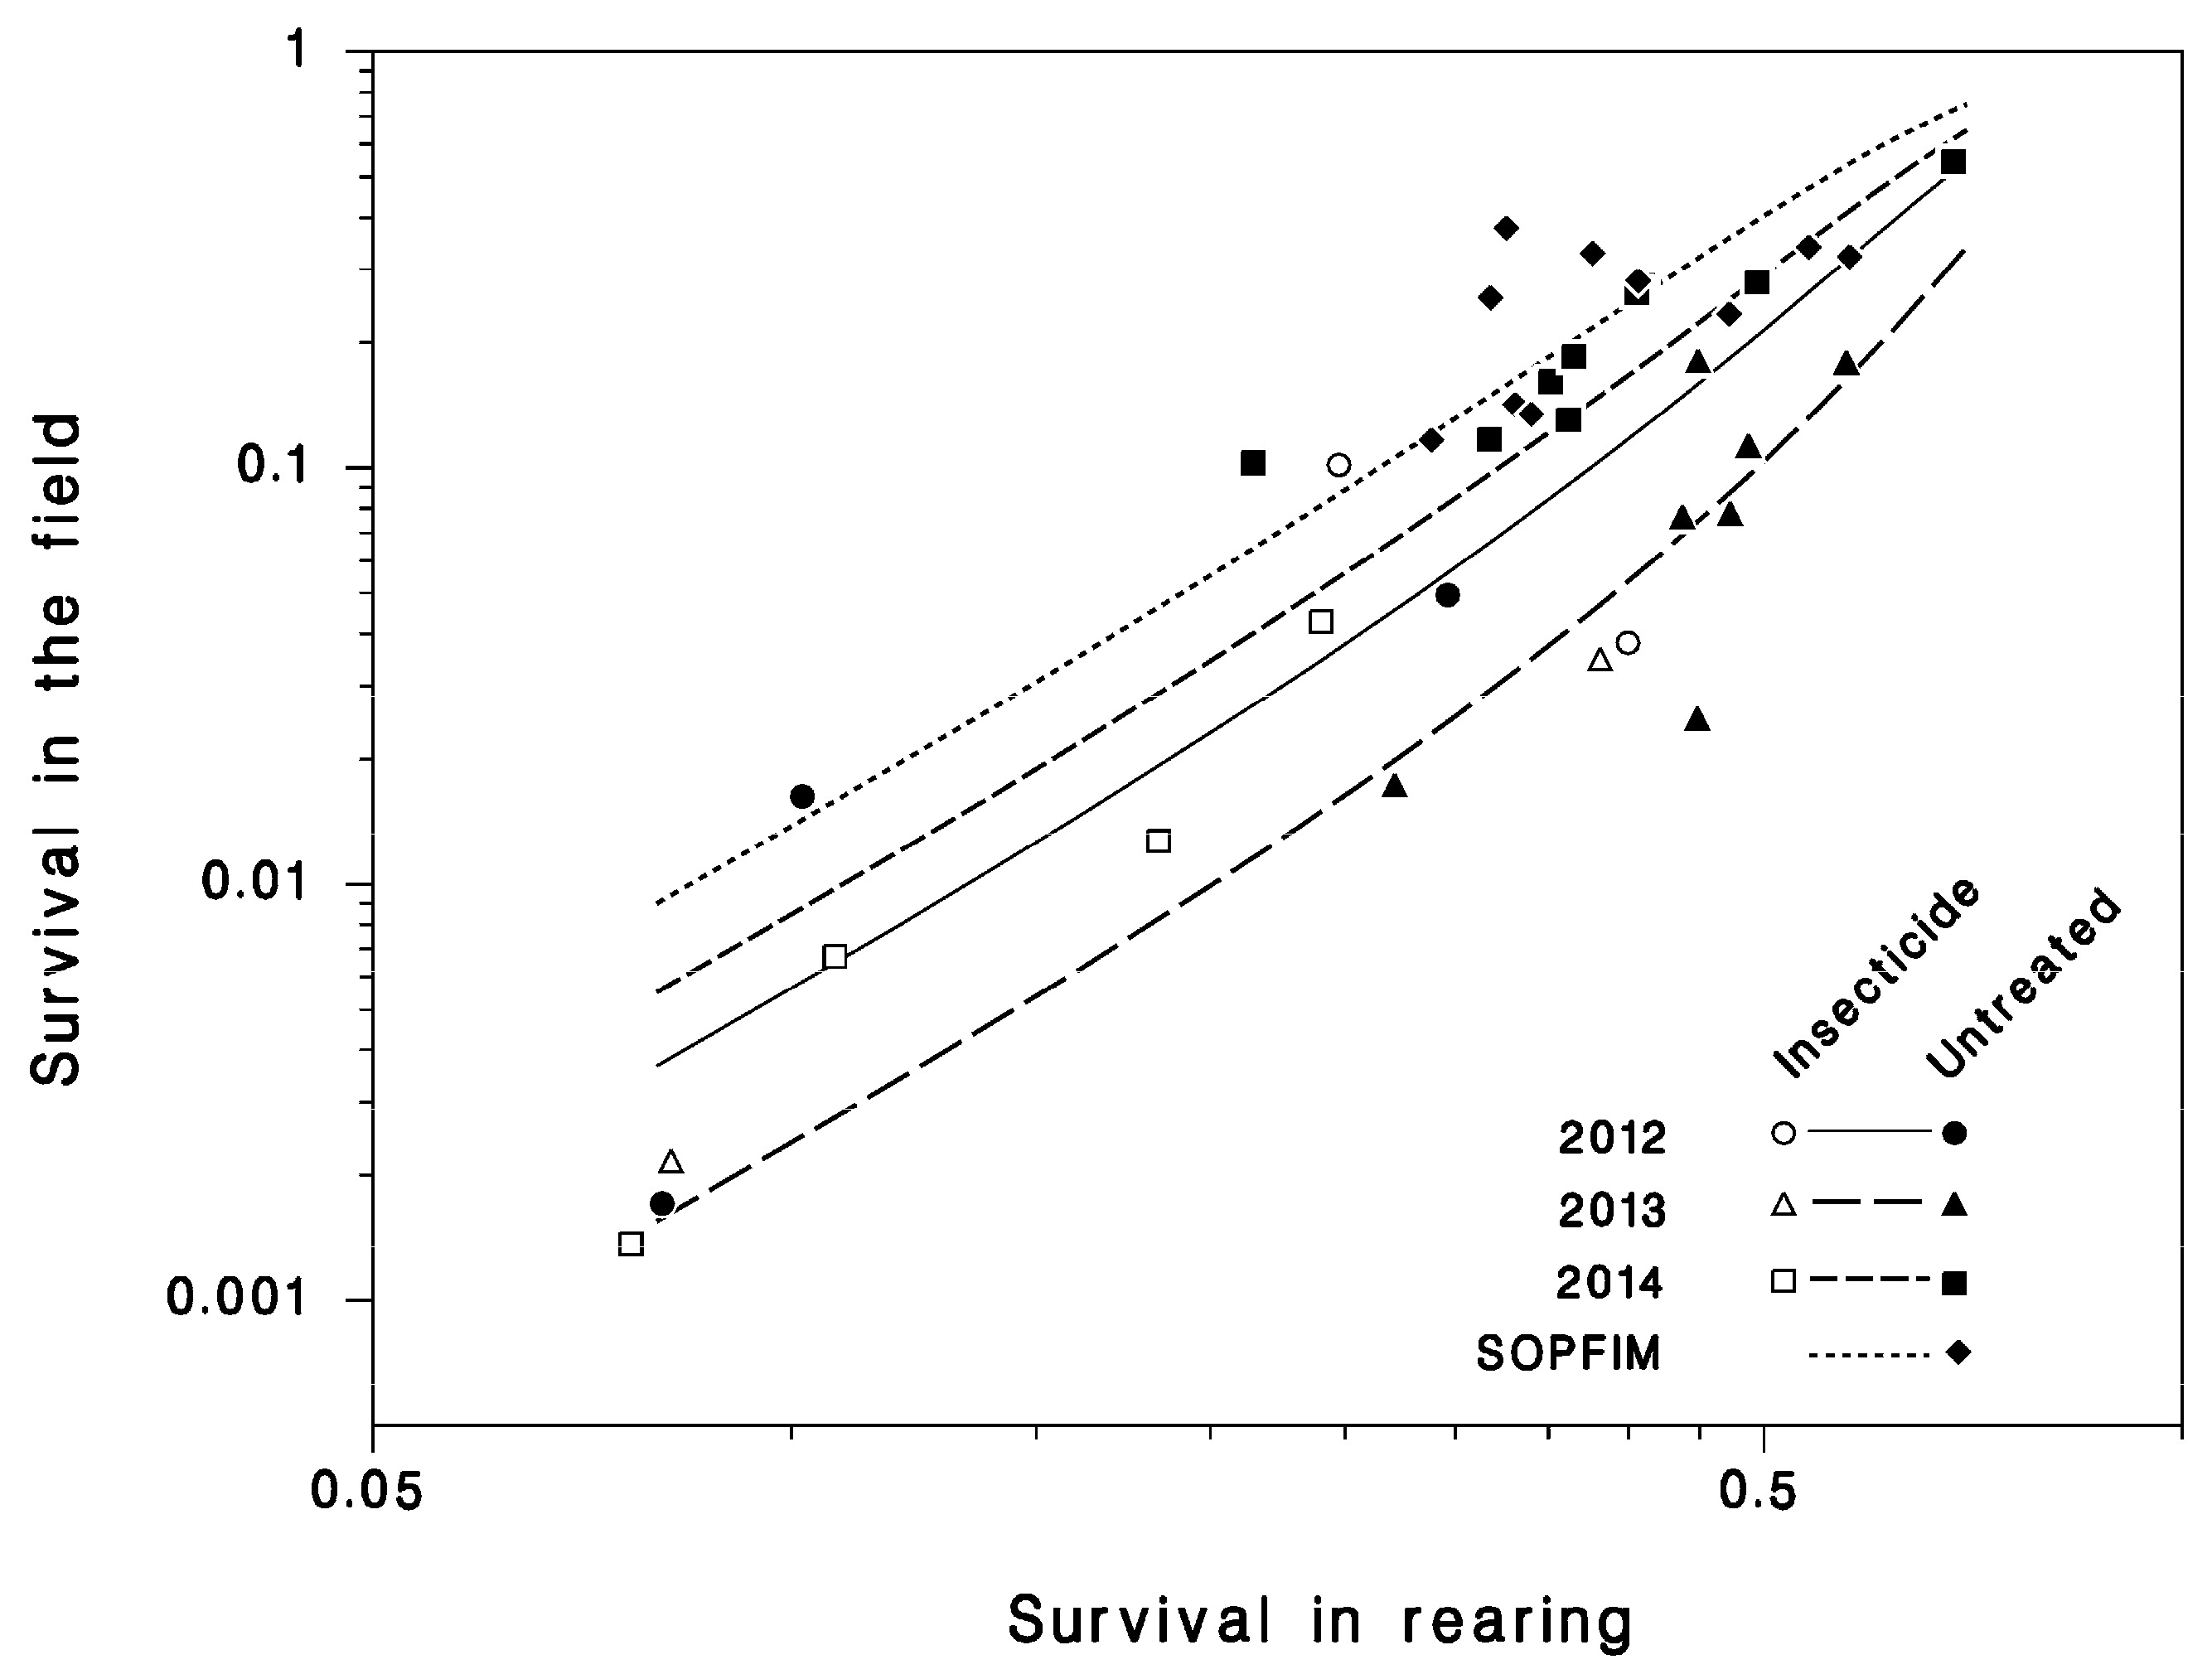
3.3. Survival in Rearing
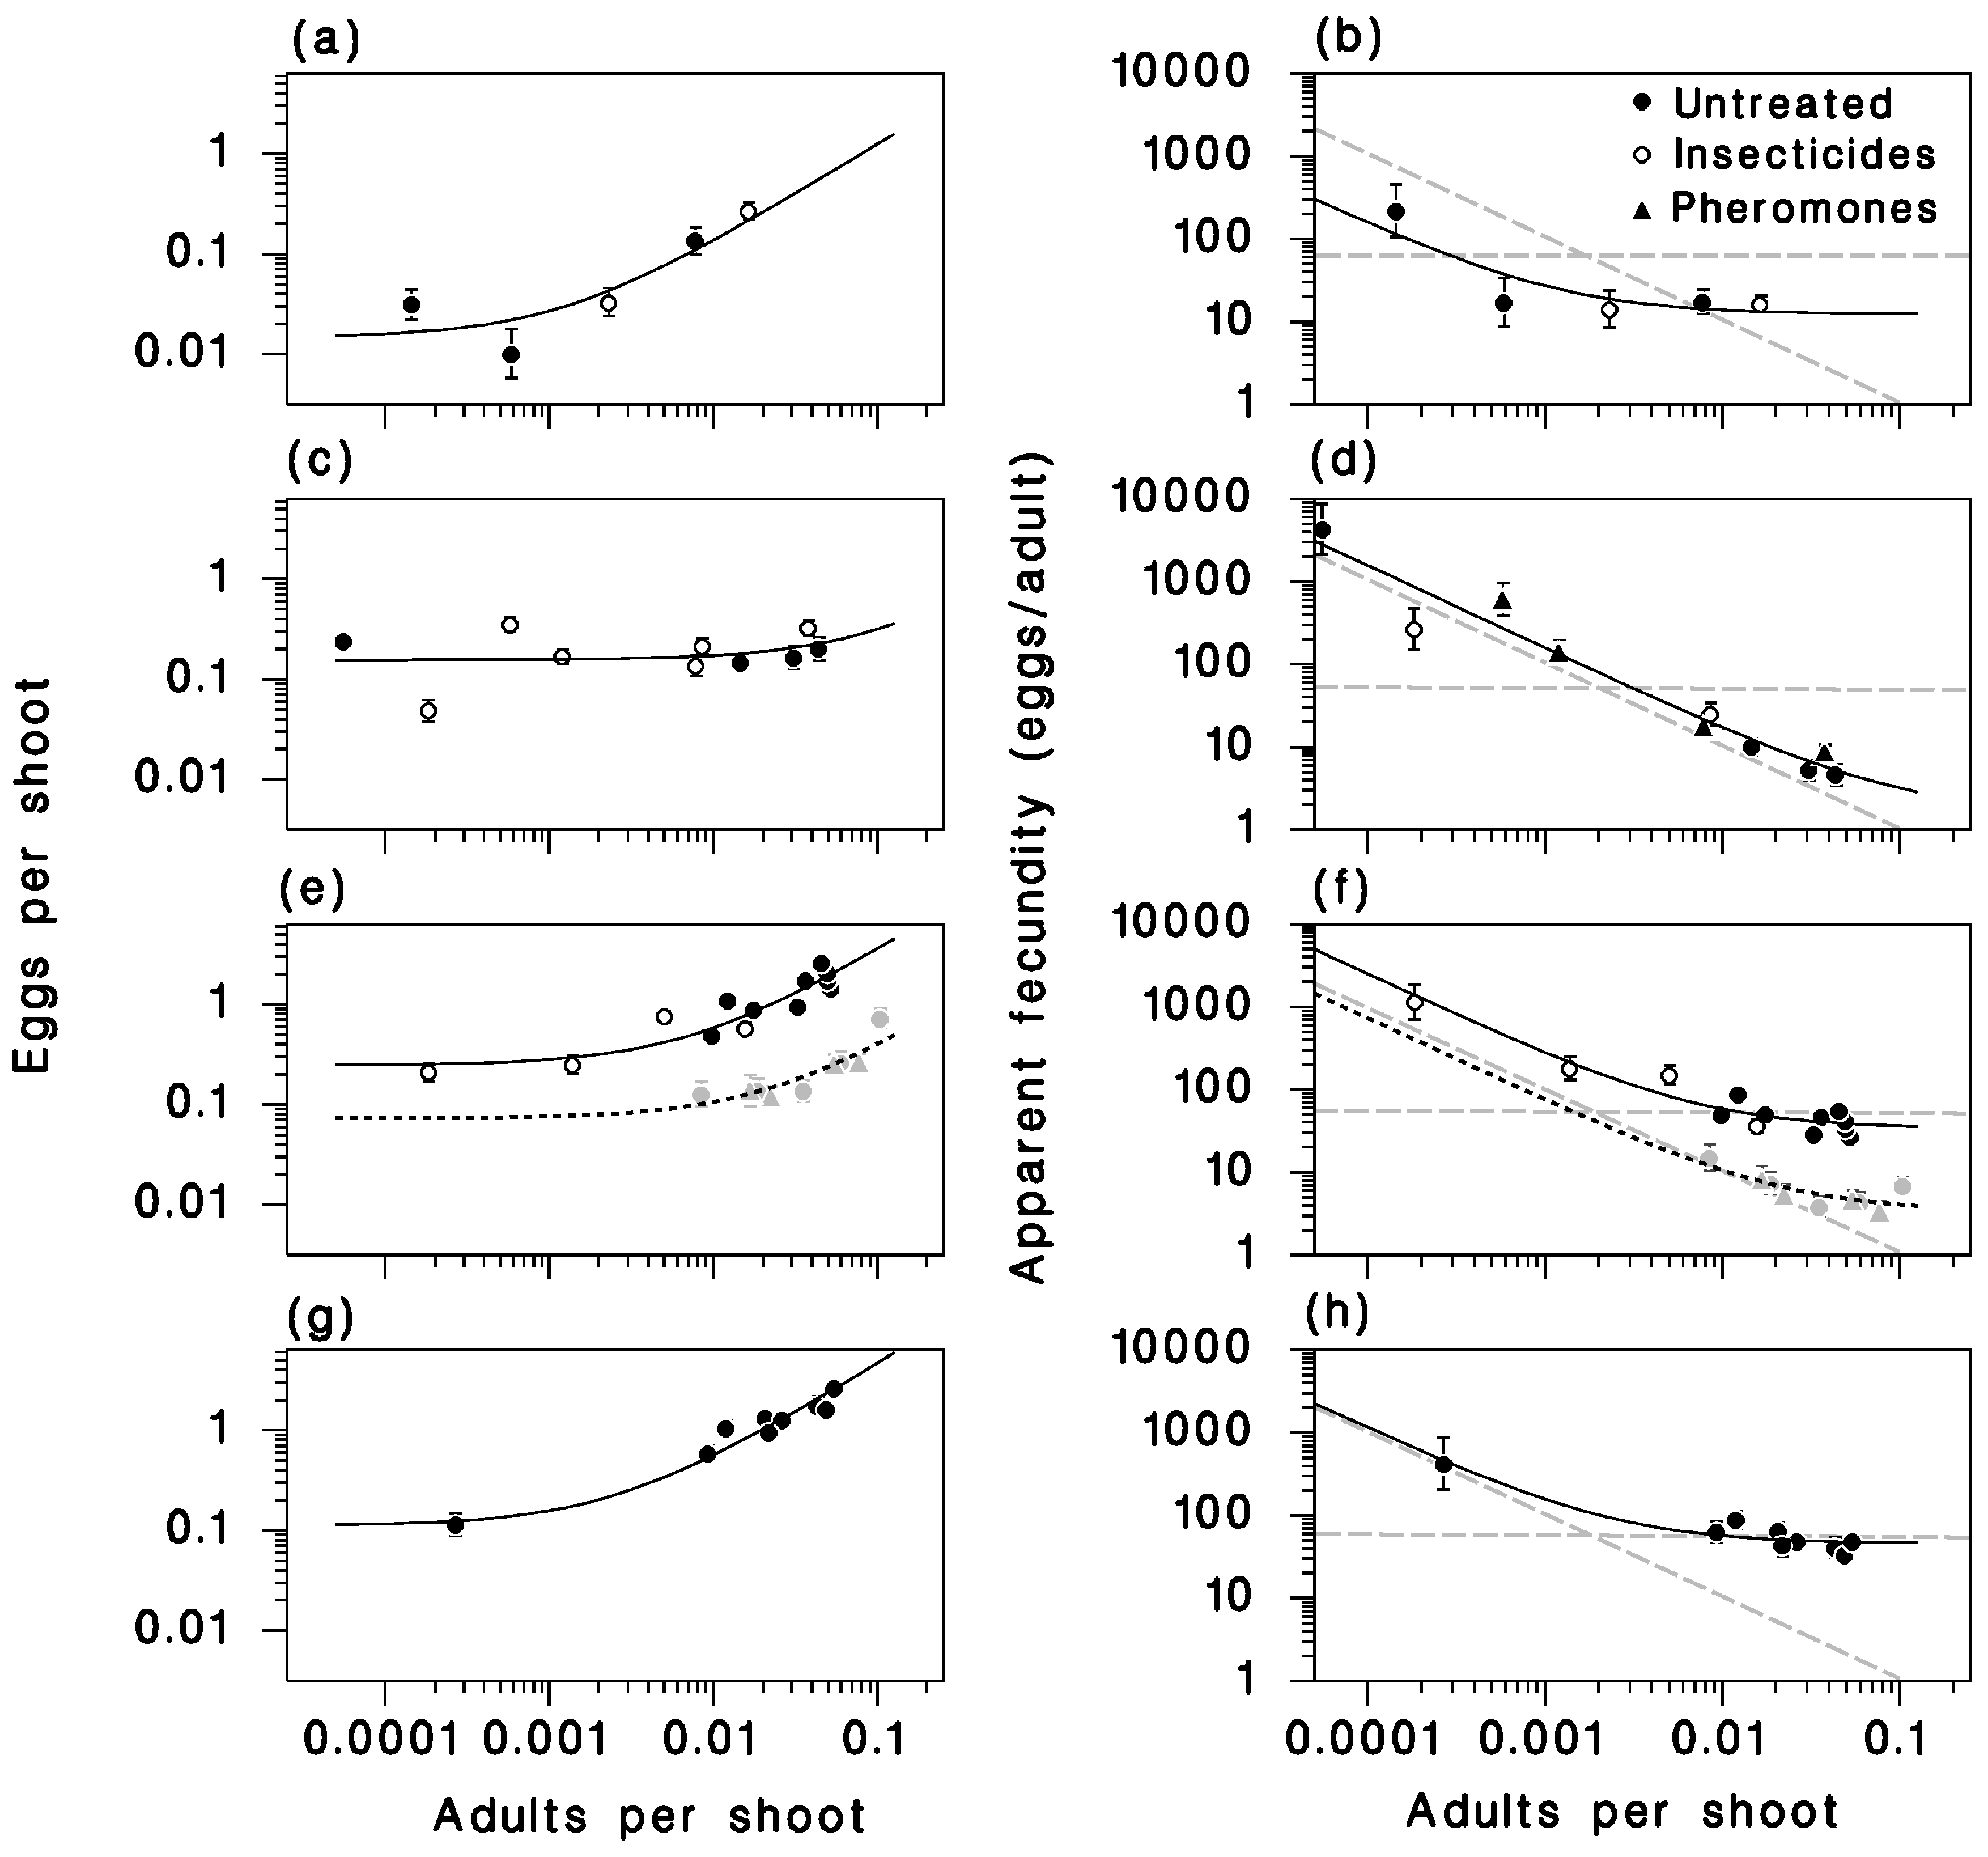
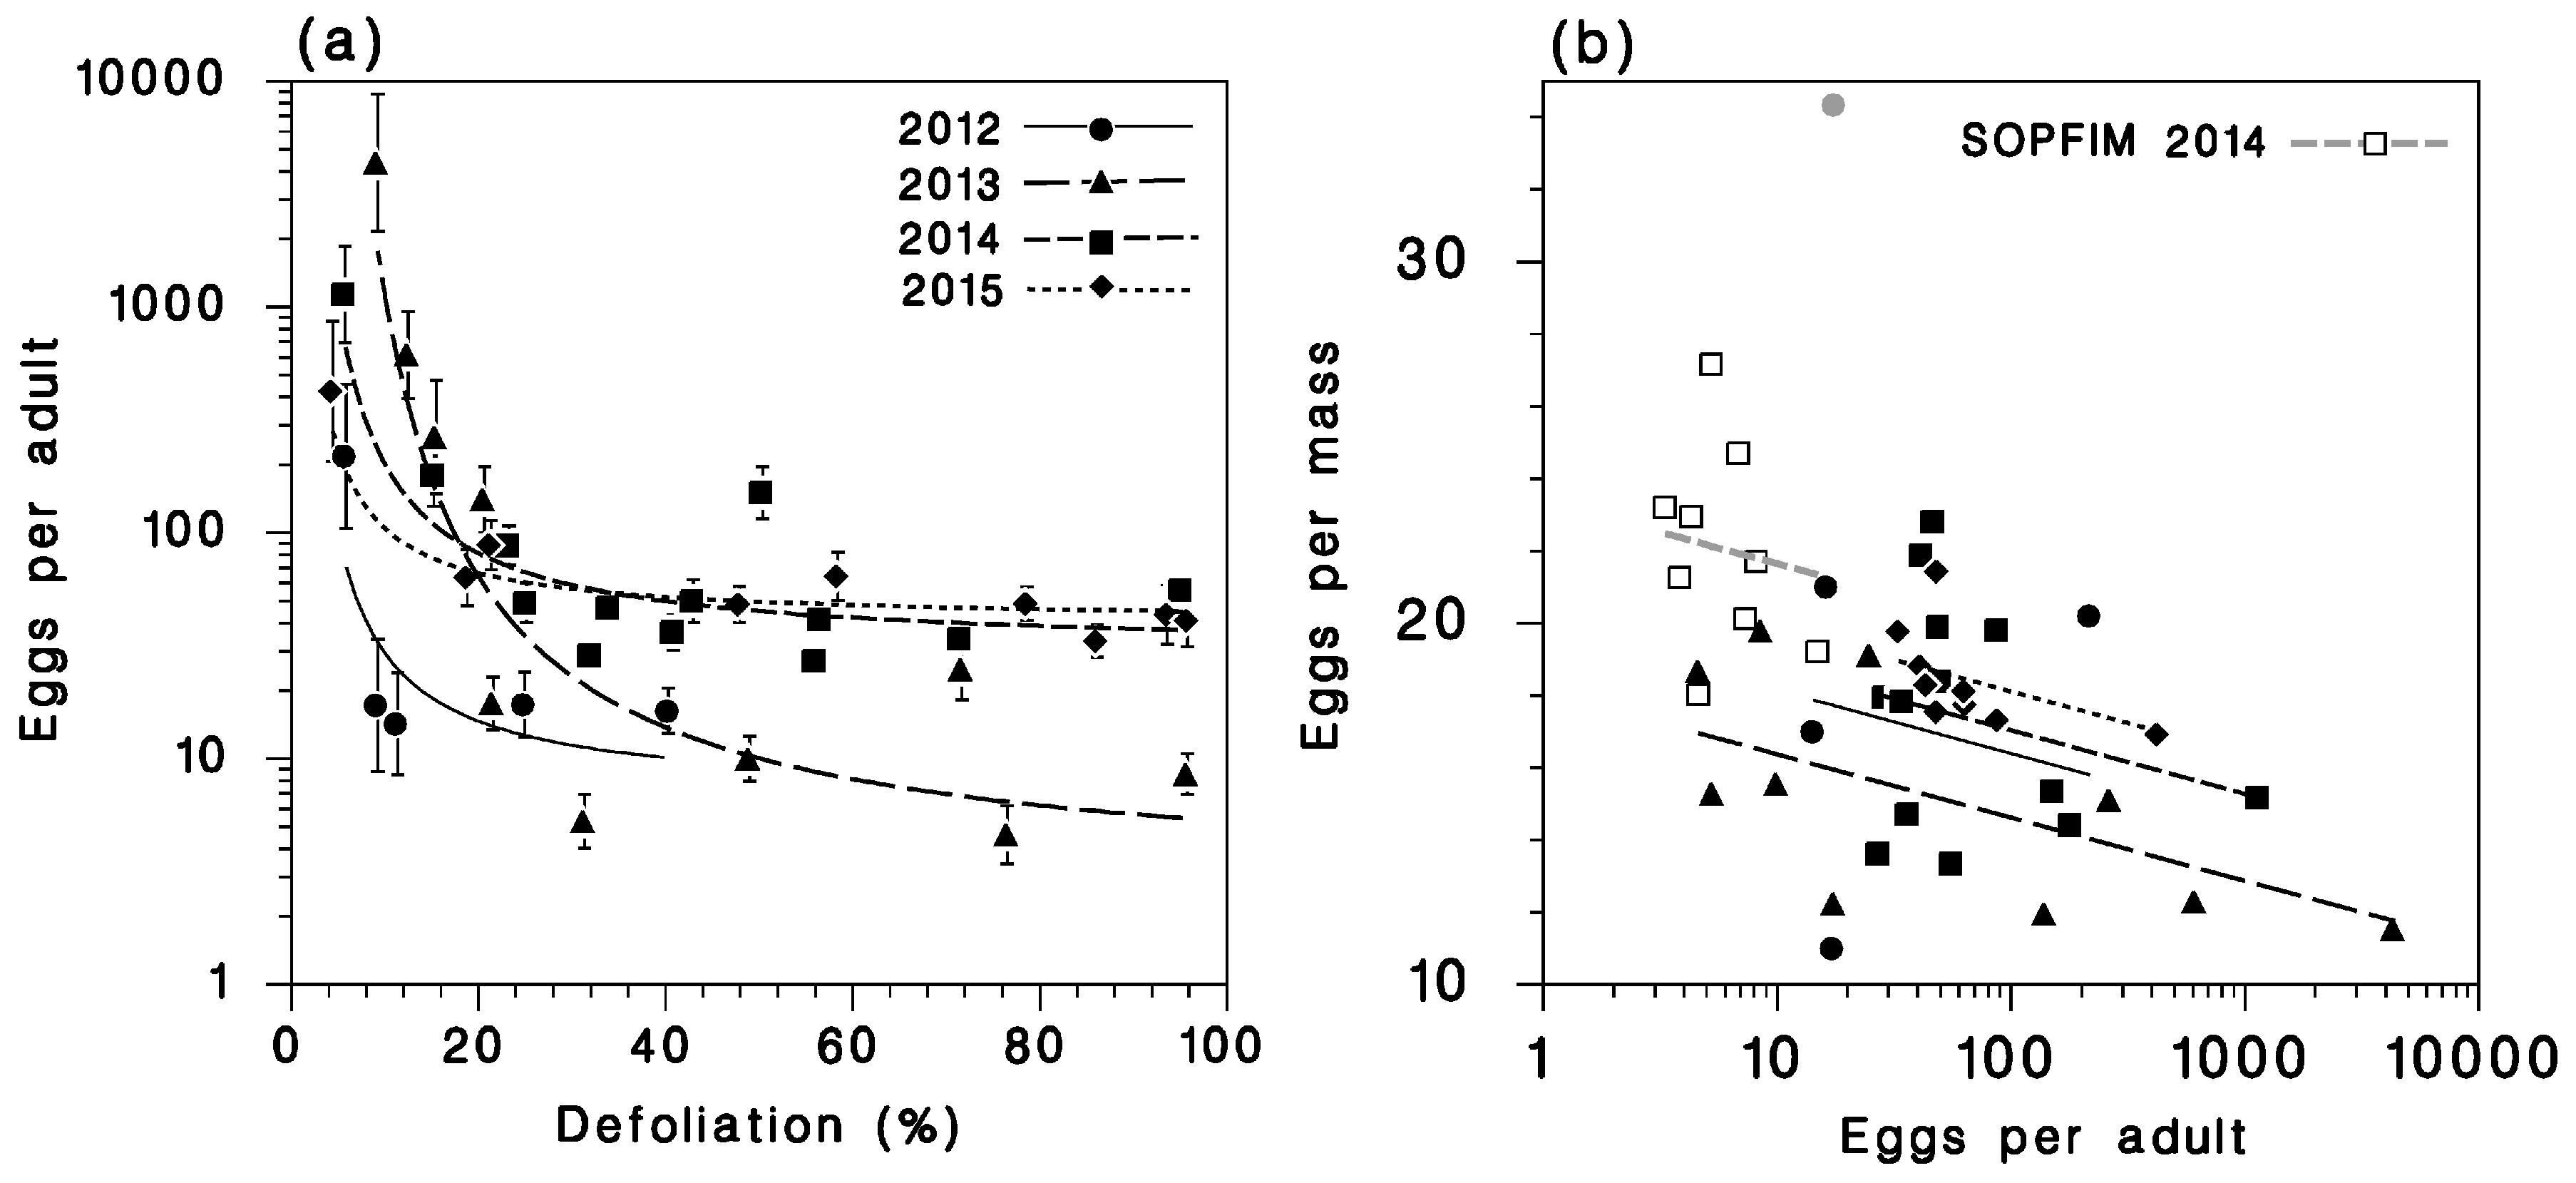
3.4. Recruitment to the Egg Stage
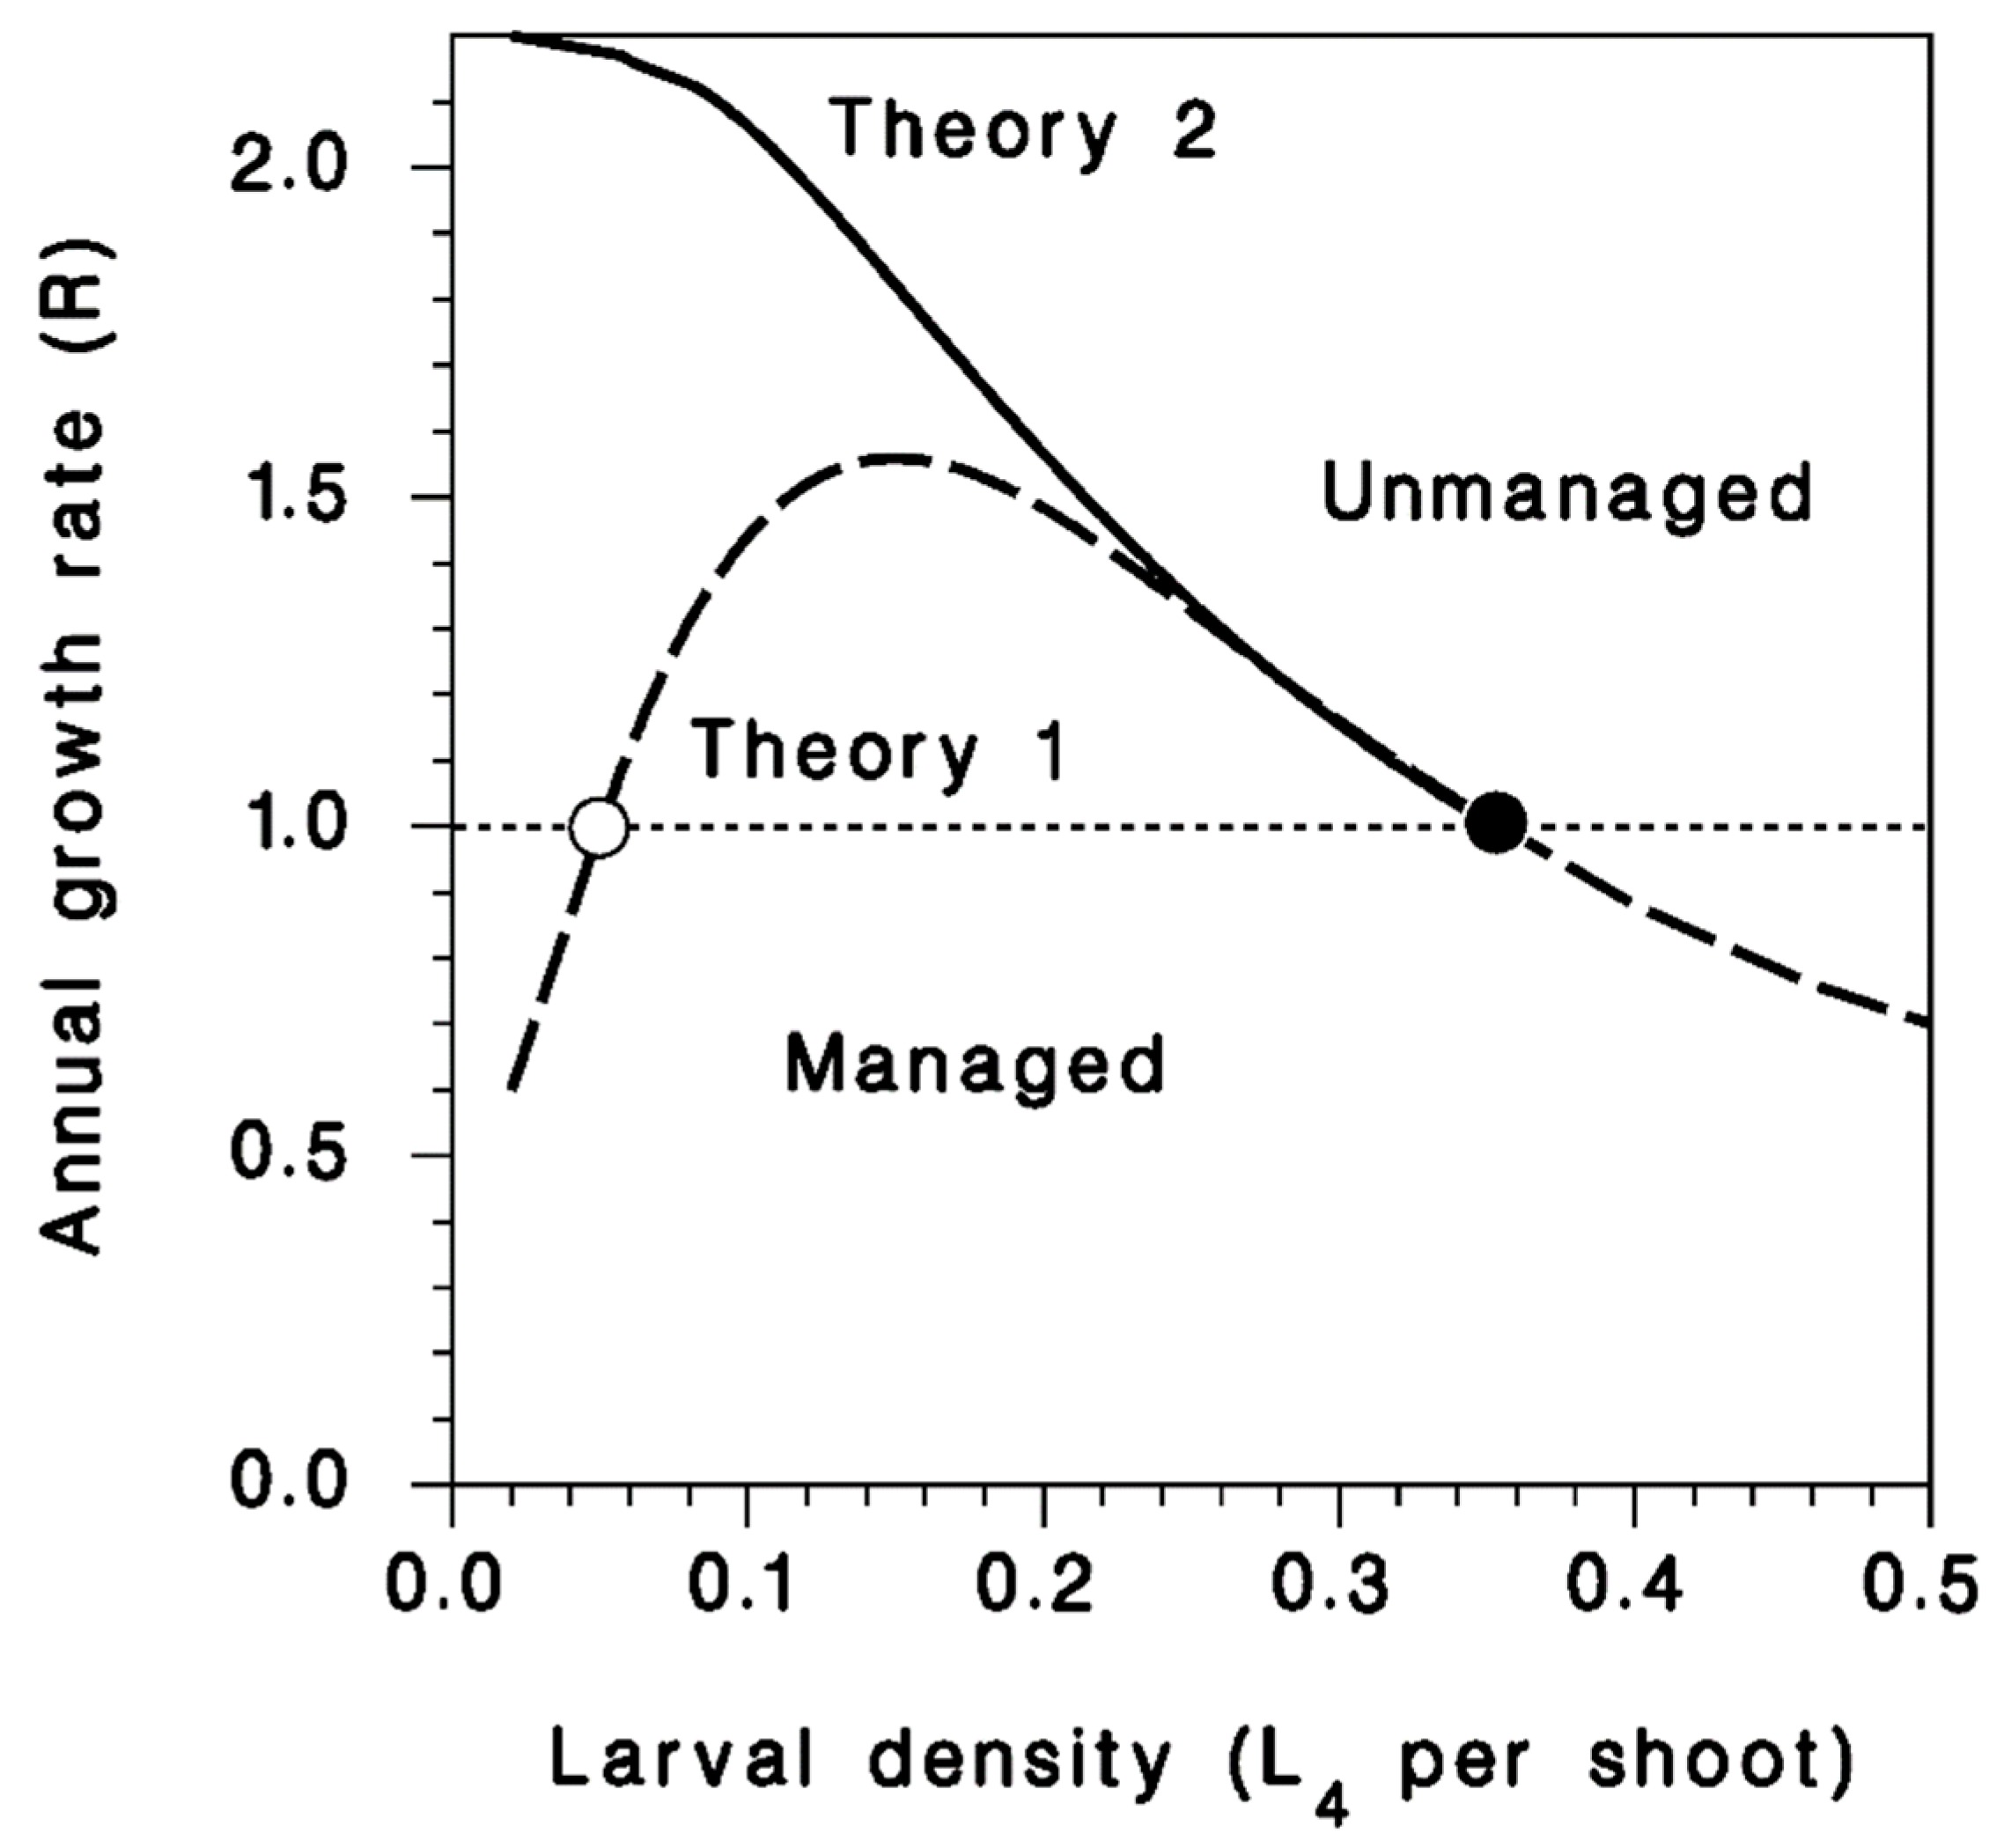
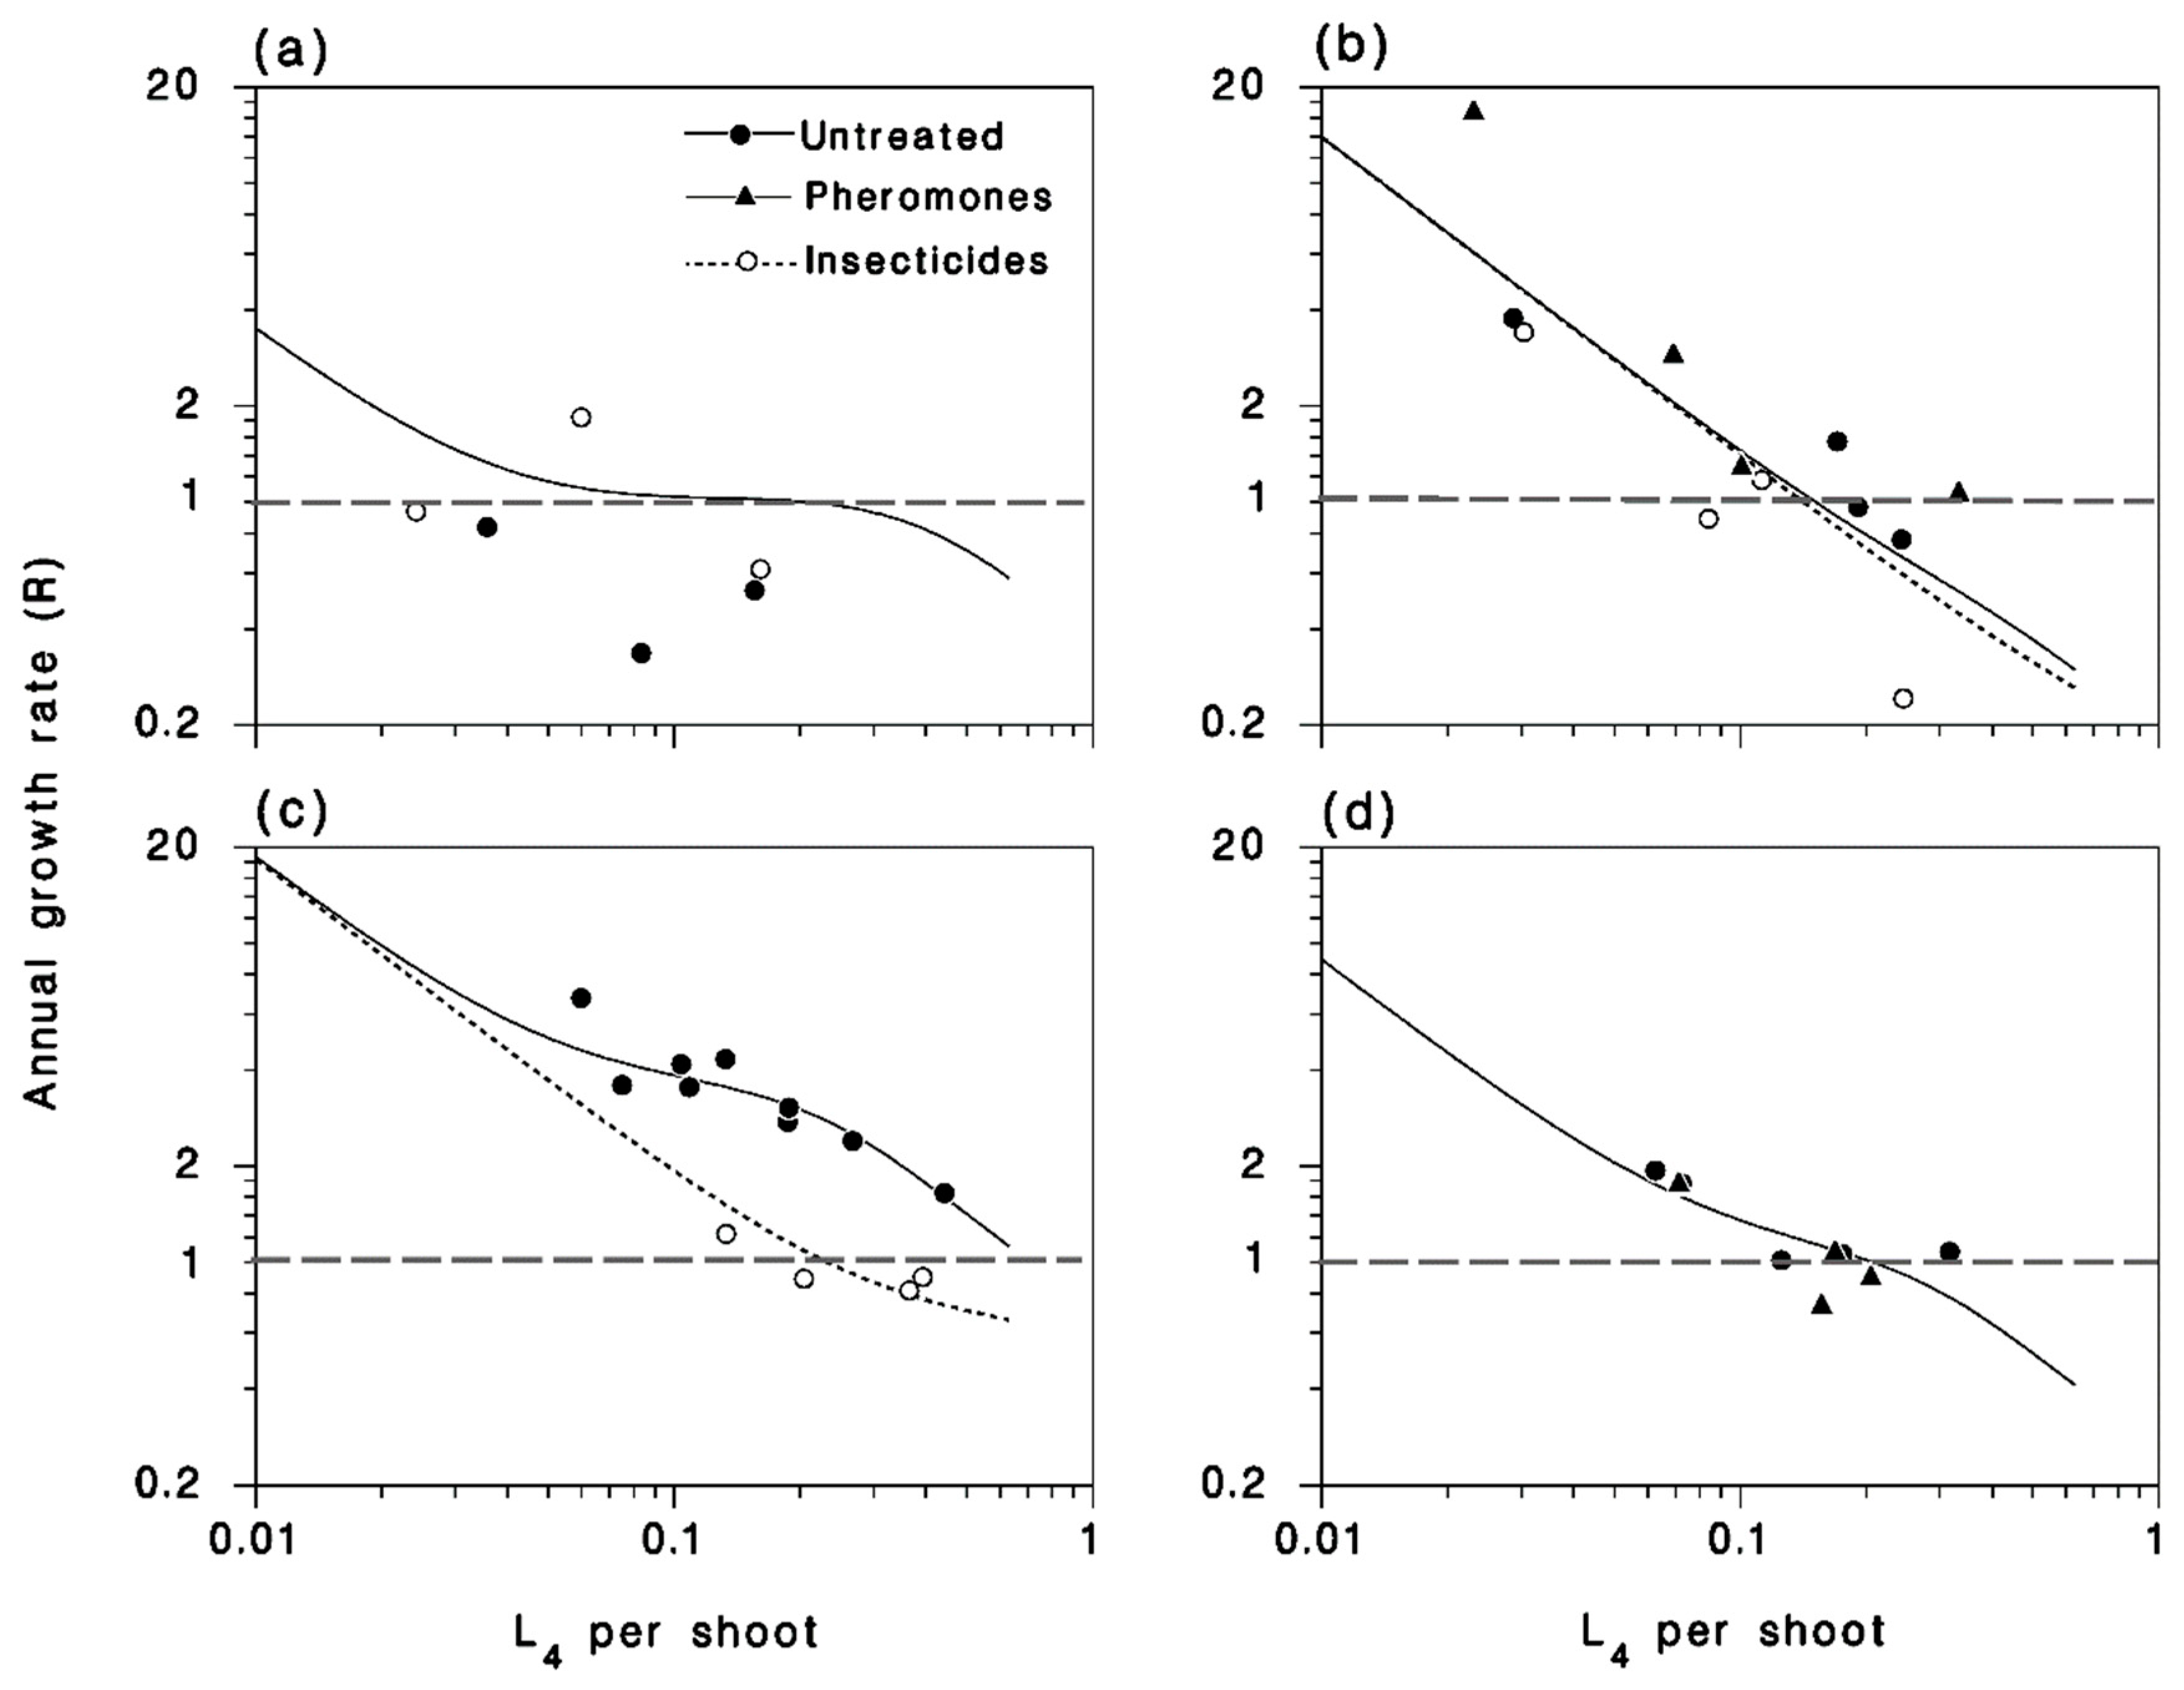
3.5. Annual Population Growth Rate
4. Discussion
5. Conclusions
Author Contributions
Funding
Acknowledgments
Conflicts of Interest
References
- MacLean, D.A. Vulnerability of fir spruce stands during uncontrolled spruce budworm outbreaks: A review and discussion. For. Chron. 1980, 56, 213–221. [Google Scholar] [CrossRef]
- Armstrong, J.A.; Cook, C.A. Aerial Spray Applications on Canadian Forests: 1945 to 1990; Forestry Canada: Ottawa, ON, Canada, 1993. [Google Scholar]
- Chang, W.Y.; Lantz, V.A.; Hennigar, C.R.; MacLean, D.A. Economic impacts of spruce budworm (Choristoneura fumiferana Clem.) outbreaks and control in New Brunswick, Canada. Can. J. For. Res. 2012, 42, 490–505. [Google Scholar] [CrossRef]
- Bouchard, M.; Auger, I. Influence of environmental factors and spatio-temporal covariates during the initial development of a spruce budworm outbreak. Lands. Ecol. 2014, 29, 111–126. [Google Scholar] [CrossRef]
- Johns, R.; Bowden, J.; Carleton, R.D.; Cooke, B.J.; Edwards, S.; Emilson, E.; James, P.M.A.; Kneeshaw, D.; MacLean, D.A.; Martel, V.; et al. A conceptual framework for the spruce budworm early intervention strategy: Can outbreaks be stopped? Forests 2019. in review. [Google Scholar]
- Ludwig, D.; Jones, D.D.; Holling, C.S. Qualitative analysis of insect outbreak systems: The spruce budworm and forest. J. Anim. Ecol. 1978, 47, 315–332. [Google Scholar] [CrossRef]
- Morris, R.F. The dynamics of epidemic spruce budworm population. Mem. Entomol. Soc. Can. 1963, 31, 30–32. [Google Scholar] [CrossRef]
- Royama, T. Population dynamics of the spruce budworm Choristoneura Fumiferana. Ecol. Monogr. 1984, 54, 429–462. [Google Scholar] [CrossRef]
- Berryman, A.A. The theory and classification of outbreaks. In Insect Outbreaks; Barbosa, P., Schultz, J.C., Eds.; Academic Press: New York, NY, USA, 1987; pp. 3–30. ISBN 13: 9780120781485. [Google Scholar]
- Régnière, J.; Delisle, J.; Bauce, E.; Therrien, P.; Kettela, E.; Cadogan, L.; Retnakaran, A.; van Frankenhuyzen, K. Understanding of spruce budworm population dynamics: Development of early intervention strategies. In Boreal Odyssey, Proceedings to the North American Forest Insect Work Conference, Edmonton, AB, Canada, 14–18 May 2001; Volney, W.J.A., Spence, J.R., Lefebvre, E.M., Eds.; Canadian Forest Service: Victoria, BC, Canada, 2001; pp. 57–68. [Google Scholar]
- Clark, W.C.; Jones, D.D.; Holling, C.S. Lessons for ecological policy design: A case study of ecosystem management. Ecol. Model. 1979, 7, 1–53. [Google Scholar] [CrossRef]
- Régnière, J.; Nealis, V. Ecological mechanisms of population change during outbreaks of the spruce budworm. Ecol. Entomol. 2007, 32, 461–477. [Google Scholar] [CrossRef]
- Allee, W.C.; Bowen, E. Studies in animal aggregations: Mass protection against colloidal silver among goldfishes. J. Exp. Zool. 1932, 61, 185–207. [Google Scholar] [CrossRef]
- Stephens, P.A.; Sutherland, W.J.; Freckleton, R.P. What is the Allee effect? Oikos 1999, 87, 185–190. [Google Scholar] [CrossRef]
- Régnière, J.; Delisle, J.; Pureswaran, D.; Trudel, R. Mate-finding Allee effect in spruce budworm population dynamics. Entomol. Exp. Appl. 2012, 146, 112–122. [Google Scholar] [CrossRef]
- Régnière, J.; Delisle, J.; Dupont, A.; Trudel, R. Results of three mating disruption trials for population management of the spruce budworm (Lepidoptera: Tortricidae). Forest 2019. in review. [Google Scholar]
- Van Frankenhuyzen, K.; Régnière, J. Multiple effect of tebufenozide on the survival and performance of the spruce budworm (Lepidoptera: Tortricidae). Can. Entomol. 2016, 149, 227–240. [Google Scholar] [CrossRef]
- Régnière, J.; Sanders, C.J. Optimal sample size for the estimation of spruce budworm (Lepidoptera: Tortricidae) populations on balsam fir and white spruce. Can. Entomol. 1983, 115, 1621–1626. [Google Scholar] [CrossRef]
- Sanders, C.J. A Summary of Current Techniques Used for Sampling Spruce Budworm Populations and Estimating Defoliation in Eastern Canada; Canadian Forest Service: Victoria, BC, Canada, 1980.
- Régnière, J.; Nealis, V.G. Moth dispersal, egg recruitment and spruce budworms: Measurement and interpretation. Forests 2019, 10, 706. [Google Scholar] [CrossRef]
- Régnière, J. An oviposition model for the spruce budworm, Choristoneura fumiferana (Lepidoptera: Tortricidae). Can. Entomol. 1983, 115, 1371–1382. [Google Scholar] [CrossRef]
- Régnière, J.; You, M. A simulation model of spruce budworm (Lepidoptera: Tortricidae) feeding on balsam fir and white spruce. Ecol. Model. 1991, 54, 277–297. [Google Scholar] [CrossRef]
- Stedinger, J.R. A spruce budworm-forest model and its implications for suppression programs. For. Sci. 1984, 30, 597–615. [Google Scholar] [CrossRef]
- Bouchard, M.; Martel, V.; Régnière, J.; Therrien, P.; Correia, D.L.P. Do natural enemies explain fluctuations in low-density spruce budworm populations? Ecology 2018, 99, 2047–2057. [Google Scholar] [CrossRef]
- Bouchard, M.; Régnière, J.; Therrien, P. Bottom-up factors contribute to large-scale synchrony in spruce budworm populations. Can. J. For. Res. 2017, 48, 277–284. [Google Scholar] [CrossRef]
- Blais, J.R. The relationship of the spruce budworm (Choristoneura fumiferana Clem.) to the flowering condition of balsam fir (Abies balsamea (L.) Mill.). Can. J. Zool. 1952, 30, 1–19. [Google Scholar] [CrossRef]
- Bauce, E.; Carisey, N. Larval feeding behaviour affects the impact of staminate flower production on the suitability of balsam fir trees for spruce budworm. Oecologia 1996, 105, 126–131. [Google Scholar] [CrossRef] [PubMed]
- Alerstam, T.; Chapman, J.W.; Bäckman, J.; Smith, A.D.; Karlsson, H.; Nilsson, C.; Reynolds, D.R.; Klaassen, H.G.; Hill, J.K. Convergent patterns of long-distance nocturnal migration in noctuid moths and passerine birds. Proc. R. Soc. B Biol. Sci. 2011, 278, 3074–3080. [Google Scholar] [CrossRef] [PubMed]
- MacLean, D.; Amirault, P.; Amos-Binks, L.; Cerleton, D.; Hennigar, C.; Johns, R.; Régnière, J. Positive results of an early intervention strategy to suppress a spruce budworm outbreak after five years of trials. Forests 2019, 10, 448. [Google Scholar] [CrossRef]


| Parameter | Estimate | SE | t | p |
|---|---|---|---|---|
| p0 | 0.06206 | 0.01378 | 4.50269 | 0.000028 |
| p0,S | 0.05220 | 0.03037 | 1.71885 | 0.046687 |
| p1 | 1.98880 | 1.18228 | 1.68218 | 0.050163 |
| p1|2013 | 1.63544 | 1.22133 | 1.33907 | 0.094054 |
| p1|2014 | 3.81979 | 1.36986 | 2.78846 | 0.004034 |
| p1|S | 2.66913 | 1.38153 | 1.93201 | 0.030232 |
| p2|2012 | 1.26555 | 1.39848 | 0.90495 | 0.185456 |
| p2|2013 | −2.35263 | 1.24347 | 1.89198 | 0.032874 |
| p2|2014 | −4.79843 | 1.20321 | 3.98801 | 0.000138 |
| p3 | 1.94932 | 0.20292 | 9.60643 | 0.000000 |
| Source | DF | Adj SS | Adj MS | F-Value | p-Value |
|---|---|---|---|---|---|
| N | 1 | 22.27 | 22.277 | 104.57 | 0.000 |
| Year | 2 | 0.228 | 0.114 | 0.53 | 0.595 |
| Insecticide | 1 | 2.061 | 2.061 | 9.68 | 0.006 |
| Year × Insecticide | 2 | 1.092 | 0.546 | 2.56 | 0.103 |
| N × Year | 2 | 2.997 | 1.499 | 7.04 | 0.005 |
| N × Insecticide | 1 | 0.325 | 0.325 | 1.52 | 0.232 |
| N × Year × Insecticide | 2 | 0.256 | 0.128 | 0.60 | 0.559 |
| Error | 19 | 4.047 | 0.213 | ||
| Total | 30 | 73.30 |
| Source | DF | Adj SS | Adj MS | F-Value | p-Value |
|---|---|---|---|---|---|
| Year | 3 | 1.6136 | 0.53787 | 6.70 | 0.002 |
| Insecticide | 1 | 0.0201 | 0.02006 | 0.25 | 0.621 |
| Logit(SR) | 1 | 3.8566 | 3.85659 | 48.06 | 0.000 |
| Logit(SR) × Year | 3 | 0.3090 | 0.10301 | 1.28 | 0.300 |
| Logit(SR) × Insecticide | 1 | 0.0114 | 0.01138 | 0.14 | 0.709 |
| Error | 27 | 2.1665 | 0.08024 | ||
| Total | 36 | 19.2402 |
| Parameter | Estimate | SE | t | p |
|---|---|---|---|---|
| I2012 | 0.015 | 0.006 | 2.621 | 0.006 |
| I2013 | 0.157 | 0.028 | 5.507 | 0.000 |
| I2014 | 0.248 | 0.072 | 3.450 | 0.001 |
| I2015 | 0.112 | 0.050 | 2.221 | 0.016 |
| IS | 0.073 | 0.035 | 2.072 | 0.023 |
| F2012 | 12.356 | 3.759 | 3.287 | 0.001 |
| F2013 | 1.617 | 1.608 | 1.006 | 0.161 |
| F2014 | 33.777 | 6.362 | 5.309 | 0.000 |
| F2015 | 45.713 | 7.7495 | 5.899 | 0.000 |
| FS | 3.321 | 1.147 | 2.897 | 0.003 |
| Source | DF | Adj SS | Adj MS | F-Value | p-Value |
|---|---|---|---|---|---|
| Year | 3 | 3.531 | 1.177 | 16.08 | 0.000 |
| 1/D | 1 | 0.656 | 0.656 | 8.96 | 0.006 |
| Year × 1/D | 3 | 4.562 | 1.521 | 20.77 | 0.000 |
| Error | 29 | 2.123 | 0.073 | ||
| Total | 36 | 14.005 |
| Source | DF | Adj SS | Adj MS | F-Value | p-Value |
|---|---|---|---|---|---|
| Year | 4 | 121.24 | 30.310 | 3.83 | 0.010 |
| LogEM | 1 | 41.80 | 41.804 | 5.29 | 0.027 |
| Error | 39 | 308.41 | 7.908 | ||
| Total | 44 | 587.99 |
© 2019 by the authors. Licensee MDPI, Basel, Switzerland. This article is an open access article distributed under the terms and conditions of the Creative Commons Attribution (CC BY) license (http://creativecommons.org/licenses/by/4.0/).
Share and Cite
Régnière, J.; Cooke, B.J.; Béchard, A.; Dupont, A.; Therrien, P. Dynamics and Management of Rising Outbreak Spruce Budworm Populations. Forests 2019, 10, 748. https://doi.org/10.3390/f10090748
Régnière J, Cooke BJ, Béchard A, Dupont A, Therrien P. Dynamics and Management of Rising Outbreak Spruce Budworm Populations. Forests. 2019; 10(9):748. https://doi.org/10.3390/f10090748
Chicago/Turabian StyleRégnière, Jacques, Barry J. Cooke, Ariane Béchard, Alain Dupont, and Pierre Therrien. 2019. "Dynamics and Management of Rising Outbreak Spruce Budworm Populations" Forests 10, no. 9: 748. https://doi.org/10.3390/f10090748
APA StyleRégnière, J., Cooke, B. J., Béchard, A., Dupont, A., & Therrien, P. (2019). Dynamics and Management of Rising Outbreak Spruce Budworm Populations. Forests, 10(9), 748. https://doi.org/10.3390/f10090748