Article

Differential Trends of Qinghai Spruce Growth with Elevation in Northwestern China during the Recent Warming Hiatus

1
Research Institute of Forest Ecology, Environment and Protection, Chinese Academy of Forestry, Key Laboratory of Forest Ecology and Environment of the State Forestry Administration of China, Beijing 100091, China
2
State Key Laboratory of Urban and Regional Ecology, Research Center for Eco-Environmental Sciences, Chinese Academy of Sciences, Beijing 100085, China
3
University of Chinese Academy of Sciences, Beijing 100049, China
4
Academy of Water Resource Conservation Forests of Qilian Mountains in Gansu Province, Zhangye 734000, China
*
Author to whom correspondence should be addressed.
Forests 2019, 10(9), 712; https://doi.org/10.3390/f10090712
Submission received: 6 July 2019 / Revised: 10 August 2019 / Accepted: 19 August 2019 / Published: 21 August 2019
(This article belongs to the Section Forest Ecology and Management)

Abstract

:
Tree growth strongly responds to climate change, especially in semiarid mountainous areas. In recent decades, China has experienced dramatic climate warming; however, after 2000 the warming trend substantially slowed (indicative of a warming hiatus) in the semiarid areas of China. The responses of tree growth in respect to elevation during this warming hiatus are poorly understood. Here, we present the responses of Qinghai spruce (Picea crassifolia Kom.) growth to warming using a stand-total sampling strategy along an elevational gradient spanning seven plots in the Qilian Mountains. The results indicate that tree growth experienced a decreasing trend from 1980 to 2000 at all elevations, and the decreasing trend slowed with increasing elevation (i.e., a downward trend from −10.73 mm2 year−1 of the basal area increment (BAI) at 2800 m to −3.48 mm2 year−1 of BAI at 3300 m), with an overall standard deviation (STD) of 2.48 mm2 year−1. However, this trend reversed to an increasing trend after 2000, and the increasing trends at the low (2550–2900 m, 0.27–5.07 mm2 year−1 of BAI, p > 0.23) and middle (3000–3180 m, 2.08–2.46 mm2 year−1 of BAI, p > 0.2) elevations were much weaker than at high elevations (3300 m, 23.56 mm2 year−1 of BAI, p < 0.01). From 2000–2013, the difference in tree growth with elevation was much greater than in other sub-periods, with an overall STD of 7.69 mm2 year−1. The stronger drought conditions caused by dramatic climate warming dominated the decreased tree growth during 1980–2000, and the water deficit in the 2550–3180 m range was stronger than at 3300 m, which explained the serious negative trend in tree growth at low and middle elevations. After 2000, the warming hiatus was accompanied by increases in precipitation, which formed a wetting–warming climate. Although moisture availability was still a dominant limiting factor of tree growth, the relieved drought pressure might be the main reason for the recent recovery in the tree growth at middle and low elevations. Moreover, the increasing temperature significantly promoted tree growth at 3300 m, with a correlation coefficient between the temperature and BAI of 0.77 (p < 0.01). Our results implied that climate change drove different growth patterns at different elevations, which sheds light into forest management under the estimated future climate warming: those trees in low and middle elevations should be paid more attention with respect to maintaining tree growth, while high elevations could be a more suitable habitat for this species.

1. Introduction

Climate exerts a strong influence on tree growth through specific physiological thresholds of temperature and water availability [1]. In recent decades, dramatic warming has occurred around the world [2], most prominently after the 1980s [3]. A series of studies have recognized that climate warming has dramatically altered tree growth [4,5,6,7,8,9], and there is evidence indicating the responses of forest growth to climate warming vary at different elevations [10,11,12,13]. Since 2000, however, the warming trend has substantially slowed, which aligns with the worldwide deceleration in warming known as the global warming hiatus [14,15,16]; thus, the forest growth trends have been altered in semiarid regions [17]. However, how tree growth responds to this warming hiatus at different elevations remains unclear.
Dozens of previous studies have investigated tree growth patterns and their relationships with climate warming in semiarid regions, but a consistent conclusion has not been reached [4,5,6,18,19,20]. Some studies indicate that a warming climate at the regional or global scale is often presumed to be responsible for tree growth declines and mortality [5,6,18,19]. Forests in semiarid areas are subjected to seasonal or episodic drought stress [21,22] and could be particularly sensitive to rapid climate change. Meanwhile, due to the amplified water limitation caused by climate warming, the decline in forest growth might be accelerated [8,19,23]. However, there is some evidence that rising temperature enhances tree growth at some sites where warmth is a prevailing limiting factor [4,12,20]. Therefore, the response of tree growth to climate warming has strong local heterogeneity and could be attributed to different hydrothermal combinations, which are caused by the vertical zonality of climate at different elevations [12].
Many studies have investigated the response of tree growth to climate warming at different elevation gradients in semiarid and arid regions [5,13,24]. There are two main perspectives about tree growth patterns and their relationships with climate factors at high elevations. Some studies have found that tree growth at high elevations is sensitive to temperature [25,26]. Increasing temperatures have been reported to increase tree growth at high elevations [11,13,25]. However, other studies have observed that tree growth at high elevations could be impaired by high temperatures, mostly due to hotter droughts exacerbating water deficits [6,27]. It is generally believed that rapid warming reduces tree growth at low elevations [22,28]. These studies have revealed that tree growth at low elevations could be more sensitive to warming-induced increases in atmospheric moisture demand; thus, these trees more readily suffer from temperature-induced drought. These results are mediated by diverse climate regimes and species-specific traits, and the impact of rapid warming on tree growth could change with elevation or site [6,13,29].
Most relevant works, such as those mentioned above, have focused on the effect of rapid warming on tree growth. However, the global warming trend has slowed since 2000, and the warming hiatus may be tied to equatorial Pacific surface cooling [15]. Additionally, there are reports that indicated this reduction in warming arises through the combined effects of internal decadal variability, volcanic and solar activity, and decadal changes in anthropogenic aerosol forcing [14]. A warming hiatus affects vegetation changes in terrestrial ecosystems [17,30,31]. Ballantyne et al. (2017) found that this warming hiatus may have increased net biome productivity (NBP) globally. Due to the warming hiatus after 2000, terrestrial net ecosystem production of China showed a decadal-scale shift from a downward trend during 1982–2000 to an upward trend during 2000–2010 [31]. In the Qilian mountains, this warming hiatus resumed the trend of increasing tree growth [17]. Whether the tree growth response to warming hiatus shares a similar pattern at different elevation gradients remains unclear. Here, to better understand tree growth at different elevations in response to the warming hiatus, we investigated the impacts of climate change on tree growth in the central Qilian Mountains in Northwest China based on a stand-total sampling strategy along an elevational gradient. The main aim of this study was to evaluate the patterns of tree growth at different elevations under climate warming and warming hiatus climatic conditions. We hypothesized that increased growth of Qinghai spruce (Picea crassifolia Kom.) might occur at all elevations across the whole forest belt during the warming hiatus; however, the increasing tree growth trend at low elevations should be much weaker than that at high elevations because of drought limited tree growth at low elevations.

2. Materials and Methods

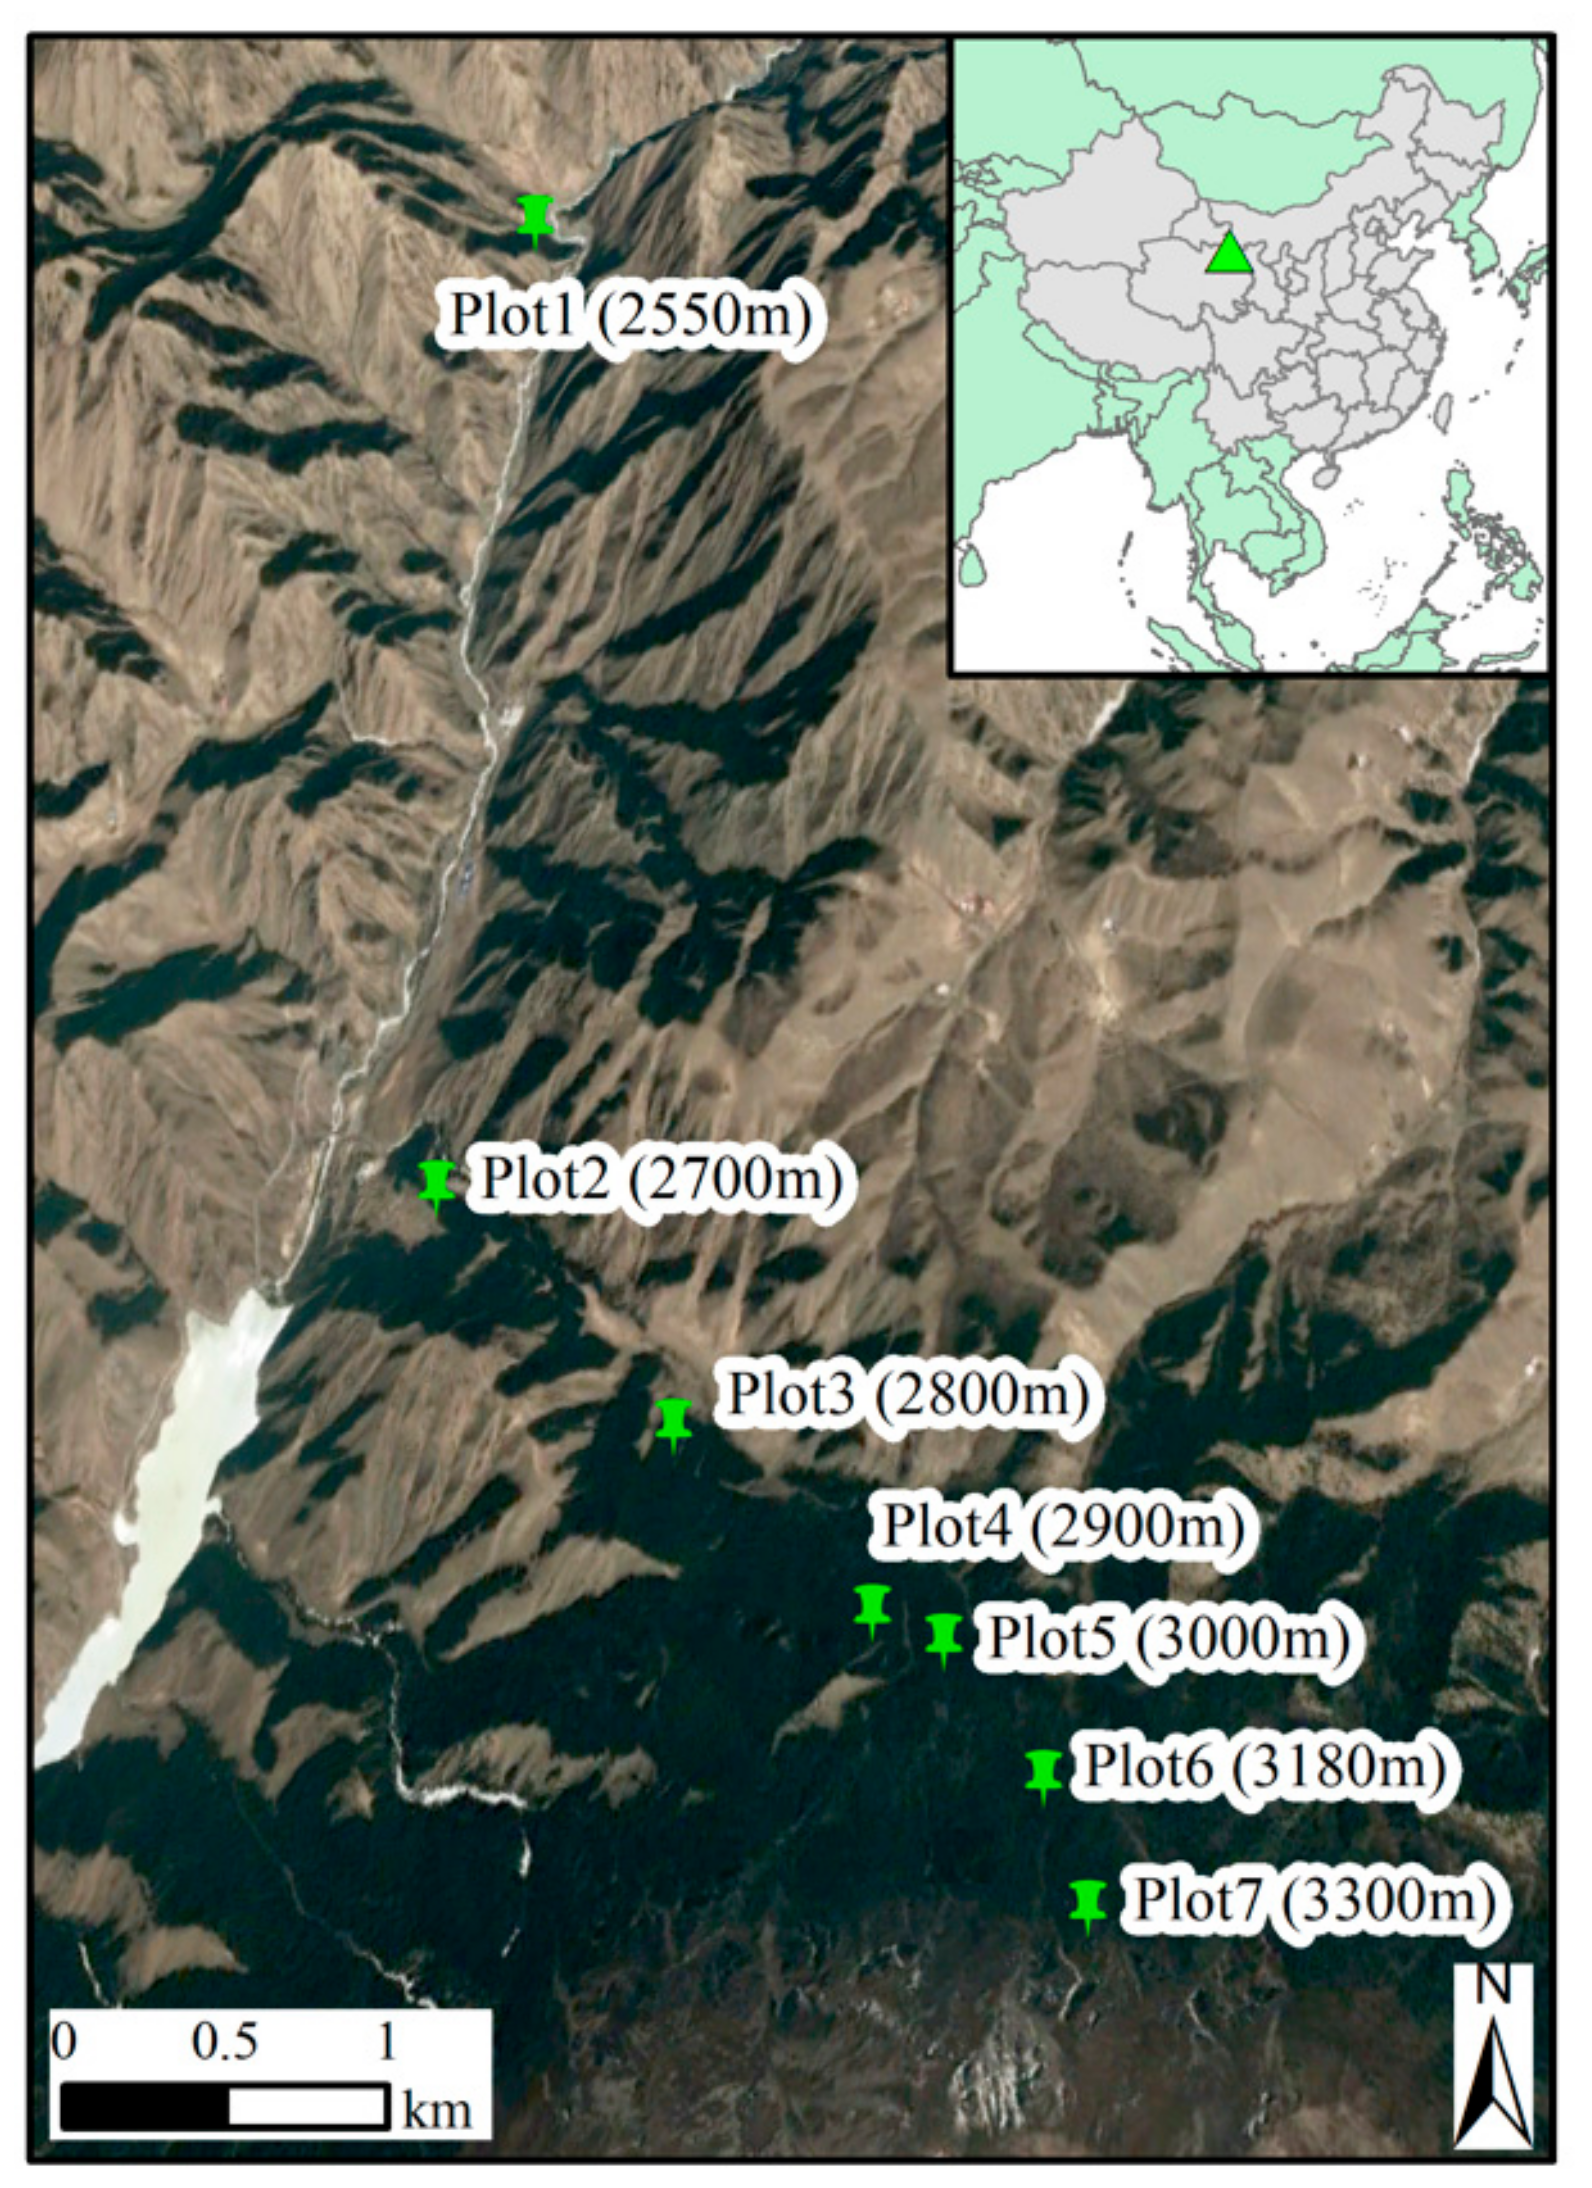
2.1. Study Area and Sampling Plots

The Qilian Mountains in Central Eurasia, located on the Tibetan Plateau, the Loess Plateau and the junction of the Inner Mongolia–Xinjiang deserts, are located on the border between the Qinghai and Gansu provinces of northern China. The study area is in a transition zone between two dominant climate patterns, i.e., the East Asian monsoon and the westerlies. A mix of these two climate patterns occurs in the Heihe River basin in the middle of the Qilian Mountains, where primary Qinghai spruce forests are distributed [32]. For the 1960–2013 period, the mean annual temperature at the study site was 1.1 °C (Figure 2a). The mean annual precipitation was 389.7 mm (Figure 2b). The elevation range is generally 2000–4000 m a.s.l. (Tuanjie Peak, 5826 m a.s.l.) in the Qilian Mountains. Our study area is located in the central Qilian Mountains, Gansu Province (38°22′–38°35′ N, 100°17′–100°19′ E); the highest summit in our study area is 3800 m a.s.l. Qinghai spruce is an indigenous evergreen conifer tree species that dominates most of the cold evergreen coniferous forest belt, vertically ranging from 2600 to 3300 m a.s.l. (including moss-spruce forests, shrub-spruce forests, and meadow-spruce forests along the elevational gradient) in the Qilian Mountains in northwestern China [33]. Qinghai spruce forests are an important agent for soil and water resource conservation in mountainous regions. It is important to understand how the elevation-related Qinghai spruce growth responds to climate to appropriately manage forests, forecast forest dynamics, and manage ecological and social development in this region.
In summer 2014, seven plots 20 m × 20 m in size and without signs of physical damage, were chosen at different elevations across the whole forest belt, vertically ranging from 2550 to 3300 m a.s.l. (Figure 1). The elevation interval between plots was approximately 100 m. The plots at 2550 m and 3300 m were located in the low and alpine tree line ecotones, respectively. All seven plots were located on shaded slopes, with similar slopes of approximately 23–41°.

2.2. Tree-Ring Sampling and Laboratory Treatment

In each plot, two increment cores, one parallel to the slope and another parallel to the contour, were collected from all trees with diameter at breast height (DBH) >5 cm and height >2 m using a 5.15 mm increment borer. The cores were extracted at 1.3 m above the ground. The DBHs and heights were also recorded. Basic information regarding elevation, aspect, slope, canopy density of each plot, density, age and DBH of the trees was also recorded during field work (Table 1).
Cores were air dried and fixed into grooved wooden strips. The samples were sanded with coarse-to-fine grain sandpaper until the tree rings became clearly visible, and then they were measured using a LINTAB semiautomatic measuring device. Ring-width series were measured to an accuracy of 0.01 mm. The quality of all measurement series was then checked using COFECHA software [34]. We discarded series that were not correlated with the entire dataset.
In general, tree-ring series are usually detrended and standardized to remove long-term growth trends and maximize the common climatic signal between trees [35]. However, in this study, we were more interested in the long-term trends of tree growth and unstandardized basal area increment (BAI) was used to display the growth trend of the trees.
Ring width was converted into tree BAI according to the following standard formula:
BAI n = π R n 2 R n 1 2 ,
where Rn and Rn−1 represent the tree radial radius values of year n and year n − 1, respectively [36]. BAIn is the BAI value for year n.

2.3. Climate Data

Climate data (including temperature and precipitation) were obtained from the closest standard meteorological station, with similar elevations to those in our study area: Qilian station (38°6′36″ N, 100°9′ E, 2787.4 m a.s.l.), which is located approximately 50 km south of the study area. The drought indices were determined using the standardized precipitation evapotranspiration index (SPEI), which considers the impacts of both potential evapotranspiration and precipitation [37]. The SPEI datasets were downloaded from the global SPEI database (available at http://sac.csic.es/spei/database.html), and the data analyzed in this study were obtained from a version history of SPEIbase v2.5 at the time scale of 12 months.
Based on the daily weather data, the climate variables, including monthly (over an 18-month window from May of the previous year to October of the current year), seasonal (spring: March–May, summer: June–August, autumn: September–November, and winter: December–February), mean temperature, mean SPEI and summed precipitation of the prior July to the current June (P7–C6) and the current May to August (C5–C8), were calculated from 1960 to 2013.

2.4. Statistical Analysis

In this study, we used middle age class trees (aged between 60 and 120 years, namely, germinated from 1954–1894) to estimate the difference in tree growth between different elevations. We calculated the subsample signal strength (SSS) of each plot to indicate the statistical reliability of the chronology when the SSS reached 85%, indicating that the samples were sufficient for further analysis. The years when the SSS reached 85% differed across the plots, but each plot had a value earlier than 1937.
Simple linear models (ordinary least squares regression equations) were used to model the temporal trends of tree growth. Tree growth trend was the slope of the regression line of the mean BAI chronologies for each plot. When the slope value was positive, it indicated that tree growth increased. The larger the value was, the more significant the increase was. In contrast, when the value was negative, tree growth decreased.
The tree growth-climate relationships were analyzed for the period 1960–2013. Pearson’s correlations between the BAI chronologies and the climate variables (first using seasonal climate data and then monthly data that included mean temperature, precipitation and SPEI) were calculated to examine the main climatic factors affecting Qinghai spruce growth for the common period of 1960–2013. After that, we further analyzed the relationships between the BAI chronologies and main climate factors during the sub-periods 1960–1980, 1980–2000 and 2000–2013 to determine the main climatic factors limiting tree growth.

3. Results

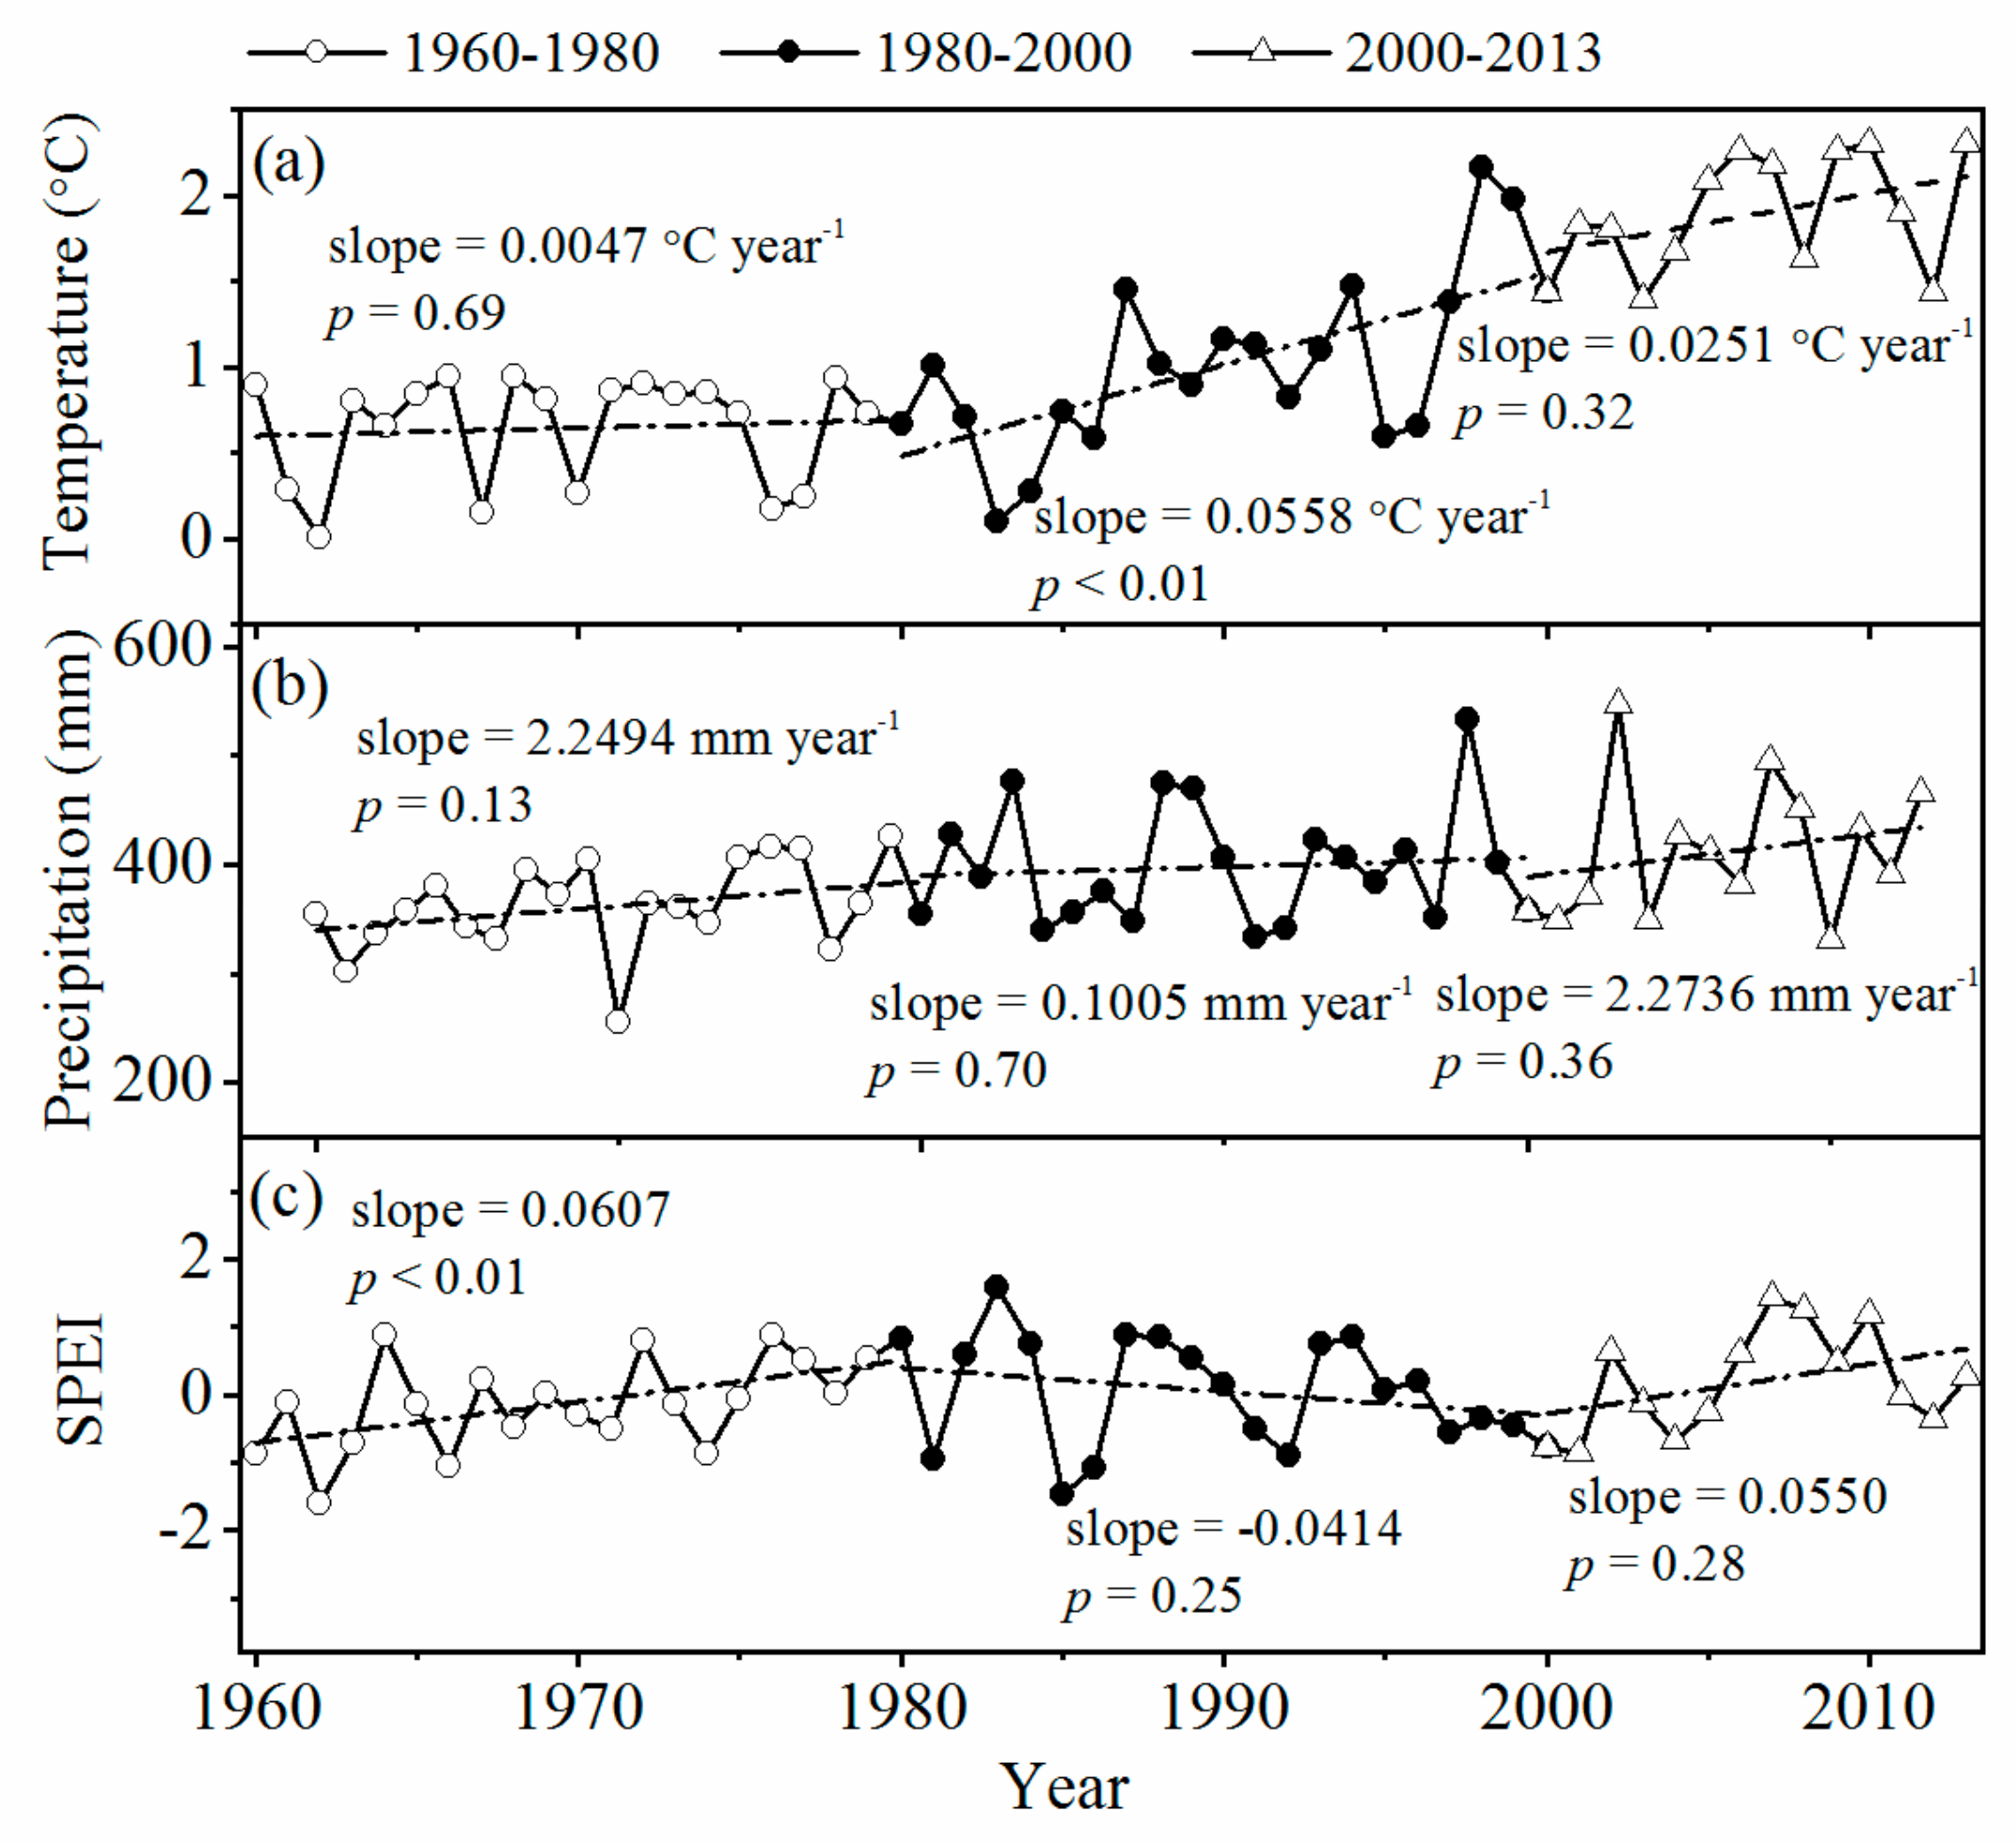
3.1. Climate Ttrends in the Middle Qilian Mountains in Recent Decades

Over the past six decades, a warming trend was observed across the study area (Figure 3a). No significant increasing temperature trends over the period 1960–1980 were observed; however, there were significant increases from 1980–2000, with a rate of 0.056 °C year−1 (p < 0.01). After 2000, the warming trend substantially slowed, as the warming rate declined from 0.056 °C year−1 (p < 0.01) in the period from 1980–2000 to 0.027 °C year−1 (p > 0.05) in the period from 2000–2013, which aligned with the worldwide deceleration in warming known as the global warming hiatus. Additionally, the annual precipitation slightly increased during the periods 1960–1980 and 2000–2013 (Figure 3b), with upward trends of 2.25 mm year−1 and 2.27 mm year−1, respectively. However, from 1980 to 2000, there was nearly no change in precipitation. The interannual variation in the SPEI of the study area from 1960 to 2013 is shown in Figure 3c, which measures drought severity according to its intensity and duration. There was a clear wetting trend from 1960–1980 (p = 0.011), followed by a drying trend from 1980–2000. After 2000, the SPEI exhibited an increasing trend, and the warming hiatus was accompanied by increasing precipitation; furthermore, a wetting trend appeared in this period once again (Figure 2).

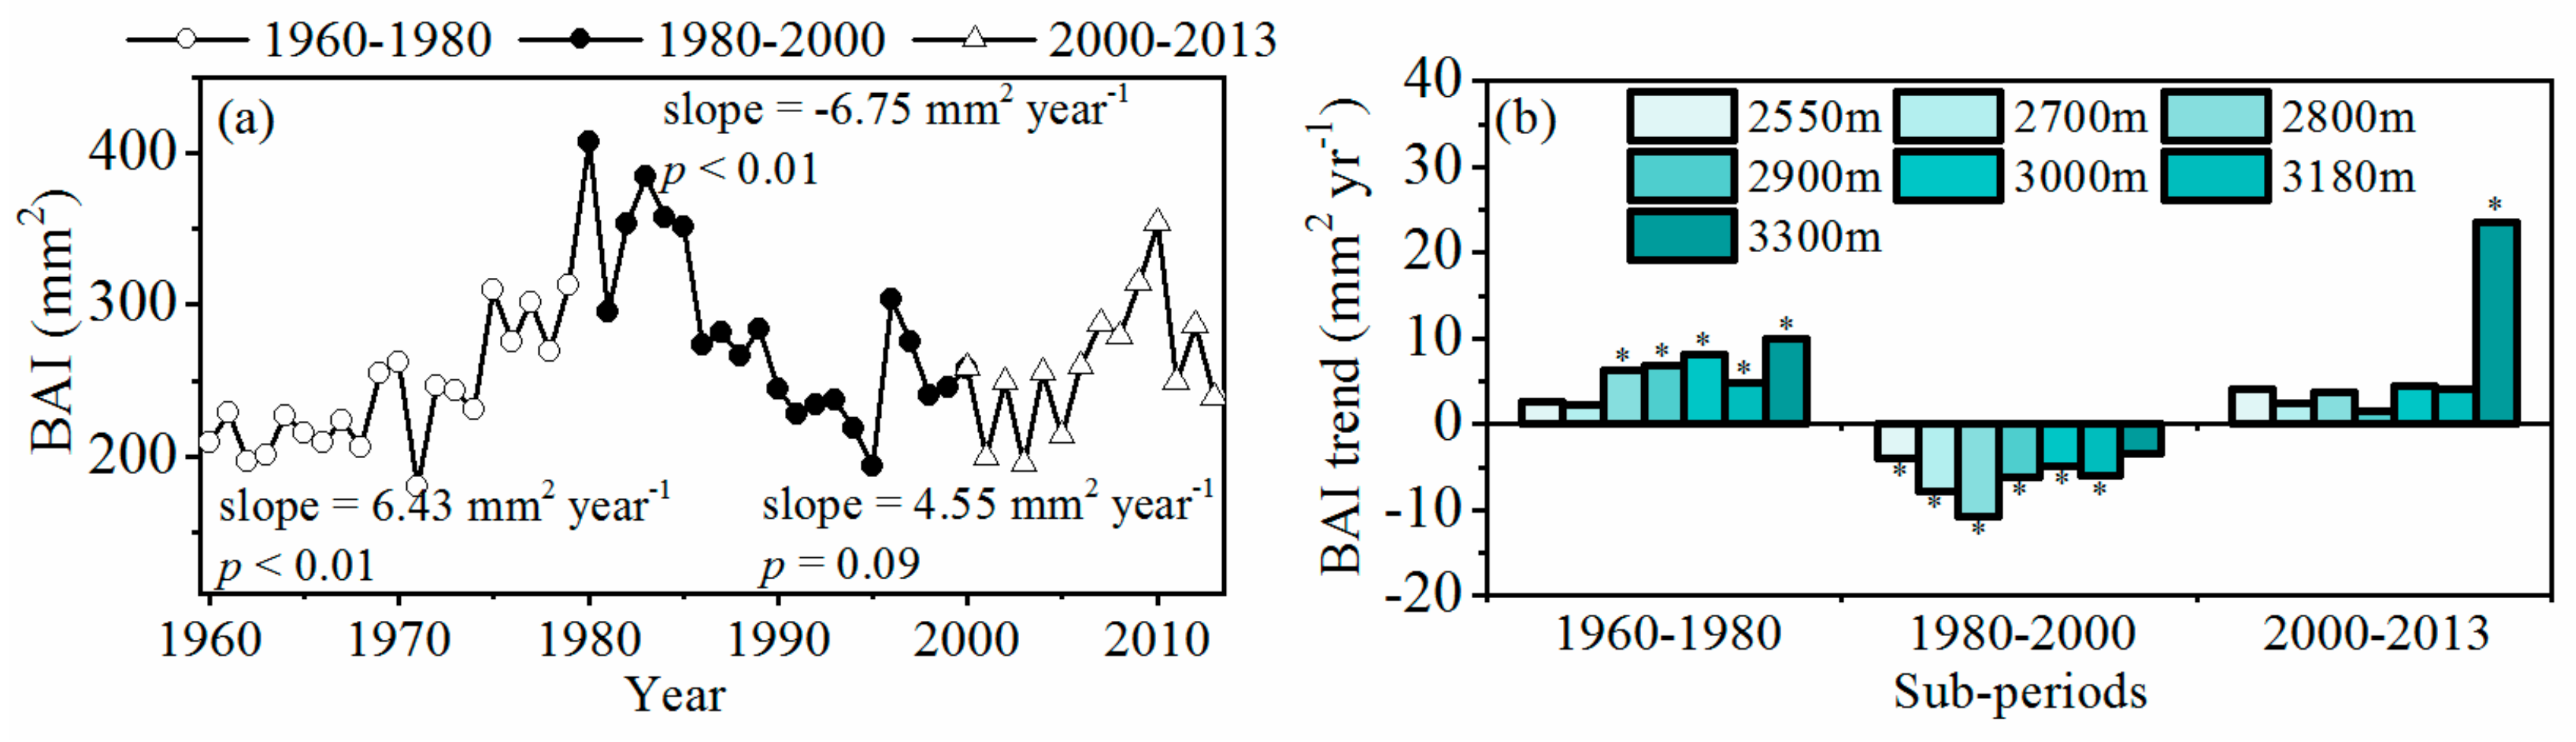
3.2. Patterns of Tree Growth along Elevation

Based on the statistical analysis methods in Section 2.4, the BAI data were statistically reliable for further analysis after 1960. Figure 3a shows that the mean annual BAI of all trees significantly increased during the periods from 1960–1980 (slope = 6.43 mm2 year−1, p < 0.01) and 2000–2013 (slope = 4.55 mm2 year−1, p < 0.1) within the seven plots across the whole forest belt, while those in the period from 1980–2000 showed a remarkable decline (slope = −6.75 mm2 year−1, p < 0.01). For each sub-period, we found significantly different mean BAI temporal trends across different elevations (Figure 3b). For the sub-period from 1960–1980, increased growth trends were consistently observed at all elevations, and the growth trend increased with increasing elevation (uptrend from 2.27 mm2 year−1 in 2700 m to 10.01 mm2 year−1 in 3300 m), with a standard deviation (STD) of 2.82 mm2 year−1. A significant decrease in the growth trend from 1980 to 2000 was detected at elevations from 2550 m to 3180 m, with the decreasing trends all being significant at a level of 0.01; however, there was no significant decrease at the elevation of 3300 m (p > 0.1). In this sub-period, the STD was 2.49 mm2 year−1. For the sub-period from 2000–2013, the BAI exhibited an increasing trend at all elevations, while the trees from 2550 m to 3180 m showed a markedly weaker increasing trend, with an annual rate of increase of 1.60 to 4.43 mm2 (p > 0.1). Additionally, trees at the 3300 m plot showed a significant increasing growth trend, with an annual rate of increase of 23.56 mm2 (p < 0.01). The difference in tree growth trends along elevations in the sub-period from 2000–2013 (STD was 7.69 mm2 year−1) was dramatically greater than those during the sub-periods from 1960–1980 and 1980–2000 (Figure 3b).

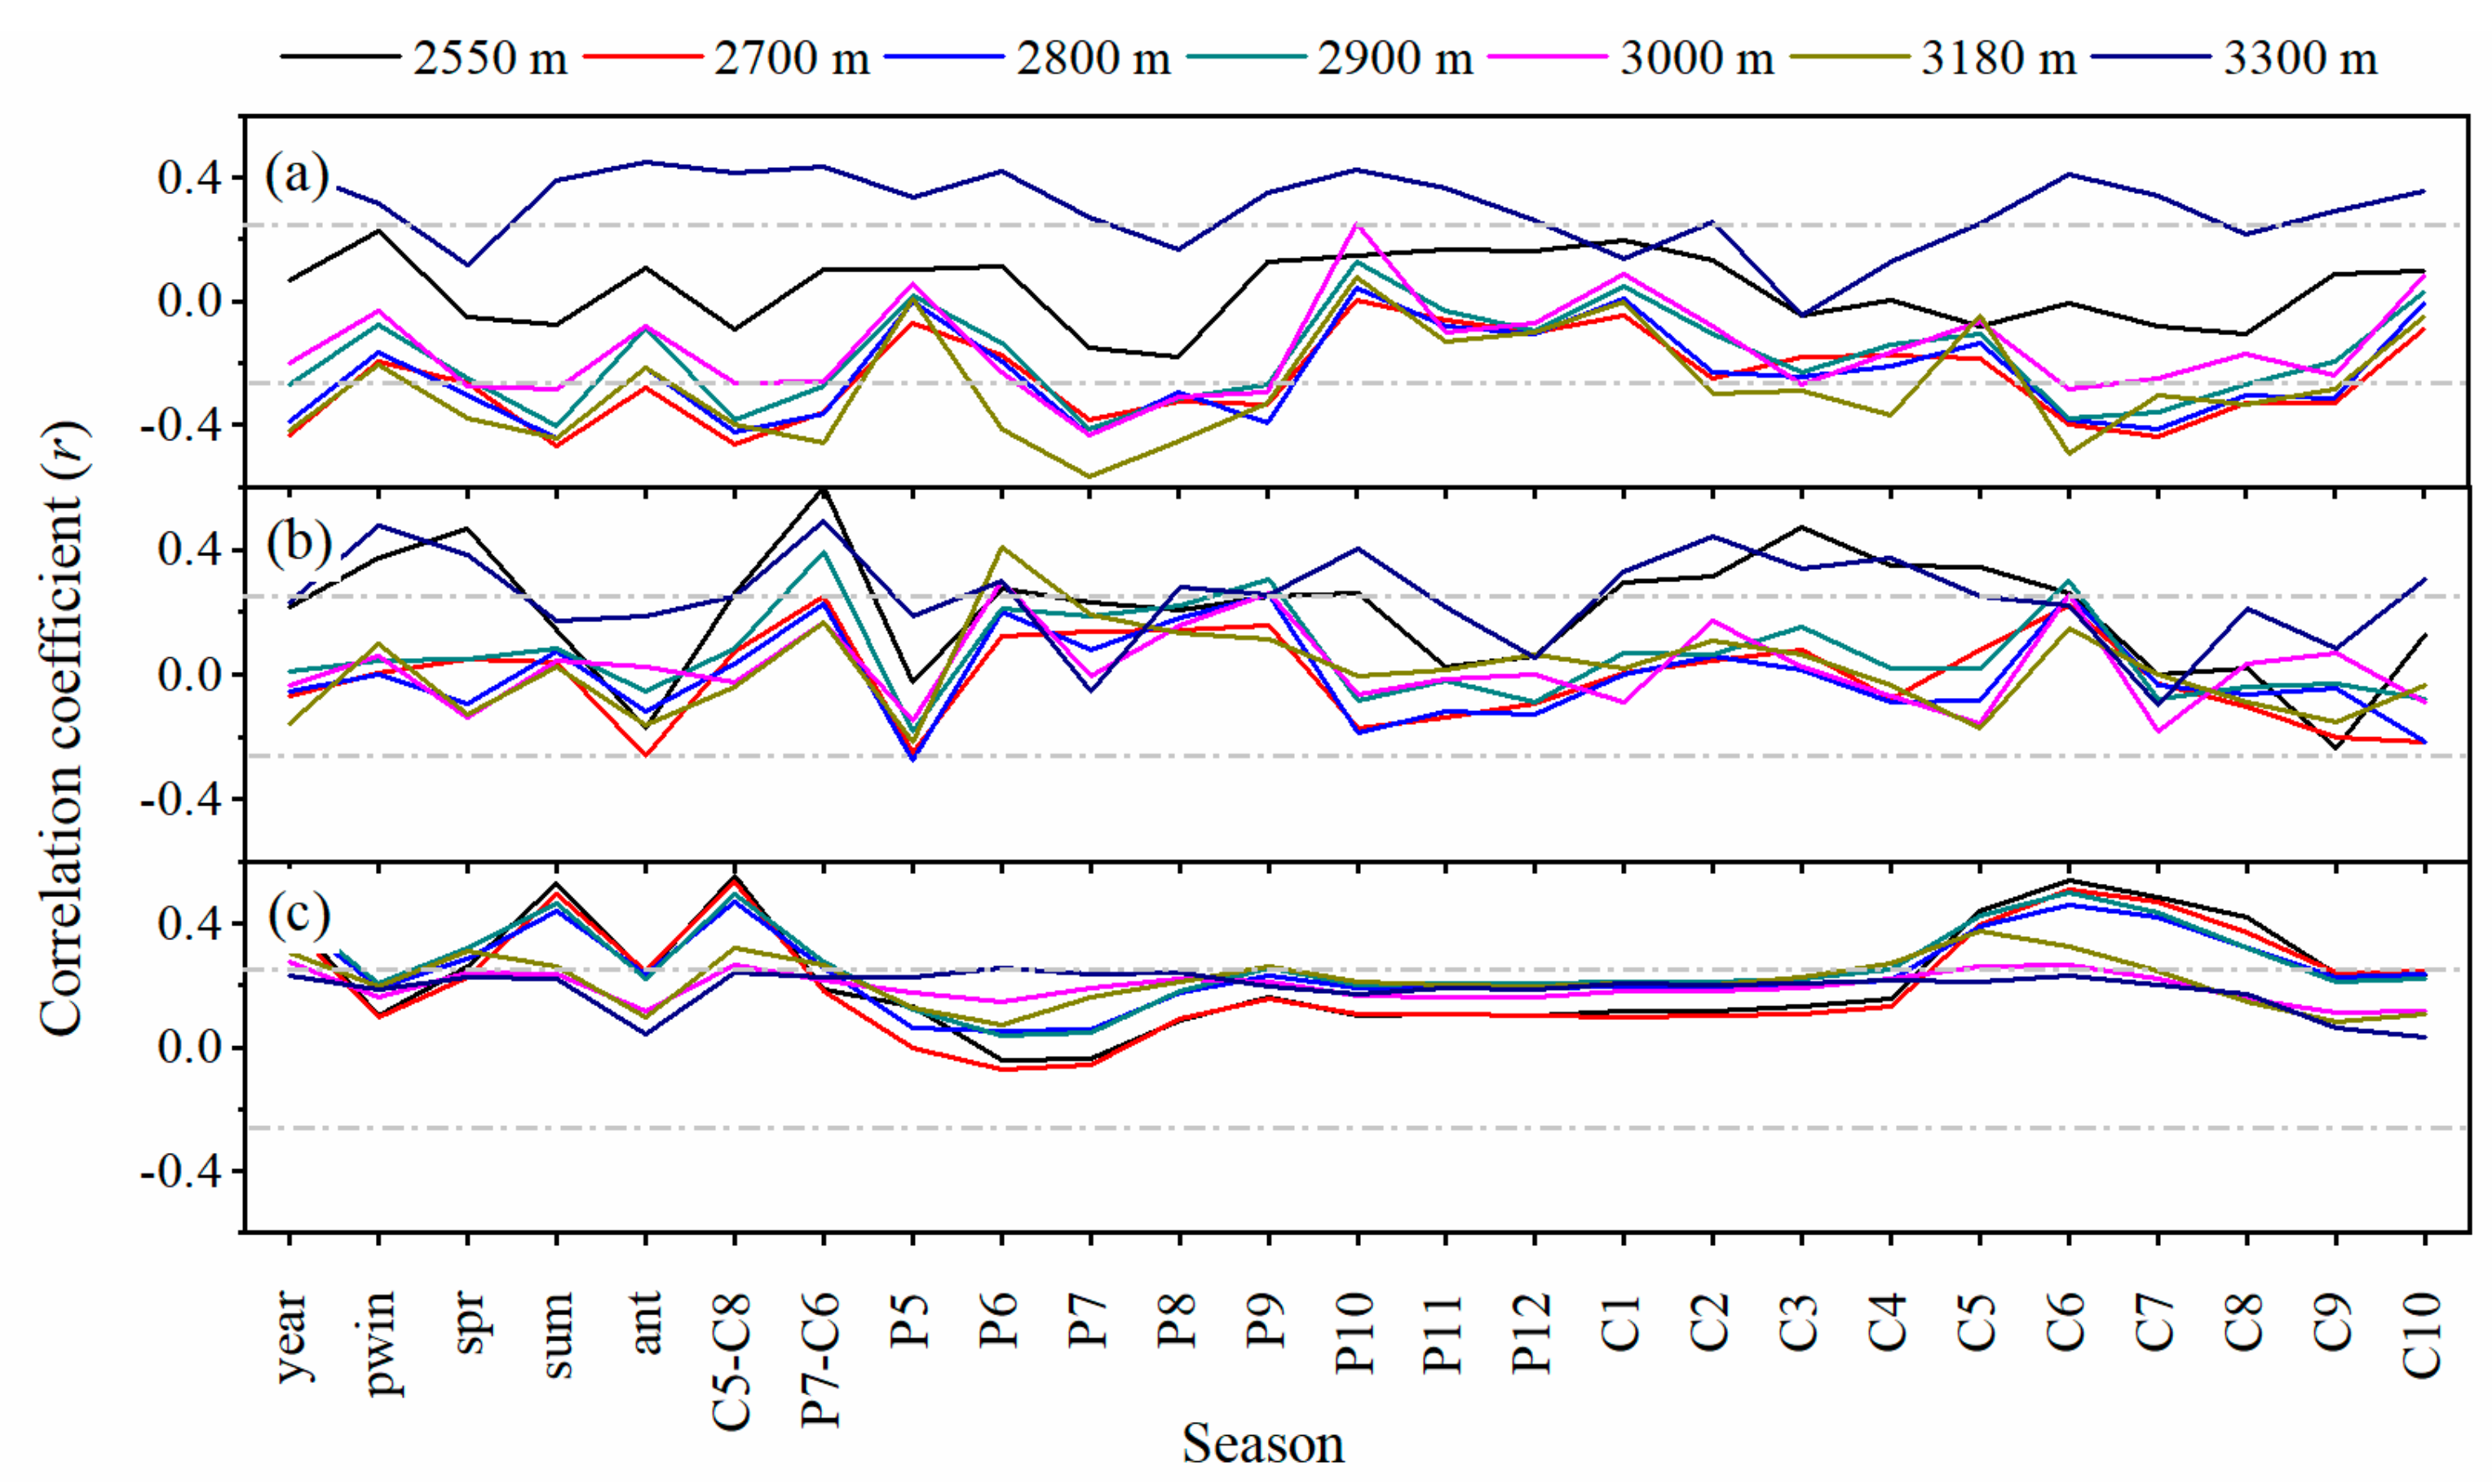
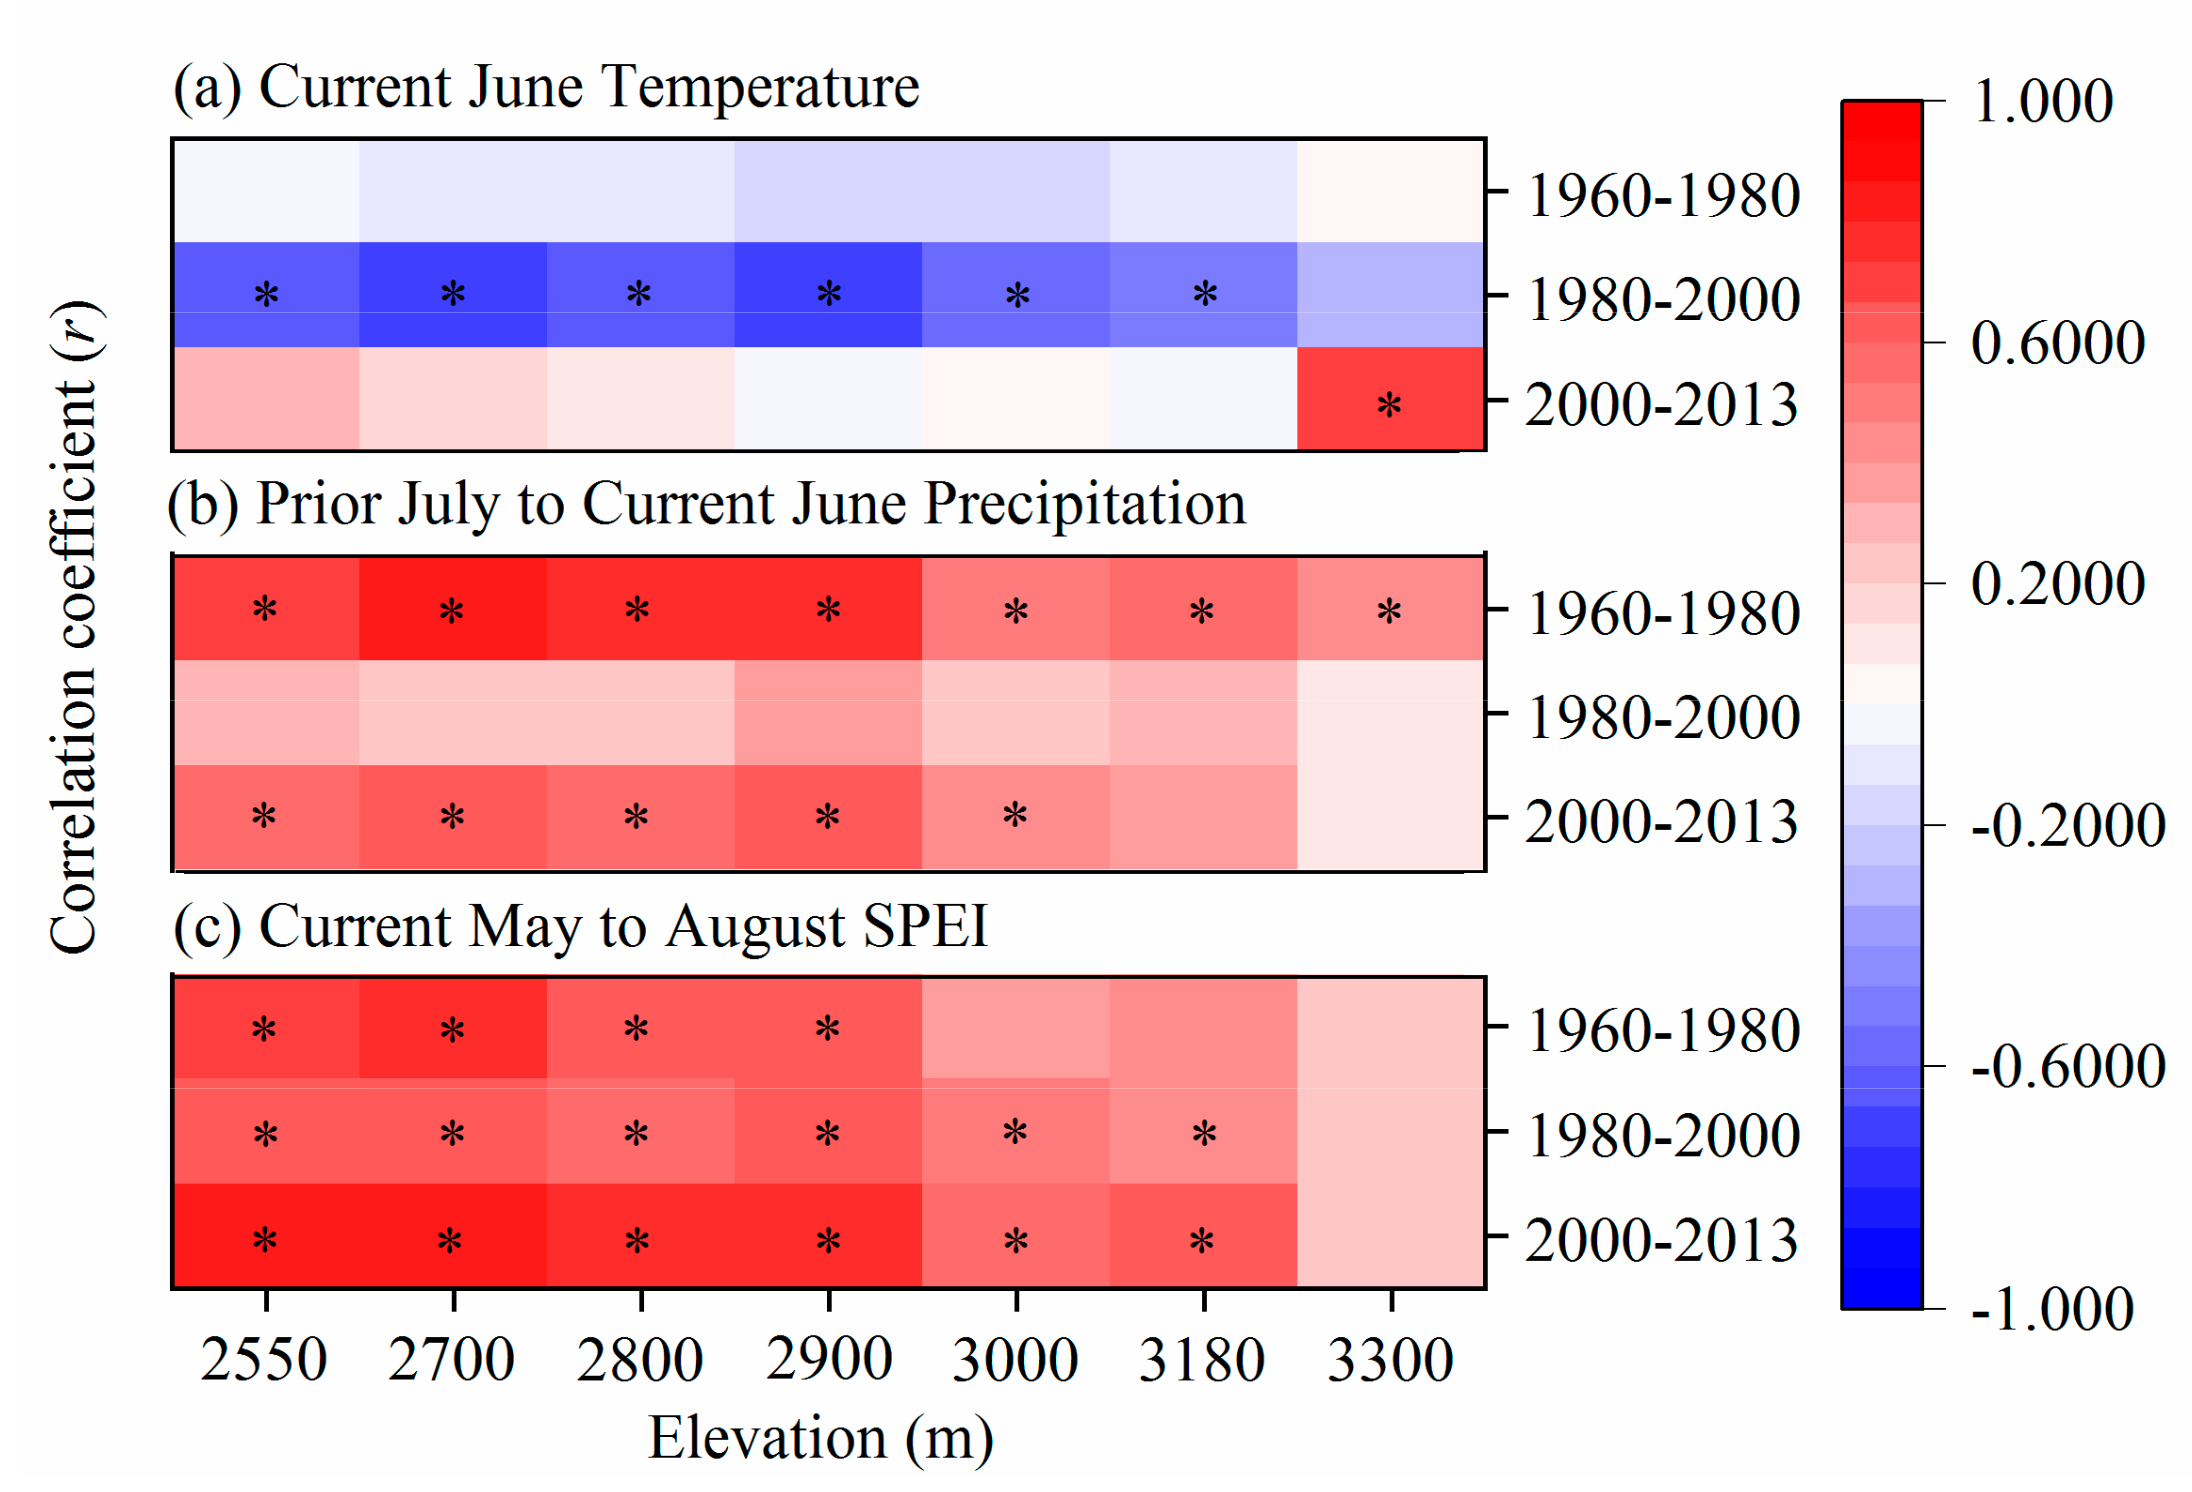
3.3. Growth-Climate Relationships

In our study region, there was a striking change in the correlation patterns over different seasonal and monthly window climates and BAI chronologies across the whole forest belt at the different elevations. The BAI chronologies at 2700 m, 2800 m, 2900 m, 3000 m and 3180 m showed significantly (p < 0.05) negative correlations with temperatures in the previous July and current June (Figure 4a). The chronology at the highest elevation of 3300 m showed a strong positive correlation with temperature. Significant correlations between BAI and temperature were absent at the lowest plot of 2550 m. For the correlation coefficient between the BAI and precipitation, there were only three BAI chronologies (at 2550 m, 2900 m and 3300 m) that were positively correlated with precipitation from the prior July to the current June (Figure 4b). The correlations between the BAI chronologies and SPEI levels showed that there were differences across elevations. The BAI chronologies in the low-elevations plots (2550 m, 2700 m, 2800 m, 2900 m) showed strong positive correlations with the SPEI; however, markedly weakened and mostly positive correlations were observed in the high-elevation plots (3000 m, 3180 m, 3300 m). A significant positive correlation was found in the summer months between May and August (Figure 4c). This result indicates that the temperature in the current June, the precipitation from July in the previous year to June in the current year and the current May to August SPEI were the main climate variables that drove the tree growth trend changes.

3.4. Impacts of Main Climate Factor Changes on Elevation-Related Tree Growth

There were three sub-periods with significantly different correlations between the BAI chronologies and main climate factors. In particular, the correlation coefficient (r) between the BAI chronologies and temperature were conspicuously different in each sub-period. For the period from 1960–1980, the negative relationships between BAI chronologies and temperature were not significant (p > 0.05); however, positive, but not significant (p > 0.05), correlations were observed in the period from 2000–2013. Furthermore, the correlations between the BAI chronologies and temperature were significantly negative in the period from 1980–2000 (p < 0.05), except for that at the 3300 m elevation (Figure 5a). Meanwhile, the BAI chronologies were positively correlated with precipitation for all three sub-periods (Figure 5b), while those relationships were weakest in the period from 1980–2000 (p > 0.05) and remarkably different in the periods from 1960–1980 (p < 0.05) and 2000–2013 (p < 0.05). Regarding the correlation between the BAI chronologies and the current May to August SPEI (Figure 5c), the BAI chronologies were mostly significantly and positively correlated with the current May to August SPEI (p < 0.05) in each sub-period. On the other hand, the climate–growth relationships varied along the elevations. In each sub-period, the correlation coefficients between the BAI chronologies and main climate factors (i.e., SPEI, temperature and precipitation) all showed a downward trend with increasing elevation, except for the correlation coefficient between the BAI chronologies and temperature at 3300 m in the period from 2000–2013, which showed a significant positive trend (r = 0.715, p < 0.01).
Overall, during the period from 1980–2000, warming temperatures were found in this study area but were not accompanied by increases in precipitation, suggesting that there were hotter droughts in this period (Figure 2); therefore, tree growth was limited by hotter drought conditions during that period. After 2000, with the warming hiatus and increasing precipitation, the climate became wetter again (Figure 2), and the hotter drought restrictions on tree growth were alleviated. Meanwhile, tree growth in the high-elevation plots (especially at 3300 m) was unconstrained by hotter droughts (Figure 5a), and warm temperatures prominently stimulated tree growth at an elevation of 3300 m during the period from 2000–2013.

4. Discussion

4.1. The Role of Climate Change on the Three Sub-Periods of Tree Growth

Tree growth experienced a decreasing trend from 1980 to 2000 across the whole forest belt in the range of 2550–3300 m, but this decreasing trend shifted to an increasing trend after 2000. The remarkable decline in tree growth could not be the result of senescence because related studies have shown that Qinghai spruce should keep growing fast before they enter into the senescence stage at an age of approximately 120–140 years [38]. There is no evidence of negative BAI trends in healthy trees with stable climate, except for in the scenarios of tree senescence and impending death [39,40]. Dendrochronology studies have also shown that the BAI of healthy trees exhibited an increasing trend for multiple decades after reaching an asymptotic level [18,41]. The Qinghai spruce trees in our study area were mainly dominated by young and middle-aged forests, and the ages of trees used in this study were less than 120 years old as of 2013. This means that the tree growth data in this study are not from older trees, and the BAI should theoretically show a continuous increasing trend. Thus, the declining BAI trend after 1980 was not due to tree age.
In this study, there were not any forest structure changes, such as in tree density, or any human disturbances in recent decades in the sample plots. Thus, any BAI change trends should be due to climate change, which further produces a variety of stresses on tree growth, including water deficit and drought [19,21,42]. Related studies have found that Qinghai spruce growth was most sensitive to limited moisture conditions and tree growth and growth cessations were controlled by moisture availability [10,43,44,45].
The rapid warming in recent decades, which was accompanied by an increase in drought stress, impaired tree growth [22,46]. The effects of warming-induced drought stress on tree growth have been observed in Korean pine (Pinus koraiensis Sieb. et Zucc), European beech (Fagus sylvatica L.), Scots pine (Pinus sylvestris L.), Norway spruce (Picea abies (L.) Karst.), trembling aspen (Populus tremuloides Michx.), and Qinghai spruce [9,29,44,47,48]. Our results that show a declining trend of Qinghai spruce from 1980–2000 also prove this. The warming-induced drought was caused by the increase in potential evapotranspiration after warming, which led to enhanced soil water loss. As such, this change resulted in a decreased tree growth rate due to this warming-induced drought. After 2000, however, the warming trend substantially slowed, which aligns with the worldwide deceleration in warming, known as the global warming hiatus [14,15,16]. In our study area, the warming hiatus, combined with the increased precipitation, formed a wetter climate that relieved the drought stress [17]. Warming could also prolong the length of the growing season [12,29]. Therefore, tree growth benefited from a longer growing season and a wetter climate, which allowed the tree growth to increase after 2000. Gao et al. (2018) also observed an increasing growth trend of Qinghai spruce trees in the Qilian Mountains.

4.2. Variation in the Growth–Climate Relationship along Elevations

In this study, different numbers of cores that ranging from eight to 122 at different elevations were used, which depended on uneven stand densities at research plots (Table 1). However, this difference did not have a strong effect on the tree growth trend comparisons in the 1960–2013 period, as the same cores were used for the whole 1960–2013 analysis period, and the mean tree BAI for each plot was calculated to analyze the tree growth trends.
During the period from 1960–1980, increased growth trends were consistently observed at all elevations (Figure 3b), and the tree growth trend differences among the elevations were small (with a standard deviation of 2.82 mm2 year−1). However, after 2000, the tree growth trend at the 3300 m plot rapidly increased, while the trees at the 2550 m to 3180 m elevations showed markedly weaker increasing trends. The main reason for this result was that the 3300 m plot had relatively lower evapotranspiration than the 2550–3180 m plots; therefore, these trees suffered from less temperature-induced drought. Meanwhile, the increasing temperature significantly promoted tree growth at 3300 m. To a certain extent, lower stand density at the 3300 m plot also played some role in mitigating the effects of warming-induced drought and was favorable for tree growth. In general, the impacts of warming on tree growth varied along the elevations.
It was clearly shown that forest densities at the 2550–3180 m elevations were much greater than the density at the 3300 m elevation (Table 1), which might help explain the high growth rate of individual trees at the 3300 m elevation. Plant interactions can regulate plant communities, and this role can be altered by abiotic stress [49,50]. With increasing climate stress, the role of competition is decreased [51]. In our study region, the trees at low and middle elevations suffered from more competition than those at the high elevation. Moreover, forests in the low and middle elevations were confined by more drought stress, i.e., climate stress in the low and middle elevations was harsher than at the high elevation. Therefore, competition plays an even weaker role when forests suffer from climate change.
The rapid warming during the period from 1980–2000 significantly decreased tree growth at all elevation plots, except the 3300 m plot (p = 0.16), and the tree growth trend decreased gradually with elevation. Tree growth at the lower and middle elevations showed decreasing trends, as demonstrated by many previous studies [5,11,13,47]. For example, in Northeast China, Zhu et al. (2018) found that the growth of Yezo spruce trees (Picea jezoensis (Siebold & Zucc.) Carrière) at low elevations showed a declining trend after 1980; but this species showed increased tree growth at high elevation plots. However, in the Qilian Mountains, tree growth at different elevations had similar growth patterns [10,44]. As shown in this study, at all elevation plots, tree growth showed a decreasing trend during the rapid warming period of 1980–2000, but comparatively, tree growth at the highest elevation plot (3300 m) had a decreasing trend that was much slower than those at the lower and middle elevations.
The growth trends of the Qinghai spruce trees at different elevation plots were consistent with the growth–climate relationships. During the period from 1980–2000, trees at the lower elevations (2550–2900 m) showed a similar response to the main climate variations as those trees in the middle elevations (3000–3180 m). They showed a comparably remarkable correlation between the BAI chronologies and the current May to August SPEI and temperature in June, although the correlations at the 3000–3180 m elevations were weaker than at the 2550–2900 m elevations. However, tree growth rate at the high elevation (3300 m) was not significantly correlated with climate variations. This result suggests that the SPEI and temperature played major roles in the tree growth surge in this period, especially in the lower and central forest areas. Tree growth was sensitive to increased temperature in arid and semiarid areas [22,52] and warming was considered a potential driver of drought [8]. The SPEI considers the impacts of both potential evapotranspiration induced by temperature and precipitation [37]. In this study, SPEI was used as an index to describe drought intensity and air temperature was the index used to describe warming. In the period of 1980−2000, warming, i.e., temperature increase, but without precipitation increase caused a smaller SPEI and was expected to exacerbate drought for the whole forest belt on the Qilian Mountains. The lower and middle elevations suffered from relatively high potential evapotranspiration [53,54], which might have been impaired by temperature-induced water deficits [43,44,45]. Therefore, the decreasing tree growth trends in these areas were greater than those at the highest elevation plot.
The warming hiatus was found to have a greater contribution to tree growth at high elevations, such as in the Altay-Sayan region of Siberia [55]. In our study, after 2000, the tree growth trend also increased. The tree growth trend from 2550 m to 3180 m (p > 0.19) was much weaker than that at 3300 m (slope = 23.6 mm2 year−1, p < 0.01). Correlations between the BAI chronologies at the different elevation plots and drought index showed negative effect of drought on tree growth, except for the 3300 m plot, supporting the hypothesis that moisture availability played a key role in the tree growth trends. However, the significantly positive correlations with temperature at the 3300 m plot supported the hypothesis that temperature played a major role in tree growth at that elevation. This result means that temperature was the critical factor at 3300 m rather than moisture under the wetter climate formed by the warming hiatus in the 2000s. However, for the low and middle elevations, moisture was still the critical factor.
Tree growth plasticity enables trees to grow slowly during periods with poor growing conditions; however, when the conditions improve, increased tree growth resumes [56]. Plants exhibit resistance to external stress through morphological and physiological changes that improve their adaptability to environmental stress [57,58]. The stress resistance generated by plants enables them to resume growth when the external pressure is within the adaptive threshold range. Thus, once a temperature-induced drought has been alleviated, increased tree growth can resume. However, the temperatures were still high even though the rapid warming slowed. For the 2550–3180 m plots, where evapotranspiration was higher, moisture availability was still a dominant factor limiting tree growth. With relatively lower evapotranspiration compared with that of the 2550–3180 m trees, the 3300 m plot had a higher growth trend. On the other hand, dozens of previous studies have determined that high elevation tree growth benefits from higher temperatures [12,20]; additionally, when there is sufficient moisture to support growth, the growing season becomes longer. Therefore, the increasing tree growth trend at the 2550–3180 m elevations was much weaker than that at 3300 m.

4.3. The Implications for Forest Management

Researchers and climate institutions have now declared the warming hiatus to be ‘over’ [16], and rapid warming will recover and intensify; thus, Qinghai spruce at the low and middle forest belt elevations may suffer from increased water deficit, and tree growth may decline or trees may die. Qinghai spruce is an important agent for soil and water resource conservation in mountainous regions. Therefore, it is important to maintain tree growth, especially in trees at low and middle elevations, which could be relieved of drought stress by reducing stand density appropriately to maintain tree growth. Meanwhile, Qinghai spruce at higher elevations may experience accelerated growth, and climatic warming trends may promote an upward shift in the alpine tree lines [59], so higher elevations are more conducive to the transplantation and survival of this species.

5. Conclusions

In this study, tree growth of Qinghai spruce and the climate–growth relationships in the Qilian Mountains were analyzed from 1960 to 2013 based on tree-ring data collected from seven different elevation plots. The main conclusions are summarized as follows: Tree growth showed three sub-periods where the trends changed at the forest belt level, namely, tree growth showed increasing trends during the periods from 1960–1980 (slope = 6.43 mm2 year−1, p < 0.01) and 2000–2013 (slope = 4.55 mm2 year−1, p = 0.09) and significant declines in the period from 1980–2000 (slope = −6.75 mm2 year−1, p < 0.01), which were mainly driven by changes in moisture availability. These shifting tree growth trends were associated with climate condition changes as well as with hotter droughts in the study area. Due to the varying climatic factors, BAI trends were significantly different across different elevations, especially after 2000, when tree growth trends at the low and middle elevations of the forest belt were much slower than at the high elevation. In this period, moisture availability was still a dominant limiting factor of tree growth at the lower elevations and central forest areas, but temperature was significantly positively correlated with tree growth at 3300 m, suggesting that temperature-enhanced tree growth and prolonged growing seasons benefited tree growth at higher elevations. Our results suggest that climate change drove contrasting growth patterns among the vertical distribution belt ranging from 2550 to 3300 m in elevation. So, it is important that elevation-dependent management strategies be developed to maintain sustainable forests in the study region under estimated future climate change.

Author Contributions

Formal analysis, B.W.; investigation, B.W., L.Z., Y.Y. and S.W.; writing—original draft, B.W.; writing—review & editing, B.W., P.Y. and Y.W.

Funding

This work was financially supported by the National Natural Science Foundation of China (NSFC 91425301, 91225302).

Acknowledgments

We thank the sampling staff of the Academy of Water Resource Conservation Forests of Qilian Mountains in Gansu Province for their assistance in the field, Zhongen Niu for his computer programing assistance, and Ashley A. Webb for further polishing the English language in this manuscript.

Conflicts of Interest

The authors declare no conflict of interest.

References

  1. Andreu, L.; Gutierrez, E.; Macias, M.; Ribas, M.; Bosch, O.; Camarero, J.J. Climate increases regional tree-growth variability in Iberian pine forests. Glob. Chang. Biol. 2007, 13, 804–815. [Google Scholar] [CrossRef]
  2. IPCC. Climate Change 2014: Mitigation of Climate Change. Contribution of Working Group III to the Fifth Assessment Report of the Intergovernmental Panel on Climate Change; Edenhofer, O., Pichs-Madruga, R., Sokona, Y., Farahani, E., Kadner, S., Seyboth, K., Adler, A., Baum, I., Brunner, S., Eickemeier, P., et al., Eds.; Cambridge University Press: Cambridge, UK; New York, NY, USA, 2014. [Google Scholar]
  3. Consortium, P.K. Continental-scale temperature variability during the past two millennia. Nat. Geosci. 2015, 8, 981–982. [Google Scholar] [CrossRef]
  4. Gou, X.H.; Chen, F.H.; Jacoby, G.; Cook, E.; Yang, M.X.; Peng, H.F.; Zhang, Y. Rapid tree growth with respect to the last 400 years in response to climate warming, northeastern Tibetan Plateau. Int. J. Climatol. 2007, 27, 1497–1503. [Google Scholar] [CrossRef]
  5. Jump, A.S.; Hunt, J.M.; Penuelas, J. Rapid climate change-related growth decline at the southern range edge of Fagus sylvatica. Glob. Chang. Biol. 2006, 12, 2163–2174. [Google Scholar] [CrossRef]
  6. Wilmking, M.; Juday, G.P.; Barber, V.A.; Zald, H.S.J. Recent climate warming forces contrasting growth responses of white spruce at treeline in Alaska through temperature thresholds. Glob. Chang. Biol. 2004, 10, 1724–1736. [Google Scholar] [CrossRef]
  7. Pasho, E.; Toromani, E.; Alla, A.Q. Climatic impact on tree-ring widths in Abies borisii-regis forests from South-East Albania. Dendrochronologia 2014, 32, 237–244. [Google Scholar] [CrossRef]
  8. Williams, A.P.; Allen, C.D.; Macalady, A.K.; Griffin, D.; Woodhouse, C.A.; Meko, D.M.; Swetnam, T.W.; Rauscher, S.A.; Seager, R.; Grissino-Mayer, H.D.; et al. Temperature as a potent driver of regional forest drought stress and tree mortality. Nat. Clim. Chang. 2013, 3, 292–297. [Google Scholar] [CrossRef]
  9. Wang, X.C.; Pederson, N.; Chen, Z.J.; Lawton, K.; Zhu, C.; Han, S.J. Recent rising temperatures drive younger and southern Korean pine growth decline. Sci. Total Environ. 2019, 649, 1105–1116. [Google Scholar] [CrossRef] [PubMed]
  10. Gao, L.L.; Gou, X.H.; Deng, Y.; Yang, M.X.; Zhang, F. Assessing the influences of tree species, elevation and climate on tree-ring growth in the Qilian Mountains of northwest China. Trees Struct. Funct. 2017, 31, 393–404. [Google Scholar] [CrossRef]
  11. Zhang, W.T.; Jiang, Y.; Dong, M.Y.; Kang, M.Y.; Yang, H.C. Relationship between the radial growth of Picea meyeri and climate along elevations of the Luyashan Mountain in North-Central China. For. Ecol. Manag. 2012, 265, 142–149. [Google Scholar] [CrossRef]
  12. Qi, Z.; Liu, H.; Wu, X.; Hao, Q. Climate-driven speedup of alpine treeline forest growth in the Tianshan Mountains, Northwestern China. Glob. Chang. Biol. 2015, 21, 816–826. [Google Scholar] [CrossRef] [PubMed]
  13. Zhu, L.J.; Cooper, D.J.; Yang, J.W.; Zhang, X.; Wang, X.C. Rapid warming induces the contrasting growth of Yezo spruce (Picea jezoensis var. microsperma) at two elevation gradient sites of northeast China. Dendrochronologia 2018, 50, 52–63. [Google Scholar] [CrossRef]
  14. Fyfe, J.C.; Meehl, G.A.; England, M.H.; Mann, M.E.; Santer, B.D.; Flato, G.M.; Hawkins, E.; Gillett, N.P.; Xie, S.P.; Kosaka, Y.; et al. Making sense of the early-2000s warming slowdown. Nat. Clim. Chang. 2016, 6, 224–228. [Google Scholar] [CrossRef] [Green Version]
  15. Kosaka, Y.; Xie, S.P. Recent global-warming hiatus tied to equatorial Pacific surface cooling. Nature 2013, 501, 403. [Google Scholar] [CrossRef] [PubMed]
  16. Xie, S.P.; Kosaka, Y. What Caused the Global Surface Warming Hiatus of 1998–2013? Curr. Clim. Chang. Rep. 2017, 3, 128–140. [Google Scholar] [CrossRef]
  17. Gao, L.L.; Gou, X.H.; Deng, Y.; Wang, Z.Q.; Gu, F.; Wang, F. Increased growth of Qinghai spruce in northwestern China during the recent warming hiatus. Agric. For. Meteorol. 2018, 260, 9–16. [Google Scholar] [CrossRef]
  18. Piovesan, G.; Biondi, F.; Di Filippo, A.; Alessandrini, A.; Maugeri, M. Drought-driven growth reduction in old beech (Fagus sylvatica L.) forests of the central Apennines, Italy. Glob. Chang. Biol. 2008, 14, 1265–1281. [Google Scholar] [CrossRef]
  19. Peng, C.H.; Ma, Z.H.; Lei, X.D.; Zhu, Q.; Chen, H.; Wang, W.F.; Liu, S.R.; Li, W.Z.; Fang, X.Q.; Zhou, X.L. A drought-induced pervasive increase in tree mortality across Canada’s boreal forests. Nat. Clim. Chang. 2011, 1, 467–471. [Google Scholar] [CrossRef]
  20. Pretzsch, H.; Biber, P.; Schutze, G.; Uhl, E.; Rotzer, T. Forest stand growth dynamics in Central Europe have accelerated since 1870. Nat. Commun. 2014, 5, 10. [Google Scholar] [CrossRef] [PubMed]
  21. Allen, C.D.; Macalady, A.K.; Chenchouni, H.; Bachelet, D.; McDowell, N.; Vennetier, M.; Kitzberger, T.; Rigling, A.; Breshears, D.D.; Hogg, E.H.; et al. A global overview of drought and heat-induced tree mortality reveals emerging climate change risks for forests. For. Ecol. Manag. 2010, 259, 660–684. [Google Scholar] [CrossRef] [Green Version]
  22. Liu, H.Y.; Williams, A.P.; Allen, C.D.; Guo, D.L.; Wu, X.C.; Anenkhonov, O.A.; Liang, E.Y.; Sandanov, D.V.; Yin, Y.; Qi, Z.H.; et al. Rapid warming accelerates tree growth decline in semi-arid forests of Inner Asia. Glob. Chang. Biol. 2013, 19, 2500–2510. [Google Scholar] [CrossRef]
  23. Adams, H.D.; Barron-Gafford, G.A.; Minor, R.L.; Gardea, A.A.; Bentley, L.P.; Law, D.J.; Breshears, D.D.; McDowell, N.G.; Huxman, T.E. Temperature response surfaces for mortality risk of tree species with future drought. Environ. Res. Lett. 2017, 12, 10. [Google Scholar] [CrossRef]
  24. Carroll, C.J.W.; Martin, P.H.; Knapp, A.K.; Ocheltree, T.W. Temperature induced shifts in leaf water relations and growth efficiency indicate climate change may limit aspen growth in the Colorado Rockies. Environ. Exp. Bot. 2019, 159, 132–137. [Google Scholar] [CrossRef]
  25. Salzer, M.W.; Hughes, M.K.; Bunn, A.G.; Kipfmueller, K.F. Recent unprecedented tree-ring growth in bristlecone pine at the highest elevations and possible causes. Proc. Natl. Acad. Sci. USA 2009, 106, 20348–20353. [Google Scholar] [CrossRef] [PubMed] [Green Version]
  26. Smith, W.K.; Germino, M.J.; Johnson, D.M.; Reinhardt, K. The Altitude of Alpine Treeline: A Bellwether of Climate Change Effects. Bot. Rev. 2009, 75, 163–190. [Google Scholar] [CrossRef]
  27. Yang, B.; He, M.H.; Melvin, T.M.; Zhao, Y.; Briffa, K.R. Climate Control on Tree Growth at the Upper and Lower Treelines: A Case Study in the Qilian Mountains, Tibetan Plateau. PLoS ONE 2013, 8, 12. [Google Scholar] [CrossRef]
  28. Barber, V.A.; Juday, G.P.; Finney, B.P. Reduced growth of Alaskan white spruce in the twentieth century from temperature-induced drought stress. Nature 2000, 405, 668–673. [Google Scholar] [CrossRef]
  29. Sidor, C.G.; Popa, I.; Vlad, R.; Cherubini, P. Different tree-ring responses of Norway spruce to air temperature across an altitudinal gradient in the Eastern Carpathians (Romania). Trees Struct. Funct. 2015, 29, 985–997. [Google Scholar] [CrossRef]
  30. Ballantyne, A.S.W.; Anderegg, W.; Kauppi, P.; Sarmiento, J.; Tans, P.; Shevliakova, E.; Pan, Y.; Poulter, B.; Anav, A.; Friedlingstein, P.; et al. Accelerating net terrestrial carbon uptake during the warming hiatus due to reduced respiration. Nat. Clim. Chang. 2017, 7, 148–152. [Google Scholar] [CrossRef]
  31. He, H.; Wang, S.; Zhang, L.; Wang, J.; Ren, X.; Zhou, L.; Piao, S.; Yan, H.; Ju, W.; Gu, F.; et al. Altered trends in carbon uptake in China’s terrestrial ecosystems under the enhanced summer monsoon and warming hiatus. Natl. Sci. Rev. 2019, 6, 505–514. [Google Scholar] [CrossRef]
  32. Li, D.L.; Liu, X.H. Climate in Gansu; China Meteorological Press: Beijing, China, 2000. [Google Scholar]
  33. Wang, J.Y.; Chang, X.X.; Ge, S.L.; Miao, Y.X.; Chang, Z.Q.; Hu, Z. Vertical Distribution of the Vegetation and Water and Heat Conditions of Qilian Mountain (Northern Slope). J. Northwest For. Coll. 2001, 16, 1–3. [Google Scholar]
  34. Holmes, R.L. Computer-assisted quality control in tree-ring dating and measurement. Tree-Ring Bull. 1983, 43, 69–75. [Google Scholar]
  35. Cook, R.E.; Briffa, K.R.; Shiyatov, S.G.; Mazepa, V.S. Tree-ring standardization and growth-trend estimation. In Methods of Dendrochronology: Applications in the Environmental Science; Springer: Amsterdam, The Netherlands, 1990; Volume 1990, pp. 104–123. [Google Scholar]
  36. Monserud, R.A.; Sterba, H. A basal area increment model for individual trees growing in even- and uneven-aged forest stands in Austria. For. Ecol. Manag. 1996, 80, 57–80. [Google Scholar] [CrossRef]
  37. Vicente-Serrano, S.M.; Begueria, S.; Lopez-Moreno, J.I. A Multiscalar Drought Index Sensitive to Global Warming: The Standardized Precipitation Evapotranspiration Index. J. Clim. 2010, 23, 1696–1718. [Google Scholar] [CrossRef] [Green Version]
  38. Liu, X. Qinghai Spruce; Lanzhou University Press: Lanzhou, China, 1992; Volume 1992, pp. 48–54. [Google Scholar]
  39. Leblanc, D.C. Red spruce decline on whiteface mountain, New-York 1. relationships with elevation, tree age, and competition. Can. J. For. Res. Rev. Can. Res. For. 1990, 20, 1408–1414. [Google Scholar] [CrossRef]
  40. Dittmar, C.; Zech, W.; Elling, W. Growth variations of Common beech (Fagus sylvatica L.) under different climatic and environmental conditions in Europe-A dendroecological study. For. Ecol. Manag. 2003, 173, 63–78. [Google Scholar] [CrossRef]
  41. Choi, J.; Lorimer, C.G.; Vanderwerker, J.; Cole, W.G.; Martin, G.L. A crown model for simulating long-term stand and gap dynamics in northern hardwood forests. For. Ecol. Manag. 2001, 152, 235–258. [Google Scholar] [CrossRef]
  42. Chen, L.; Huang, J.G.; Alam, S.A.; Zhai, L.H.; Dawson, A.; Stadt, K.J.; Comeau, P.G. Drought causes reduced growth of trembling aspen in western Canada. Glob. Chang. Biol. 2017, 23, 2887–2902. [Google Scholar] [CrossRef] [PubMed]
  43. Liang, E.; Shao, X.M.; Eckstein, D.; Liu, X.H. Spatial variability of tree growth along a latitudinal transect in the Qilian Mountains, northeastern Tibetan Plateau. Can. J. For. Res. Rev. Can. Res. For. 2010, 40, 200–211. [Google Scholar] [CrossRef]
  44. Liang, E.; Leuschner, C.; Dulamsuren, C.; Wagner, B.; Hauck, M. Global warming-related tree growth decline and mortality on the north-eastern Tibetan plateau. Clim. Chang. 2016, 134, 163–176. [Google Scholar] [CrossRef]
  45. Zhao, S.D.; Jiang, Y.; Dong, M.Y.; Xu, H.; Manzanedo, R.D.; Pederson, N. Early monsoon failure and mid-summer dryness induces growth cessation of lower range margin Picea crassifolia. Trees Struct. Funct. 2018, 32, 1401–1413. [Google Scholar] [CrossRef]
  46. Wu, X.C.; Liu, H.Y.; Wang, Y.F.; Deng, M.H. Prolonged limitation of tree growth due to warmer spring in semi-arid mountain forests of Tianshan, northwest China. Environ. Res. Lett. 2013, 8, 9. [Google Scholar] [CrossRef]
  47. Sanchez-Salguero, R.; Camarero, J.J.; Hevia, A.; Madrigal-Gonzalez, J.; Linares, J.C.; Ballesteros-Canovas, J.A.; Sanchez-Miranda, A.; Alfaro-Sanchez, R.; Sanguesa-Barreda, G.; Galvan, J.D.; et al. What drives growth of Scots pine in continental Mediterranean climates: Drought, low temperatures or both? Agric. For. Meteorol. 2015, 206, 151–162. [Google Scholar] [CrossRef] [Green Version]
  48. Yu, L.; Huang, L.; Shao, X.M.; Xiao, F.J.; Wilmking, M.; Zhang, Y.X. Warming-Induced Decline of Picea crassifolia Growth in the Qilian Mountains in Recent Decades. PLoS ONE 2015, 10, 13. [Google Scholar] [CrossRef]
  49. Littell, J.S.; Peterson, D.L.; Tjoelker, M. Douglas-fir growth in mountain ecosystems: Water limits tree growth from stand to region. Ecol. Monogr. 2008, 78, 349–368. [Google Scholar] [CrossRef]
  50. Kunstler, G.; Albert, C.H.; Courbaud, B.; Lavergne, S.; Thuiller, W.; Vieilledent, G.; Zimmermann, N.E.; Coomes, D.A. Effects of competition on tree radial-growth vary in importance but not in intensity along climatic gradients. J. Ecol. 2011, 99, 300–312. [Google Scholar] [CrossRef]
  51. Pedersen, B.S. The role of stress in the mortality of midwestern oaks s indicated by growth prior to death. Ecology 1998, 79, 79–83. [Google Scholar] [CrossRef]
  52. Lutz, D.A.; Shugart, H.H.; Ershov, D.V.; Shuman, J.K.; Isaev, A.S. Boreal forest sensitivity to increased temperatures at multiple successional stages. Ann. For. Sci. 2013, 70, 299–308. [Google Scholar] [CrossRef] [Green Version]
  53. Chang, X.X.; Zhao, W.Z.; He, Z.B. Radial pattern of sap flow and response to microclimate and soil moisture in Qinghai spruce (Picea crassifolia) in the upper Heihe River Basin of arid northwestern China. Agric. For. Meteorol. 2014, 187, 14–21. [Google Scholar] [CrossRef]
  54. Tian, F.X.; Zhao, C.Y.; Feng, Z.D. Simulating evapotranspiration of Qinghai spruce (Picea crassifolia) forest in the Qilian Mountains, northwestern China. J. Arid Environ. 2011, 75, 648–655. [Google Scholar] [CrossRef]
  55. Kharuk, V.I.; Im, S.T.; Petrov, I.A. Warming hiatus and evergreen conifers in Altay-Sayan Region, Siberia. J. Mt. Sci. 2018, 15, 2579–2589. [Google Scholar] [CrossRef]
  56. Brubaker, L.B. Responses of tree poputations to climatic-change. Vegetatio 1986, 67, 119–130. [Google Scholar] [CrossRef]
  57. Gray, S.B.; Brady, S.M. Plant Developmental Responses to Climate Change. Dev. Biol. 2016, 419, 64–77. [Google Scholar] [CrossRef] [PubMed]
  58. Zhu, J. Abiotic Stress Signaling and Responses in Plants. Cell 2016, 167, 313–324. [Google Scholar] [CrossRef] [PubMed] [Green Version]
  59. Liang, E.Y.; Wang, Y.F.; Piao, S.L.; Lu, X.M.; Camarero, J.J.; Zhu, H.F.; Zhu, L.P.; Ellison, A.M.; Ciais, P.; Penuelas, J. Species interactions slow warming-induced upward shifts of treelines on the Tibetan Plateau. Proc. Natl. Acad. Sci. USA 2016, 113, 4380–4385. [Google Scholar] [CrossRef] [Green Version]
Figure 1. Remote sensing image (from Google Earth) of the study area showing the sampling plot locations.
Forests 10 00712 g001
Figure 2. The (a) annual mean temperature; (b) total annual precipitation and (c) standardized precipitation evapotranspiration index (SPEI) at a 12-month scale over the period from 1960–2013.
Forests 10 00712 g002
Figure 3. The temporal variation in the basal area increment (BAI) from 1960 to 2013. (a) The mean BAI for all plots; (b) the mean BAI of one plot across different elevations. The stars indicate significant correlations (p < 0.05).
Forests 10 00712 g003
Figure 4. Correlations between BAI chronology and (a) mean temperature, (b) total precipitation and (c) SPEI over different seasonal and monthly windows. The dotted lines indicate a significant correlation (p < 0.05). P indicates the climate variables of the previous year; C indicates the climate variables of the current year.
Forests 10 00712 g004
Figure 5. Correlation coefficients between the BAI chronologies and main climate factors that significantly influence tree growth. A star indicates a significant correlation (p < 0.05). (a) Temperature in current June; (b) precipitation from July of the previous year to June of the current year and (c) the current May to August SPEI.
Forests 10 00712 g005
Table 1. Summary information for the Qinghai spruce sample plots.
PlotsElevation (m a.s.l.)Aspect (°)Slope (°)Canopy DensityStand Density (Trees/ha)Age (Years)DBH (cm)Number of Cores Analyzed
P12550NE12410.55137564 (31–129)11.6 (5.9–27.2)26
P22700NE45330.75162568 (45–115)12.3 (5.6–24.8)59
P32800NE7230.85302566 (39–116)14.1 (6.6–29.5)122
P42900NE24320.90272565 (33–109)12.7 (5.5–31.9)107
P53000NW7230.75212558 (30–102)12.6 (5.5–31.9)48
P63180NE25320.55825113 (30–197)28.9 (6.3–39.1)22
P73300NE32350.2030080 (41–169)15.1 (5.3–35.2)8
Note: Mean values for age and DBH are followed by the range in parentheses. DBH and age did not differ significantly among plots (Kruskal–Wallis test, p > 0.05).

