Article

Growth of Abies sachalinensis Along an Urban Gradient Affected by Environmental Pollution in Sapporo, Japan

1
Forest Growth and Yield Science, School of Life Sciences, Weihenstephan, Technical University of Munich, Hans-Carl-von-Carlowitz-Platz 2, 85354 Freising, Germany
2
Graduate School of Agriculture, Hokkaido University, Sapporo 060-8589, Japan
*
Author to whom correspondence should be addressed.
Present address: Urban and Regional Ecology, Research Center for Eco-Environmental Science, Beijing 100085, China and University of Chinese Academy of Sciences, Beijing 100049, China.
Forests 2019, 10(8), 707; https://doi.org/10.3390/f10080707
Submission received: 22 June 2019 / Revised: 29 July 2019 / Accepted: 16 August 2019 / Published: 20 August 2019
(This article belongs to the Special Issue Growth and Ecosystem Services of Urban Trees)

Abstract

:
Urban tree growth is often affected by reduced water availability, higher temperatures, small and compacted planting pits, as well as high nutrient and pollution inputs. Despite these hindering growth conditions, recent studies found a surprisingly better growth of urban trees compared to trees at rural sites, and an enhanced growth of trees in recent times. We compared urban versus rural growing Sakhalin fir (Abies sachalinensis (F. Schmidt) Mast.) trees in Sapporo, northern Japan and analyzed the growth differences between growing sites and the effects of environmental pollution (NO2, NOX, SO2 and OX) on tree growth. Tree growth was assessed by a dendrochronological study across a gradient from urban to rural sites and related to high detailed environmental pollution data with mixed model approaches and regression analyses. A higher growth of urban trees compared to rural trees was found, along with an overall accelerated growth rate of A. sachalinensis trees over time. Moreover, environmental pollution seems to positively affect tree growth, though with the exception of oxides OX which had strong negative correlations with growth. In conclusion, higher temperatures, changed soil nutrient status, higher risks of water-logging, increased oxide concentrations, as well as higher age negatively affected the growth of rural trees. The future growth of urban A. sachalinensis will provide more insights as to whether the results were induced by environmental pollution and climate or biased on a higher age of rural trees. Nevertheless, the results clearly indicate that environmental pollution, especially in terms of NO2 and NOX poses no threat to urban tree growth in Sapporo.

1. Introduction

The effects of air pollution and climate change on tree growth have been discussed ambiguously over the past decades. While several studies clearly link tree and forest damage with sensitivity to air and environmental pollution [1,2,3,4,5,6], some studies also named unfavorable climatic conditions with limited soil water availability [4,7], aggravated soil compaction, nutrient imbalances [8,9], and pests and disease infestation, as well as management errors as reasons for tree growth decline in forests [1,3,10,11]. On the other hand, several studies [12,13,14,15,16] found opposing positive effects of climate change conditions and increased environmental pollution on tree growth in forests. Presumed causes for the improved growth are higher nitrogen depositions, higher temperatures and higher CO2-concentrations, together with a longer growing season and changes in forest management [12,17]. However, limited water availability might counteract these positive effects of climate change, shorten the growing season due to early leaf shed and reduce growth of trees [18]. Such contrasting findings have even been reported for single tree species. For example, Piovesan, et al. [19] found for Fagus sylvatica L. stands in Italy, a basal area increment (BAI) decrease of 15%–20% [19], while Pretzsch, Biber, Schütze, Uhl and Rötzer [16] reported a 30% increase of volume growth in Central Europe [16].
In contrast to forested sites, the effects of environmental pollution and climate on urban tree growth are less well understood. Several studies state a detrimental effect of environmental pollution on urban tree growth, phenology and vitality [20,21,22,23,24]. Studies reported changes in leaf anatomy and morphology, injury and reduced photosynthesis caused by heavy environmental pollution [24,25,26,27,28]. Kozlowski [29] stated foliar injury, higher mortality, reduced growth and yield, a reduction in shoot–produced compounds (carbohydrates) and stress to trees as the effects of environmental pollution [29]. Further, the impacts of climate change with warmer temperatures, higher maximum temperatures and less precipitation in summer will induce more stress on urban trees, possibly decreasing vitality and growth of less adapted species, and increase the risks of pests and disease. Therefore, the combined effect of environmental pollution and climate change’s implications on trees should be regarded together [12]. The effects of environmental pollution and climate change on tree growth and vitality are highly important for urban trees, since the urban environment is overall a stressful, tough growing site for trees compared to forest sites [30]. This is due to conditions such as compacted, small planting pits, with reduced water and nutrient availability [31], root space [32] and aeration of root systems [33], as well as high temperatures [34] and mechanical injuries [35]. Additional negative influences, such as environmental pollution due to anthropogenic emissions might decrease growth and vitality to the limit of their sustainability [36]. Environmental pollution can weaken trees and open the door for insect infestations and pests [25,29]. Pollution is one of the major problems in urban environments for human health but also for tree vitality [36,37].
With an increasing urbanity along a gradient from the rural surroundings of a city to the inner-city centers, a reduced growth and vitality of trees might be expected due to the conditions outlined above. Surprisingly, the worldwide study of Pretzsch, Biber, Uhl, Dahlhausen, Schütze, Perkins, Rötzer, Caldentey, Koike, van Con, du Toit, Foster and Lefer [17], comparing rural and urban tree growth in several climate zones, found an enhanced growth of urban trees compared to the trees growing at the outskirts of many cities [17,38]. In that study, a total of 1383 urban trees were dendrochronologically sampled in ten metropolises worldwide, covering hemi to boreal (Sapporo, Japan; Prince George, Canada), temperate (Paris, France; Munich and Berlin, Germany), Mediterranean (Cape Town, South Africa; Santiago de Chile, Chile), and subtropical (Hanoi, Vietnam; Houston, MO, USA; Brisbane, Australia) climatic conditions [39,40]. The sampled trees of a defined species per city were selected from the city center to the suburban and rural areas and in all four primary directions from the city center. Dating back more than 100 years, the tree ring chronologies reflect the effect of global climate change and the urban heat island on urban tree growth worldwide. The study showed an increased growth rate of urban trees since the 1960s [17]. Moreover, across all cities and across the entire time span, urban trees grew more rapidly than those in the rural surroundings. This effect was most pronounced in the boreal climate zone. That was explained by higher temperatures and extended growing seasons in cities, as well as with increased CO2-concentrations [17] similar to the study of Bytnerowicz, Omasa and Paoletti [12]. The urban heat island preempts the climate influence in general, but is most pronounced in the boreal climate [17]. In almost all investigated cities, except those in a temperate climate, the negative effects of the urban environment (e.g., reduction of photosynthesis by biogenic volatile organic compounds (BVOCs), fine dust and drought stress) are overcompensated by its benefits, such as an elongated growing period or fertilization due to emissions [15,41,42].
However, Guardans [2] found an increased climate change sensitivity of European beech and Norway spruce forest stands in boreal areas compared to other climatic zones, due to temperature and water stress, though reduced impacts of environmental pollution [2]. These contrasting results raise the question of how climate change and environmental pollution changes affect the growth of a coniferous urban tree species growing in the boreal climate zone. This study focuses on the growth of urban and rural A. sachalinensis MAST. trees in Sapporo, northern Japan, and the effects of urbanization, climate change and environmental pollution. This town rapidly increased its population from about one to two million in the past five decades. The growth of urban and rural trees was assessed by dendrochronology and related to climate and environmental pollution. The following research questions were stated:
  • What was the growth of A. sachalinensis in the past decades in the urban and rural areas of Sapporo, northern Japan?
  • Are the growth trends of A. sachalinensis similar to worldwide trends of urban tree growth?
  • Can differences in the growth of A. sachalinensis be found regarding the sampling sites?

2. Materials and Methods

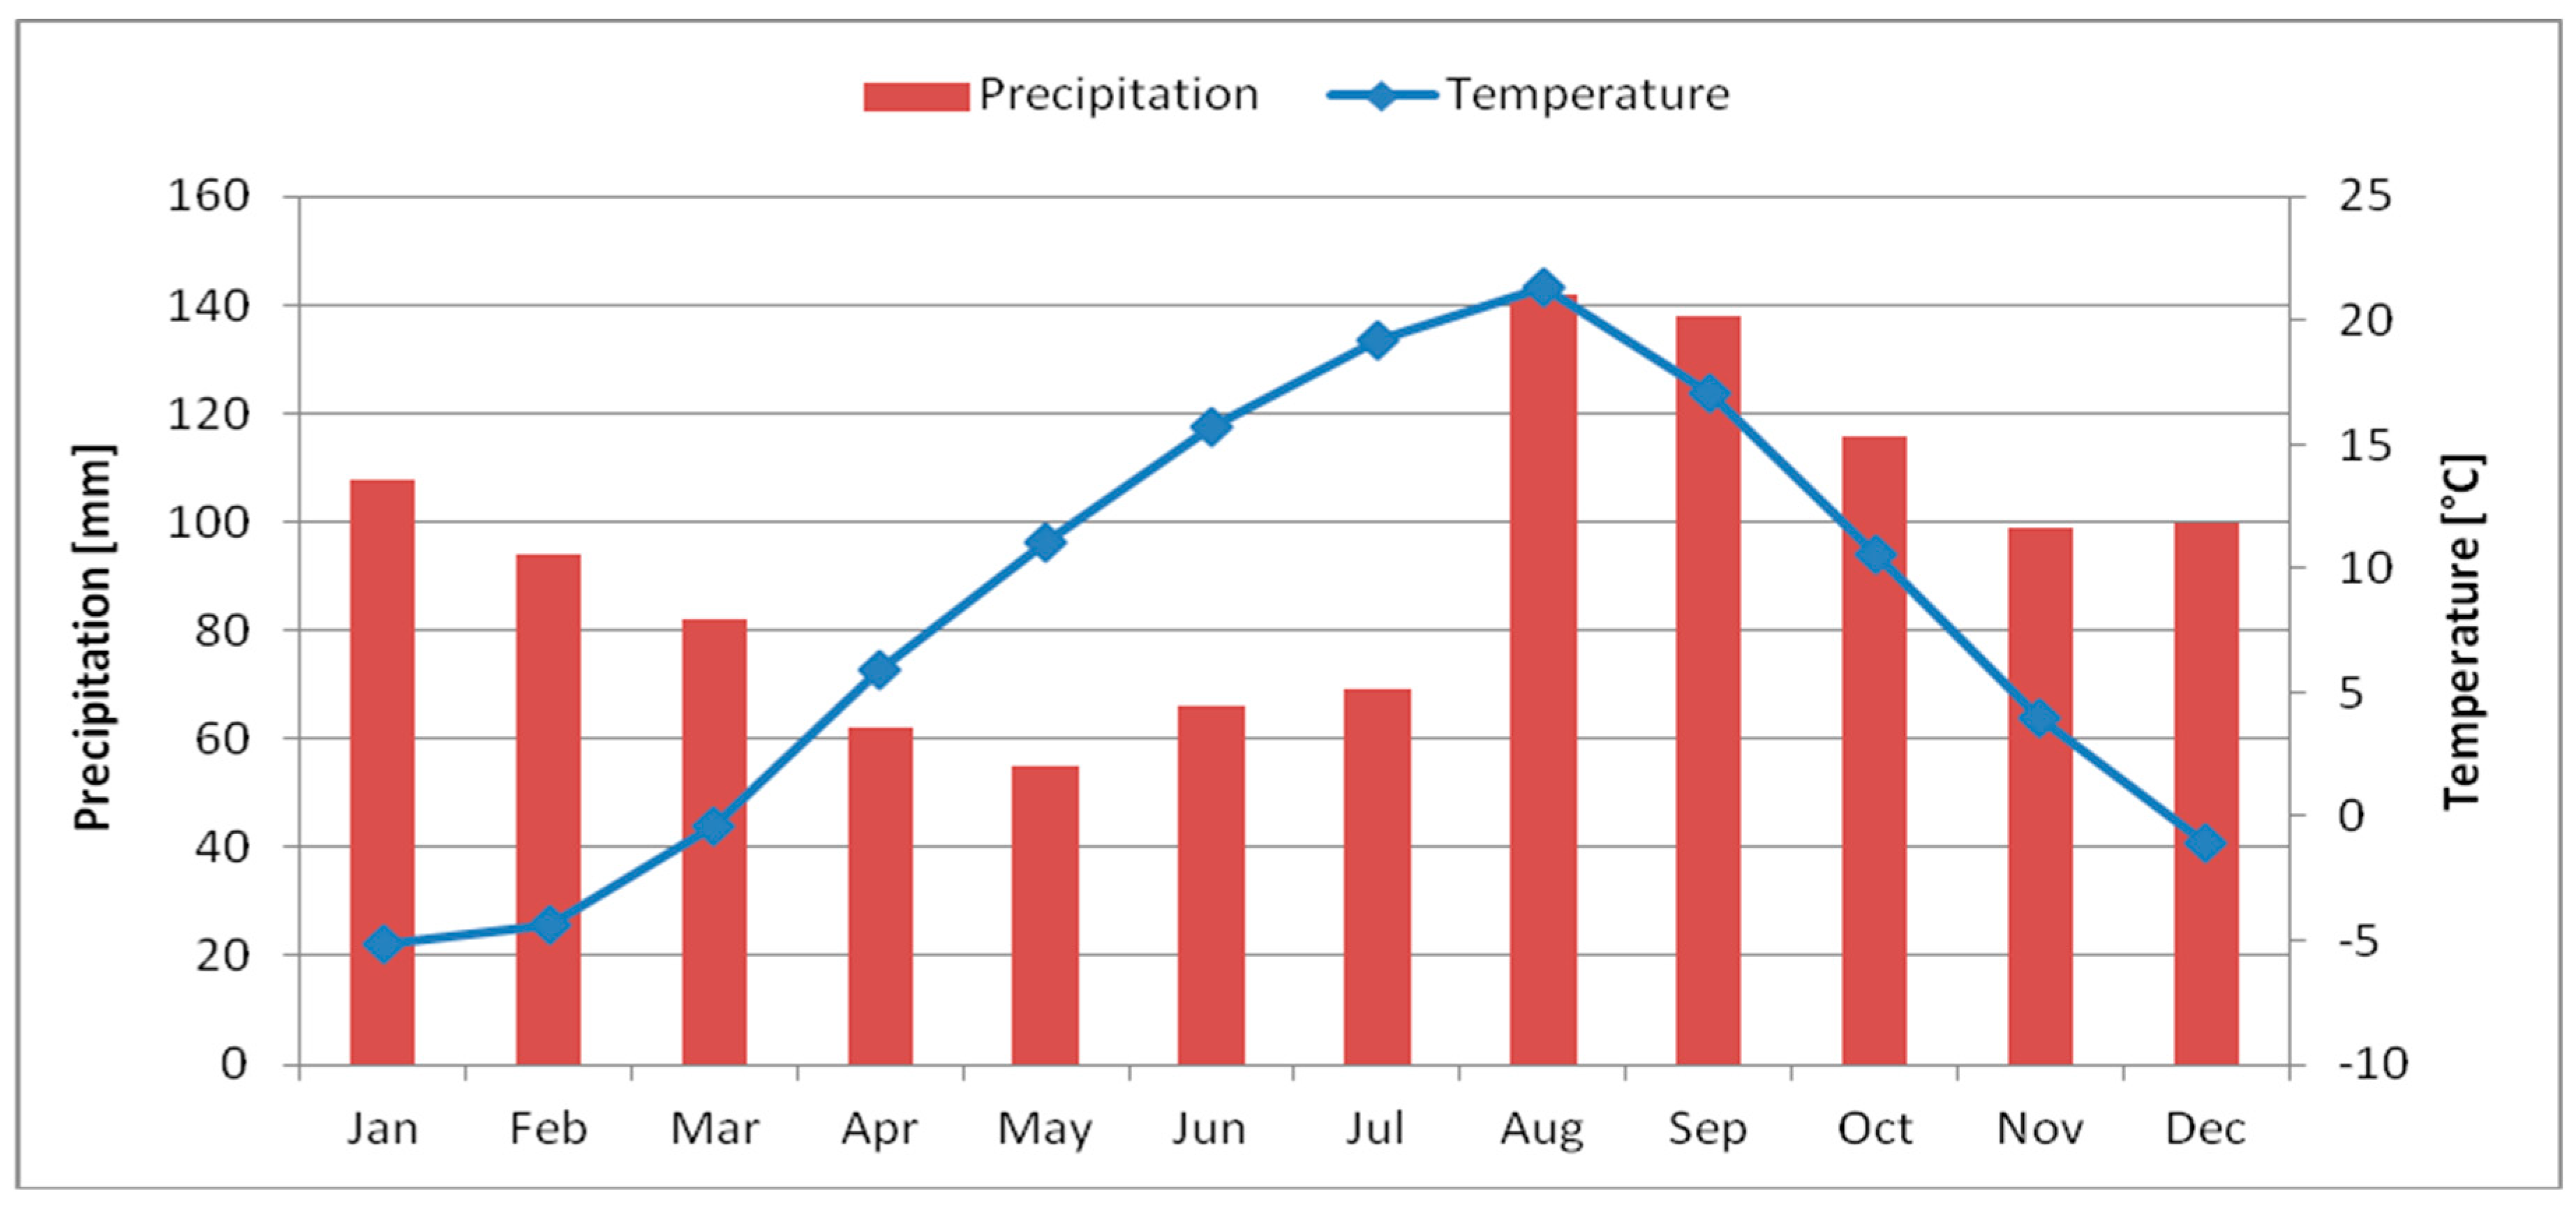
2.1. Climate of Sapporo

Sapporo has about 2.0 million inhabitants and a size of 1121.12 km2, the biggest city of Hokkaido island, northern Japan (43°4′ N, 141°21′ E ~ 43°3′43′ N, 141°21°15′E). Its climate is characterized as cold, without a dry season and hot summers [39,40] with an average annual temperature of 7.8 °C and a precipitation sum of 1130 mm (mean of 1980–2012). Over the year, the highest temperatures occur in July, August and September, with August as the hottest month (average of 20 °C). The coldest months are January and February with below 0 °C. The highest amount of precipitation also occurs in August and September (Figure 1, Japan Meteorological Agency).
To further analyze the effect of climate on tree growth, we calculated the de Martonne-index [43] on the basis of monthly precipitation and monthly temperature from 1983 to 2012. The snow-free period is from mid-April to early November.

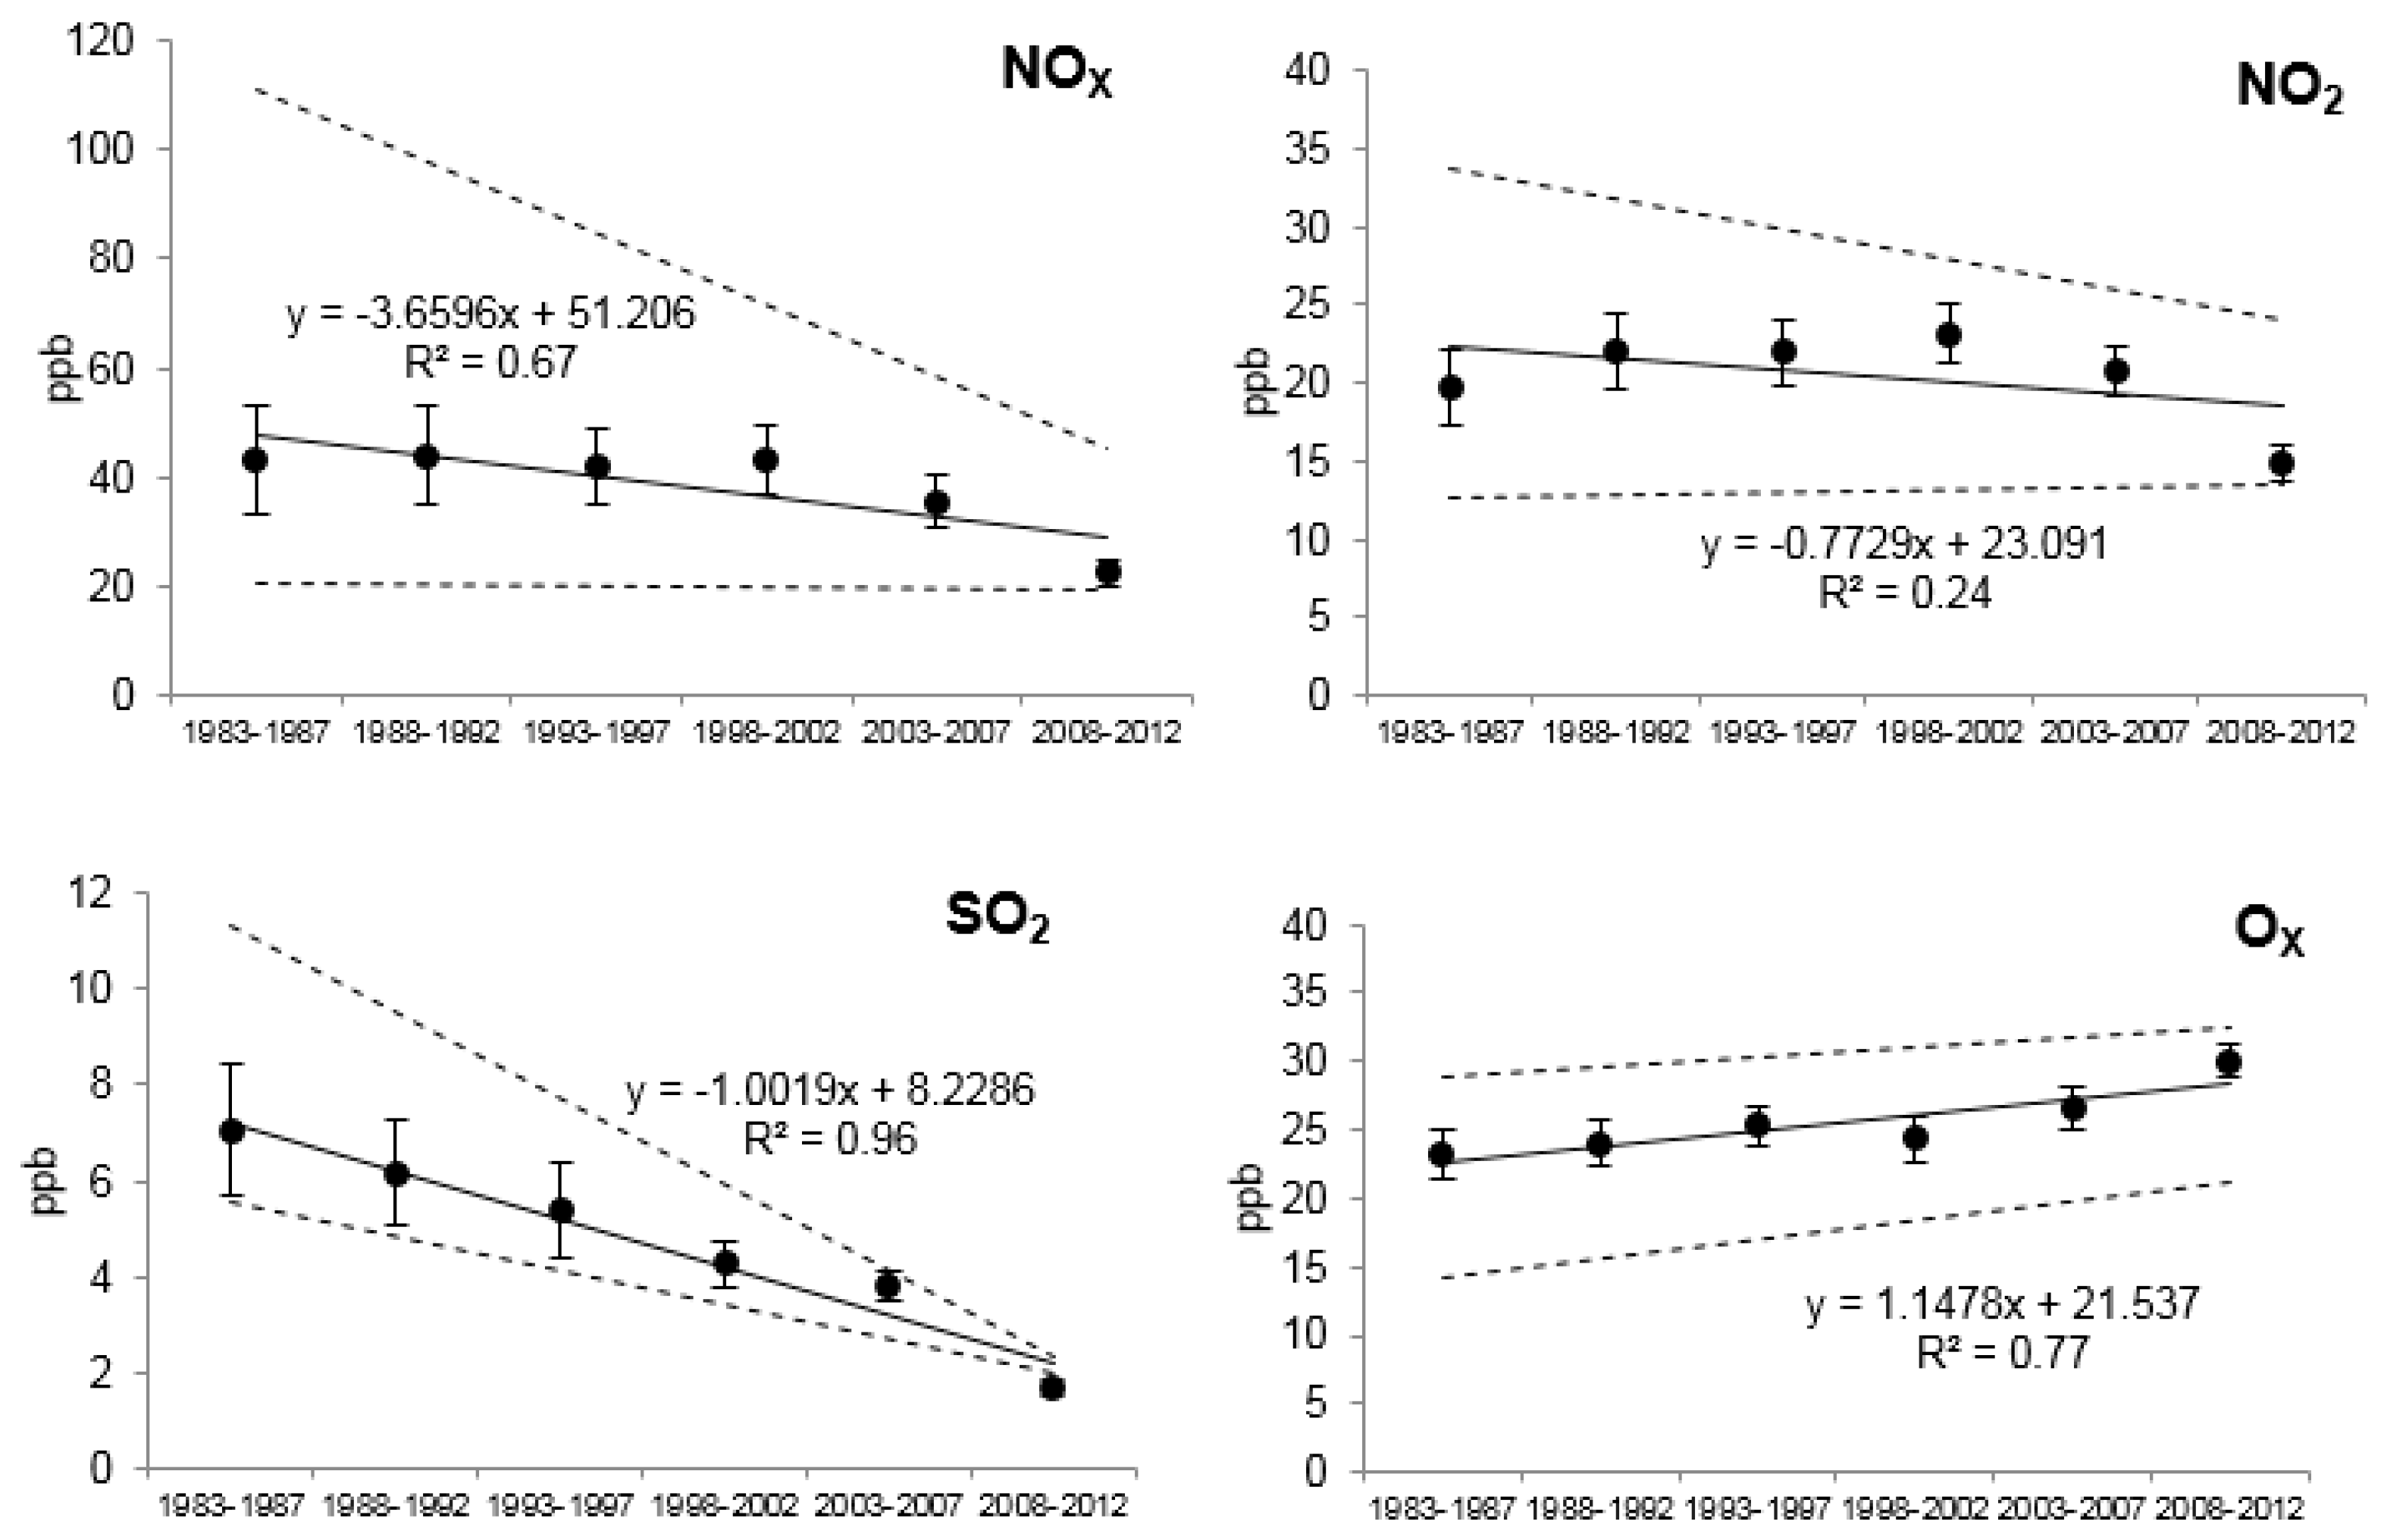
2.2. Environmental Pollution Data

Environmental pollution data (nitrogen dioxide NO2, oxides OX, sulfur dioxide SO2 and nitric oxide NOX) in Sapporo have been measured at several stations across the city (Table 1). Elevation of each monitoring site is about 50–200 m a.s.l. The highest concentrations of NO2 were found at Kita-1-jyo and Tsukisamu-South, with the heavily trafficked region having a of mean concentration of 20.8 ppm. The highest OX concentrations were found in Yamahana and Atsubetsu—the SE located suburb or close to reserved forests. The average concentrations of all stations was 26.9 ppm. For SO2 we found mean concentrations of 4.4 ppm (highest concentrations at stations Sapporo Middle Part and West District with heavy traffic), while for NOX the overall mean concentration was about 39.9 ppm (highest concentrations at stations Tsukisamu-South, near the reserve forest, and Kita-1-jyo, with heavy traffic). The average measured temperature of all stations across Sapporo was 8.6 °C. The warmest temperatures occurred at southeast Atsubetsu, in the east of Sapporo and at Yamahana, in the central south of Sapporo. Further, carbon monoxide CO was measured at the station Kita-1-jyo from 1986 to 2012, the mean value was 0.9 ppm. The values of NO2 and OX vary evenly around the mean, while SO2, NOX and temperature data are dominated by outliers, possibly induced by measurement errors or extreme conditions; e.g., at main roads.
The change of the environmental pollution values in Sapporo over six time periods ranging from 1983 to 2012 is displayed in Figure 2. Although NOX, NO2 and SO2 concentrations were decreasing, the OX concentrations were increasing. The regression line showed a high coefficient of determination for NOX, SO2 and OX (R2 > 0.65) over time; however, for NO2 it was lower (R2 < 0.25). For NOX and NO2, there was a peak concentration recorded in the period 1998 to 2002. The overall highest concentrations of environmental pollution were found for NOX, with values up to 50 ppm. The lowest concentrations were observed for SO2.

2.3. Sample Tree Species

The study focused on Sakhalin fir, A. sachalinensis, an evergreen conifer species originating of the Sakhalin islands and southern Kurils, Russia. The species also occurs in northern Hokkaido, Japan. It prefers moist climates with cool summers and mild winters, though it faces problems if exposed to waterlogged soils [44,45]. The shade tolerance of A. sachalinensis is very high and the growing rate low [46]. A screening experiment for 18 species native to Japan by Yamaguchi, et al. [47] showed, that most Abies species native to Japan are classified into the intermediate ozone sensitivity type (responses to AOT40; 16-30 ppm h), A. sachalinensis prefers slightly acidic soils with pHs around 5 [48].

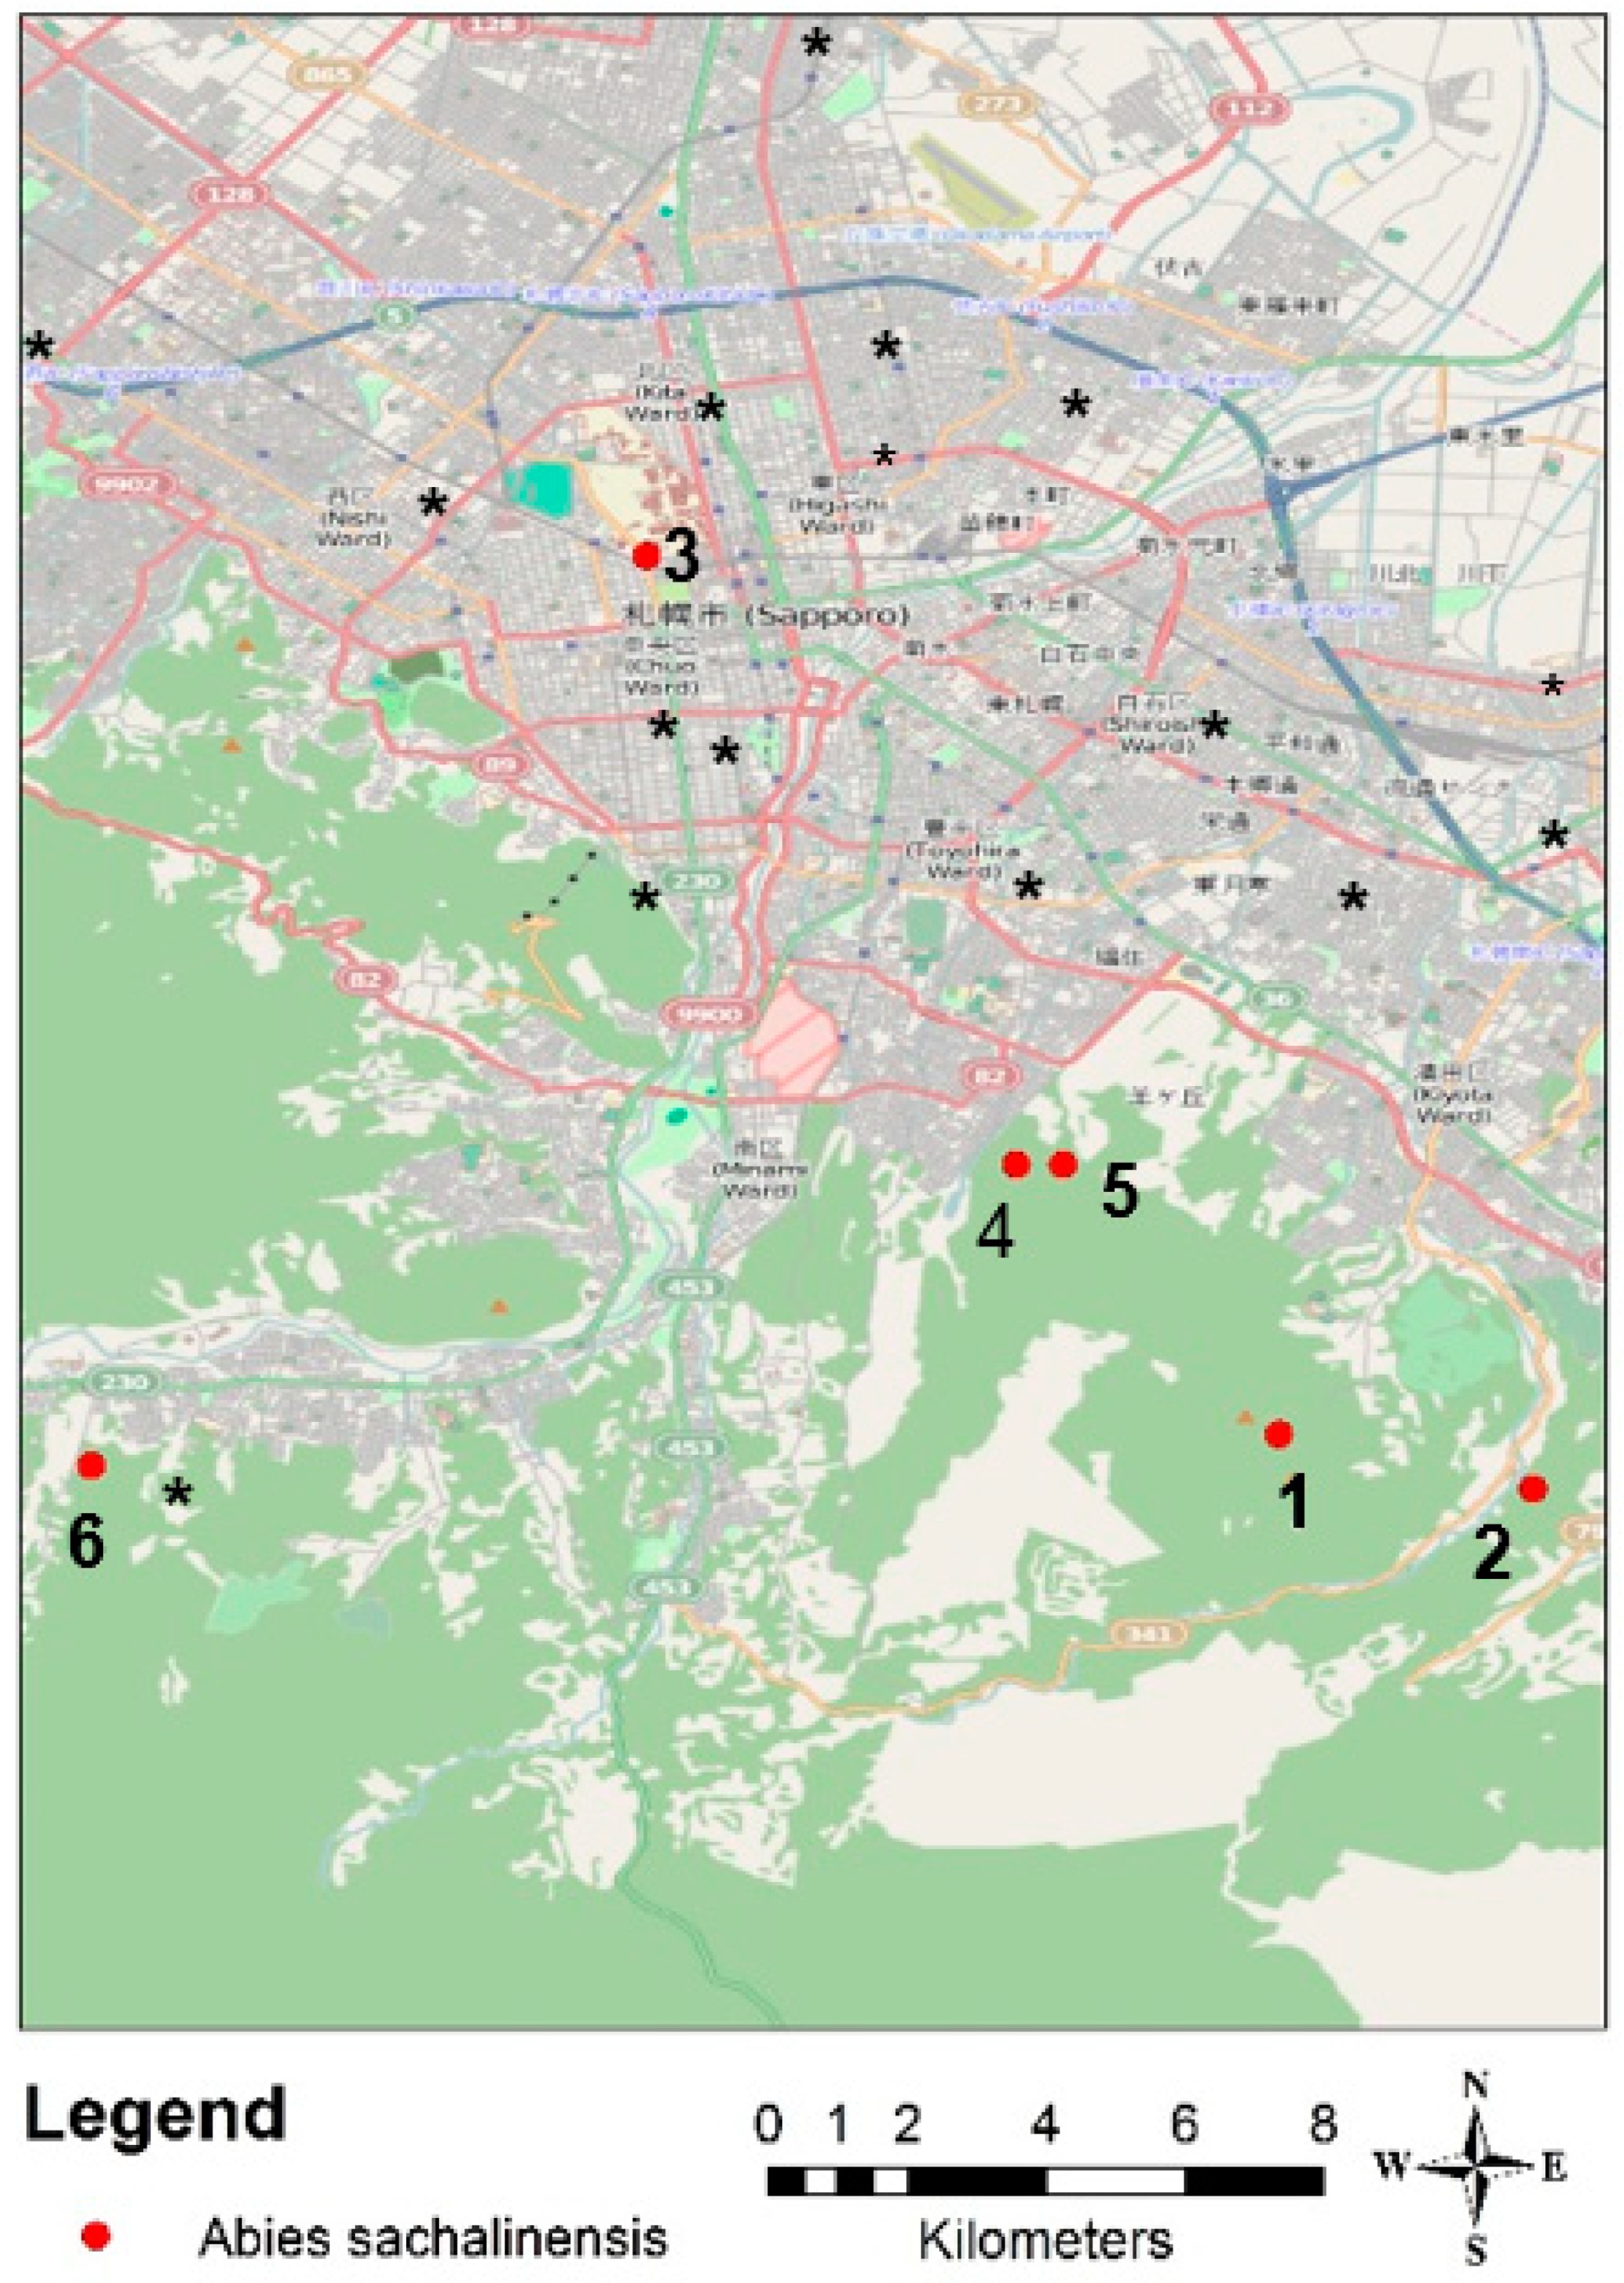
2.4. Data Collection

Across the city of Sapporo, 109 A. sachalinensis individual trees were chosen for data sampling at six sites along a gradient from the city center to the suburbs of Sapporo and a forest area outside of the city (Figure 3).
The trees in sample plot 1 and plot 2 (Shirahata-yama 1 and Shirahata-yama 2) together with plot 6 (Misumai of Hokkaido University Forests) were all classified as rural (Table 2). The trees of plot 3 (Hokkaido University Nursery in Sapporo) were growing along street canyons and were therefore classified as urban. The trees of sample plots 4 and 5 (both Hitsujigaoka-7 site) were classified as suburban trees; however, for model development, were merged with the urban trees. The sample trees at the urban and suburban plots were typically trees growing in cities, standing along streets, in front of buildings and at squares. The trees at the forest sites were party planted, mostly due to esthetic reasons and not for timber production, since the wood of A. sachalinensis gains low prices in wood markets. The stem density at the rural plots spans from 2000 (plot 2), over 2200 (plot 6), to 2500 (plot 1) stems per hectare. To the best of our knowledge, the trees at plots 3 (urban), and 2 to 4 (rural to suburban) were not further managed. Trees of plots 1 (rural), as well as of plots 5 to 6 (suburban to rural) faced typhoon events or thinning. The soil nutrient status was slightly different across the sample plots. While urban and suburban plots had higher nitrogen (N) content and bulk densities than rural plots, the calcium (Ca) and magnesium (Mg) content was higher at rural plots. The phosphorus (P) and potassium (K) content was not consistent over plot classification; however, highest concentrations were found for P at Shirahata-yama 2 and for K at Hitsujigaoka-7 2nd plots.
Before increment core collection, data on tree structure and the site conditions were recorded, including diameter at breast height, 1.3 m (dbh), tree height (h), height to the crown base (cb), crown radius in four directions (N, E, S, W), tree position (coordinates and altitude), site condition, tree vitality, and open surface area of the unpaved area around the tree in four directions. Based on the recorded data, the average crown radius cr (Equation (1)) and crown diameter cd (cd = cr × 2), the crown projection area (CPA) (Equation (2)) and the crown volume (cv) (Equation (3)) were calculated.
mean   cr   = ( r N 2 +   r E 2 +   r S 2   +   r W 2 ) / 4
cpa = cr2 × π
cv = CPA × crown height
The increment core collection was conducted at each tree. Two cores opposite to each other were extracted at a height of 1.3 m in northern and western directions with a 5 mm diameter increment corer (Haglöf Sweden AB; Långsele, Västernorrland, Sweden).

2.5. Core and Data Processing

The cores were processed by mounting on wooden boards with regard to the grain direction. Thereafter, the cores were sanded until the highest visibility of the cross-sectional area, and then polished with progressively finer sandpaper from grit size 180 up to 800. Annual tree-ring widths of the cores were measured with a digital positioning table with a resolution of 1/100 mm (Rinntech e.K., Heidelberg, Germany). Crossdating and synchronization of ring-width data were accomplished by the software TsapWin (Rinntech e.K., Heidelberg, Germany) using standard dendrochronological methods [49,50,51].
All following analyses were conducted with the package dplR of R [52]. The biological age trend (higher growth of younger trees) in the ring-width data was removed by a double detrending procedure applied to all series (modified negative exponential curves and cubic smoothing splines with 20 year rigidity, 50% wavelength cutoff). The resulting index series contained only year-to-year variability associated with fluctuations in climate [49,50] producing dimensionless ring-width indices (RWIs). In a final step, autocorrelation was removed by autoregressive (AR) models (maximum order of three) and the series were averaged using Tukey’s biweight robust mean. This reduces bias caused by extreme values. Mean sensitivity was calculated as assessment of chronology quality; it depends on the year-to-year variability and was employed as a measure of variability. All further analyses of climate-growth correlations were conducted with the resulting chronologies. From the chronologies, the ages of the analyzed trees were derived. When the exact age of the tree was not clear (missing tree pith, among others), the age was back calculated based on the un-detrended average growth rate of the last ten years and the dbh of the tree.

2.6. Statistics

Data on previously measured tree structures (dbh, height and crown values) were tested for significant differences between groups of urbanity (urban versus rural versus suburban and urban versus rural). Since the assumptions of normality and homogeneity were not met, the Kruskal–Wallis test with pairwise testing for significance (pairwise Wilcox-test with Bonferroni–Holm p-value correction) was applied for three groups and the Kruskal–Wallis test for two groups. Statistics were done in R, version 3.3.3 [53].

2.7. Trend Analysis (Long-Term Trends)

Using the R package lme4, two linear mixed models of the following forms Equations (4) and (5) were developed to assess the influence of the time of age, growth (before 1960 and since 1960) and urbanity (urban-rural) on the annual basal area (response variable) derived from increment cores. To differentiate between the two growths-trend relevant periods (before 1960 and since 1960), we introduced the dummy variable recent, with 1 indicating each observation later than 1959 and 0 otherwise, which is in accordance with growth trends, since approximately the 1960s, that have been identified for forest trees.
ln(baij) = a0 + a1 × timeij + (b0 + b1 × timeij) × log(ageij) + cij + εij,
ln(baij) = a0 + a1 × urbij + (b0 + b1 × urbij) × log(ageij) + cij + εij,
In Equations (4) and (5) the basal area is the response variable for the jth of ni observations in the ith of M groups or clusters, and a1, …, an and b1, …, bn are the fixed effects with the a parameter’s components of the intercept and the b parameter’s components of the slope. When a1 in Equation (4) differed significantly from 0, the age-basal area relationship before 1960 had a different intercept than that since 1960. In Equation (5), any differences in the intercepts would indicate that the intercept of urban trees was not the same as that for rural trees. The parameter b1 in both equations have an analogous meaning to that of the slope. The c parameters are random effects, which are assumed to have a normal distribution. These random effects cover statistical dependencies, which are due to the nested data structure. The errors εij are assumed to have an independent, identical distribution. With both models, we try to answer the research questions 1, 2 and 3 to derive the growth trend of A. sachalinensis in Sapporo in view of time and location.

3. Results

For the 109 measured A. sachalinensis trees, an average dbh of 34.4 cm with a mean age of 59 years was found. The mean tree height was 17.8 m and the average cd was 5.9 m. Moreover, an average cv of 1621 m3 was found.
Table 3 displays the measured and calculated tree structures of A. sachalinensis in Sapporo classified by the sampling sites. The trees at rural plot 2 (Sharahata-yama 2) and rural plot 6 (Misumai) were the oldest with an average age of around 100 years. The according tree characteristics dbh, cd, cpa, crown length and cv were greatest at both plots as well. Youngest trees were found at suburban plots 4 and 5, Hitsujigaoka 1st and Hitsujigaoka 2nd, both in the Hitsukigaoka-7 site, with a mean age of around 35 years. Tree on those plots were, therefore, the smallest.
A further classification of A. sachalinensis to urban, suburban and rural growing trees illustrated that greatest tree structures were mostly found for rural trees (with exception of crown start). Urban and rural tree structures were significantly different, with suburban trees showing intermediate size (crown start), or were similar to the urban trees (dbh, tree height, cd, cpa and cv). Only the crown lengths of suburban trees were more similar to those of rural trees (Table 4).

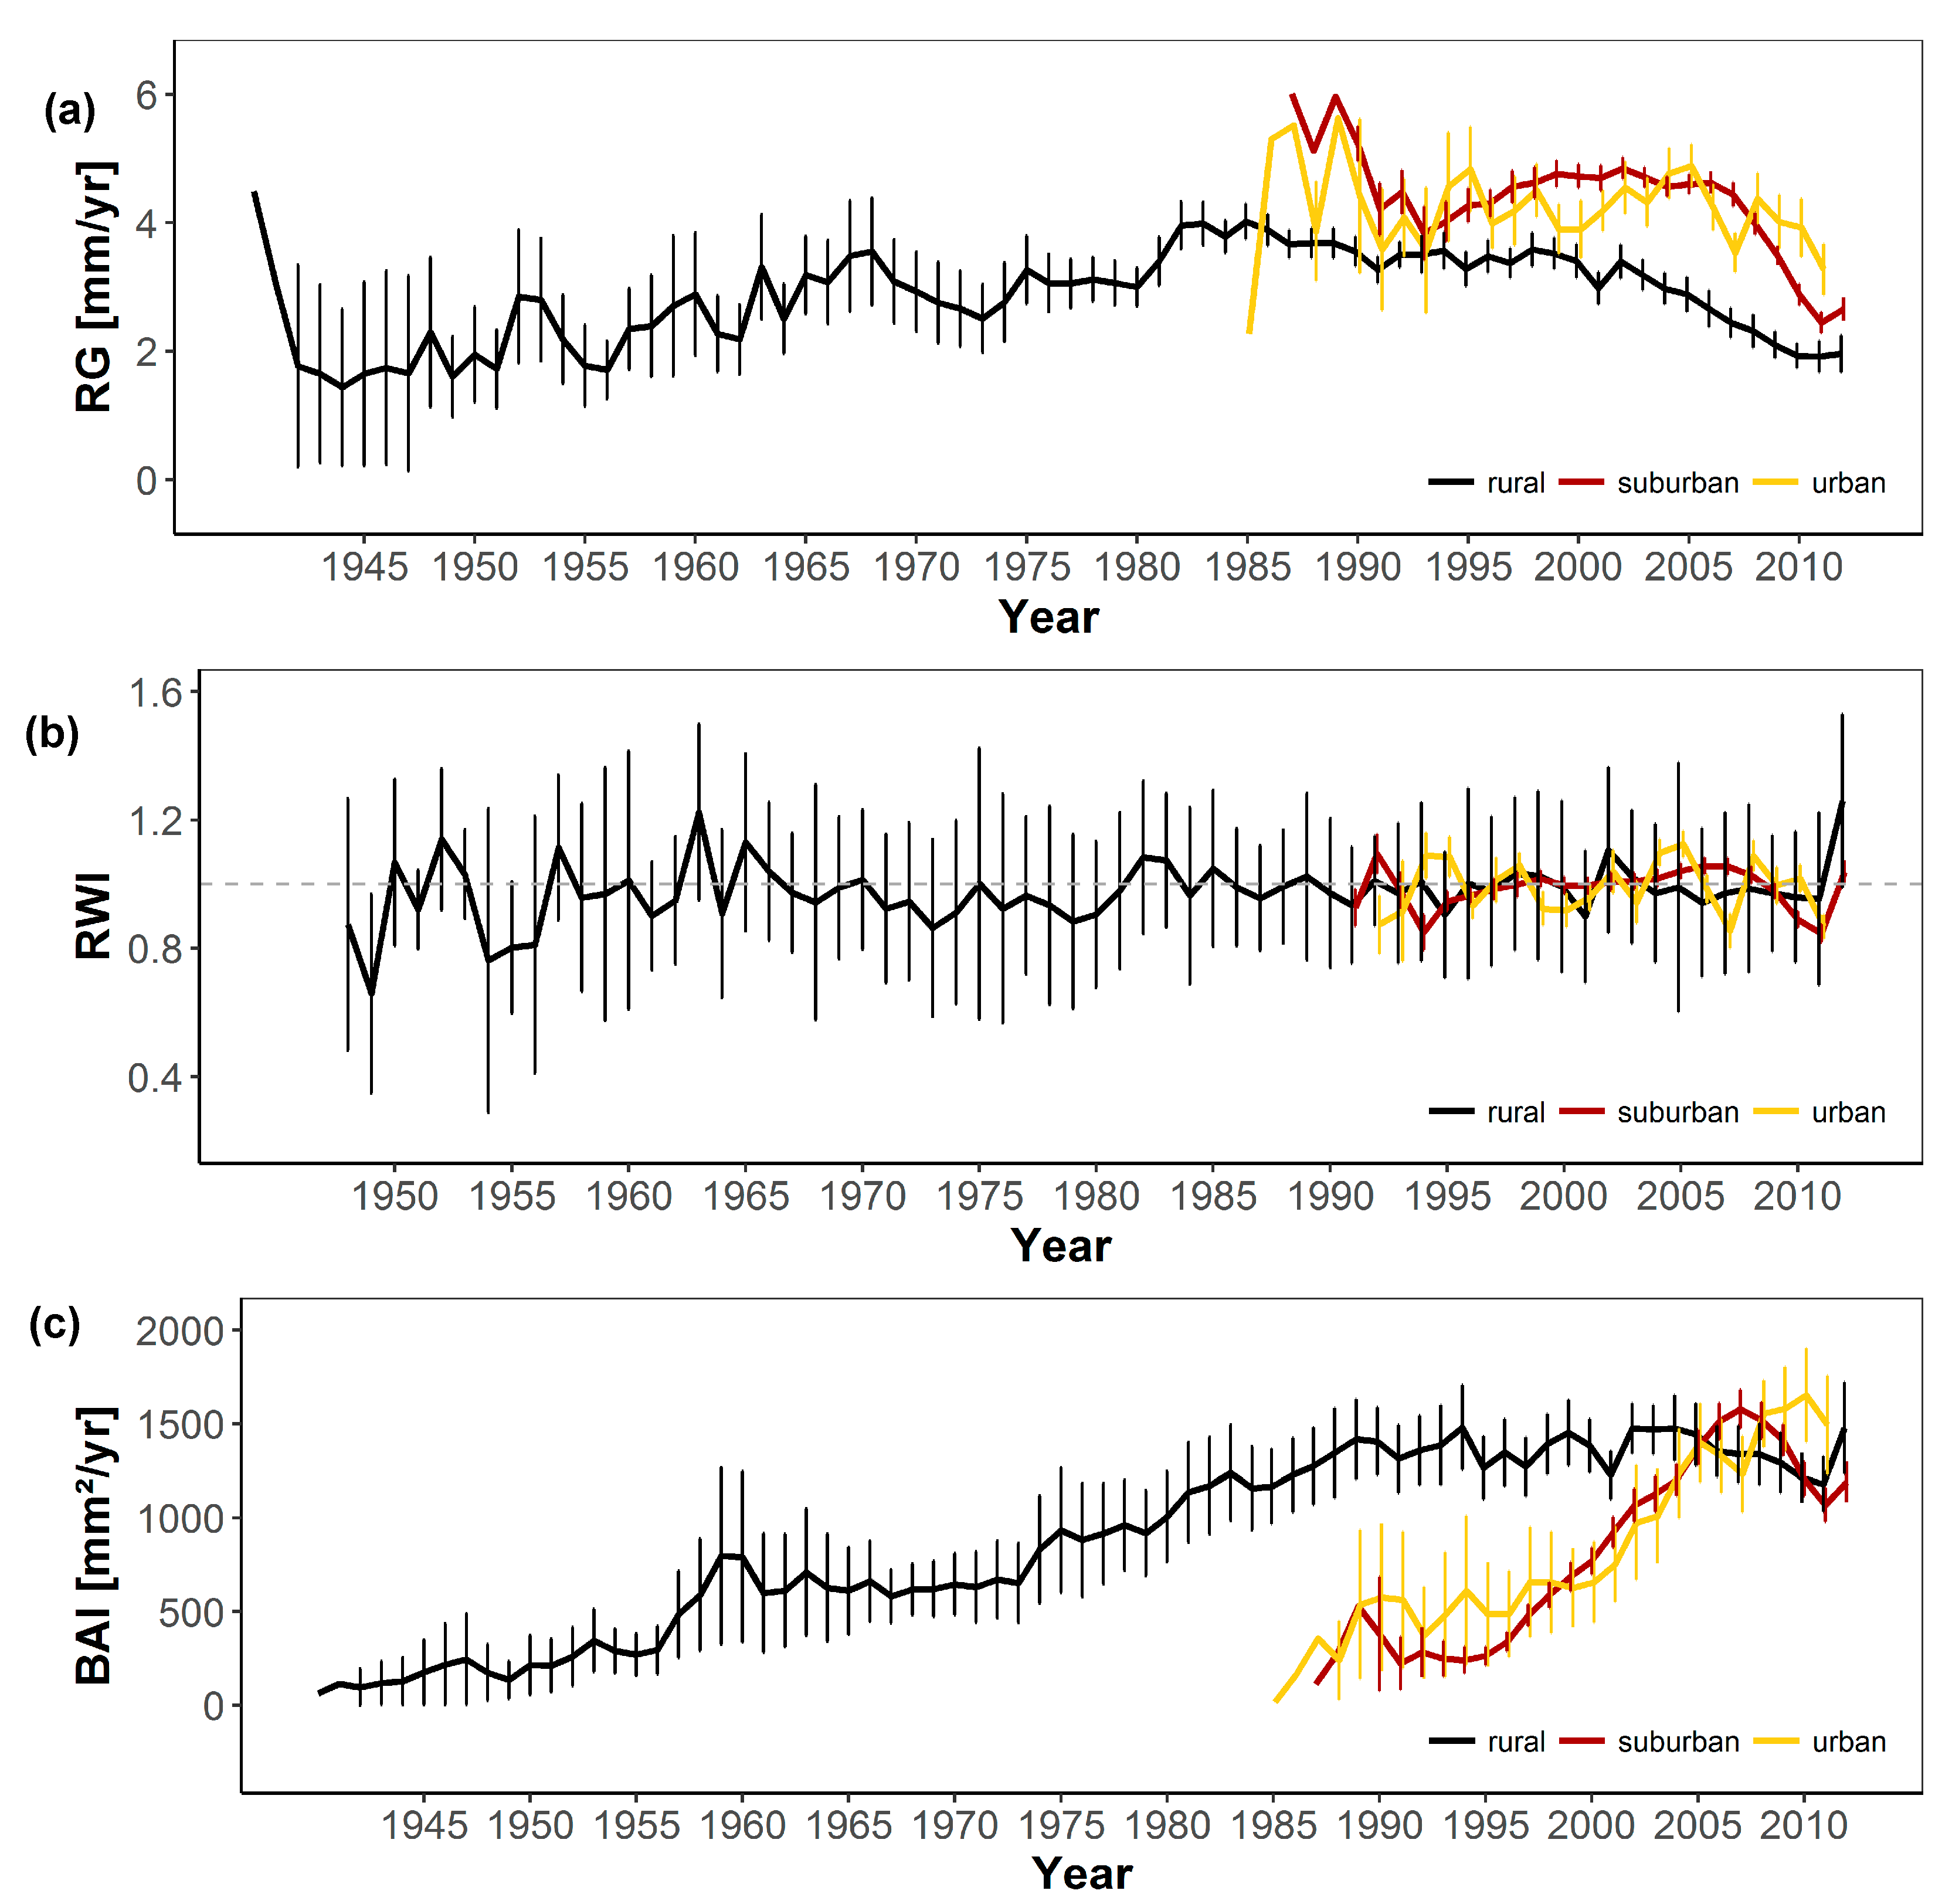
3.1. Short-Term Growth Trends

When analyzing the overall growth trends of A. sachalinensis in Sapporo, a strong age-trend could not be found (Figure 4a). At younger ages, A. sachalinensis did not show a better radius growth than older trees displayed. However, with the exception of 2011, a decrease in growth can be observed during the last ten years. After double-detrending, these trends cannot be found in Figure 4b, highlighting a more varying indexed growth earlier in life and during the past years, and a very uniform growth from 1984 to 2008. Overall, the basal area of A. sachalinensis shows a steady increase, with a drop in 1956, 1995 and 2011 (Figure 4c).
When looking in more detail at the growth of A. sachalinensis in Sapporo, analyzing the growth chronologies of trees at urban, suburban and rural settings, distinct trends can be found (Figure 5). The raw radial growth curves of rural trees displayed a far higher age of rural trees than of urban and suburban trees (Figure 5a). Urban and suburban chronologies started the earliest, in 1985. When regarding their growth, rural trees showed lowest stem growth rates, while urban and suburban trees indicated clearly higher values. For all chronologies, a decline was found for the last ten years, which was most pronounced for suburban and urban trees. After the detrending process and after the age-trend removal (Figure 5b), the growth chronologies appear more similar. However, common positive or negative pointer years for all three chronologies could not be found. The decline in the past years was observed as well, albeit a steep increase in growth was found in 2011. The basal area increment (Figure 5c) indicates a higher level of BAI of rural trees due to their higher age and longer growing period. Both urban and suburban trees had a marked increase in BAI since their planting, exceeding rural trees between 2005 and 2008.
The statistical characteristics of the displayed chronologies can be found in Table 5. While the highest growth rate was found for urban and suburban trees, rural trees were growing on average the least. Mean sensitivity was 0.23, with highest for the urban chronology and lowest for the suburban chronology (0.19). Autocorrelation was found highest for rural trees, at 0.68 and least for urban trees, at 0.33.

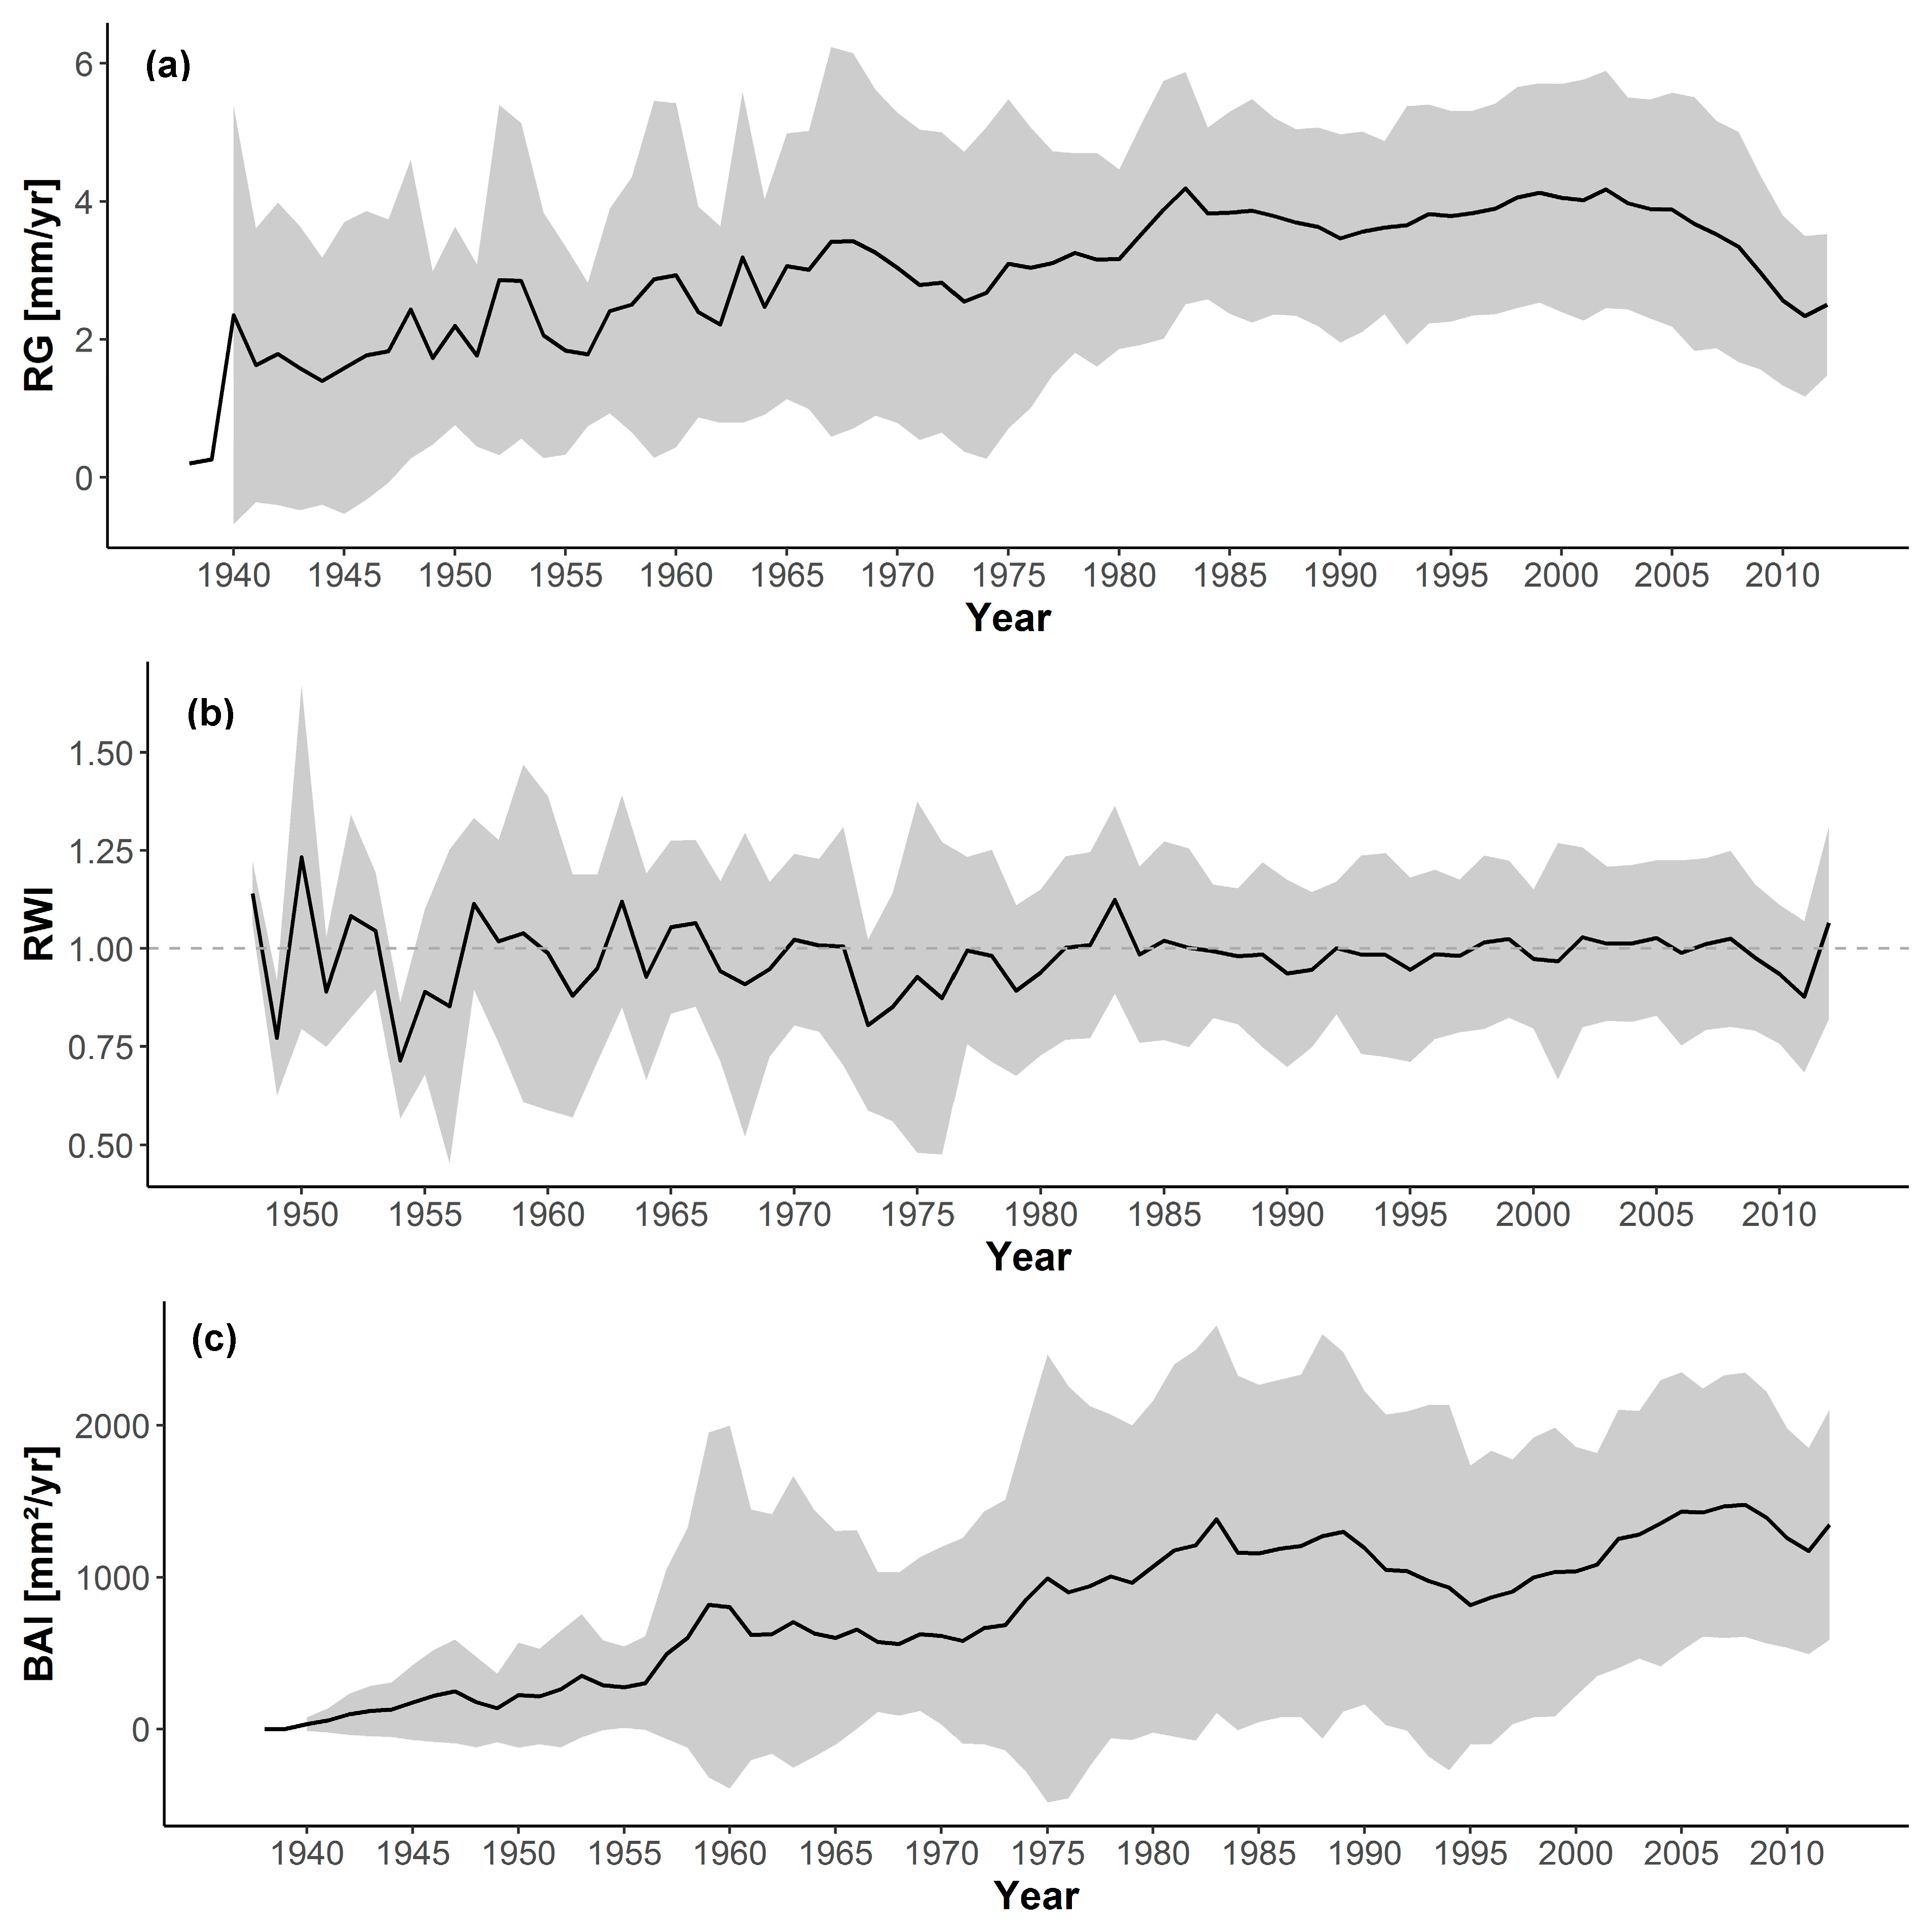
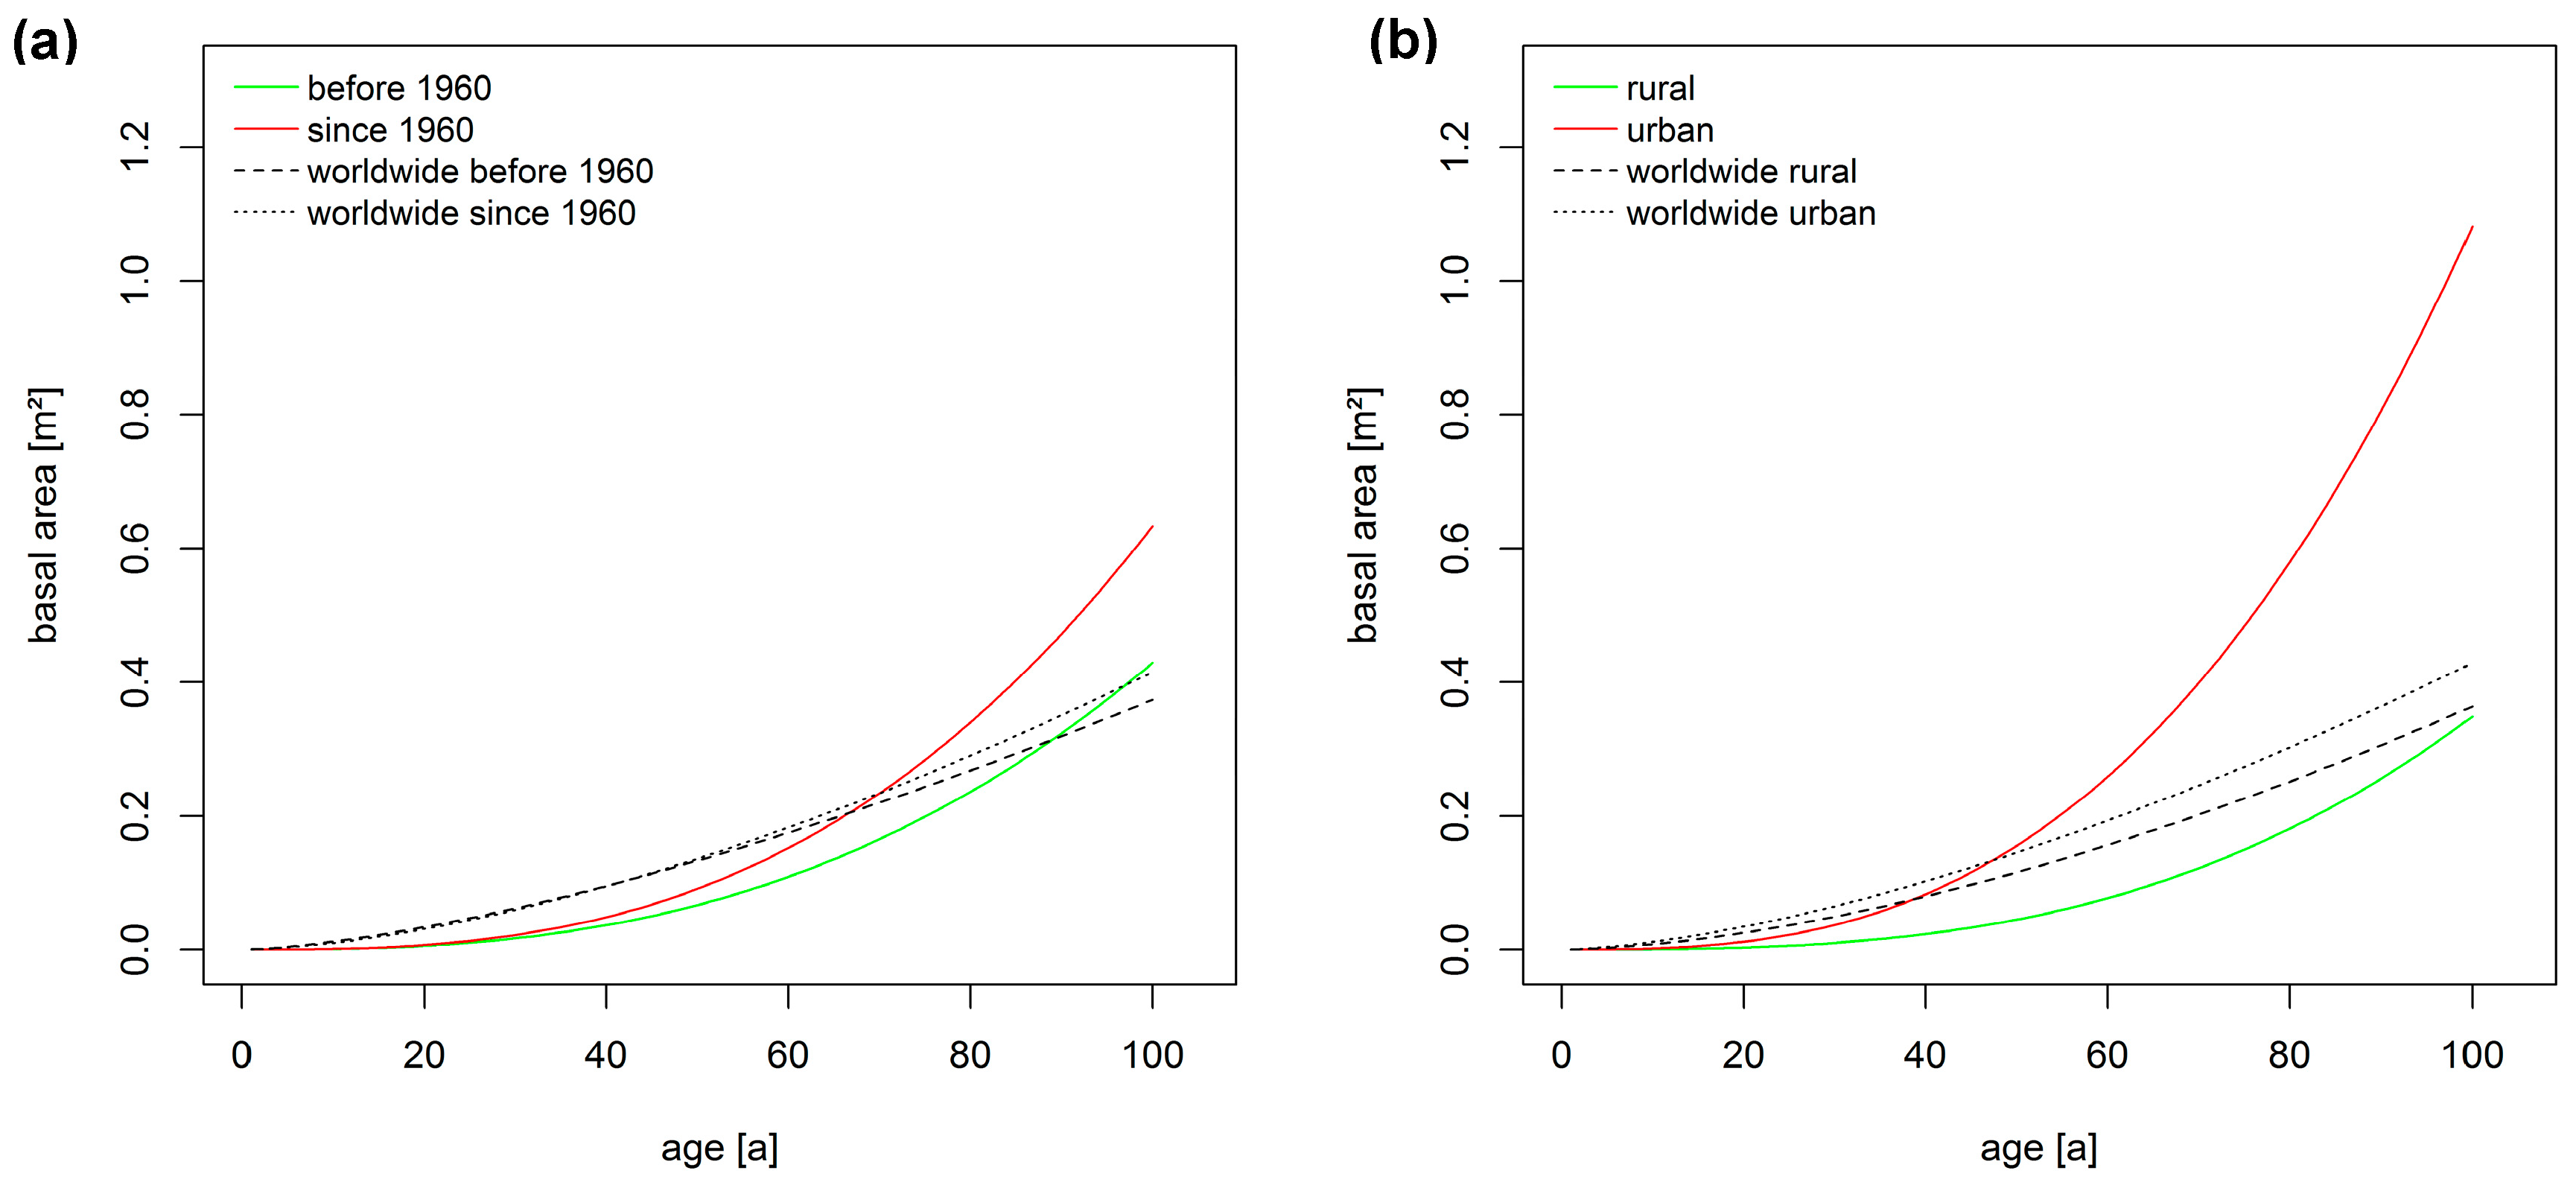
3.2. Long-Term Growth Trends

Tree growth in Sapporo has shown an enhanced growth for the past decades compared with the growth before 1960. This is in accordance with the overall global trend of urban trees found by [17] (Figure 6a). Young A. sachalinensis grew similarly, regardless of their planting time; however, after reaching an age of around 50 years, trees planted in more recent decades showed an enhanced growth, also passing the overall worldwide average. Urban A. sachalinensis trees illustrated a far better growth compared to rural trees, in particular after an age of 60 years, urban tree growth exceeded rural trees’ growth by far (Figure 6b). In comparison to the worldwide results on urban and rural tree growth by Pretzsch, Biber, Uhl, Dahlhausen, Schütze, Perkins, Rötzer, Caldentey, Koike, van Con, du Toit, Foster and Lefer [17], A. sachalinensis rural trees showed a lower average growth rate. Younger trees were growing less than the worldwide average, though, at the old age of more than 100 years, A. sachalinensis exceeded the growth rate of other studies trees. Urban trees had a similar growth rate to those trees measured worldwide until an age of 50 years, and then an extremely high growing rate was found for A. sachalinensis in Sapporo.
The described trends of Figure 6a,b can also be found by using a mixed model (Table 6 and Table 7). While age had an overall significantly positive effect on growth of A. sachalinensis, the time of growth (before or since 1960) acted as negative driver, though it was not significant. In combination with age, a significant, positive interaction was found again. Therefore, the older trees were, the better was the tree growth since 1960. A similarly positive effect for age on tree growth as a single term was found when looking at the influence of urbanity. Urbanity had a highly positive influence on growth, indicating a better growth of urban A. sachalinensis compared to rural trees. In combination, however, urban trees showed a more enhanced growth with higher age than rural trees.

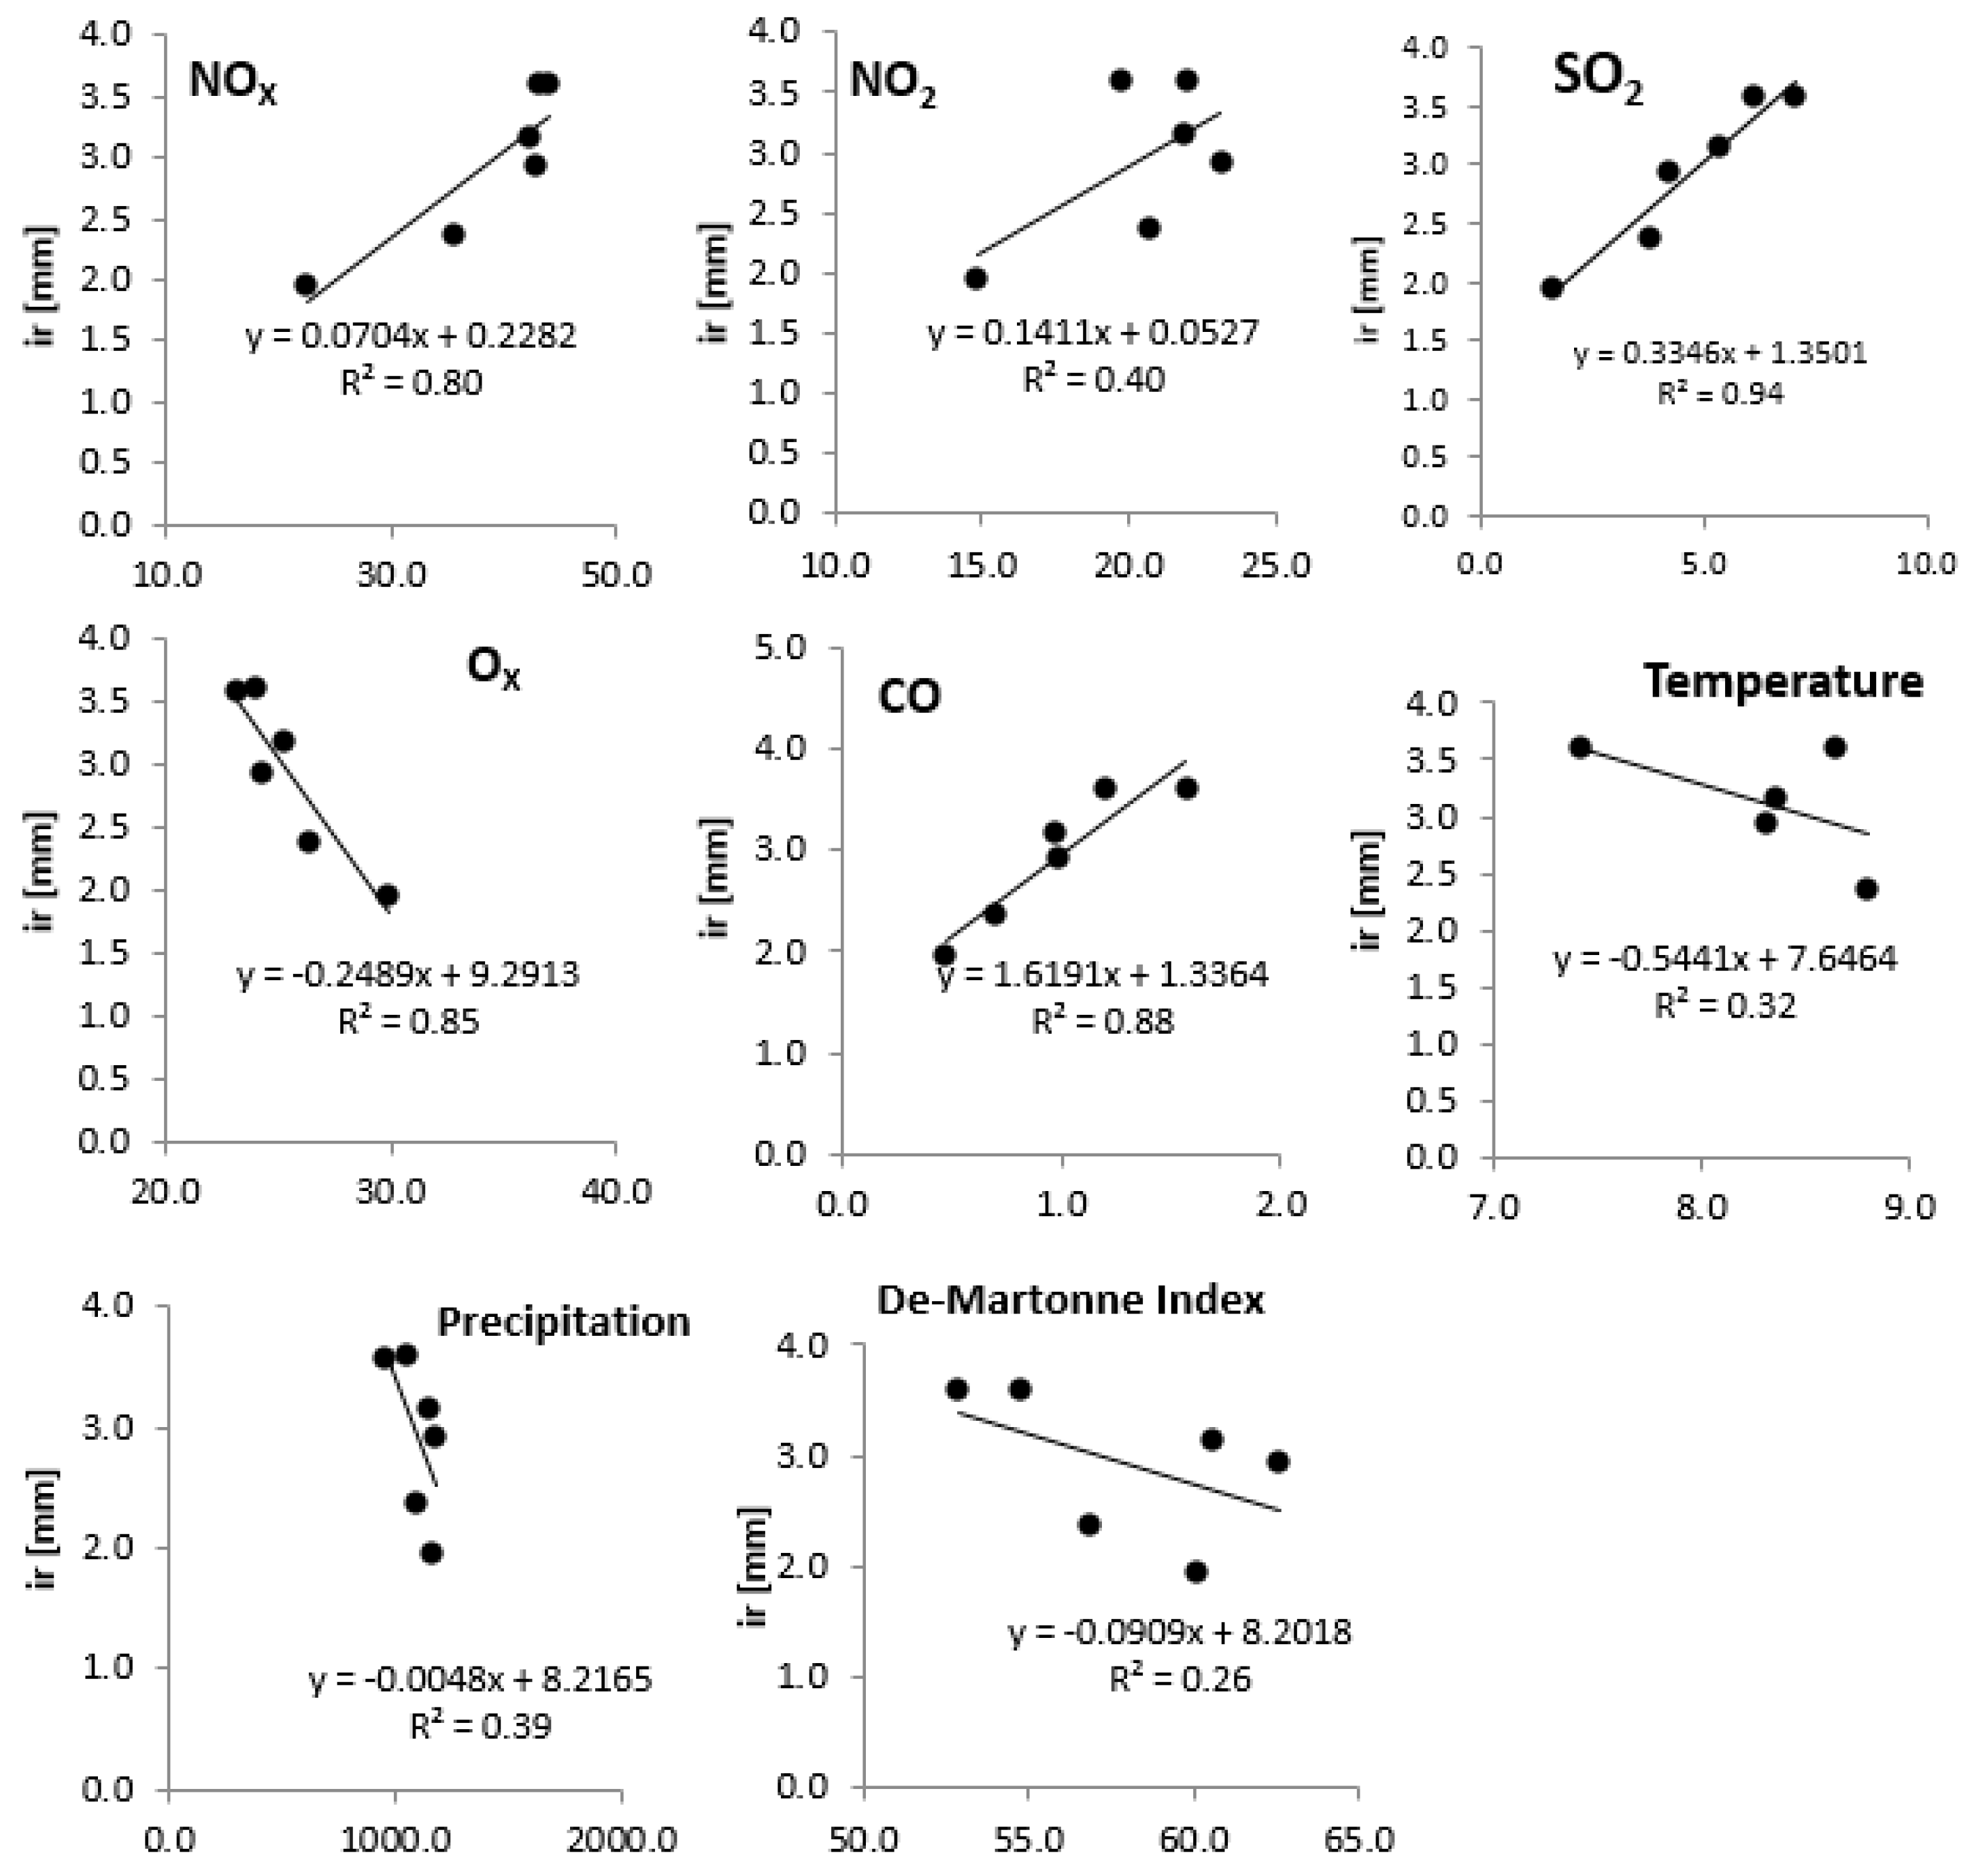
3.3. Relationships of Growth with Environmental Pollution

The growth was also related to the measured environmental pollution and climate data of Sapporo (Figure 7).
Radius increment, concentrations of environmental pollutions and climate data were averaged in six periods of five years. Over the analyzed periods, strong correlations of growth with NOX, SO2, OX and CO were found (R2 > 0.8). However, weak relationships were found between growth and NO2, temperature, precipitation and the de Martonne-index (R2 < 0.4). When looking at the strengths of the relationships, a strong positive effect of higher environmental pollution on tree growth in Sapporo was derived for NOX, NO2, SO2 and CO. An increase in concentrations of these gases was strongly related to an increase in growth. On the other hand, for the OX concentration and the climate data temperature, precipitation and the de Martonne-index, a negative relationship with growth was observed. A higher concentration of OX as well as higher temperatures, more precipitation and a higher de Martonne-index was correlated with decreased growth.

4. Discussion

The studied A. sachalinensis trees in Sapporo, Japan were, across all sampling sites, an average age of 59 years old. This age is comparatively high for an urban tree species, since studies such as Nowak, et al. [54] and Skiera and Moll [55], stated a very low life span of 15 years on average and a high mortality rate of 6.6% per year. However, the most frequently planted trees in cities are deciduous tree species, illustrating a very high annual mortality rate of 12.6% for Acer negundo L., 7.4% for Robinia pseudoacacia L. and 6.8% for Fraxinus pennsylvanica Marsh., compared to results for coniferous species (3.2% for Picea abies (L.) Karst. and 0% for Pinus strobus L.) [54]. In a Japanese forest stand, a competition driven mortality rate of 1.7% per year was found for A. sachalinensis, with an overall age range of 33 to 187 years and a mean age of 104 years in the Nakagawa Experiment Forest of Hokkaido University, located in the northern part of the island [56]. Moreover, a maximum age of 249 years for canopy trees of A. sachalinensis was derived [56]. This is in line with the maximum age we found in our study, as a maximum age of 250 years was found for trees sampled at the rural Misumai plot. The oldest trees were found at the rural plots Shirahata-yama 2 and Misumai. The trees at suburban and urban plots were markedly younger. These plots were in the rural outskirts of the city and have been established earlier than the other urban and suburban sites. The average age of all sampled trees across Sapporo was younger compared to the study of Hiura, Sano and Konno [56]; however, when excluding the fairly young urban and suburban trees, an average age of 82 years for the trees at the forested sites can be derived. When only looking at plots Shirahata-yama 2 and Misumai, the average age of the trees was 100 years, which is very similar to the study about A. sachalinensis growing in a Japanese forest [56]. All in all, the found growth rates and ages seem to be in line with the results of other studies on coniferous species, urban trees and A. sachalinensis.
Tree age is correlated with tree structures like diameter at breast height (dbh), tree height and crown parameters, such as diameter, height, projection area and volume [57], and the older trees at rural plots Shirahata-yama 2 and Misumai had significantly greater dbh, height and other crown parameters than the trees growing at suburban and urban plots. Due to their young age, though, urban and suburban trees show a high growth rate. While the trees sampled at the forest-sites are more than double as old as the trees at suburban and urban plots, the difference in dbh is only 14 cm and 12 cm respectively. Overall, the height growth of A. sachalinensis in Sapporo is faster compared to trees measured in a northern Japanese forest stand [56]; however, urban trees often can reach greater tree sizes than forest trees due to more unobstructed growth and less competition [58].
The average raw radius growth rate of A. sachalinensis in Sapporo, northern Japan is with 4.2 mm/year, in line with other studies analyzing the growth of this species, such as Hiura, Sano and Konno [56], who found a growth rate of 1.0–7.0 mm/year, and Umeki [59] describing 3.1 mm per year, both studying A. sachalinensis at forest-sites in Japan. In urban areas, the growth rates of coniferous species have seldom been measured. Peper, et al. [60] provided data on the dbh increments between the ages 15 and 30 years for three coniferous species in Santa Monica, California, US. The transformed data indicate radius increments of 5.7 mm per year for Pinus canariensis C. Sm., 4.7 mm for Ficus microcarpa L. f. and 8.4 mm for Cedrus deodara (D. Don.) G. Don., which all are higher than those found for A. sachalinensis in Japan. When accounting for the similar age, the growth rate F. microcarpa is comparable to the radius increments of urban and suburban trees of A. sachalinensis. The highest growth was found for urban and suburban A. sachalinensis trees, while trees at rural plots grew least. This might be induced by the younger age of urban and suburban trees.
For all further analysis, the age difference was accounted for in model development by including the age of the trees or by an age detrending of the raw tree ring widths. A similar year-to-year variability (mean sensitivity) was found for the urban, suburban and rural chronologies, albeit trees at the urban sites showed higher mean sensitivity. This seems logical, since trees growing in extreme environments often display stronger sensitivity values than trees of sites with less stress and better water supply [61]. The higher autocorrelation of rural trees indicated, that radial growth was strongly influenced by the conditions of the preceding year, due to preformed shoot primordia in this species [62]. The lower autocorrelation of urban trees might be caused by the different conditions at the urban sites compared to forest sites. The urban environment seems to affect trees positively, while rural trees are more often faced with stressful conditions, such as possibly less nutrient inputs and higher ozone concentrations over 60~80 ppb (nmol mo−1). Information on the soil nutrient status showed, that the soil at rural plots has higher phosphorus and magnesium concentrations; however, the nitrogen content is lower. Moreover, the soil compaction is slightly less at rural sites.
The radius and BAI chronology of urban trees also indicated a growth decline in the past decades, though the steep increase in growth during the past year before sample taking. In total, the chronology of the urban trees showed a decreased variability and a higher stability over the past decades. The chronologies of urban and suburban trees illustrated high radius growth rates and strong increases in BAI. Though urban and suburban chronologies highlighted an opposing pattern to the rural trees in past decades (decrease in radius increment and BAI), this is in particular visible for the suburban chronology.
Trees of A. sachalinensis in Sapporo showed an enhanced growth rate during the most recent decades compared to former times (before 1960), as well as a better growth of urban trees compared to rural trees. These findings are in line with the trends found for R. pseudoacacia in Santiago de Chile [63] and Quercus nigra Mill. in Houston, Texas [42]. However, results of A. sachalinensis might be biased by the strong age and growth differences of urban and rural trees, since no sampled urban tree was older than 47 years (planted around 1970–1975). Trees of the category “before 1960” were only rural trees, which illustrated a lower growth rate than urban trees. The different age of the trees was included in the model performance, though the great difference might still bias the results slightly.
In total, the results of tree growth in Sapporo follow the overall worldwide trend [17] found for trees in metropolises, which describes an enhanced growth of urban trees, possibly induced by a longer growing period, higher CO2-concentrations and warmer temperatures compared to rural sites [15,41,64]. The accelerated growth of urban trees was most pronounced for the boreal zone. Urban trees of this zone, possibly gain most by higher temperatures, by higher nutrient inputs and by prolonged growing periods, especially when further water availability is sufficient [17]. An extended growing period by climate change, though, will not affect A. sachalinensis, as much as it might affect other deciduous species. Since A. sachalinensis is a coniferous species, it can use photosynthesis throughout the whole year, and much longer than deciduous species anyway. Guardans [2], on the other hand, described an increased climate change and environmental pollution sensitivity of trees in the boreal area due to temperature and water stress. This was also found by Rötzer, et al. [65] for urban trees in temperate cities. Due to the relative high precipitation amounts in Sapporo with more than 1000 mm per year, though, this pollution sensitivity to temperature and water stress might not be true for A. sachalinensis. Moreover, correlating radial growth of this species with precipitation and a climate index, the de Martonne-index revealed a negative effect of increased precipitation on growth. Similarly, higher temperatures were negatively correlated with growth as well. Together with a negative influence of a higher de Martonne-index, it seems that possibly, a high water-availability and warmer temperatures have surprisingly negative effects on growth, albeit correlation coefficients were low (R2 < 0.4). As this species is adapted to cold boreal climate zones, the negative relationship with temperature seems likely. Moreover, Temperate Plants Database [66] and Chittendon [44] described A. sachalinensis as a species growing well on moist soils, but it is, however, sensitive to water logging. If soils are not well-drained, growth and vitality declines might follow. Since high run-off rates are typical for urban soils, a stronger waterlogging effect during the snow melting season in rural areas could occur.
In summary, neither a prolonged growing season, nor higher temperatures induced the better growth of urban trees. A further correlation with environmental pollution revealed that NOX, SO2, CO and NO2 had strong positive effects on urban tree growth. Only with OX, a negative correlation was found. Related to Figure 7, SO2 is originated from diesel cars with the use of relatively low-quality gas, and its trend is similar to the emission of NO gas. These (SOX and NO) decreases were accompanied by an increase in O3. This O3 is partly provided from transboundary O3 from windward regions [47]. Firs growing in Japan, such as Abies sp., were classified as mid-tolerant tree species in terms of elevated O3, among 25 tree seedlings, through a big size screening text with Open Top Chambers [46,47]. The fir especially, is sensitive at the needle flushing time of mid-April to early May, when O3 concentration usually reaches 50–70 ppb. Several studies reported a negative effect of ozone concentrations to tree growth [47,67,68,69,70]. Due to photosynthesis inhibition found for street trees [71], later bud break times and reduced leafs per bud were found for F. crenata Blume [47,72]. Moreover, these findings overlap with the results of Gregg, et al. [73], who described a strong negative effect of ozone concentration on the growth of clonal poplar. A reduced ozone exposure at urban sites was stated as reason for better growth of urban plants compared to higher ozone concentration and reduced growth of rural plants [73].
However, a decrease in environmental pollution in Sapporo was found during past years, though OX was increasing. Therefore, a monitoring of A. sachalinensis in future will provide further insights. The bias by the age differences of the urban trees in urban and rural surroundings might then be excluded, and the influence of atmospheric concentrations and risks of waterlogging could be analyzed in more detail.

5. Conclusions

A. sachalinensis trees in Sapporo, northern Japan showed distinct growth patterns related to their growing site. Very old rural trees had lower growth rates than younger urban trees. Moreover, an enhanced growth of trees during past years was found. Growth relationships with environmental pollutions were mainly positive. Only OX seemed to be a major cause of reduced rural tree growth, possibly together with higher tendencies of waterlogged soils, though this was not analyzed in our study. In total, environmental pollution and warmer temperatures, as well as further growing conditions at urban sites (e.g., small planting pits and compacted soils) did not affect tree growth as negatively as could be expected.

Author Contributions

H.P., T.R, E.U. and P.B. conceptualized the experiment. T.R., M.U., L.Q. and T.K. collected the data and provided help with obtaining permission. P.B. invented the statistical analysis. A.M.-R. analyzed the data and wrote the manuscript. All authors provided editorial advice and participated in the review process.

Funding

This research was funded by the AUDI Environmental Foundation for funding this study (project 5101954: “Reaktionskinetik von Bäumen unter Klimaveränderungen”—“Reaction kinetics of trees under climate change”).

Acknowledgments

All contributors thank the municipal authority of Sapporo and Field Science Center for Northern Biosphere of Hokkaido University, Japan, for supporting the search for the trees and the permission to measure and core the trees.

Conflicts of Interest

The authors declare no conflict of interest.

References

  1. De Bauer, L.I.; Krupa, S.V. The Valley of Mexico: Summary of Observational Studies on its Air Quality and Effects on Vegetation. Environ. Pollut. 1990, 65, 109–118. [Google Scholar] [CrossRef]
  2. Guardans, R. Estimation of climate change influence on the sensitivity of trees in Europe to air pollution concentrations. Environ. Sci. Policy 2002, 5, 319–333. [Google Scholar] [CrossRef]
  3. Juknys, R.; Vencloviene, J.; Stravinskiene, V.; Augustaitis, A.; Bartkevicius, E. Scots pine (Pinus sylvestris L.) growth and condition in a polluted environment: From decline to recovery. Environ. Pollut. 2003, 125, 205–212. [Google Scholar] [CrossRef]
  4. Kint, V.; Aertsen, W.; Campioli, M.; Vansteenkiste, D.; Delcloo, A.; Muys, B. Radial growth change of temperate tree species in response to altered regional climate and air quality in the period 1901–2008. Clim. Chang. 2012, 115, 343–363. [Google Scholar] [CrossRef]
  5. Legge, A.H.; Jager, H.J.; Krupa, S.V. Sulfur dioxide. In Recognition of Air Pollution Injury to Vegetation: A Pictorial Atlas; Flagler, R., Ed.; Air and Waste Management Association: Pittsburgh, PA, USA, 1999; pp. 3/1–3/42. [Google Scholar]
  6. Lorenz, M.; Clarke, N.; Paoletti, E.; Bytnerowicz, A.; Grulke, N.; Lukina, N.; Sase, H.; Staelens, J. Air pollution impacts on forests in changing climate. In Forest and Society–Responding to Global Drivers of Change; IUFRO World Series; Mery, G.E.A., Ed.; International Union of Forest Research Organizations: Vienna, Austria, 2010; pp. 55–74. [Google Scholar]
  7. Scharnweber, T.; Manthey, M.; Criegee, C.; Bauwe, A.; Schroder, C.; Wilmking, M. Drought matters—Declining precipitation influences growth of Fagus sylvatica L. and Quercus robur L. in north-eastern Germany. For. Ecol. Manag. 2011, 262, 947–961. [Google Scholar] [CrossRef]
  8. Dittmar, C.; Zech, W.; Elling, W. Growth variations of common beech (Fagus sylvatica L.) under different climatic and environmental conditions in Europe—a dendroecological study. For. Ecol. Manag. 2003, 173, 63–78. [Google Scholar] [CrossRef]
  9. Penninckx, V.; Meerts, P.; Herbauts, J.; Gruber, W. Ring width and element concentrations in beech (Fagus sylvatica L.) from a periurban forest in central Belgium. For. Ecol. Manag. 1999, 113, 23–33. [Google Scholar] [CrossRef]
  10. Chappelka, A.H.; Grulke, N. Disruption of the ‘disease triangle’ by chemical and physical environmental change. Plant Biol. 2016, 18, 5–12. [Google Scholar] [CrossRef]
  11. Innes, J.L. Forest Health: Its Assessment and Status; CAB International Publishers: Oxon, UK, 1993. [Google Scholar]
  12. Bytnerowicz, A.; Omasa, K.; Paoletti, E. Integrated effects of air pollution and climate change on forests: A northern hemisphere perspective. Environ. Pollut. 2007, 147, 438–445. [Google Scholar] [CrossRef]
  13. Spiecker, H.; Mielikäinen, K.; Kölh, M.; Skovsgaard, J.P. Growth Trends in European Forests: Studies from 12 Countries; Springer: Berlin, Germany, 1996. [Google Scholar]
  14. Fang, J.; Kato, T.; Guo, Z.; Yang, Y.; Hu, H.; Shen, H.; Zhao, X.; Kisimoto-Mo, A.W.; Tang, Y.; Houghton, R.A. Evidence for environmentally enhanced forest growth. Proc. Natl. Acad. Sci. USA 2014, 111, 9527–9532. [Google Scholar] [CrossRef] [Green Version]
  15. Churkina, G.; Zaehle, S.; Hughes, J.; Viovy, N.; Chen, Y.; Jung, M.; Heumann, B.W.; Ramankutty, N.; Heimann, M.; Jones, C. Interactions between nitrogen deposition, land cover conversion, and climate change determine the contemporary carbon balance of Europe. Biogeosciences 2010, 7, 2749–2764. [Google Scholar] [CrossRef] [Green Version]
  16. Pretzsch, H.; Biber, P.; Schütze, G.; Uhl, E.; Rötzer, T. Forest stand growth dynamics in Central Europe have accelerated since 1870. Nat. Commun. 2014, 5 (Suppl. 1), 4967. [Google Scholar] [CrossRef] [PubMed] [Green Version]
  17. Pretzsch, H.; Biber, P.; Uhl, E.; Dahlhausen, J.; Schütze, G.; Perkins, D.; Rötzer, T.; Caldentey, J.; Koike, T.; van Con, T.; et al. Climate change accelerates growth of urban trees in metropolises worldwide. Sci. Rep. 2017, 7, 1–10. [Google Scholar] [CrossRef] [PubMed]
  18. Rötzer, T.; Biber, P.; Moser, A.; Schäfer, C.; Pretzsch, H. Stem and root diameter growth of European beech and Norway spruce under extreme drought. For. Ecol. Manag. 2017, 406, 184–195. [Google Scholar] [CrossRef]
  19. Piovesan, G.; Biondi, F.; Di Filippo, A.; Alessandrini, A.; Maugeri, M. Drought-driven growth reduction in old beech (Fagus Sylvatica L.) forests of the central Apennines, Italy. Glob. Chang. Biol. 2008, 14, 1265–1281. [Google Scholar] [CrossRef]
  20. Alaimo, M.G.; Lipani, B.; Lombardo, M.G.; Orecchio, S.; Turano, M.; Melati, M.R. The mapping of stress in the predominant plants in the city of Palermo by lead dosage. Aerobiología 2000, 16, 47–54. [Google Scholar] [CrossRef]
  21. Baycu, G.; Tolunay, D.; Özden, H.; Günebakan, S. Ecophysiological and seasonal variations in Cd, Pb, Zn, and Ni concentrations in the leaves of urban deciduous trees in Istanbul. Environ. Pollut. 2006, 143, 545–554. [Google Scholar] [CrossRef]
  22. Bhatti, G.H.; Iqbal, M.Z. Investigations into the effect of automobile exhausts on the phenology, periodicity and productivity of some roadside trees. Acta Soc. Bot. Pol. 1988, 57, 395–399. [Google Scholar] [CrossRef]
  23. Koike, T.; Watanabe, M.; Hoshika, Y.; Kitao, M.; Matumura, H.; Funada, R.; Izuta, T. Effects of ozone and forest ecosystems in East and Southeast Asia. Dev. Environ. Sci. 2013, 13, 371–390. [Google Scholar]
  24. Pourkhabbaz, A.; Rastin, N.; Olbrich, A.; Langenfeld-Heyser, E.; Polle, A. Influence of Environmental Pollution on Leaf Properties of Urban Plane Trees, Platanus orientalis L. Bull. Environ. Contam. Toxicol. 2010, 85, 251–255. [Google Scholar] [CrossRef]
  25. Izuta, T. Air Pollution Impacts on Plants in East Asia; Springer: Tokyo, Japan, 2017. [Google Scholar]
  26. Joshi, P.C.; Abhishek, S. Physiological responses of some tree species under roadside automobile pollution stress around city of Haridwar, India. Environmentalist 2007, 27, 365–374. [Google Scholar] [CrossRef]
  27. Pandey, J.; Agrawal, M. Evaluation of air pollution phytotoxicity in a seasonally dry tropical urban environment using three woody perennials. New Phytol. 1994, 126, 53–61. [Google Scholar] [CrossRef]
  28. Williams, R.J.H.; Lloyd, M.M.; Ricks, G.R. Effects of atmospheric pollution on deciduous woodland I: Some effects on leaves of Quercus petraea (Mattuschka) Leibl. Environ. Pollut. 1971, 2, 57–68. [Google Scholar] [CrossRef]
  29. Kozlowski, T.T. The impact of environmental pollution on shade trees. J. Arboric. 1986, 12, 29–37. [Google Scholar]
  30. Moser, A.; Rötzer, T.; Pauleit, S.; Pretzsch, H. Structure and ecosystem services of small-leaved lime (Tilia cordata Mill.) and black locust (Robinia pseudoacacia L.) in urban environments. Urban For. Urban Green. 2015, 14, 1110–1121. [Google Scholar] [CrossRef]
  31. Morgenroth, J.; Buchan, G.D. Soil moisture and aeration beneath pervious and impervious pavements. Arboric. Urban For. 2009, 35, 135–141. [Google Scholar]
  32. Bühler, O.; Kristoffersen, P.; Larsen, S.U. Growth of Street Trees in Copenhagen With Emphasis on the Effect of Different Establishment Concepts. Arboric. Urban For. 2007, 5, 330–337. [Google Scholar]
  33. Rahman, M.A.; Stringer, P.; Ennos, A.R. Effect of Pit Design and Soil Composition on Performance of Pyrus calleryana Street Trees in the Establishment Period. Arboric. Urban For. 2013, 39, 256–266. [Google Scholar]
  34. Akbari, H.; Pomerantz, M.; Taha, H. Cool surfaces and shade trees to reduce energy use and improve air quality in urban areas. Sol. Energy 2001, 70, 295–310. [Google Scholar] [CrossRef]
  35. Beatty, R.A.; Heckman, C.T. Survey of urban tree programs in the United States. Urban Ecol. 1981, 5, 81–102. [Google Scholar] [CrossRef]
  36. Rodríguez Martín, J.A.; De Arana, C.; Ramos-Miras, J.J.; Gil, C.; Boluda, R. Impact of 70 years urban growth associated with heavy metalpollution. Environ. Pollut. 2015, 196, 156–163. [Google Scholar] [CrossRef] [PubMed]
  37. Escobedo, F.J.; Nowak, D.J. Spatial heterogeneity and air pollution removal by an urban forest. Landsc. Urban Plan. 2009, 90, 102–110. [Google Scholar] [CrossRef]
  38. Ding, H.; Pretzsch, H.; Schütze, G.; Rötzer, T. Size dependency of tree growth response to drought among Norway spruce and European beech individuals in monospecific and mixed-species stands. Plant Biol. 2017. [Google Scholar] [CrossRef] [PubMed]
  39. Köppen, W.; Geiger, G. Handbuch der Klimatologie; Gebrüder Borntraeger: Berlin, Germany, 1930–1939. [Google Scholar]
  40. Peel, M.C.; Finlayson, B.L.; McMahon, T.A. Updated world map of the Köppen-Geiger climate classification. Hydrol. Earth Syst. Sci. 2007, 11, 1633–1644. [Google Scholar] [CrossRef]
  41. Chmielewski, F.M.; Rötzer, T. Response of tree phenology to climate change across Europe. Agric. For. Meteorol. 2001, 108, 101–112. [Google Scholar] [CrossRef]
  42. Moser, A.; Uhl, E.; Rötzer, T.; Biber, P.; Dahlhausen, J.; Lefer, B.; Pretzsch, H. Effects of Climate and the Urban Heat Island Effect on Urban Tree Growth in Houston. Open J. For. 2017, 7, 428–445. [Google Scholar] [CrossRef] [Green Version]
  43. De Martonne, E. Une novelle fonction climatologique: L’indice d’aridité. La Météorol. 1926, 21, 449–458. [Google Scholar]
  44. Chittendon, F. RHS Dictionary of Plants Plus Supplement; Oxford University Press: Oxford, UK, 1951–1956. [Google Scholar]
  45. Matsuda, K.; Shibuya, M.; Koike, T. Maintenance and rehabilitation of the mixed conifer-broadleaf forests in Hokkaido, northern Japan. Eur. J. For. Res. 2002, 5, 119–130. [Google Scholar]
  46. Sugai, T.; Kitao, M.; Watanabe, T.; Koike, T. Can needle nitrogen content explain the interspecific difference in ozone sensitivities of photosynthesis between Japanese larch (Larix kaempferi) and Sakhalin fir (Abies sachalinensis)? Photosynthetica 2019, 57, 540–547. [Google Scholar] [CrossRef]
  47. Yamaguchi, M.; Watanabe, M.; Matsumura, H.; Kohno, Y.; Izuta, T. Experimental studies on the effects of ozone on growth and photosynthetic activity of Japanese forest tree species. Asian J. Atmos. Environ. 2011, 5, 65–67. [Google Scholar] [CrossRef]
  48. Zhang, D.; Katsuki, T.; Rushforth, K. Abies sachalinensis. IUCN 2013. [Google Scholar] [CrossRef]
  49. Cook, E.R.; Briffa, K.R.; Meko, D.M.; Graybill, D.A.; Funkhouser, G. The “segment length curse” in long tree-ring chronology development for palaeoclimatic studies. Holocene 1995, 5, 229–237. [Google Scholar] [CrossRef]
  50. Fritts, H.C. Tree Rings and Climate; Academic Press: London, UK; New York, NY, USA; San Francisco, CA, USA, 1976. [Google Scholar]
  51. Schweingruber, F.H. Tree Rings. Basics and Applications of Dendrochronology; D. Reidel Publishing Company: Dordrecht, The Netherlands, 1988. [Google Scholar]
  52. Bunn, A. Dendrochronology Program Library in R. Dendrochronologia 2015, 26, 115–124. [Google Scholar] [CrossRef]
  53. R Core Team. R: A Language and Environment for Statistical Computing; R Foundation for Statistical Computing: Vienna, Austria, 2019. [Google Scholar]
  54. Nowak, D.J.; Kuroda, M.; Crane, D.E. Tree mortality rates and tree population projections in Baltimore, Maryland, USA. Urban For. Urban Green. 2004, 2, 139–147. [Google Scholar] [CrossRef] [Green Version]
  55. Skiera, B.; Moll, G. The sad state of city trees. Am. For. (March/April) 1992, 98, 61–64. [Google Scholar]
  56. Hiura, T.; Sano, J.; Konno, Y. Age structure and response to fine-scale disturbances of Abies sachalinensis, Picea jezoensis, Picea glehnii, and Betula ermanii growing under the influence of a dwar bamboo understory in northern Japan. Can. J. For. Res. 1996, 26, 289–297. [Google Scholar] [CrossRef]
  57. Pretzsch, H. Modellierung des Waldwachstums; Parey Buchverlag, Blackwell Wissenschafts-Verlag GmbH: Berlin, Germany, 2001. [Google Scholar]
  58. Hasenauer, H. Dimensional relationship of open-grown trees in Austria. For. Ecol. Manag. 1997, 96, 197–206. [Google Scholar] [CrossRef]
  59. Umeki, K. Growth characteristics of six tree species on Hokkaido Island, northern Japan. Ecol. Res. 2001, 16, 435–450. [Google Scholar] [CrossRef]
  60. Peper, P.J.; McPherson, E.G.; Mori, S.M. Predictive equations for dimensions and leaf area of coastal Southern California street trees. J. Arboric. 2001, 27, 169–180. [Google Scholar]
  61. Schweingruber, F.H. Tree Rings and Environment; Swiss Federal Institute for Forest, Snow and Landscape Research: Birmensdorf, Switzerland, 1996. [Google Scholar]
  62. Funakoshi, S. Shoot growth and winter bud formation in Abies sachalinensis MAST. Res. Bull. Coll. Exp. For. Hokkaido Univ. 1985, 42, 785–808. [Google Scholar]
  63. Moser, A.; Uhl, E.; Rötzer, T.; Biber, P.; Caldentey, J.M.; Pretzsch, H. Effects of climate trends and drought events on urban tree growth in Santiago de Chile. Cienc. Investig. Agrar. 2018, 45, 35–50. [Google Scholar] [CrossRef] [Green Version]
  64. IPCC. Synthesis Report; Cambridge University Press: Cambridge, UK, 2014. [Google Scholar]
  65. Rötzer, T.; Rahman, F.; Moser, A.; Pauleit, S.; Pretzsch, H. Process based simulation of tree growth and ecosystem services of urban trees under present and future climate conditions. Sci. Total Environ. 2019, 676, 651–664. [Google Scholar] [CrossRef] [PubMed]
  66. Temperate Plants Database. Ken Fern. Temperate.Theferns.info. Available online: http://temperate.theferns.info/plant/Taraxacum+officinale (accessed on 8 April 2019).
  67. Aihara, K.; Aso, T.; Takeda, M.; Koshiji, T. Actual condition of forest decline and approach (II) The phenomena of forest decline at Tanzawa Mountain in Kanagawa (in Japanese) prefecture. J. Jpn. Soc. Atmos. Environ. Plan. A 2004, 39, A29–A39. [Google Scholar]
  68. Kohno, Y.; Matsumura, H.; Ishii, T.; Izuta, T. Establishing critical levels of air pollutants for protecting East Asian vegetation—A challenge. In Plant Responses to Air Pollution and Global Change; Omasa, K., Nouchi, I., De Kok, L.J., Eds.; Springer: Tokyo, Japan, 2005; pp. 243–250. [Google Scholar]
  69. Kume, A.; Numata, S.; Watanabe, K.; Honoki, H.; Nakajima, H.; Ishida, M. Influence of air pollution on the mountain forests along the Tateyama-Kurobe Alpine route. Ecol. Res. 2009, 24, 821–830. [Google Scholar] [CrossRef]
  70. Takeda, M.; Aihara, K. Effects of ambient ozone concentrations on beech (Fagus crenanta) seedlings in the Tanzawa Mountains, Kanagawa Prefecture, Japan (in Japanese with English summary). J. Jpn. Soc. Atmos. Environ. 2007, 42, 1007–1117. [Google Scholar]
  71. Furukawa, A. Inhibition of photosynthesis of Populus euramericana and Helianthus annuus by SO2, NO2 and O3. Ecol. Res. 1991, 6, 79–86. [Google Scholar] [CrossRef]
  72. Yonekura, T.; Yoshidome, M.; Watanabe, M.; Honda, Y.; Ogiwara, I.; Izuta, T. Carry-over effects of ozone and water stress on leaf phenological characteristics and bud frost hardiness of Fagus crenata seedlings. Trees 2004, 18, 581–588. [Google Scholar] [CrossRef]
  73. Gregg, J.W.; Jones, C.G.; Dawson, T.E. Urbanization effects on tree growth in the vicinity of New York City. Nature 2003, 424, 183–187. [Google Scholar] [CrossRef] [PubMed]
Figure 1. Average precipitation sums in mm and average annual temperature in °C from 1983 to 2012 in Sapporo, Japan provided by the Japan Meteorological Agency.
Forests 10 00707 g001
Figure 2. Minimum and maximum (dashed lines), as well as means with added standard error of environmental pollution data in six time periods (1983–1987, 1988–1992, 1993–1997, 1998–2002, 2003–2007 and 2008–2012) of several weather stations across the city of Sapporo. Given are the best fitting regression lines with regression coefficients and coefficients of determination R2.
Forests 10 00707 g002
Figure 3. Sample sites of Abies sachalinensis within the city of Sapporo; the symbols * denotes approximately the locations of climate stations across Sapporo.
Forests 10 00707 g003
Figure 4. Radius growth, RG (a), indexed growth values, ring-width indices (RWI) (b), and basal area increments, BAI (c), of all sampled A. sachalinensis trees in Sapporo.
Forests 10 00707 g004
Figure 5. Radius growth, RG (a), indexed growth values RWI (b) and basal area increments BAI (c) with standard error bars for each value of A. sachalinensis trees sampled in rural, suburban and urban areas of Sapporo.
Forests 10 00707 g005
Figure 6. The growth in size in terms of basal area growth of A. sachalinensis in Sapporo and for worldwide urban trees [17] for (a) the period before 1960 compared with the period since 1960 and (b) urban trees compared with rural growing trees.
Forests 10 00707 g006
Figure 7. Relationships of mean environmental pollution (NOX, NO2, SO2, OX, CO) and mean climate data (temperature, precipitation, de Martonne-Index) with average radial growth of A. sachalinensis in Sapporo, Japan in five-year time steps from 1983 to 2012 and an added regression line with regression coefficients and adjusted R2..
Forests 10 00707 g007
Table 1. Environmental pollution (nitrogen dioxide: NO2; oxides: OX; sulfur dioxide: SO2; and nitrous gases: NOX) and climate data of several weather stations across Sapporo, Japan from 1983 to 2012, and variance from the mean value (+ higher than mean, – lower than mean). Added * to station name means suburb or closest to a green area (e.g., near an agriculture field, forested park or reserved forests).
StationNO2 Ox SO2 NOx Temperature
Atsubetsu-SE*21.9+29.4+3.238.79.1+
EastDistrict21.1+25.35.9+36.88.6+
Fushimi-SW18.526.0- 31.08.6+
Hassamu-NW*16.928.0+4.226.28.6+
Higashi 18-chome25.4+- - 54.6+-
HigashiEast*15.729.0+3.923.87.7
Kita-19-jyo19.4- - 35.2-
Kita-1-jyo35.0+- - 85.0+-
Kita-Shiroishi-E18.228.1+1.028.68.8+
MiddlePart26.9+17.76.9+50.5+-
Minami-14-jyo22.4+- - 47.7+-
MinamiS9.1- - 11.8-
ShinoroN*13.128.5+3.919.98.0
Teine*19.325.84.334.48.5
TsukisamuChuoS*28.4+- - 77.1+-
WestDistrict21.8+24.76.3+37.58.8+
Yamahana- 33.0+- - 9.1+
mean20.8 26.9 4.4 39.9 8.6
Table 2. Characteristics and soil chemical structure (nitrogen N, available phosphorus P content by the Bray ll method, potassium K, calcium Ca and magnesium Mg) at a depth of 10–20 cm, as well as bulk density of sample plots within Sapporo and its vicinity.
PlotNameClassificationN [mg/g]P [mg/g]K [μg/g]Ca [mg/g]Mg [mg/g]Compaction [kg/m3]
1Shirahata-yama 1rural2.024.23148.00--0.50
2Shirahata- yama 2rural2.116.81182.00--0.50
3Hokkaoido University Nurseryurban3.071.89152.002.440.230.55
4Hitsujigaoka-7 1suburban3.021.69345.001.880.220.52
5Hitsujigaoka-7 2suburban3.782.33360.00--0.60
6Misumairural2.981.98288.003.310.450.59
Table 3. Number of sampled trees per plot n with urbanity classification (urban, suburban, rural) and tree characteristics (age, dbh, tree height, crown start, crown diameter, crown projection area CPA, crown length and crown volume) of A. sachalinensis in Sapporo, Japan.
PlotClassificationnAge [a]Dbh
[cm]
Tree Height [m]Crown Start [m]Crown Diameter [m]CPA [m2]Crown Length [m]Crown Volume [m3]
1rural2047.3 ± 13.4232.8 ± 6.817.9 ± 1.66.3 ± 2.45.5 ±
8.1
100.0 ± 207.711.6 ± 16.11161.5 ± 2382.3
2rural1598.6 ± 23.249.1 ± 14.524.3 ± 3.67.3 ± 3.88.7 ±
2.4
253.6 ± 137.116.9 ± 4.74616.6 ± 3480.3
3urban1840.4 ± 6.328.5 ± 4.615.2 ± 2.03.5 ± 1.54.9 ±
1.1
78.4 ± 35.911.7 ± 2.5958.6 ± 529.1
4suburban2132.2 ± 3.326.2 ± 2.915.3 ± 1.06.0 ± 2.05.2 ±
0.9
86.6 ± 33.49.3 ± 2.3823.3 ± 415.9
5suburban2035.3 ± 3.227.7 ± 2.816.0 ± 1.17.9 ± 1.44.5 ±
0.8
65.6 ± 19.98.1 ± 1.6543.1 ± 219.5
6rural15100.0 ± 64.141.9 ± 12.117.9 ± 2.46.4 ± 2.96.5 ±
1.5
138.1 ± 66.911.6 ± 2.91628.3 ± 1006.0
Table 4. Tree structures (age, dbh, tree height, crown start, crown diameter, crown projection area cpa, crown length and crown volume) of A. sachalinensis of measured urban, suburban and rural trees with tested differences between categories. Different letters indicate significant differences found by one-way Kruskal–Wallis test and following a post-hoc test; n = number of sampled trees.
SitenAge [a]Dbh [cm]Tree Height [m]Crown Start [M]Crown Diameter [M]CPA [m2]Crown Length [m]Crown Volume [m3]
urban1840.4 a ± 6.328.5 a
± 4.6
15.2 a
± 2.0
3.5 a
± 1.5
4.9 a
± 1.1
78.4 a
± 35.9
11.7 a
± 2.5
958.6 a
± 529.1
suburban4334.4 a ± 2.226.5 a
± 2.9
15.6 a
± 1.1
7.0 ab
± 2.0
4.8 a
± 0.9
76.1 a
± 29.2
8.6 b
± 2.1
678.5 b
± 359.7
rural5082.0 b ± 30.0340.4 b
± 12.9
19.8 b
± 3.9
6.6 b
± 3.8
6.7 b
± 2.2
157.5 b
± 86.6
13.2 a
± 4.1
2338.1 b
± 1874.2
Table 5. Mean radius growth rate [mm/yr], mean sensitivity and autocorrelation (autoregressive, AR) of urban, suburban and rural chronologies, as well as for the overall mean chronology of A. sachalinensis in Sapporo, Japan for their total period of growth.
ChronologyGrowth RateMean Sens.AR
Urban4.220.230.33
Suburban4.210.190.51
Rural3.460.210.68
overall3.880.200.56
Table 6. Results of the linear mixed model on the annual basal area increment (mm2 yr−1) of all analyzed trees (response variable) with the individual tree coded as random effect, and the fixed effects were log (age), time of growth (period before 1960 and period since 1960) and their interaction.
ParameterFixed EffectValue ± SEp
aIntercept−13.14 ± 0.66<0.001
Log (ageij)Log (age)2.67 ± 0.04<0.001
timeijTime of growth−0.15 ± 0.140.26
b × timeij × log(ageij)Log (age) × Time of growth0.12 ± 0.04<0.001
Random effect dij1.07-
ε0.32-
Levels of Time of growth: 2 (Before 1960 and Since 1960).
Table 7. Results of the linear mixed model on the annual basal area increment (mm2 yr−1) of all analyzed trees (response variable) with the individual tree code as random effect. The fixed effects are log (age), the grade of urbanity (urban and rural) and their interaction.
ParameterFixed EffectValue ± SEp
aIntercept−14.58 ± 0.15<0.001
Log (ageij)Log (age)2.94 ± 0.02<0.001
urbijUrbanity1.79 ± 0.20<0.001
b × urbij × log (ageij)Log (age) × Urbanity−0.14 ± 0.02<0.001
Random effect dij0.82-
ε0.32-
Levels of Urbanity: 2 (Rural and Urban).

