Article

Optimizing the Stand Density of Robinia pseudoacacia L. Forests of the Loess Plateau, China, Based on Response to Soil Water and Soil Nutrient

1
College of Soil and Water Conservation, Beijing Forestry University, Beijing 100083, China
2
Forest Ecosystem Studies, National Observation and Research Station, Jixian 042200, China
3
Beijing Collaborative Innovation Centre for Eco-Environmental Improvement with Forestry and Fruit Trees, Beijing 100096, China
4
Key Laboratory of State Forestry Administration on Soil and Water Conservation, Beijing Forestry University, Beijing 100083, China
5
Beijing Engineering Research Centre of Soil and Water Conservation, Beijing Forestry University, Beijing 100083, China
6
Engineering Research Centre of Forestry Ecological Engineering, Ministry of Education, Beijing Forestry University, Beijing 100083, China
*
Author to whom correspondence should be addressed.
Forests 2019, 10(8), 663; https://doi.org/10.3390/f10080663
Submission received: 6 July 2019 / Revised: 28 July 2019 / Accepted: 5 August 2019 / Published: 6 August 2019
(This article belongs to the Section Forest Ecology and Management)

Abstract

:
Improving low-efficiency artificial forests represents a popular forest hydrological issue, and exploring the optimal stand density (OSD) of low-efficiency artificial forests is an effective method for improving the soil conditions of forestland to prevent the deterioration of ecological function. Water and nutrients were the main limiting factors for vegetation growth. However, relatively few studies addressed the optimization of stand density based on these two factors at the same time. In this study, a total of 176 standard plots (20 × 20 m2) with six stand densities (~500, ~1000, ~1500, ~2000, ~2500 and ~3000 plants·hm−2) were established to investigate the water resources (soil moisture content (SMC), soil evaporation rate (SER), and vegetation transpiration rate (VTR)) and soil nutrient resources (total nitrogen (TN), total phosphorus (TP), total potassium (TK), calcium (CaCO3), organic matter content (OMC)) in low-efficiency Robinia pseudoacacia forestland on the Loess Plateau in western Shanxi, China from June to September each year from 2017 to 2018. The relationships between stand density and water and nutrient resources were analysed with the response surface method (RSM). The RSM results indicated that the OSD averaged 1594 plants·hm−2 and ranged from 940 to 2386 plants·hm−2. The percentage of standard plots with an unreasonable stand density was 35.29%, and 65% of these plots had a value that was higher than the maximum in the range while 35% had a value that was lower than the minimum. These results indicate that the current stand density should be manipulated to fall within the identified OSD range to ensure the normal functions of soil and water conservation in R. pseudoacacia forests. The results of this study serve as a guide for optimizing the stand density of low-efficiency R. pseudoacacia forests in China.

1. Introduction

Rainfall and soil moisture present significant responses to the arid climate conditions in arid and semiarid zones, which have fragile ecological environments [1,2]. For example, when the wet season is delayed, a sharp drop in surface soil moisture content occurs and also the underground water level decreases in that year [3]. The gradual increase in drought conditions leads to changes in the soil characteristics of the forested environments of plantations, and the responses in large plantations are particularly obvious [4,5]. Growth is slow and ecological functions are inefficient in existing stands because of competition for existing resources [6], and the most important ecological functions cannot be fully performed [7]. Additionally, the forest soil environment gradually deteriorated due to changes in stand characteristics [8]. Therefore, existing plantations need to be optimized to mitigate and reverse this trend of continuous low efficiency in terms of ecological function.
The Loess Plateau in western Shanxi is a typical arid and semiarid region, and exhibits some of the most serious soil erosion in China. The precipitation in this area is insufficient and unevenly distributed, and the soil moisture is often deficient [9]. Additionally, the soil is barren, the soil fertility is low, and soil and water losses are particularly problematic. Therefore, vegetation restoration in this area is very difficult. To improve the ecological environment and prevent soil erosion, a large area was successfully established for soil, water, and vegetation conservation on the Loess Plateau in 1990 [10]. Robinia pseudoacacia is a tree species with strong adaptability to different climates, and it shows heat and drought resistance and good stress resistance and is a typical fast-growing tree species. This species has certain positive effects in terms of soil erosion control and microclimate regulation; hence, it is widely used in the restoration of typical plantations in China. In particular, it was intensively promoted for vegetation restoration on the Loess Plateau in western Shanxi [11,12].
Previous studies reported that the Grain for Green (GFG) project had positive effects in terms of controlling soil erosion and water conservation. Deng [10] showed that runoff decreased and soil erosion significantly decreased because of an increase in the area of farmland-converted forestlands. When comparing the two time periods considered in the study, i.e., 2003–2007 and 1998–2002, runoff and soil erosion were reduced by 18% and 45.4%, respectively. Xin [13] also noted that the annual sediment yield was reduced by 95% from 3887.0 t·km−2·year−1 in the 1950s to 174.7 t·km−2·year−1 in the 2000s and the annual sediment discharge decreased by 597 × 106 t·year−1 from 660 × 106 from 1980–1999 to 63 × 106 in 2000–2010. Yang [14] indicated that the basin runoff reduced by 13.8% and the sediment load by 50.7% after the farmland convert to grassland and forestland in the Yanhe River basin between 2000 and 2015.The implementation of a vegetation restoration project has a significant role in promoting the control of soil and water loss.
However, with an increase in vegetation recovery duration, existing artificial forests appeared to undergo a decrease in growth, which led to low efficiency in terms of dominant ecological functions [6,15]. Previous research results suggested that the low efficiency in dominant ecological functions at existing plantations could the effects of the increasing type and frequency of human activities that alter the climate, topography, and soil environment, forest ecosystems have been changing slowly and continuously [16,17]. For example, global warming has increased in severity, which caused soil and water losses, soil water imbalances, and changes to the physical and chemical properties of the soil environment, as a result, vegetation does not grow normally and dominant ecological functions are not fully carried out in the natural environment [18,19,20]. The internal factor is mainly an unreasonable forest structure that leads to low-efficiency ecological functions [21] because the structure determines the function. Similarly, the stand structure affects the ecological functions, and the main and most important method of improving the ecological function of plantations is the optimization of forest stand structure. Indexes of stand structure can be divided into two categories: those focused on horizontal structure or vertical structure. The indexes of horizontal forest structure include the diameter at breast height, crown index, stand density, canopy density, uniform angle index, scale size ratio, and competition index; and the indexes pertaining to vertical forest structure include the tree height, leaf area index, forest layer index, and stand porosity [22]. Among these stand structure indexes, stand density affects all the other stand structure indexes. When the stand density is optimized, it will affect the other stand structure indexes, and optimizing stand density has strong manoeuvrability [23]. Therefore, optimizing the stand structure will likely optimize the stand density.
The optimization of stand density should be oriented towards improving ecosystem service functions. Most previous research focused on the optimization of stand density through the water balance principle [24,25]. Some studies considered different landform types to explore suitable stand density values for different micro-topographies [26]. Other studies optimized stand density for the control of soil erosion or forest management [27,28]. The water balance principle mainly considers the balance of water input and output, i.e., the balance between precipitation and interception by the canopy, retention by litter, surface runoff, belowground runoff, sediment runoff, soil water storage, soil water infiltration, evaporation, and vegetation transpiration [29,30]. Micro-landform type divisions mainly consider the slope, slope direction, elevation, slope position, and soil texture type because these are the main factors that reflect the moisture distribution [31,32]. Previous studies on the optimization of stand density mainly focused on moisture distribution. Furthermore, the normal growth of stands requires sufficient available water and nutrients. The soil moisture and soil nutrient content depend on site conditions; therefore, both factors reflect the suitability of the site conditions [33,34]. In addition, their spatial distributions have important effects on the optimization of stand density; however, there are relatively few studies addressing the optimization of stand density based on the relationships among these three factors. In this study, the Caijiachuan watershed of the Loess Plateau in western Shanxi was selected as the study site and R. pseudoacacia was selected as the study species to explore the relationships between stand density and water and nutrient resources in R. pseudoacacia forestland.
Accordingly, the main objectives of this study were to (1) analyse the spatial distributions of water (soil moisture content (SMC), soil evaporation rate (SER), and vegetation transpiration rate (VTR)) and nutrients (total nitrogen (TN), total phosphorus (TP), total potassium (TK), calcium (CaCO3) and organic matter content (OMC)) in R. pseudoacacia forestland based on the results of overall situation trend analysis and (2) determine the optimal stand density and its range in R. pseudoacacia forestland according to the results of a response surface analysis. We hypothesized that:
(1) The spatial distributions of soil water and soil nutrient resource affects the distribution of stand density of R. pseudoacacia forest.
(2) There are the range of optimal stand density can maintain the balance of soil water and soil nutrient resource in R. pseudoacacia forestland.

2. Materials and Methods

2.1. Experimental Design
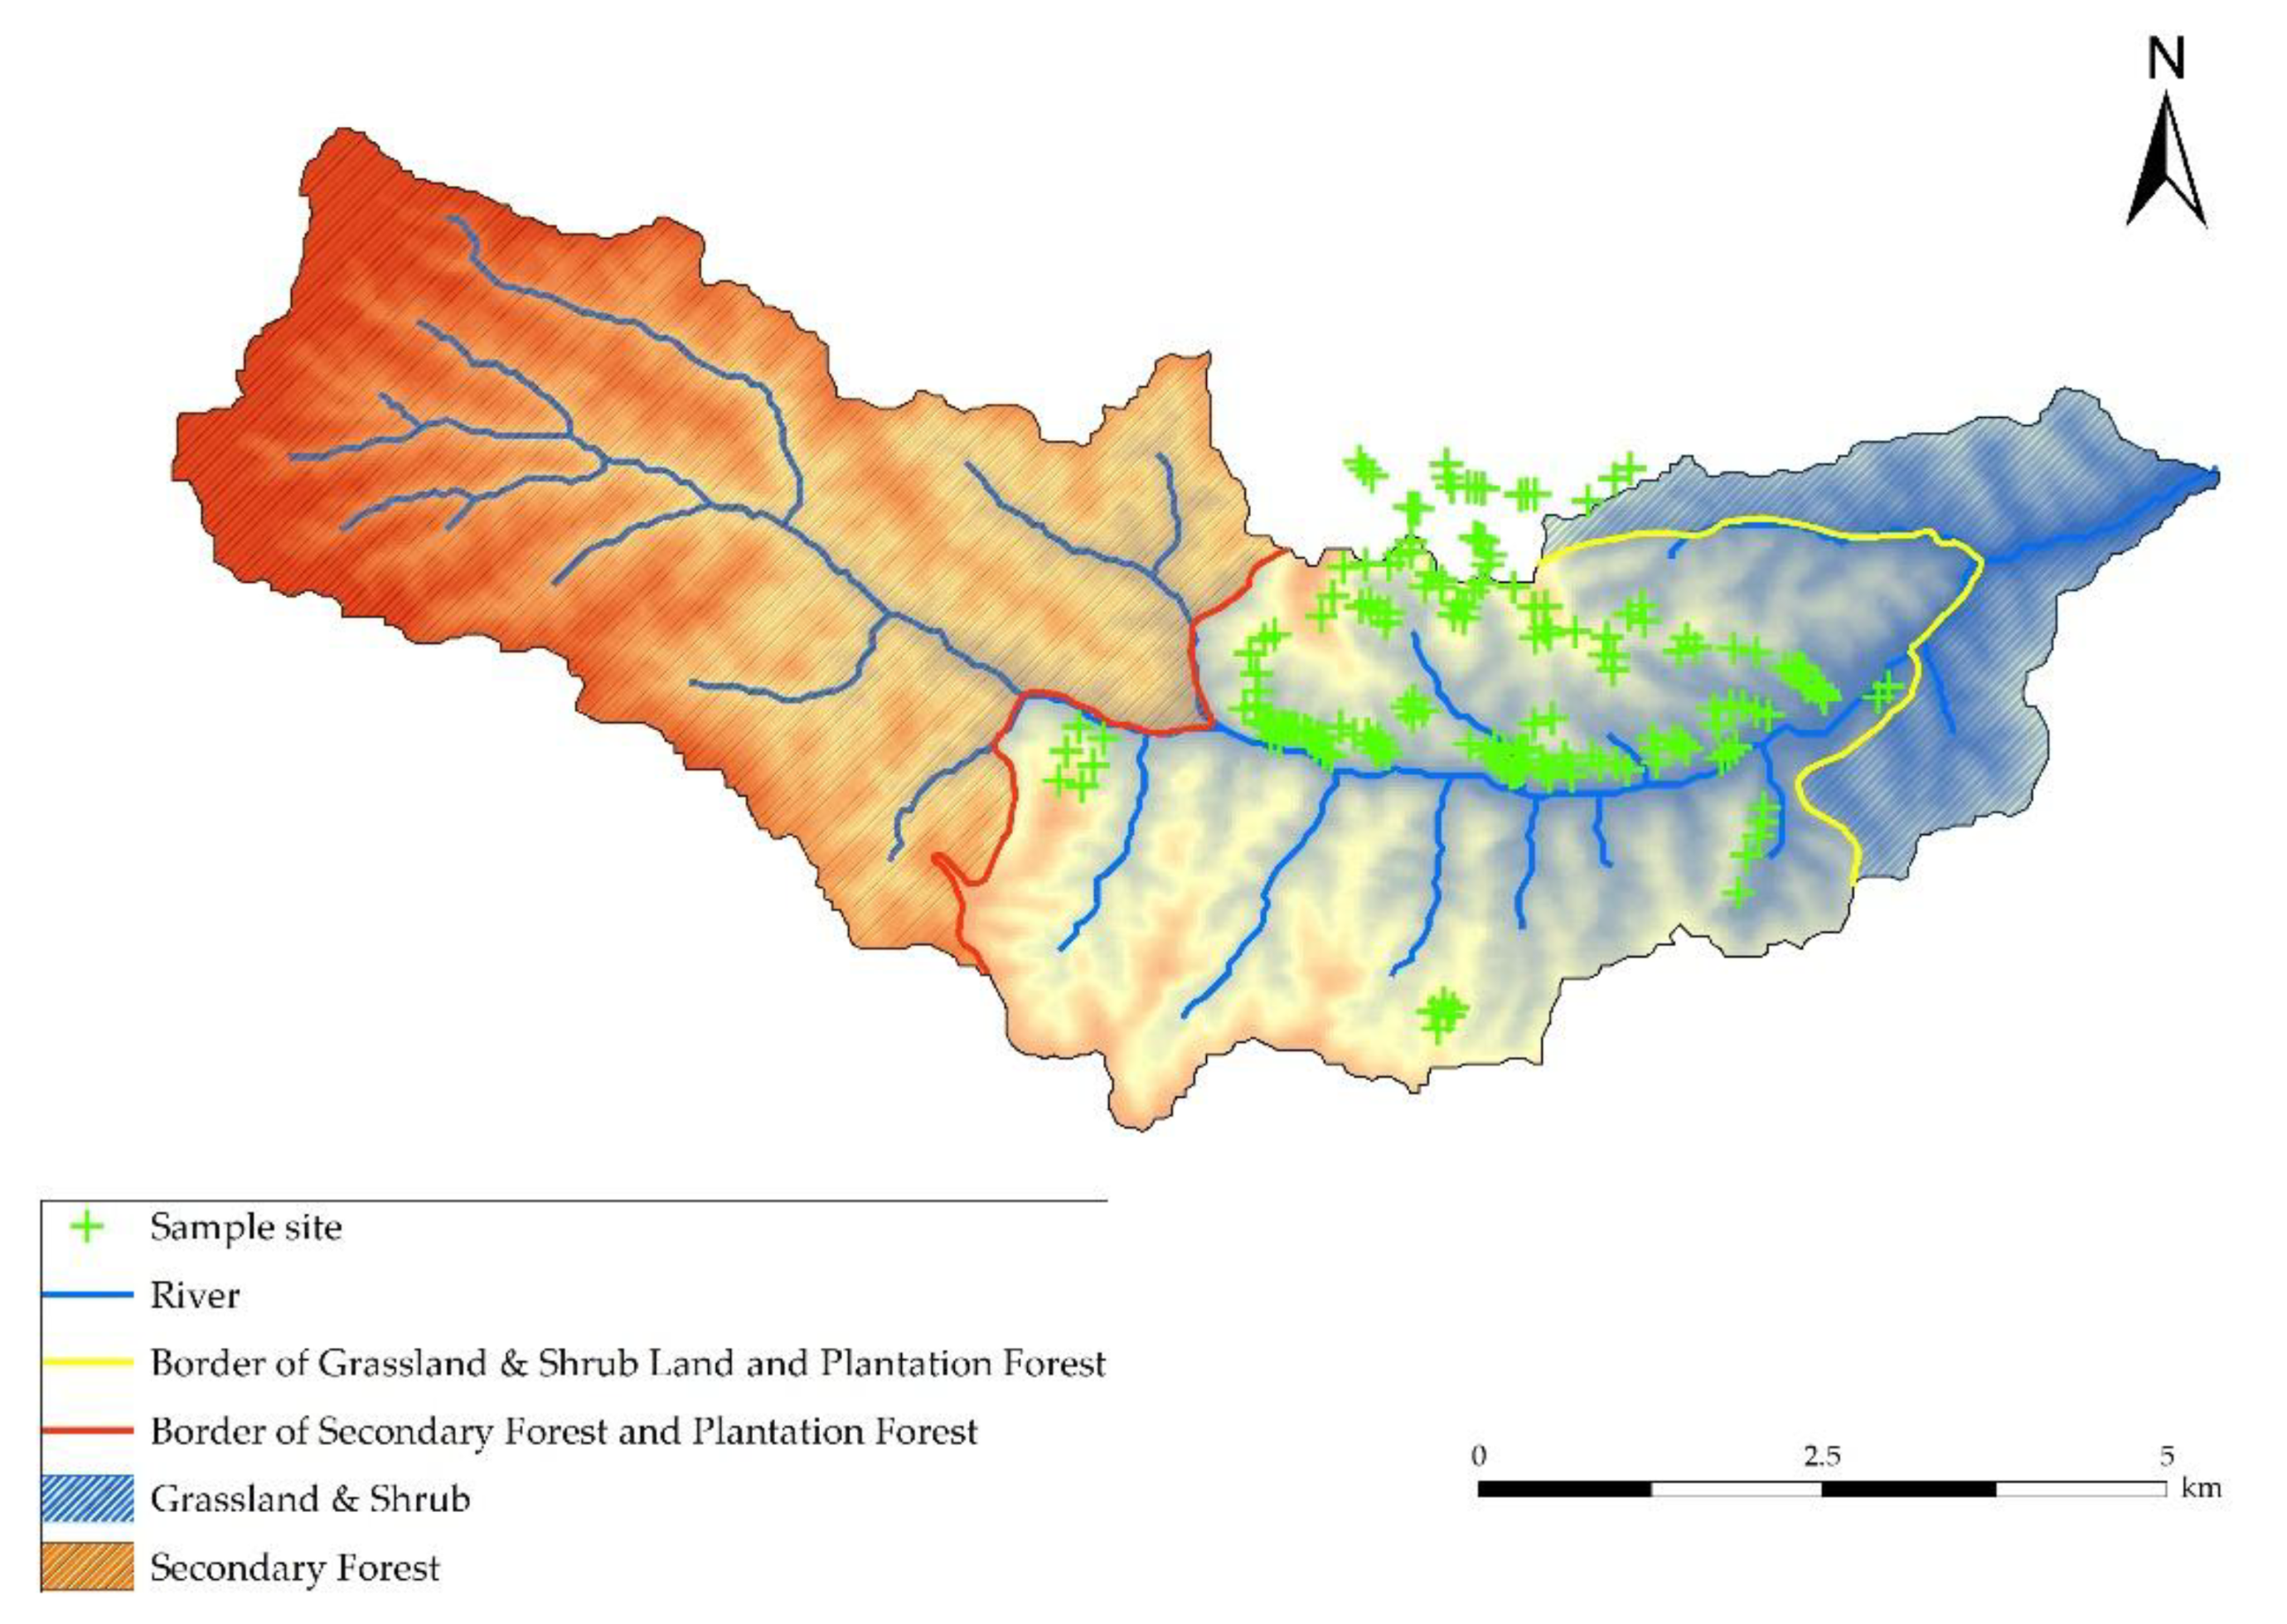
2.1.1. Study Site

In this study, we established 176 standard plots (20 × 20 m2) that included six stand densities (~500, ~1000, ~1500, ~2000, ~2500 and ~3000 plants·hm−2) from June to September each year from 2017 to 2018 according to statistical information regarding R. pseudoacacia forestland provided by the Jilin Forestry Bureau of Linfen City, Shanxi Province, which accounts for almost all R. pseudoacacia forestland in this watershed (Figure 1).

2.1.2. Investigation of Standard Plots

Three soil sampling sites per standard plot (top, middle and bottom) were established to obtain soil samples by means of a soil auger to a depth of 4 m (one sample taken every 20 cm to represent the different layers) to measure the soil moisture content and chemical properties (TN, TP, TK, CaCO3 and OMC). Hence, 528 measured soil sample values were evaluated in this study.

2.1.3. Detection of Soil Nutrients and Soil Particle Sizes

The soil samples were ground, sieved, and digested at a high temperature to convert free ammonia and organic nitrogen to ammonium sulfate (NH4)2SO4 with perchloric acid before measuring the TN, and the different forms of phosphorus were converted into orthophosphate with perchloric acid before measuring the TP. The soil samples were assessed with an automatic chemistry analyser after processing. The soil samples were first alkali fused with NaOH, and then the TK was measured with a flame photometer. The volume of carbon dioxide measured according to the gas method was used to calculate the relative content of calcium carbonate. The potassium dichromate dilution heat method was applied to measure the OMC of the soil samples. Each experiment was repeated three times. Sampling way of detection of soil particle sizes is unlike to sample of detection of soil nutrients content. There are three standard plots were established for each stand densities (~500, ~1000, ~1500, ~2000, ~2500 and ~3000 plants·hm−2) to obtain soil samples to detect the soil particle sizes. The deep of soil profile is 100 cm in (one sample taken every 20 cm to represent the different layers), the soil particle sizes were detected with laser particle size analyser (S3500SI, Microtrac Inc., Orlando, FL, USA).

2.1.4. Monitoring of SMC, SER and VTR

A portion of the soil samples from each soil layer were placed in an oven for drying (filling approximately two-thirds of an aluminium box) to measure the SMC. The SER was measured with a soil column; the column was weighed every two hours from 8:00 to 18:00 and one more time at 8:00 the next day. This process of soil evaporation and weighing was carried out for three consecutive days to obtain the average SER.
The SapIP system (Model TDP-10, Dynamax Inc., Arlington, TX, USA) was installed on three standard trees in each of the six stand densities to monitor the sap flow density with a thermal diffusion probe (TDP) from June to September each year from 2017 to 2018. We constructed Equation (10) to describe the relationship between the sapwood area and diameter at breast height according to the growth cone data from these standard trees to calculate the scale transformation between the transpiration rate of a single plant and that in a standard plot.

2.2. Statistical Analysis

The OMC was calculated using Equation (1):
OMC   =   C 1 × ( V 0 V ) × 0.003 × 1.33 m × 100 % × 1.724
where OMC represents the organic matter content (g·kg−1), C1 is molar concentration of the FeSO4 standard solution (mol·L−1), 0.003 is the molar mass of a quarter of a carbon atom (g·mol−1), 1.33 is the coefficient at room temperature, 1.724 is the conversion coefficient of organic carbon into organic matter. V0 is the volume of FeSO4 consumed in a blank controlled trial (mL), V is the volume of FeSO4 consumed in the soil samples (mL), and m is the dry weight of the samples (g). CaCO3 is calculated via Equation (2):
CaCO 3 = ( C 2 × 1 2 × V 2 C 3 × V 3 ) × 50 × t s × 10 3 m 1 × 10 6 × 1000
where CaCO3 represents the total quantity of calcium (g·kg−1), C2 represents the concentration of the standard solution of HCl (mol·L−1), C3 is the concentration of the standard solution of NaOH (mol·L−1), V2 represents the volume of the standard solution of HCl (mL), V3 is the volume of the standard solution of NaOH (mL), and m1 is the dry weight of the samples (g), ts is the ratio of the volume of the extracted solution to the volume of the measured solution.
The soil moisture content was calculated via Equations (3) and (4):
w soil = m 2 m 3 m 3 m 4 × 100 %
W ¯ soil = i   =   n w 1   +   w 2 w n
where w soil represents the soil moisture content of each soil layer in every standard plot (%), m2 represents the total weight of the wet soil and aluminium box (g), m3 represents the total weight of the dry soil and aluminium box (g), m4 represents the weight of the aluminium box (g), and W ¯ soil represents the average soil moisture content across all standard plots (%). In this study, n = 20. The SER was calculated via Equations (5) and (6):
E soil = m 6 m 5 Δ t × 100 %
E ¯ soil = i = q E 1 + E 2 E q
where E soil represents the SER in each standard plot (g·h−1), m5 represents the weight of the soil column at Time tq (g), m6 represents the weight of the soil column at Time tq + 1 (g), Δt is the evaporation time, and E ¯ soil represents the average SER across all standard plots (%). In this study, q = 6. The vegetation transpiration rate was calculated via Equations (7)–(10):
Q = 0 J s A s d t
A s = 1.0452 × H 1.6711
J s = 0.0119 × K 1.231 × 3600
K = d TM d T d T
where Q represents the sap flow (cm3), Js represents the sap flow density (cm3·cm–2·h–1), As represents the sapwood area (cm2), t is the time that the sap flow density was recorded, K is a dimensionless variable, dT is the temperature difference value associated with the thermal diffusion probe, and dTM is the maximum temperature difference value when the velocity of the sap flow is zero.
An overall situation trend analysis was carried out using ArcGIS 10.1 (Environmental Systems Research Institute, Inc., Redlands, CA, USA). A response surface analysis was performed with SAS (version 9.1, SAS Institute Inc., Cary, NC, USA). SPSS software (ver. 25.0, SPSS Inc. Chicago, IL, USA) was used for all statistical analyses in this study. Basic information on standard R. pseudoacacia forestland is presented in Table 1.

3. Results

3.1. Spatial Distribution of Soil Water and Soil Nutrient Resources

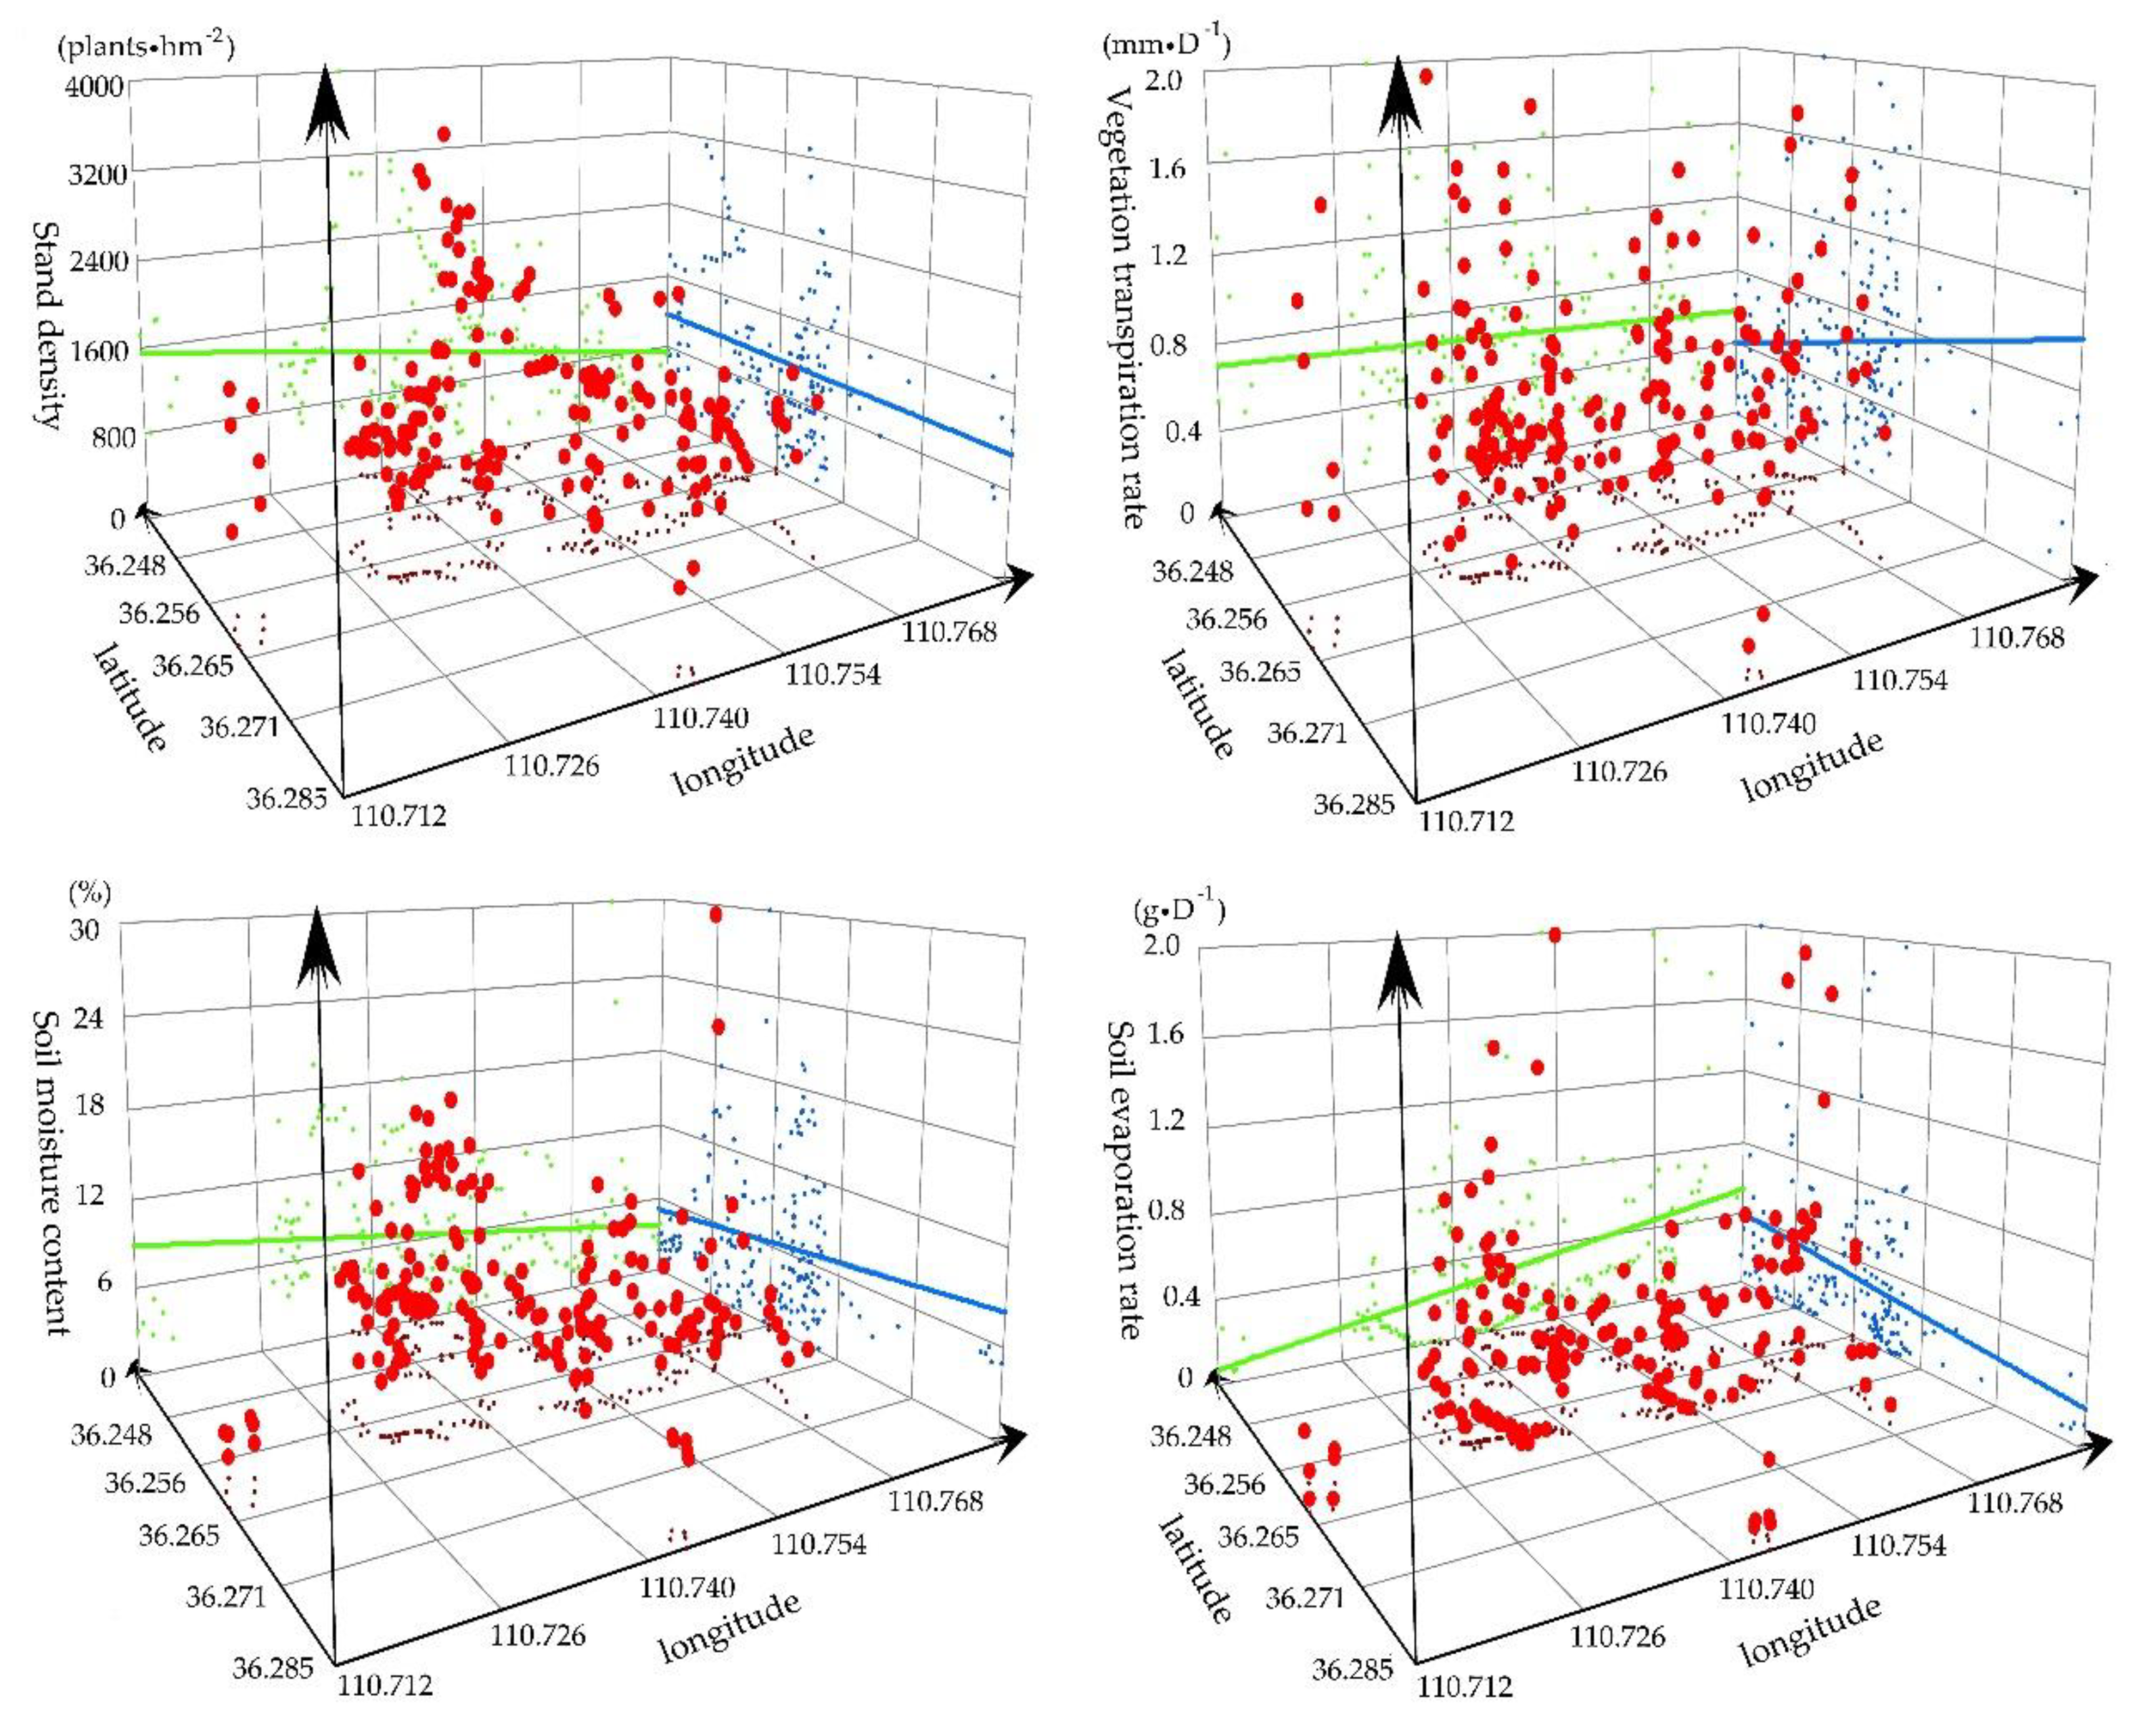
3.1.1. Spatial Distribution of SD, VTR, SMC, and SER

The spatial distribution of stand density (SD), VTR, SMC and SER in R. pseudoacacia forestland is shown in Figure 2. The results showed that the SD, VTR and SMC decreased from west to east and increased from south to north. The SD decreased at a rate of 4 plants·hm−2 per second of longitude and increased at a rate of 1 plants·hm−2 for every two seconds of latitude. The VTR of R. pseudoacacia forest increased at a rate of 5 × 10⁻⁴ mm·L−1 per second of longitude and 3.45 × 10⁻³ mm·L−1 per second of latitude. The SMC decreased at a rate of 2.49 × 10⁻²% per second of longitude and 2.2 × 10⁻²% per second of latitude. The SER increased from west to east and from south to north. The SER of R. pseudoacacia forest increased at a rate of 5.85 × 10⁻⁴ g·D−1 per second of longitude and 1.5 × 10⁻⁴ g·D−1 per second of latitude.

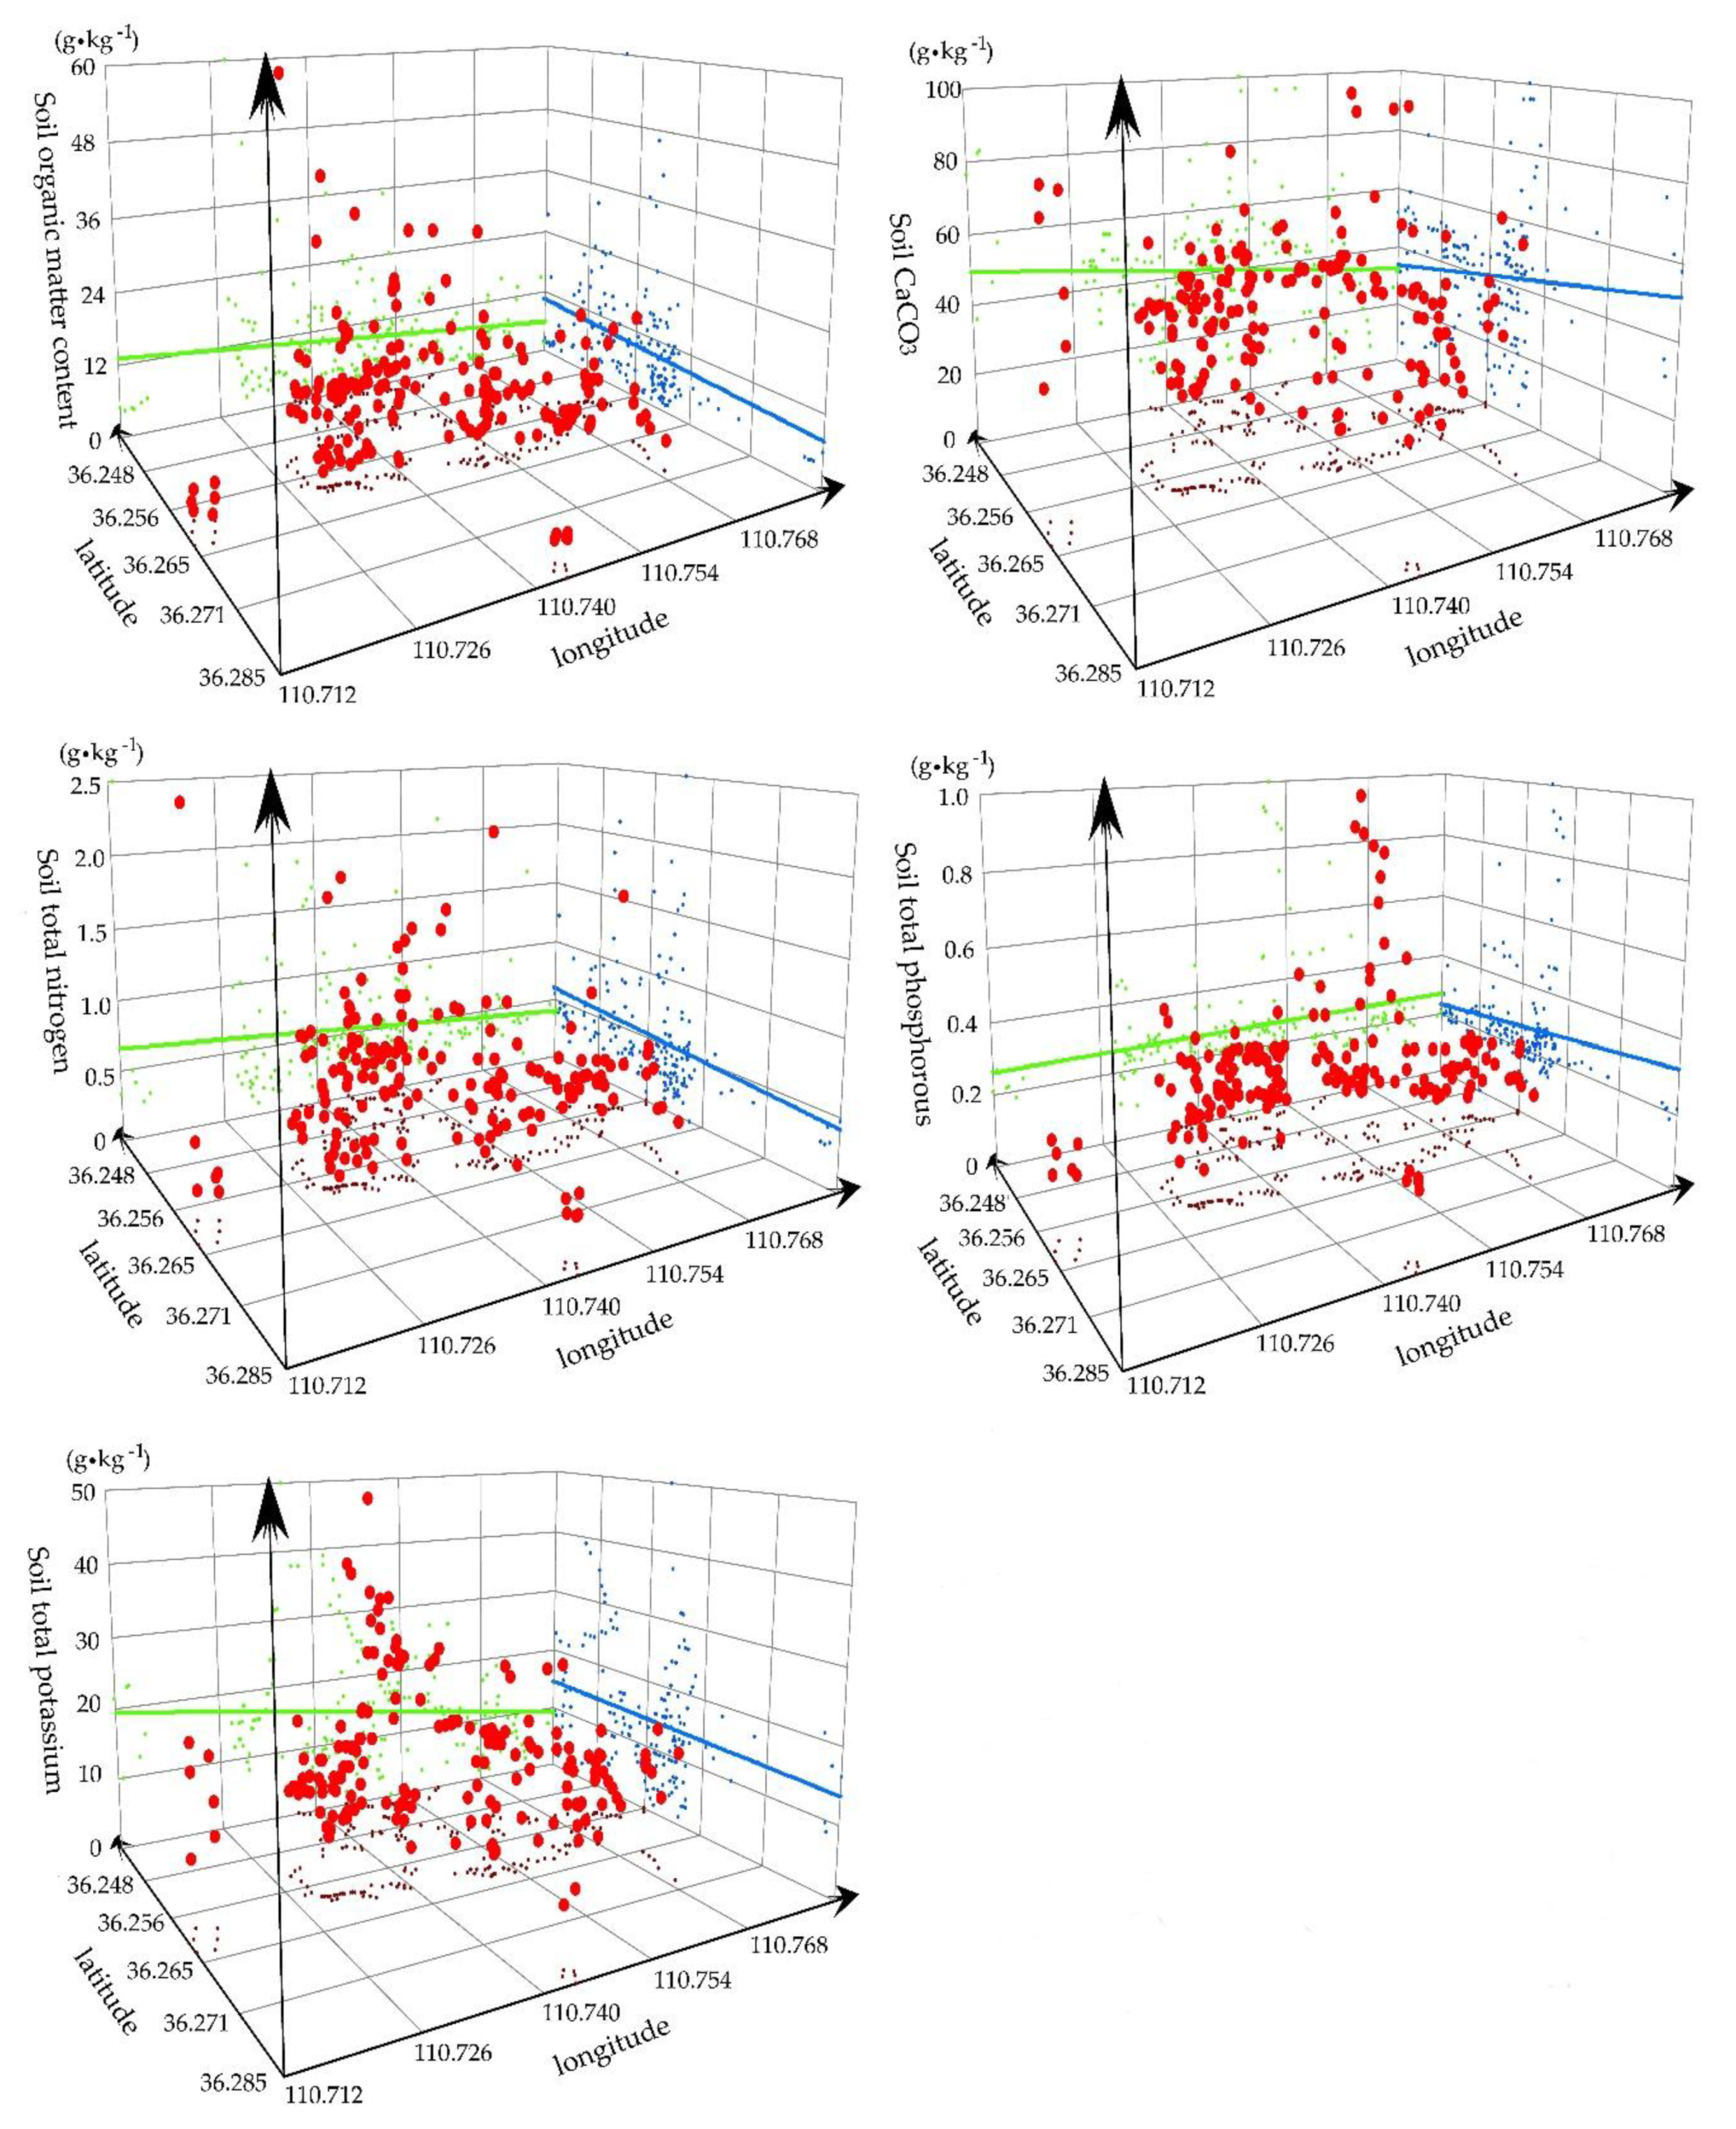
3.1.2. Spatial Distribution of Soil Nutrients

The spatial distributions of soil nutrients in R. pseudoacacia forestland are shown in Figure 3. The results show that the soil OMC, TN and TK presented the same decreasing trend from west to east and increasing trend from south to north. However, the spatial distribution of soil TP showed the opposite trends. The spatial distribution of soil CaCO3 showed a decreasing trend from west to east and from south to north. The soil OMC, TN, TK and CaCO3 decreased at a rate of 0.03 g·kg−1, 0.001 g·kg−1, 0.05 g·kg−1, and 0.07 g·kg−1 with each second of longitude, respectively, while the soil TP increased at a rate of 5.88 × 10⁻⁵ g·kg−1. The soil OMC increased at a rate of 0.02 g·kg−1 per second of latitude, and that of both of soil TN and soil TK increased by 0.01 g·kg−1; however, the soil TK and soil CaCO3 decreased by 1.32 × 10⁻³ g·kg−1 and 0.11 g·kg−1, respectively.

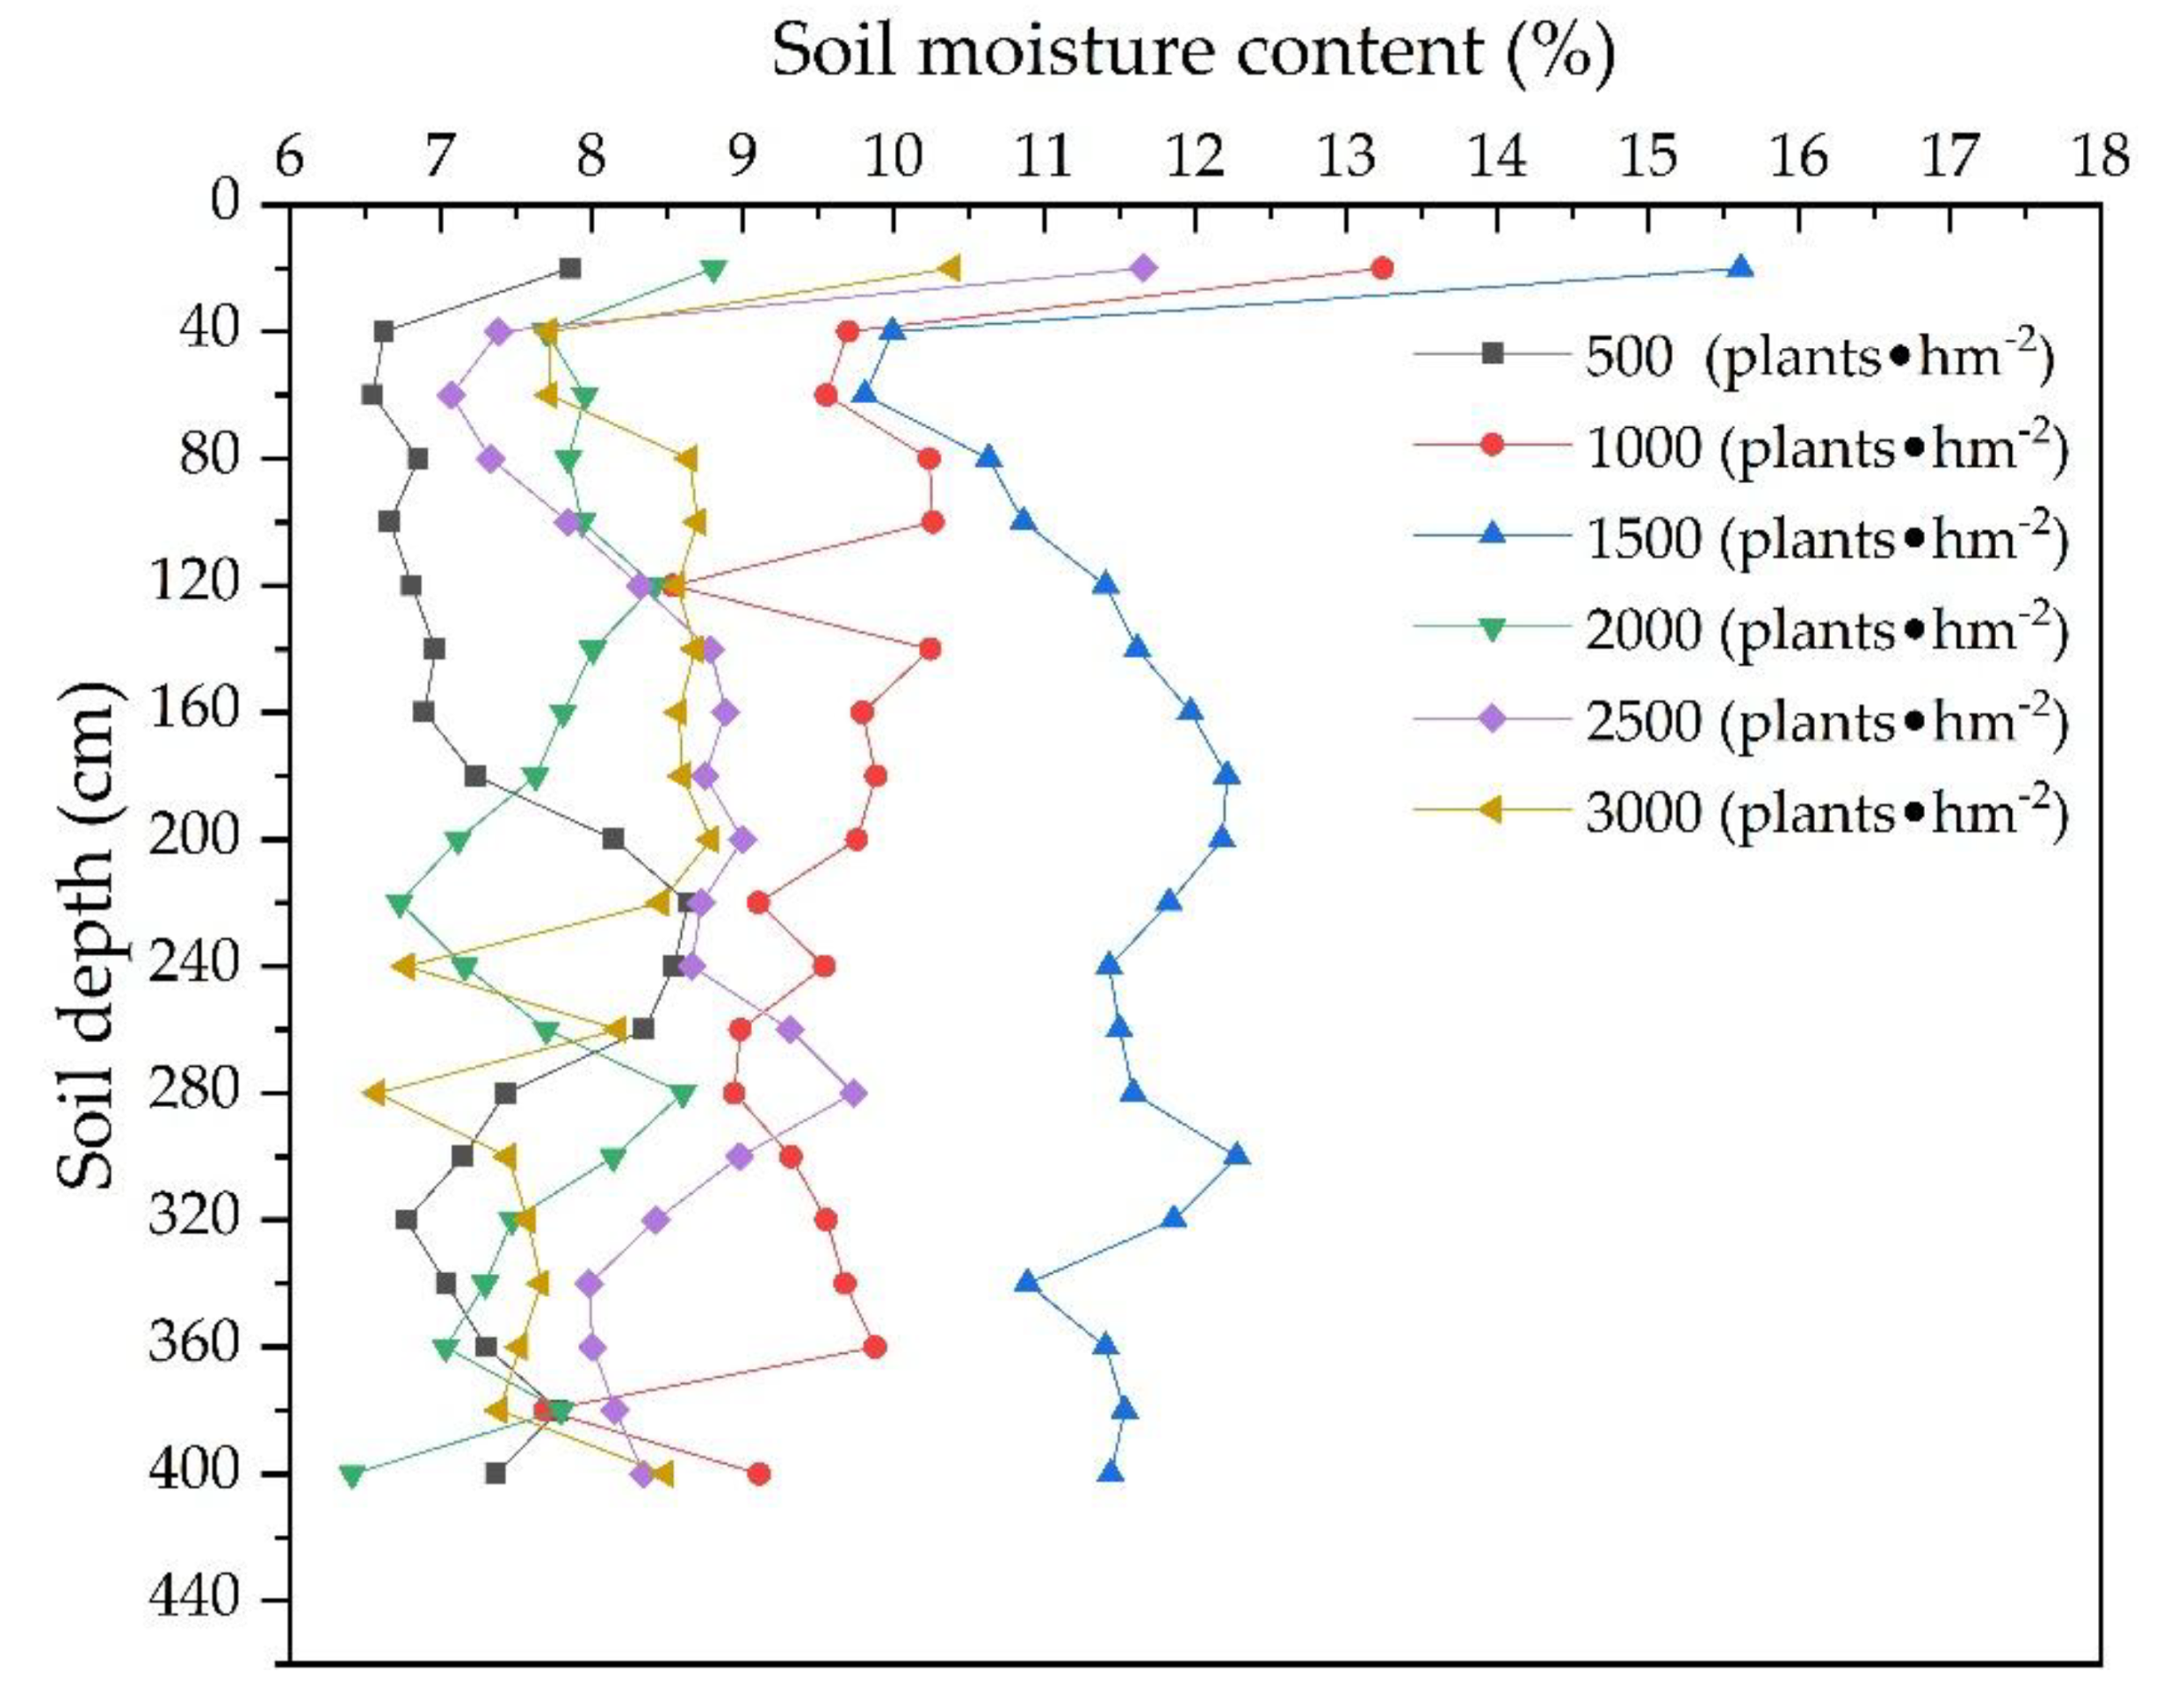
3.1.3. Vertical Distribution of the Soil Water and Soil Particles

The vertical distributions of soil moisture content and soil particle size in R. pseudoacacia forestland are shown in Figure 4 and Table 2. The results of vertical distribution of soil moisture content showed that the soil moisture content of topsoil layer (0–40 cm) higher than deep soil layer (40–400) in all R. pseudoacacia forestlands, and the variation rate of soil moisture content is approximately two percent in deep soil layer. The results showed that the soil moisture content (~11.6%) in R. pseudoacacia forestland (~1500 plants·hm−2) is higher than other R. pseudoacacia forestlands, while the soil moisture content (~7.3%) in R. pseudoacacia forestland (~500 plants·hm−2) is the lowest.
The results of vertical distribution of soil particles showed that soil type is loessal soil in all R. pseudoacacia forestland and sand content accounted for the largest proportion (higher than 65%). The soil particle results suggested that only the sand and silt were detected in R. pseudoacacia forestland (~500 and ~3000 plants·hm−2), and both sand contents are higher by 90% and 85%, respectively. Additionally, the sand and silt as well as clay were detected in R. pseudoacacia forestland (~1000, ~1500, ~2000 and ~2500 plants·hm−2), and the ratios of soil particles in R. pseudoacacia forestland (~1500 plants·hm−2) were relatively better than the other three R. pseudoacacia forestlands. This is one of the reasons that soil moisture content in R. pseudoacacia forestland (~1500 plants·hm−2) is the highest compared with the other five R. pseudoacacia forestlands.

3.1.4. Statistical Analysis of the Soil Water and Soil Nutrient Resources

The soil nutrients in this study, SMC, SER and VTR, were statistically analysed, and the results are shown in Table 3. The maximum, minimum and average stand density of R. pseudoacacia forest in the study area were 3400 plants·hm−2, 350 plants·hm−2, and 1499 plants·hm−2, respectively. The maximum, minimum, and average VTR of R. pseudoacacia forest were 1.93 mm·L−1, 0.43 mm·L−1 and 0.91 mm·L−1, respectively. The maximum, minimum, and average SMC of R. pseudoacacia forestland in the study area were 33.97%, 5.66%, and 11.54%, respectively. The maximum, minimum, and average SER of R. pseudoacacia forest in the study area were 0.52 g·D−1, 0.03 g·D−1 and 0.1 g·D−1, respectively. The soil CaCO3 of R. pseudoacacia forestland showed the largest content among all soil nutrient indicators, with maximum and minimum values of 94 g·kg−1 and 13 g·kg−1 and an average value of 45.6 ± 1.12 g·kg−1. The lowest values were for soil TN and TP, with maximum and minimum values of 2.63 g·kg−1 and 1.99 g·kg−1 for TN, respectively, and 0.06 g·kg−1 and 0.03 g·kg−1 for TP, respectively. The average TN and TP values were 0.60 ± 0.03 g·kg−1 and 0.56 ± 0.02 g·kg−1, respectively.

3.2. Analysis of Stand Structure Optimization of R. pseudoacacia Forest

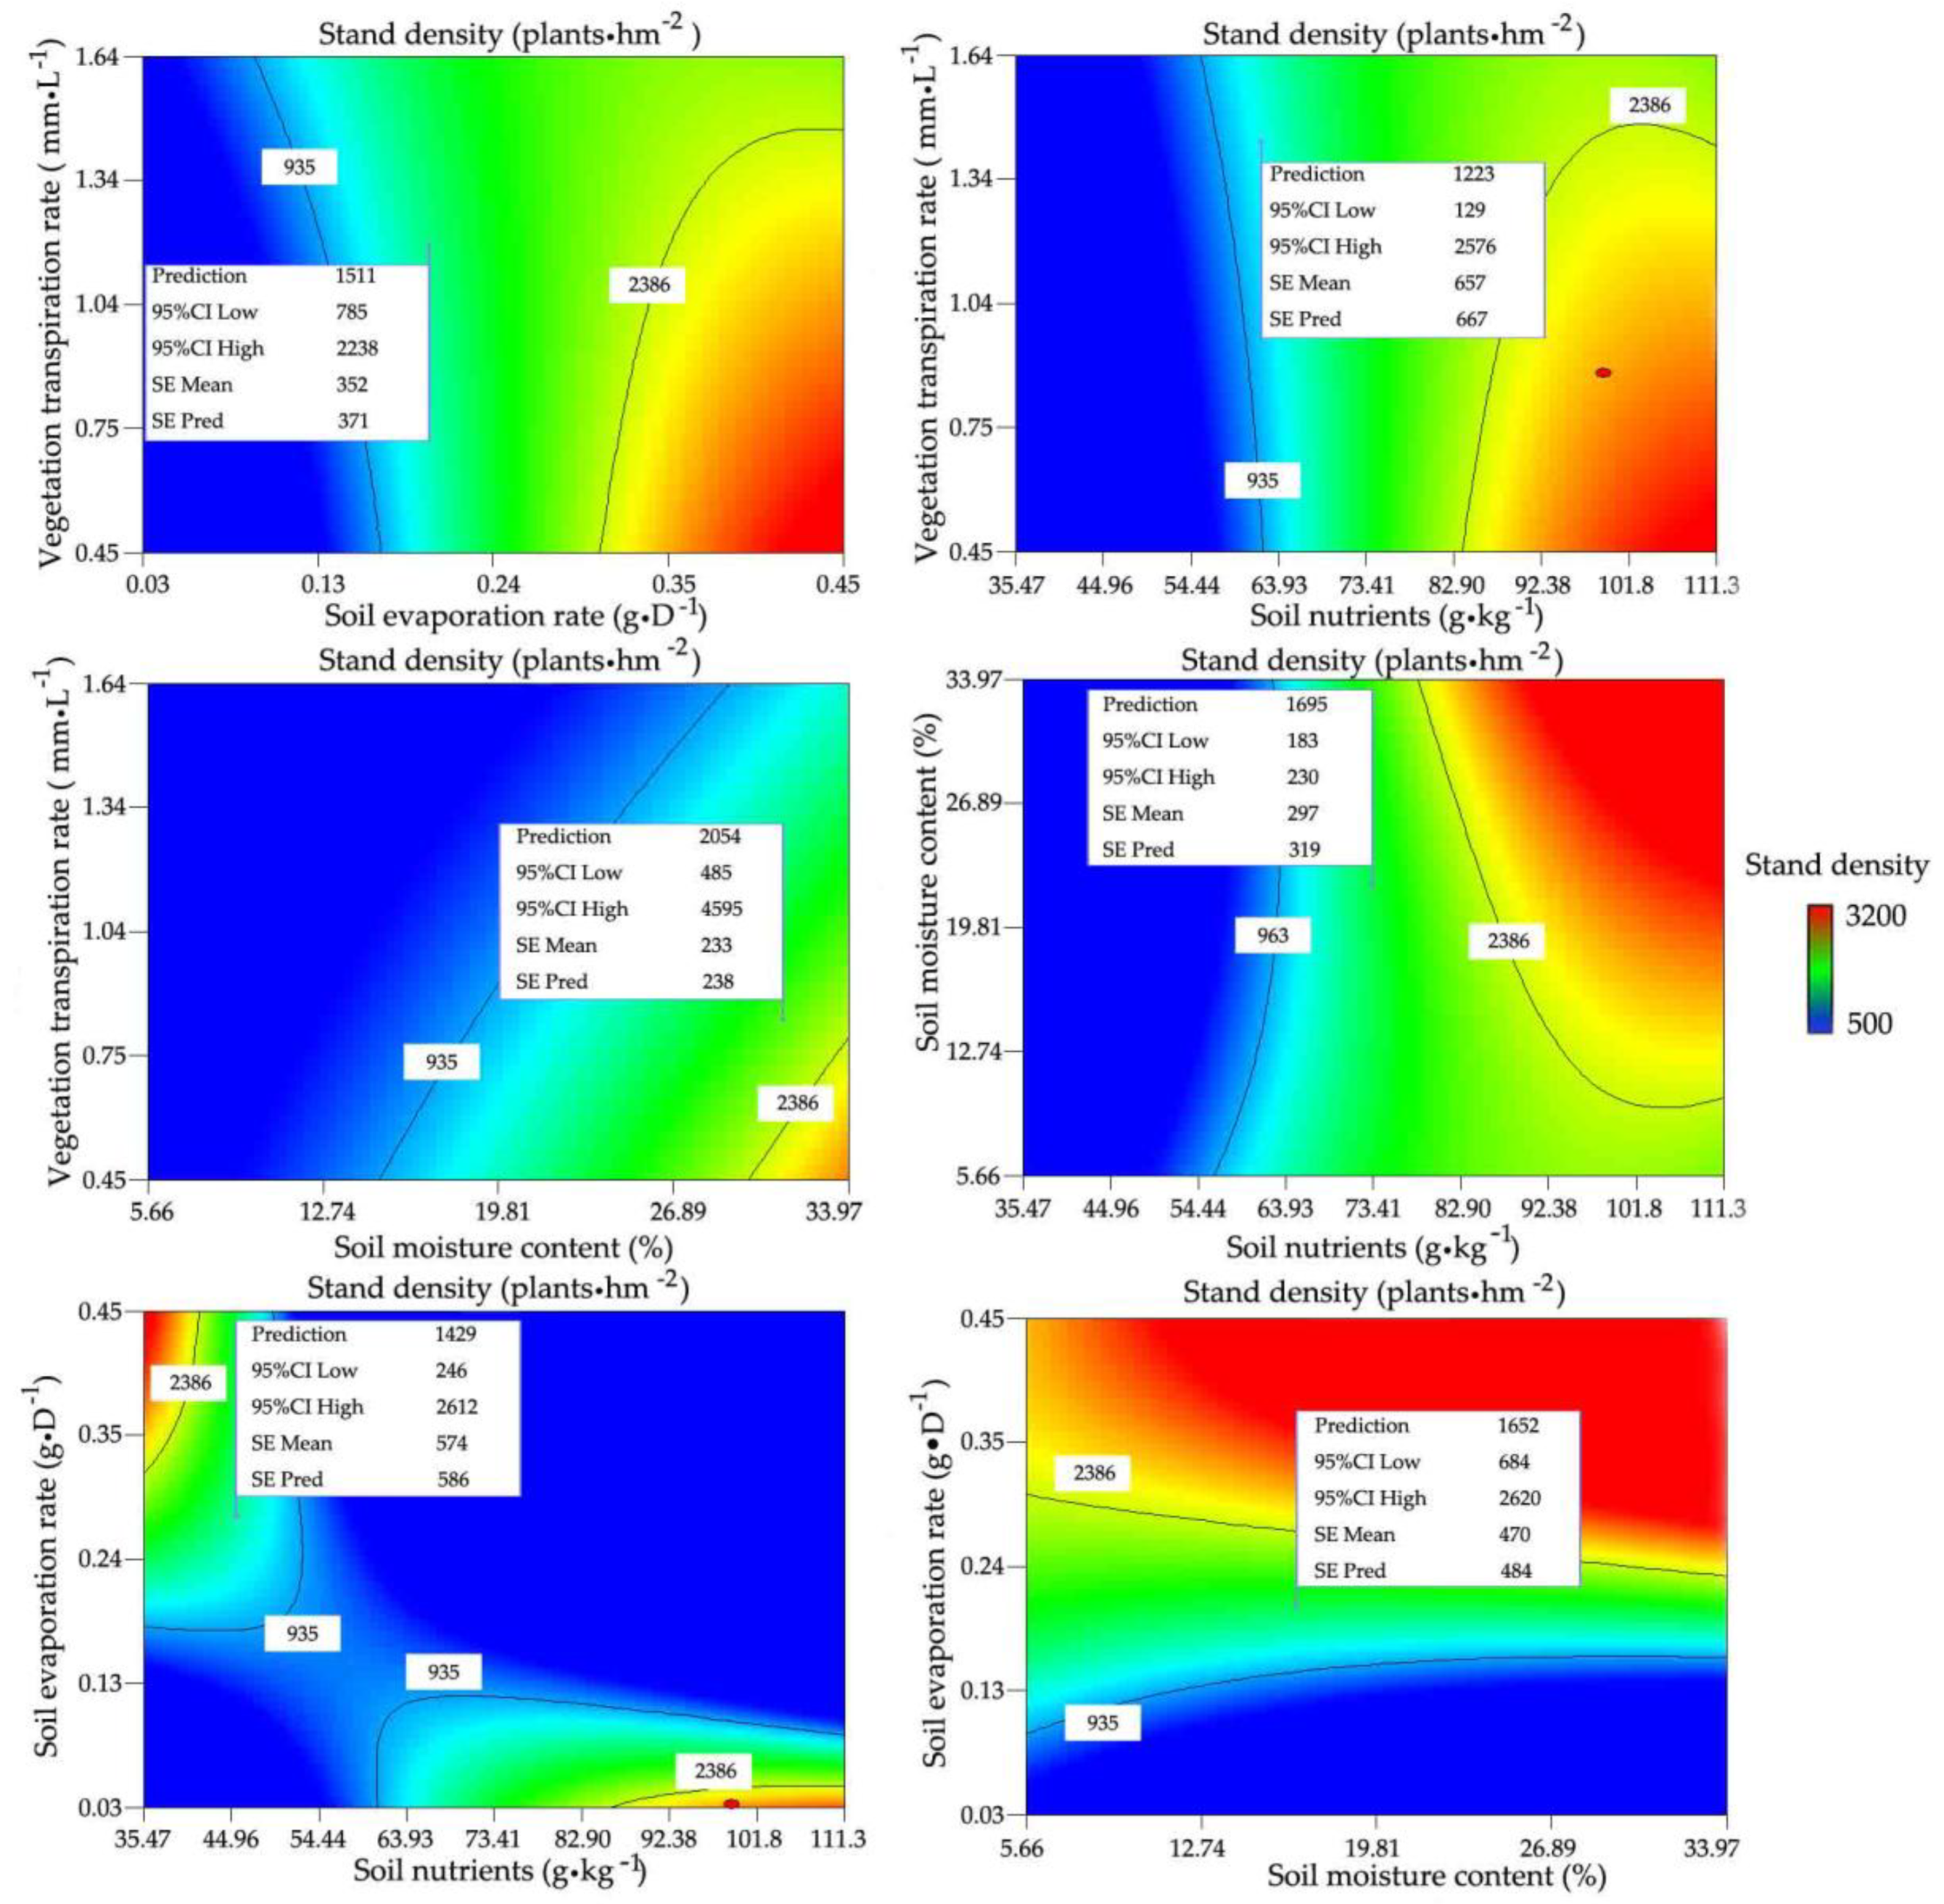
3.2.1. Relationships between Stand Density and Water and Nutrients

Exploring the relationships between soil water/nutrients and stand density, slope, tree height, diameter at breast height, forest age, and leaf area index will provide a clear and useful guide to optimal stand structure. The results are shown in Table 4. The soil TK, soil CaCO3, SMC, SER and VTR showed significant positive relationships with stand density at the 0.01 level. The correlation coefficients were 0.910 **, 0.686 **, 0.243 **, 0.710 **and 0.761 **, respectively. The soil OMC showed a significant positive relationship with stand density at the 0.05 level, with a correlation coefficient of 0.148 *. Additionally, the soil TK, soil CaCO3, SMC, SER showed significant positive relationships with leaf area index at the 0.01 level. The correlation coefficients were 0.337 **, 0.201 **, 0.338 ** and −0.314 **, respectively. Significant interactions were observed between the nutrient and water indexes evaluated in this study and stand density as well as leaf area index. When the stand density is optimized, it will also affect the leaf area index, and optimizing stand density has strong manoeuvrability. Therefore, to further explore the quantitative relationships among these three types of variables, a quantitative analysis was conducted.

3.2.2. Determining the Optimal Stand Density and Its Ranges for R. pseudoacacia Forest

The results of the response surface analysis of the soil nutrients, SMC, SER and VTR, suggested that the optimal stand density (OSD) ranged between 940 and 2386 plants·hm−2 and the average OSD was 1594 plants·hm−2 (Figure 5). The proportion of standard plots with an unreasonable stand density accounted for 35.29% of the plots based on the above results; and 65% of these plots had a stand density that was higher than the maximum OSD while 35% had a stand density that was lower than the minimum value. Therefore, the existing stand density should be manipulated to fall within the range of the OSD to ensure the conservation of soil and water in R. pseudoacacia forest.

4. Discussion

4.1. Effects of SMC, SER, and Soil Nutrients on Stand Density

On the Loess Plateau in western Shanxi, which has an average annual rainfall of only 575.9 mm, particular micro-site conditions formed more than 20 years ago due to serious soil erosion, and they led to variations in the soil moisture distribution. The results of this study indicate that the average SMC of R. pseudoacacia forestland was 11.54 ± 0.36% (Table 3), which is similar to the results found by Chang [35] and Hou [36]. Previous studies indicated that the SMC is a limiting factor that affects the normal growth of R. pseudoacacia on the Loess Plateau [3,9]. Our results also suggest that there is a significant relationship between the SMC and stand density distribution, with a correlation coefficient of 0.243 ** (Table 4). Many life activities of plants require water as a medium, and they include respiration, photosynthesis, resource competition and metabolism; thus, the water use strategies of vegetation are particularly important. Liu [37] used hydrogen and oxygen isotopes (δ2H and δ18O) to demonstrate that plants mainly use soil moisture in the maintenance of life activities, and they reported the important finding that plants absorb soil moisture from the topsoil layer when water resources are sufficient but switch to deeper soil layers once the soil moisture in the topsoil layer is deficient. From an ecological hydrology and plant physiology perspective, when the soil moisture is sufficient, the induction of hydrotropism will lead deep-rooted vegetation root systems to constantly produce more fine roots to advance their water-absorption capacity [38,39]. Furthermore, the moisture content in different soil layers is relatively stable because of the influence of soil porosity. When the SMC is at a low level, a dry soil layer will form, which hinders the absorption of moisture by the root system [40,41]. Plants have the ability to adapt to the environment [42] and will limit the growth of branches to reduce the number of leaves, thereby decreasing vegetation transpiration, to maintain normal life activities. At the same time, the number of fine roots will also decline under insufficient SMC, thus reducing the ability of the vegetation to absorb water.
The SER is an important factor that influences stand density [43,44]. The results of this study show that there is a significant correlation between soil evaporation and stand density (R = 0.710 **) (Figure 2, Table 4) and the SER is one of the main variables affected by the SMC [45]. This study suggests that the SER is 0.1 g·D−1 in R. pseudoacacia forestland on the western Loess Plateau (Figure 2, Table 3) and represents an important factor influencing vegetation degeneration and soil desiccation; this finding is consistent with the findings of Shangguan [46]. Additionally, because the SMC was insufficient for a long time, this lack of soil moisture will affect the normal growth of vegetation and cause the individuals of R. pseudoacacia in the forest to be small in size with slow growth and exhibit different degrees of spike top and even the death of whole plants. Moreover, such effects of low soil moisture caused differences in the stand density and led to low-efficiency forests. In this study, a response surface analysis was carried out to optimize stand density and the results show that the OSD averages 1594 plants·hm−2 and ranges between 940 and 2386 plants·hm−2 (Figure 5). These results are similar to the results of Zhang [47].
From a plant nutrition perspective, the needs of vegetation are the same as those of human beings. In addition to the requirement of water as a medium to complete a series of life activities, plants also need materials to provide energy to synthesize plant organs and complete various life activities [48]. Nitrogen, phosphorus and potassium are three important and necessary nutrient elements in the process of vegetation growth [49], and when they are at low concentrations in R. pseudoacacia forestland, the vegetation will be malnourished (with small individuals, slow growth, different spike top degrees, and even whole plant death), which is similar to the effects of a lack of SMC. The results of this study show that the average contents of TN, TP and TK were 0.60 ± 0.03 g·kg−1, 0.56 ± 0.02 g·kg−1 and 17.96 ± 0.64 g·kg−1, respectively (Figure 3, Table 3), which are similar to the results of Song [50]. According to the standard of soil fertility classification for the second national soil survey in China, it can be concluded that the R. pseudoacacia forestland nutrient content found in this study (0.5–0.75 g·kg−1) is too low and not conducive for the normal growth of R. pseudoacacia forest. In addition, the content of soil calcium is an important index of soil hardness [51]. Excess calcium content causes the soil structure to harden, thus preventing the transport of water and nutrients and leading to small individuals, slow growth, different degrees of spike top, and even the death of whole plants. The results of this study suggest that the average content of soil calcium was 45.6 ± 1.12 g·kg−1 (Figure 3, Table 3), and according to the standard of soil fertility classification for the second national soil survey in China, it can be concluded that the soil calcium content (≥ 1 g·kg−1) in R. pseudoacacia forestland in the study area was too high. In addition to low SMC, the calcium content is also an important factor that causes vegetation degeneration and soil desiccation [51].

4.2. Effects of the VTR on Stand Density

The VTR is one of the most important factors affecting the stand density distribution [52,53]. The results of this study show that there is an extremely significant correlation between the VTR and stand density, with a correlation coefficient of 0.761 ** (Table 4). Higher VTR values indicate greater water consumption by vegetation, and higher soil water consumption rates indicate that the soil is more prone to drought, which is especially obvious during the dry season. Guo [54] reported that the VTR in R. pseudoacacia forest was 1.20 mm·L−1, which greatly accelerated the rates of soil water consumption and degradation. The current study showed that the VTR is 0.91 mm·L−1 in the R. pseudoacacia forest in loess region of western Shanxi Province (Figure 2, Table 3), which is similar to the value found by Guo. This value suggests that the stand density of R. pseudoacacia forest in loess region of western Shanxi Province is too high. Further optimization of the stand density is critical to reducing water consumption and ensuring the normal growth of R. pseudoacacia forest and thus improving the stand structure and its soil and water conservation functions. In an ecosystem, matter can be recycled while energy cannot [55]. Leaves, stems, bark, flowers, fruit and roots eventually fall to the ground and are returned to the soil for reabsorption and use by vegetation in an absorbable ion state after microbial decomposition [56,57]. The amounts of litter and nutrients directly affect the nutrient pool of R. pseudoacacia forests and then affect the life activities of the vegetation [58,59].

5. Conclusions

This study analysed the distribution of all indicators of stand density and water and soil nutrient resources, i.e., soil total nitrogen, soil total phosphorus, soil total potassium, soil organic matter content, soil moisture content, soil evaporation rate and vegetation transpiration rate, in R. pseudoacacia forestland based on forest survey and observational data. We also identify the optimal stand density and its corresponding range for low-efficiency R. pseudoacacia forests on the Loess Plateau in western Shanxi based on the results of a response surface analysis. The results of the overall situation trend analysis showed that the stand density, soil moisture content, soil evaporation rate and soil nutrients of R. pseudoacacia forestland presented low values in the southwest and high values in the northeast while the vegetation transpiration rate of R. pseudoacacia forestland presented low values in the southwest and high values in the northeast. The results of the correlation analysis showed that the soil total nitrogen, soil CaCO3, soil moisture content, soil evaporation rate and vegetation transpiration rate had significant effects on the distribution of stand density. The results of the response surface analysis indicated that the OSD averaged 1594 plants·hm−2 and ranges from 940 to 2386 plants·hm−2 on the Loess Plateau of western Shanxi.

Author Contributions

Conceptualization, H.B. and G.H.; methodology, G.H.; investigation, G.H., N.W., Y.C., X.M., D.Z., S.W.; software, G.H.; formal analysis, G.H.; visualization, G.H.; writing—original draft preparation, G.H.; and writing—review and editing, H.B. and G.H.

Funding

This research were funded by the National Key Research and Development Program of China (No. 2016YFC0501704), the National Key Technology Research and Development Program of the Ministry of Science and Technology of China (No. 2015BAD07B0502), the National Natural Science Funds of China (No. 31470638) and grants from the Beijing Municipal Education Commission (CEFF-PXM2019_014207_000099). The APC was funded by the National Key Research and Development Program of China (No. 2016YFC0501704).

Acknowledgments

The authors would like to thank Zhexiu Yu for providing technological assistance. We would also like to thank the anonymous reviewers and the Editor and Associate Editor for the thorough assessment of this paper and for many valuable and helpful suggestions.

Conflicts of Interest

The authors declare no conflict of interest.

References

  1. Yu, X.N.; Huang, Y.M.; Li, E.G.; Li, X.Y.; Guo, W.H. Effects of vegetation types on soil water dynamics during vegetation restoration in the Mu Us Sandy land, northwestern China. J. Arid. Land. 2017, 9, 188–199. [Google Scholar] [CrossRef]
  2. Yu, X.N.; Huang, Y.M.; Li, E.G.; Li, X.Y.; Guo, W.H. Effects of rainfall and vegetation to soil water input and output processes in the Mu Us Sandy land, northwest China. Catena 2018, 9, 188–199. [Google Scholar] [CrossRef]
  3. Wang, Y.; Zhu, Q.K.; Zhao, W.J.; Ma, H.; Wang, R.; Ai, N. The dynamic trend of soil water content in artificial forests on the Loess Plateau, China. Forests 2016, 7, 236. [Google Scholar] [CrossRef]
  4. Singh, K.; Singh, B.; Singh, R.R. Changes in physico-chemical, microbial and enzymatic activities during restoration of degraded sodic land: Ecological suitability of mixed forest over monoculture plantation. Catena 2012, 96, 57–67. [Google Scholar] [CrossRef]
  5. Singh, K.; Pandey, V.C.; Singh, B.; Singh, R.R. Ecological restoration of degraded sodic lands through afforestation and cropping. Ecol. Eng. 2012, 43, 70–80. [Google Scholar] [CrossRef]
  6. Su, C.H.; Fu, B.J. Evolution of ecosystem services in the Chinese Loess Plateau under climatic and land use changes. Global Planet. Chang. 2013, 101, 119–128. [Google Scholar] [CrossRef]
  7. Su, C.H.; Fu, B.J.; He, C.S.; Lü, Y.H. Variation of ecosystem services and human activities: a case study in the Yanhe Watershed of China. Acta Oecol. 2012, 44, 46–57. [Google Scholar] [CrossRef]
  8. Staska, B.; Essl, F.; Samimi, C. Density and age of invasive Robinia pseudoacacia modulate its impact on floodplain forests. Basic Appl. Ecol. 2014, 15, 551–558. [Google Scholar] [CrossRef]
  9. Liang, H.B.; Xue, Y.Y.; Li, Z.S.; Wang, S.; Wu, X.; Gao, G.Y.; Liu, G.H.; Fu, B.J. Soil moisture decline following the plantation of Robinia pseudoacacia forests: Evidence from the Loess Plateau. Forest Ecol. Manag. 2018, 412, 62–69. [Google Scholar] [CrossRef]
  10. Deng, L.; ShangGuan, Z.P.; Li, R. Effects of the grain-for-green program on soil erosion in China. Int. J. Sediment Res. 2012, 27, 120–127. [Google Scholar] [CrossRef]
  11. Meng, K.; Garcia-Fayos, P.; Hu, S.; Jiao, J.Y. The effect of Robinia pseudoacacia afforestation on soil and vegetation properties in the Loess Plateau (China): A chronosequence approach. Forest Ecol. Manag. 2016, 375, 146–158. [Google Scholar]
  12. Vítková, M.; Müllerová, J.; Sádlo, J.; Pergl, J.; Pyšek, P. Black locust (Robinia pseudoacacia) beloved and despised: A story of an invasive tree in Central Europe. Forest Ecol. Manag. 2017, 384, 287–302. [Google Scholar] [CrossRef] [PubMed]
  13. Xin, Z.B.; Yu, B.F.; Han, Y.G. Spatiotemporal variations in annual sediment yield from the middle yellow river, China, 1950–2010. J. Hydrol. Eng. 2015, 20, 04014090. [Google Scholar]
  14. Yang, K.J.; Lu, C.H. Evaluation of land-use change effects on runoff and soil erosion of a hilly basin—the Yanhe River in the Chinese Loess Plateau. Land Degrad. Dev. 2018, 29, 1211–1221. [Google Scholar] [CrossRef]
  15. Liu, Y.X.; Lü, Y.H.; Fu, B.J.; Harris, P.; Wu, L.H. Quantifying the spatio-temporal drivers of planned vegetation restoration on ecosystem services at a regional scale. Sci. Total Environ. 2019, 650, 1029–1040. [Google Scholar] [CrossRef]
  16. Benayas, J.M.R.; Bullock, J.M. Enhancement of biodiversity and ecosystem services by ecological restoration: a meta-analysis. Science 2009, 325, 1121–1124. [Google Scholar] [CrossRef]
  17. Li, T.; Lü, Y.; Fu, B.; Comber, A.J.; Harris, P.; Wu, L. Gauging policy-driven large-scale vegetation restoration programmes under a changing environment: their effectiveness and socio-economic relationships. Sci. Total Environ. 2017, 607–608, 911–919. [Google Scholar] [CrossRef]
  18. Zhao, X.K.; Li, Z.Y.; Zhu, Q.K.; Zhu, D.H.; Liu, H.F. Climatic and drought characteristics in the loess hilly gully region of China from 1957 to 2014. PLoS ONE 2017, 12, e0178701. [Google Scholar]
  19. Wang, L.N.; Zhu, Q.K.; Zhao, W.J.; Zhao, X.K. The drought trend and its relationship with rainfall intensity in the Loess Plateau of China. Nat. Hazards. 2015, 77, 479–495. [Google Scholar] [CrossRef]
  20. Kirschbaum, M.U.F. The temperature dependence of soil organic matter decomposition, and the effect of global warming on soil organic C storage. Soil Biol. Biochem. 1995, 27, 753–760. [Google Scholar] [CrossRef]
  21. Tang, S.Z.; Lei, X.D.; Li, X.F. Study on Spatial structure optimizing model of stand selection cutting. Sci. Ailvae Ainicae 2014, 40, 25–31. [Google Scholar]
  22. Hui, G.Y.; Klaus, V.G.; Hu, Y.B.; Xu, H. Structure-Based Forest Management; China Forestry Publishing House: Beijing, China, 2007. [Google Scholar]
  23. Li, Y.F.; Hui, G.Y.; Zhao, Z.H.; Hu, Y.B. The bivariate distribution characteristics of spatial structure in natural Korean pine broad-leaved forest. J. Veg. Sci. 2012, 23, 1180–1190. [Google Scholar] [CrossRef]
  24. Bi, H.X.; Li, X.Y.; Li, J.; Guo, M.X.; Liu, X. Study on suitable vegetation cover on Loess Area based on soil water balance. Sci. Ailvae Ainicae 2007, 43, 17–23. [Google Scholar]
  25. Chi, D.K.; Wang, H.; Li, X.B.; Liu, H.H.; Li, X.H. Estimation of the ecological water requirement for natural vegetation in the Ergune River basin in Northeastern China from 2001 to 2014. Ecol. Indic. 2018, 92, 141–150. [Google Scholar] [CrossRef]
  26. Fu, W.; Huang, M.B.; Gallichand, J.Q.; Shao, M.A. Optimization of plant coverage in relation to water balance in the Loess Plateau of China. Geoderma 2012, 173–174, 134–144. [Google Scholar] [CrossRef]
  27. Wang, J. Study on Construction of Ecological Rehabilitation System in Aquatic-Terrestrial Ecotone, Lijinag River; Beijing Forestry University: Beijng, China, 2016. [Google Scholar]
  28. Bochet, E.; García-Fayos, P. Factors controlling vegetation establishment and aater erosion on motorway slopes in Valencia, Spain. Restor. Ecol. 2004, 12, 166–174. [Google Scholar] [CrossRef]
  29. Bochet, E.; García-Fayos, P.; Tormo, J. How can we control erosion of roadslopes in semiarid mediterranean areas? Soil improvement and native plant establishment. Land Degrad. Dev. 2010, 21, 110–121. [Google Scholar] [CrossRef]
  30. Zhang, Y.; Huang, M.B.; Lian, J.J. Spatial distributions of optimal plant coverage for the dominant tree and shrub species along a precipitation gradient on the central Loess Plateau. Agric. Forest Meteorol. 2015, 206, 69–84. [Google Scholar] [CrossRef]
  31. Zhao, C.L.; Jia, X.X.; Zhu, Y.J.; Shao, M.A. Long-term temporal variations of soil water content under different vegetation types in the Loess Plateau, China. Catena 2017, 158, 55–62. [Google Scholar] [CrossRef]
  32. Jiang, C.; Zhang, H.Y.; Zhang, Z.D. Spatially explicit assessment of ecosystem services in China’s Loess Plateau: Patterns, interactions, drivers, and implications. Global Planetary Chang. 2018, 161, 41–52. [Google Scholar] [CrossRef]
  33. Wang, L.; Shao, M.A.; Li, Y.Y. Study on relationship between growth of artificial Robinia Pseudocacia and soil desiccation in the Loess Plateau of northern Shanxi Province. Sci. Ailvae Ainicae 2004, 40, 84–91. [Google Scholar]
  34. Wang, Y.P.; Shao, M.A. Soil water carrying capacity of apricot forest on Loess Region in northern Shaanxi. Sci. Ailvae Ainicae 2009, 45, 1–7. [Google Scholar]
  35. Chang, Y.F.; Bi, H.X.; Ren, Q.F.; Xu, H.S.; Cai, Z.C.; Dan, W.; Liao, W.C. Soil moisture stochastic model in Pinus tabuliformis forestland on the Loess Plateau, China. Water 2017, 9, 354. [Google Scholar] [CrossRef]
  36. Hou, G.R.; Bi, H.X.; Wei, X.; Kong, L.X.; Wang, N.; Zhou, Q.Z. Response of soil moisture to single-rainfall events under three vegetation types in the gully region of the Loess Plateau. Sustainability 2018, 10, 3793. [Google Scholar] [CrossRef]
  37. Liu, Z.Q.; Yu, X.X.; Jia, G.D. Water uptake by coniferous and broad-leaved forest in a rocky mountainous area of northern China. Agric. Forest Meteorol. 2019, 265, 381–389. [Google Scholar] [CrossRef]
  38. Takahashi, H.; Scott, T.K. Intensity of hydrostimulation for the induction of root hydrotropism and its sensing by the root cap. Plant. Cell Environ. 1993, 16, 99–103. [Google Scholar] [CrossRef]
  39. Ponce, G.; Corkidi, G.; Eapen, D.; Lledías, F.; Cárdenas, L.; Cassab, G. Root hydrotropism and thigmotropism in\r, arabidopsis thaliana\r, are differentially controlled by redox status. Plant. Signal. Behav. 2017, 12, e1305536. [Google Scholar] [CrossRef]
  40. Bonn, A.; Allott, T.; Evans, M.; Joosten, H.; Stoneman, R. Peatland Restoration and Ecosystem Services (Science, Policy and Practice) || Ecosystem Services, Degradation and Restoration of Peat Swamps in the South East Asian Tropics; Cambridge University Press: Cambridge, UK, 2016; pp. 253–288. [Google Scholar]
  41. Dietrich, D. Hydrotropism—How roots search for water. J. Exp. Bot. 2018, 69, 2759–2771. [Google Scholar] [CrossRef]
  42. Chen, Y.H.; Wu, X.F.; Hao, J.; Li, K.L.; Liu, J. The adaptability and decontamination effect of four kinds of woody plants in constructed wetland environment. Acta Ecol. Sin. 2014, 34, 916–924. [Google Scholar]
  43. Belnap, J.; Welter, J.R.; Grimm, N.B.; Barger, N.; Ludwig, J.A. Linkages between microbial and hydrologic processes in arid and semi-arid watersheds. Ecology 2005, 86, 298–307. [Google Scholar] [CrossRef]
  44. Benyon, R.G.; Theiveyanathan, S.; Doody, T.M. Impacts of tree plantations on groundwater in south-eastern Australia. Aust. J. Bot. 2006, 54, 181–192. [Google Scholar] [CrossRef]
  45. An, N.; Tang, C.S.; Xu, S.K.; Gong, X.P.; Shi, B.; Inyang, H.I. Effects of soil characteristics on moisture evaporation. Eng. Geol. 2018, 239, 126–135. [Google Scholar] [CrossRef]
  46. Shangguan, Z.P.; Zheng, S.X. Ecological properties of soil water and effects on forest vegetation in the Loess Plateau. Int. J. Sustain. Dev. World Ecol. 2006, 13, 307–314. [Google Scholar] [CrossRef]
  47. Zhang, J.J.; He, W.; Na, L. Study on appropriate of Pinus tabulaeformis and Robinia Pseudoacacia for soil and water conservation forests in Loess area. Sci. Soil Water Conserv. 2007, 5, 55–59. [Google Scholar]
  48. Medina, A.; Vassilev, N.; Alguacil, M.M.; Roldán, A.; Azcón, R. Increased plant growth, nutrient uptake, and soil enzymatic activities in a desertified mediterranean soil amended with treated residues and inoculated with native mycorrhizal fungi and a plant growth-promoting yeast. Soil Sci. 2004, 169, 260–270. [Google Scholar] [CrossRef]
  49. Hazary, M.E.H. Effect of nitrogen and phosphorus fertilizer on yield and nutritional quality of jumbo grass (Sorghum Grass x Sudan Grass). Adv. Animal Vet. Sci. 2015, 3, 444–450. [Google Scholar] [CrossRef]
  50. Song, X.D.; Ye, Y.H.; Zhang, Y.; Zeng, D.H.; Hang, Y.Y. Study on soil nutrients and moisture as well as soil microorganism at grassland-forestland interface in gully region of Loess Plateau. J. Northwest. Agric. For. Univ. 2007, 35, 55–60. [Google Scholar]
  51. Zhang, J.M.; Jia, G.D.; Liu, Z.Q.; Wang, D.D.; Yu, X.X. Populus simonii Carr. Reduces wind erosion and improves soil properties in Northern China. Forests 2019, 10, 315. [Google Scholar] [CrossRef]
  52. Pokorný, R. Sap flux simulation and tree transpiration depending on tree position within stand of different densities. Phyton Ann. Rei Bot. A 2000, 40, 157–162. [Google Scholar]
  53. Asbjornsen, H.; Tomer, M.D.; Gomez-Cardenas, M.; Brudvig, L.A.; Greenan, C.M.; Schilling, K. Tree and stand transpiration in a Midwestern bur Oak savanna after elm encroachment and restoration thinning. Forest Ecol. Manag. 2007, 247, 209–219. [Google Scholar] [CrossRef]
  54. Guo, B.N.; Zhang, J.J.; Wang, Z.; Hao, R.; Huang, M. Characteristics of water consumption by Robinia pseudoacacia forest on Loess Plateau of western Shanxi Province, China. Chin. J. Ecol. 2012, 31, 2736–2741. [Google Scholar]
  55. Korhonen, J.; Wihersaari, M.; Savolainen, I. Industrial ecosystem in the Finnish forest industry: Using the material and energy flow model of a forest ecosystem in a forest industry system. Ecol. Econ. 2001, 39, 145–161. [Google Scholar] [CrossRef]
  56. Schmitt, T.J.; Dosskey, M.G.; Hoagland, K.D. Filter strip performance and processes for different vegetation, widths, and contaminants. J. Environ. Qual. 1999, 28, 1479–1489. [Google Scholar] [CrossRef]
  57. Wang, J.; Zhang, L.; Lu, S.; Jin, X.; Gan, S. Contaminant removal from low-concentration polluted river water by the bio-rack wetlands. J. Environ. Sci. 2012, 24, 1006–1013. [Google Scholar] [CrossRef]
  58. Borin, M.; Bigon, E. Abatement of NO3-N concentration in agricultural waters by narrow buffer strips. Environ. Pollut. 2002, 117, 165–168. [Google Scholar] [CrossRef]
  59. Hou, G.R.; Bi, H.X.; Yu, X.X.; Jia, G.D.; Wang, D.D.; Zhang, Z.Y.; Liu, Z.Q. A vegetation configuration pattern with a high-efficiency purification ability for TN, TP, AN, AP, and COD based on comprehensive assessment results. Sci. Rep. 2019, 9, 2427. [Google Scholar] [CrossRef] [PubMed] [Green Version]
Figure 1. Distribution of standard plots.
Forests 10 00663 g001
Figure 2. Spatial distribution of stand density (SD), vegetation transpiration rate (VTR), soil moisture content (SMC) and soil evaporation rate (SER).
Forests 10 00663 g002
Figure 3. Spatial distributions of soil nutrients (soil total nitrogen, soil total phosphorous, total potassium, soil CaCO3, soil organic matter).
Forests 10 00663 g003
Figure 4. Soil moisture content in R. pseudoacacia forestland of different stand densities.
Forests 10 00663 g004
Figure 5. Determining the optimal stand density and its ranges for R. pseudoacacia forest.
Forests 10 00663 g005
Table 1. Basic information on standard R. pseudoacacia forestland.
Stand Density (plants·hm−2)Elevation (m)Slope (°)Av. Tree High (m)Av. DBH (cm)Av. Tree Age (a)Leaf Area Index
~5001170226.8 ± 1.197.5 ± 0.09251.61
~10001180299.7 ± 1.6110.5 ± 0.31261.78
~15001190228.6 ± 1.0613.9 ± 0.28251.98
~20001180239.5 ± 1.379.6 ± 0.55222.74
~25001120158.7 ± 1.639.6 ± 0.69233.24
~30001120267.8 ± 1.968.8 ± 0.65233.91
Table 2. Soil particle size analysis in R. pseudoacacia forestland of different stand densities.
Soil TypesStand Density (plants·hm−2)Soil Depth (cm)Soil Particle Size
Sand (%) (0.02~2 mm)Silt (%) (0.002~0.02 mm)Clay (%) (<0.002 mm)
Loessal soil5002090.349.660
4093.066.940
6091.758.250
8092.377.630
10090.819.190
10002070.8726.632.5
4074.0825.40.52
6073.2525.950.8
8074.8724.580.55
10073.3524.082.57
15002068.8930.11.01
4068.6629.32.04
6067.2930.731.98
8069.7727.352.88
10069.6227.822.56
20002076.0323.60.37
4079.7619.890.35
6075.4924.130.38
8079.919.740.36
10078.6320.840.53
25002082.8916.950.16
4080.1419.690.17
6084.6615.170.17
8083.7116.120.17
10083.1616.670.17
30002088.8211.180
4089.110.90
6085.214.80
8086.5113.490
10087.3812.620
Table 3. Statistical analysis of the soil nutrients, SMC, SER and VTR in R. pseudoacacia forestland.
IndicatorsMin.Max.Mean ± SESkewnessKurtosis
Stand density (plants·hm−2)35034001499 ± 531.061.48
Soil total nitrogen (g·kg−1)0.062.630.60 ± 0.032.256.04
Soil total phosphorous (g·kg−1)0.031.990.56 ± 0.023.0410.45
Soil total potassium (g·kg−1)4.1952.7217.96 ± 0.641.061.48
Soil CaCO3 (g·kg−1)139445.6 ± 1.120.431.03
Organic matter content (g·kg−1)1.3155.609.79 ± 0.582.519.20
Soil moisture content (%)5.6633.9711.54 ± 0.361.502.62
Soil evaporation rate (g·D−1)0.030.520.10 ± 0.012.457.30
Vegetation transpiration rate (g·D−1)0.431.930.91 ± 0.020.950.49
Table 4. Regression analysis of the soil nutrients in R. pseudoacacia forestland.
IndicatorsSDElevationSTHDBHAgeLAITNTPTKCaCO3OMCSMCSERVTR
SD1.000.000.040.050.06−0.030.337 **−0.010.000.910 **0.686 **0.148 *0.243 **−0.710 **0.761 **
Elevation0.051.000.248 **0.10−0.020.02−0.090.179 *0.020.05−0.080.241 **−0.04−0.090.00
S0.040.248 **1.00−0.120.214 **−0.01−0.010.01−0.080.04−0.06−0.10−0.080.110.04
TH0.050.10−0.121.00−0.218 **0.10−0.100.140.140.050.175 *0.02−0.167 *−0.080.02
DBH0.06−0.020.214 **−0.218 **1.000.040.172 *−0.01−0.020.06−0.11−0.151 *0.287 **0.140.00
Age−0.030.02−0.010.100.041.00−0.140.07−0.02−0.030.070.020.030.020.170 *
LAI0.337 **−0.09−0.01−0.100.172 *−0.141.00−0.11−0.080.337 **0.201 **−0.070.338 **−0.314 **−0.11
TN−0.010.179 *0.010.14−0.010.07−0.111.00−0.02−0.01−0.100.442 **−0.100.010.01
TP0.000.02−0.080.14−0.02−0.02−0.08−0.021.000.000.110.110.12−0.080.154 *
TK0.910 **0.050.040.050.06−0.030.337 **−0.010.001.000.686 **0.148 *0.243 **−0.710 **−0.06
CaCO30.686 **−0.08−0.060.175 *−0.110.070.201 **−0.100.110.686 **1.000.01−0.01−0.774 **0.10
OMC0.148 *0.241 **−0.100.02−0.151 *0.02−0.070.442 **0.110.148 *0.011.000.09−0.140.07
SMC0.243 **−0.04−0.08−0.167 *0.287 **0.030.338 **−0.100.120.243 **−0.010.091.00−0.110.10
SER−0.710 **−0.090.11−0.080.140.02−0.314 **0.01−0.08−0.710 **−0.774 **−0.14−0.111.000.00
VTR0.761 **0.000.040.020.000.170 *−0.110.010.154 *−0.060.100.070.100.001.00
1.SD is stand density, S is slope, TH is tree height, DBH is diameter at breast height, Age is forest age, LAI is leaf area index, TN is soil total nitrogen, TP is soil total phosphorous, TK is soil total potassium, CaCO3 is soil CaCO3, OMC is soil organic matter content, SMC is soil moisture content, SER is soil evaporation rate, VTR is vegetation transpiration rate, * Correlation is significant at the 0.05 level, ** correlation is significant at the 0.01 level.

