Article

Nitrogen Deposition and Responses of Forest Structure to Nitrogen Deposition in a Cool-Temperate Deciduous Forest

1
The United Graduate School of Agricultural Science, Gifu University, 1-1 Yanagido, Gifu 501-1193, Japan
2
River Basin Research Center, Gifu University, 1-1 Yanagido, Gifu 501-1193, Japan
3
Takayama Field Station, River Basin Research Center, Gifu University, 919-47 Iwai, Takayama, Gifu 506-0815, Japan
*
Author to whom correspondence should be addressed.
Present address: Faculty of Education and Integrated Arts and Sciences, Waseda University, 2-2 Wakamatsu, Shinjuku, Tokyo 162-8480, Japan.
Forests 2019, 10(8), 631; https://doi.org/10.3390/f10080631
Submission received: 19 June 2019 / Revised: 23 July 2019 / Accepted: 25 July 2019 / Published: 27 July 2019
(This article belongs to the Section Forest Ecology and Management)

Abstract

:
Few studies have reported the estimation of nitrogen (N) deposition, including dissolved organic N (DON) fluxes, through water flows and the contribution of snowfall in Asia. In this study, the concentrations and fluxes of DON and dissolved inorganic N (DIN) in bulk precipitation (BP), the throughfall (TF) of trees and understory dwarf bamboo, and stemflow (SF) were evaluated in a cool-temperate forest over three years to clarify N fluxes via precipitation and responses of trees and understory canopies to N deposition. The input of N to the study site in BP was 11.1 ± 1.71 kg N ha−1 year−1, with a significant contribution from DON (78%). Snowfall fluxes contributed up to 46% of the total N input, with variations related to the amount of snowfall (2.08–5.52 kg N ha−1 year−1). The forest canopy enriched DON (2.11 ± 0.42 kg N ha−1 year−1) but consumed NO3 + NO2–N (−0.73 ± 0.19 kg N ha−1 year−1). In contrast, through the understory bamboo canopy, DON (−1.02 ± 0.55 kg N ha−1 year−1) decreased while DIN (0.35 ± 0.44 kg N ha−1 year−1) increased. This study indicates that DON and snowfall should not be neglected when evaluating total N deposition into forest ecosystems, especially in remote regions. The canopy processes related to the dissolved N in the presence of understory plants might have significant implications for the internal N cycle in forest ecosystems.

1. Introduction

Nitrogen (N), which is considered an essential nutrient for plants, can be deposited into forest ecosystems from the atmosphere via the hydrological pathway or dry deposition process. Anthropogenic N generated from intensive human activities amounted to more than 160 Tg N per year in the 1990s [1]. With increasing N pollution of the atmosphere, N deposition into forest ecosystems shows an increasing trend. It has been estimated that N deposition in 2050 will be approximately two-fold greater than that in 1990 at the global scale [2]. Therefore, atmospheric N deposition has been highlighted as a significant concern in terms of its impact on forest ecosystems [3,4,5].
Multiple studies have focused on the estimation of dissolved inorganic N (DIN) to comprehend the effects of N deposition on forest ecosystems [6,7,8,9,10]. N deposition tends to enhance litter decomposition, mineralization, and nitrification processes in the soil N cycle [11]. Therefore, tree carbon storage has been estimated to increase due to N deposition [12]. On the other hand, N load thresholds have been reported for temperate deciduous forests, such as 10–15 kg N ha−1 year−1 across Europe [13] and 10–30 kg N ha−1 year−1 across China [14]. Excess N loads would result in negative effects on forest ecosystems, such as soil acidification [15,16,17] and N leaching via seepage water or runoff [18,19].
In contrast to studies on N deposition that have focused on inorganic N, determination of the critical N load for ecological health should take organic N into consideration. DON deposition contributed up to one-quarter of N deposition across Europe and Asia or 35%–40% of N deposition across the Americas [20]. It is noteworthy that some studies have revealed more than half the contribution from DON to N deposition at remote sites [21,22]. However, most studies on the effects of N deposition to forest ecosystems have focused on DIN deposition input or direct DIN (NH4+ and/or NO3) addition to soil. In the soil N cycle of forest ecosystems, DON is considered to be a vital intermediate N compound when the particulate organic N is decomposed and transferred to DIN for direct uptake by plants and microbes. Although DON deposition has been gradually recognized as an important component of N deposition recently, we are still far from comprehending the interaction mechanisms between DON deposition input and the internal N cycle in the forest ecosystems. Considering forest ecosystems characterized by abundant annual precipitation input (>2000 mm), the information gap is even greater. Cool-temperate forest ecosystems in Asia have been neglected compared with those on North America and Europe, having limited precipitation [23,24,25,26]. Therefore, it is critical to also identify DON deposition levels for supplying a premise to get a more complete understanding of forest ecosystem responses to N deposition.
The primary point of contact between a forest ecosystem and N deposition is the canopy. From the perspective of the hydrological cycle, bulk precipitation (BP) can be divided into two pathways by which precipitation reaches the soil: throughfall (TF) and stemflow (SF). The soil N cycle may be impacted by water flows (TF and SF). TF is known to be an important hydrological pathway that reflects canopy interactions and dry deposition in the internal N cycle of forest ecosystems. In contrast, we are yet to fully understand the N dynamics in SF, which can concentrate a greater water flux into the root zone [27]. Some work has studied tree canopy N fluxes using a net TF flux approach (TF+SF–BP) to quantify the adjustment of the N flux to the soil by trees, revealing that an individual tree canopy may act as either a source or sink of N when rainfall passes through it to the soil [23,25,28]. Furthermore, the TF of understory plants has often been overlooked. In forest ecosystems with dense understory plants, there may be a major influence of the understory canopy on TF passing through the tree canopy to the soil [29]. Therefore, TF and SF are considered important conduits between the atmospheric N deposition input and the soil N cycle of forest ecosystems. As such, it is necessary to better understand the fate of N deposition based on the hydrological cycle and N nutrient cycling in forest ecosystems.
The present study was designed to estimate the concentrations and fluxes of dissolved N in BP, TF above a bamboo canopy (TFa), TF below a bamboo canopy (TFb), and SF over three years in the Takayama forest site, central Japan, which is a cool-temperate forest with a dense bamboo understory. The site was established as one of the AsiaFlux network sites for measuring CO2 flux in 1993 [30]. Not only eddy covariance-based net ecosystem production (NEP) but also biometric-based carbon (C) flux measurement have been conducted intensively at this site. Therefore, where and how the forest stores C is well known [31]. Moreover, Ohtsuka et al. [32] revealed that the net primary production (NPP) of annual woody tissue varied markedly at the Takayama forest site and was positively correlated with eddy covariance-based NEP. They suggested that the interannual variability in the ecosystem C exchange was directly responsible for much of the interannual variation of C accumulation in the woody components. Thus, the direct effects of N deposition on woody growth greatly affect C sequestration. Moreover, Chen et al. [33] measured the concentrations and fluxes of dissolved organic carbon (DOC) in the Takayama forest site and quantified the contribution of DOC from various forest water fluxes, such as TF and SF. The present study aims to further elucidate the links between C and N cycling in forest ecosystems.
To understand N cycling in the Takayama forest over three years, N fluxes (BP, TF, and SF) were used. These fluxes included snowfall, which is a non-negligible component of precipitation in cool-temperate forest ecosystems. The effects of the understory canopy on N fluxes derived from N deposition were also quantified at the study site. We hypothesized that (i) N deposition to the Takayama forest site would be characterized by a low DIN contribution but high DON contribution (including from snowfall deposition) and (ii) the dense canopy layers of trees and understory dwarf bamboo would have substantial effects on N deposition. We attempted to address the following questions to test these hypotheses: (1) What is the contribution of dissolved N in rainfall and snowfall to N deposition? (2) What are the dynamics and characteristics of the concentrations and fluxes of DON and DIN in SF, TFa, and TFb? (3) What are the responses of the tree canopy and bamboo canopy to N deposition?

2. Materials and Methods

2.1. Study Site

This study was conducted in a cool-temperate deciduous broad-leaved forest (Takayama forest), located on mid slope of Mt. Norikura in the Takayama Forest Research Station belonged to the River Basin Research Center, Gifu university, central Japan (36°08′ N, 137°25′ E, 1420 m a.s.l.). A permanent plot of 1 ha (100 m × 100 m) was set on a west-facing slope for field measurements since 1998 (Figure 1).
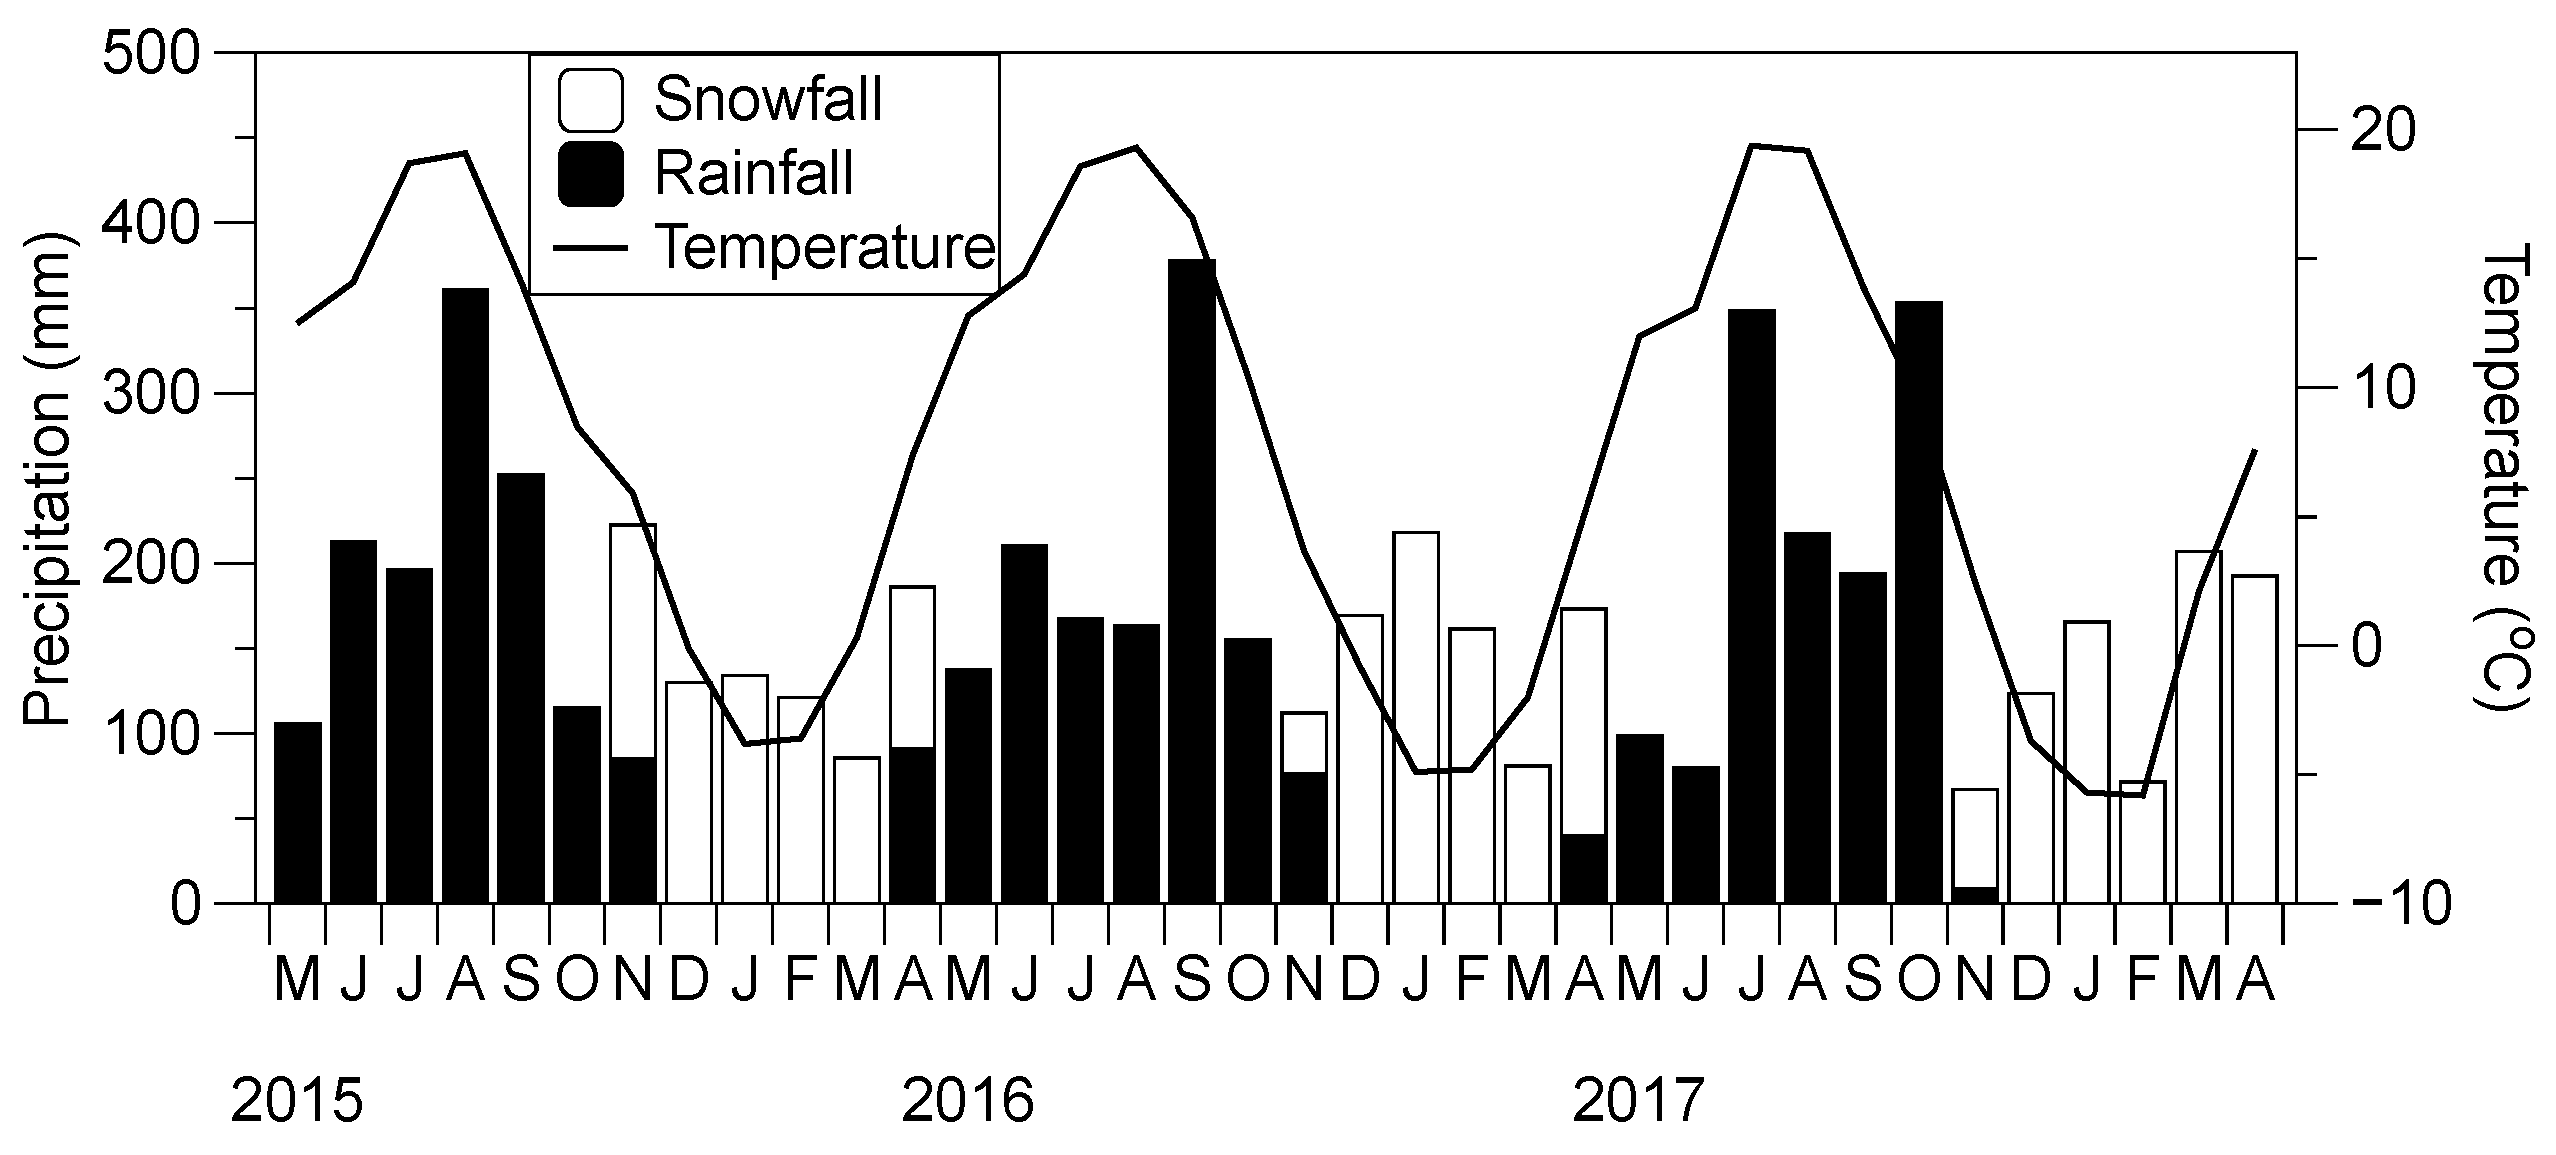
The Takayama forest site is an approximately 50-year-old forest study site dominated by Quercus crispula (26.9% in total basal area), Betula ermanii (24.6%), and B. platyphylla var. japonica (14.6%). Only 2.8% of evergreen species are present [33]. The forest floor is covered (ca. 40 stems m−2) by dense dwarf bamboo grass Sasa senanensis at 1–1.5 m height [34]. The soil at the study site was classified as an andisol along with Japanese volcanic ash soils [35]. The climate is seasonal cool-temperate, with a mean annual air temperature of 7.2 °C and a mean annual precipitation of 2215 mm (average 40% contribution from snowfall) during the period from 2010 to 2018. Figure 2 shows the precipitation and air temperature at the study site during the sampling time. The snow depth is usually 1–2 m in the snow season (December–April).

2.2. Sampling of N fluxes in Different Water Fluxes

In consideration of the presence of snow cover during the snow season, we set up samplers to collect BP, TF, and SF during the growing season and collected snow samples during the snow season. During the growing season of years 2015–2017, BP was collected in bottles (20 L) equipped with funnels (collection area: 0.0346 m2). The bottles (3 replicates from July 2016) were set up in areas near the permanent plot but without a tree canopy. The TF collectors were the same as those for BP, except for the volume of the bottles (12 L) and the fact that they were evenly distributed within the permanent plot (9 replicates). Owing to the dense cover of dwarf bamboo on the forest floor, a pair of TF collectors was set up to collect TFa and TFb. An SF collector consisted of a polyethylene film surrounding a tree trunk (like a collar), a tube connecting the film to a rain gage (HOBO RG3), and a reservoir tank (24 L). SF collectors were set up on three major tree species (3 replicates each). After measuring total volume using a measuring cylinder or rain gage, subsamples from each type of collector were placed into polyethylene bottles (100 mL) for chemical analysis in the same manner once per month. After each sampling time, 10 mL of 0.1 mg L−1 Cu(Br)2 solution was added to the collectors to prevent microbial alteration during collector storage and transit.
During the snow season, snowpack samples were collected in January 2016, January 2017, and March 2018, each on three sampling occasions. Because there was no canopy cover (understory dwarf bamboo was overwhelmed by thick snowpack during the snow season), we assumed that TF was the same as BP during this period. Moreover, no SF was considered to have occurred. Three random locations were selected as sampling points within the permanent plot. Snow samples were collected using a 100 mL soil corer from the snow surface to the soil surface in 5 cm depth layers (35–30 cm, 25–20 cm, 15–10 cm, and 5–0 cm for sampling in 2016; 105–100 cm, 85–80 cm, 65–60 cm, 45–40 cm, 25–20 cm, and 15–10 cm for sampling in 2017; and 105–100 cm, 80–75 cm, 60–55 cm, 40–35 cm, 20–15 cm, and 10–5 cm for sampling in 2018). Snow sampling was conducted when the snowpack had accumulated to its maximum. The samples were placed into sealed plastic bags. Later, the melted-snow samples were transferred into 100 mL bottles for storage prior to chemical analysis.

2.3. Chemical Analysis

After filtration through a 0.45 µm nitrocellulose membrane, the water samples were stored in a freezer and kept in the dark until analysis. Concentrations of NH4–N, NO3 + NO2–N, and total dissolved N (TDN), were measured by a nutrient analyzer (QuAAtro 2-HR) using a colorimetric method and continuous flow analysis. TDN was oxidized to NO3 by an alkaline persulfate via combustion at high temperature in the analyzer for concentration measurement. In each analysis run, standard solutions with 0.5 mg L−1 concentration (NO2–N and NO3–N) were used to check the recovery of NO3 during the oxidation process, with the oxidation efficiency kept over 90%. The limits of quantification were 0.01 mg L−1 for NH4–N and NO3 + NO2–N. Standard solutions were prepared in distilled water with 0–2 mg L−1 of concentration range for NH4–N, NO3 + NO2–N, and TDN. The concentration of DON was calculated by difference between TDN and the sum of NH4–N and NO3 + NO2–N (DIN).

2.4. Flux Calculation

N fluxes (kg N ha−1 episode−1) were calculated based on the average concentration (mg L−1) and water depth (mm) in each sampling time [35].
N fluxes in SF and BP were calculated as follows:
F = hC/100
where F (kg N ha−1 episode−1) is N flux in each sampling time, h (mm) is water depth in each sampling time and C (mg L−1) is average concentration of N in each sampling time. Data of water depth in BP (rainfall and snowfall) were obtained from the meteorological station at the Takayama Field Station.
Water depth in SF was calculated based on basal area of trees in the permanent plot:
hSF = (VSF/b) (B/S)/100
where hSF (mm) is water depth in SF, VSF (L) is the volume collected by SF, b (m2) is the basal area of the sample tree, B (m2) is the total basal area of all trees in the permanent plot, and S (m2) is the permanent plot area.
N flux in TF was calculated as follows:
F = VTFC/100STF
where VTF (L) is volume collected by TF in each sampling time and STF (m2) is the collection area of the funnel.
The annual N flux (kg N ha−1 year−1) was calculated as follows:
Fa = ∑F
where Fa (kg N ha−1 year−1) is the annual N flux. During the snow season, the N flux in TF was assumed to be equal to the N flux in BP, and the N flux in SF was assumed to be equal to zero.
Assessment of the relative importance of dry deposition and wet deposition in BP was made according to the assumptions of [6]: (i) dry deposition from local sources dominates total deposition if a strong negative correlation exists between the rainfall and average N concentration, while the N deposition is independent of rainfall and (ii) wet deposition from long-range transport is prominent if average N concentration is independent of rainfall, and rainfall and N deposition show a positive correlation.
We used the net TF to identify the N fluxes that are influenced by the canopy. The net TF was calculated using flux data:
Net TFa = TFa + SF − BP
Net TFb = TFb − TFa
In this study, the SF of the understory dwarf bamboo was neglected because of (i) possible low contribution from the SF of bamboo forests to N fluxes in internal forest cycles [36] and (ii) measurement difficulties owing to the crowded (ca. 40 stems m−2) and thin culms (with a diameter at breast height of <1 cm) of the understory dwarf bamboo.
Correlations between rainfall in each rain event or water fluxes in TFb and N fluxes in each net TF were estimated to understand the canopy processes. This approach was first proposed by Lovett and Lindberg [37] and then improved by Aguillaume et al. [28]. It has been stated that a positive correlation between each rain event or water fluxes in TFb and N fluxes in each net TF indicates leaching from the canopy, whereas a negative correlation indicates consumption by the canopy and no significant correlation may be a result of dry deposition.

2.5. Statistical Analysis

Significant differences among the average concentration of dissolved N in each snow depth were assessed by one-way analysis of variance (ANOVA) with post hoc Tukey’s Honestly Significant Difference (HSD) tests. Significant differences for dissolved N concentrations between TFa and TFb were analyzed by paired two-sample t-tests. Spearman′s rank correlation coefficient for BP and net TF was applied to test significant correlations between water flux and the average dissolved N concentration or fluxes at each sampling time in the growing seasons. All statistical analyses were performed by R version 3.4.4.

3. Results

3.1. N Input via Bulk Precipitation

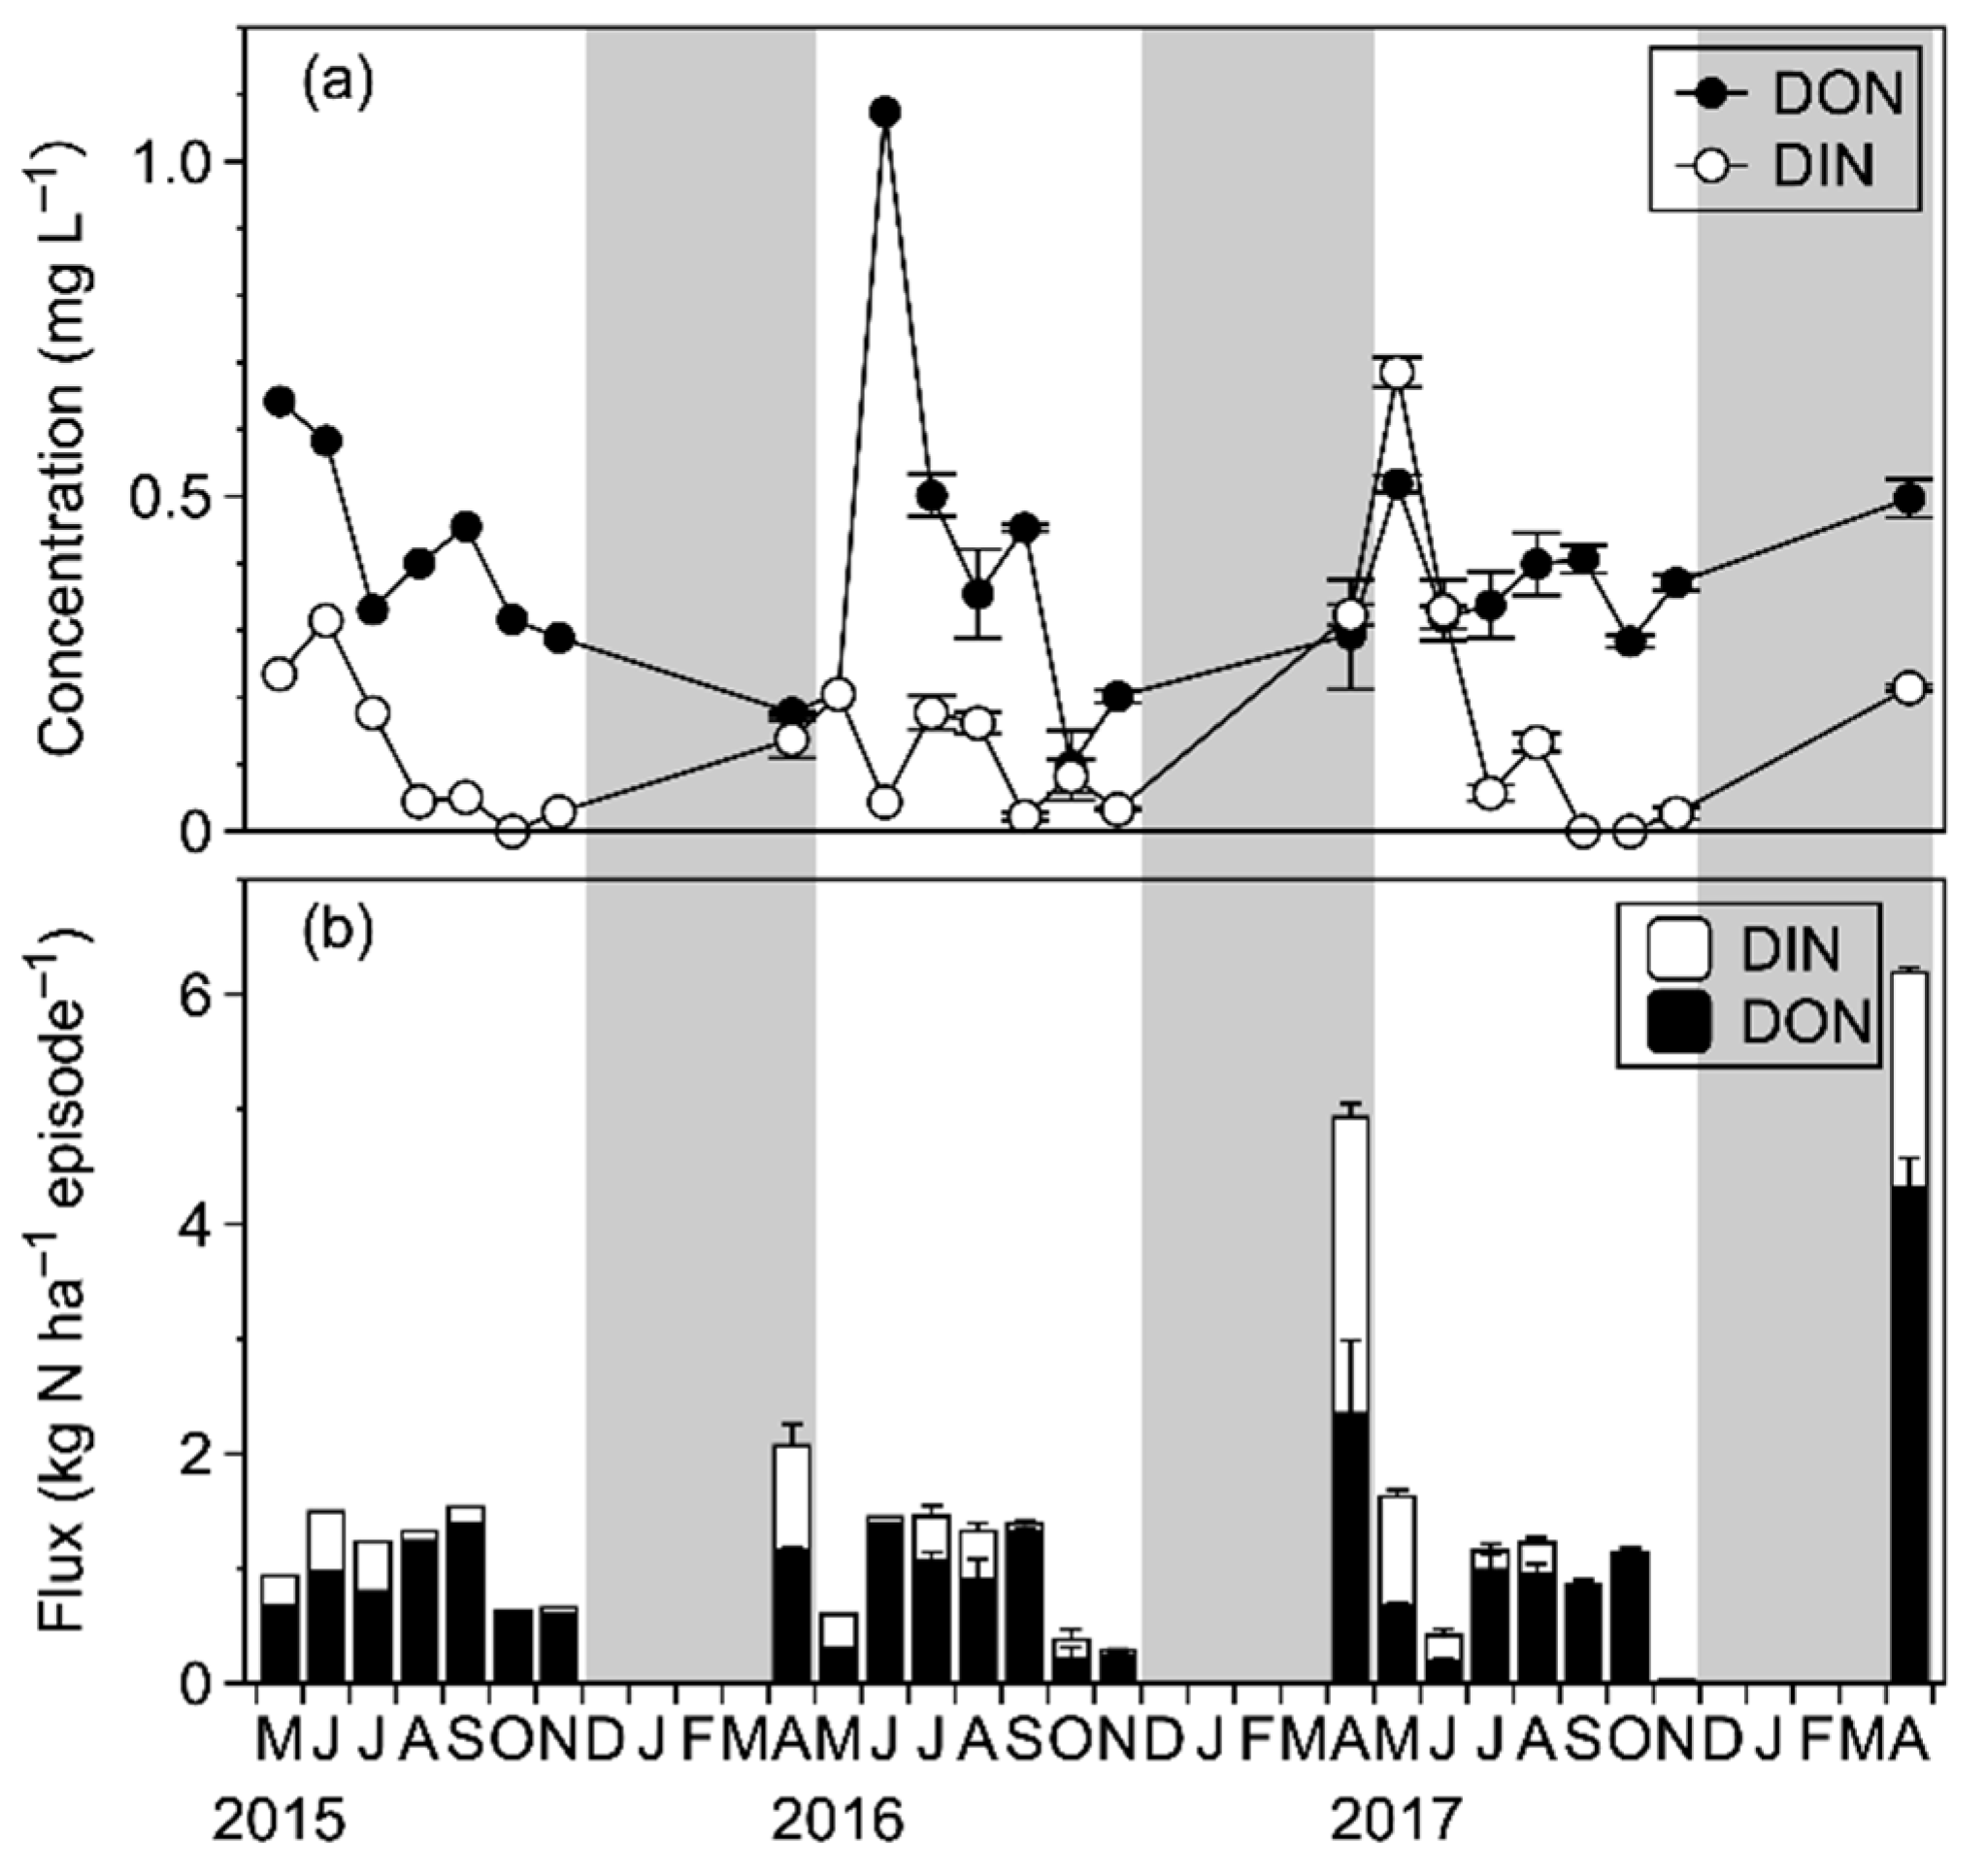
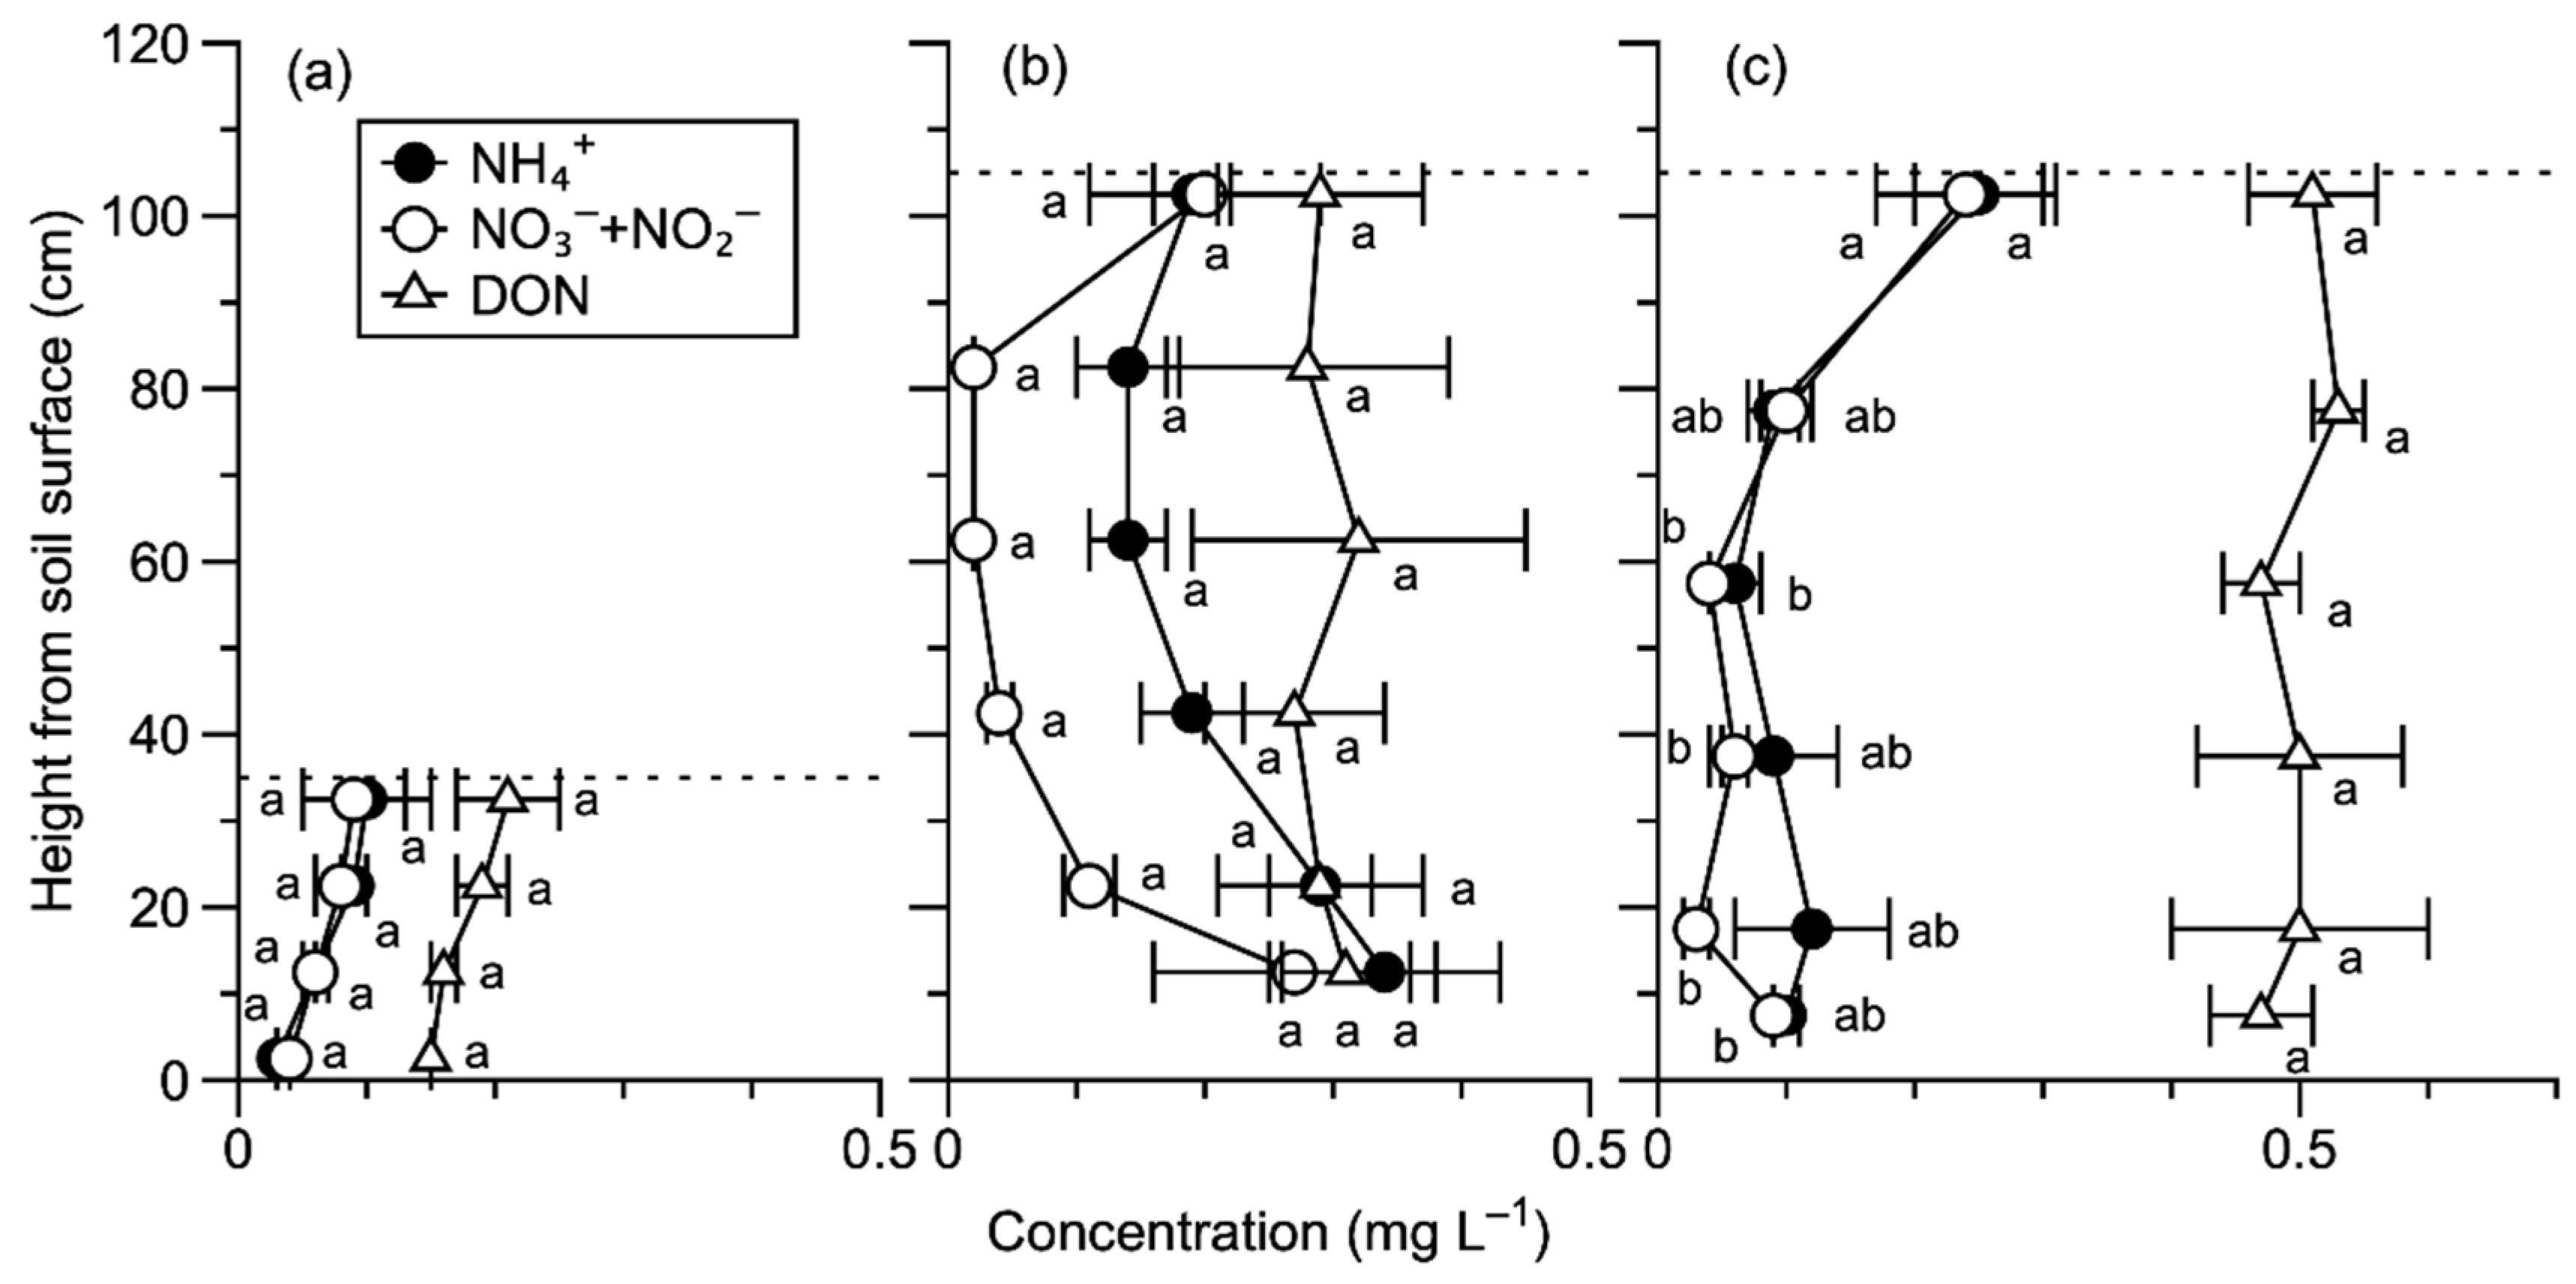
The average monthly concentration of DON in BP followed a clear seasonal pattern in each year, with the highest concentrations in spring (May to June) followed by a tendency to decrease over time (Figure 3a). The dynamics of DIN concentrations also revealed decreasing trends from spring to winter in 2015 and 2017, although there was no clear seasonal trend in 2016 (Figure 3a). For the average dissolved N flux pattern, DON fluxes were dominant in total N deposition. A higher dissolved N flux was deposited during summer, except for in 2017 when the flux during autumn was also high (Figure 3b). The depth of the snowpack was 35 cm, 105 cm, and 105 cm during the three years, respectively (Figure 4). Significant differences were observed between the concentration of NO3 + NO2–N at the top of the snow layer and that at the remaining snow depths and between the concentration of NH4–N at the top of the snow layer and at a depth of 60–55 cm in March 2018 (p < 0.05) (Figure 4). During the three years, snowfall flux fluctuated (2.08 ± 0.34 kg N ha−1 year−1, 5.17 ± 0.87 kg N ha−1 year−1, and 5.52 ± 0.64 kg N ha−1 year−1, respectively), owing to variations in the snowfall amount across the three years (659 mm, 799 mm, and 871 mm, respectively) (Figure 3).
For BP water fluxes, Takayama forest received 1344 ± 25.6 mm of rainfall and 776 ± 107 mm of snowfall during the three years (Table 1). The average concentrations of DON in rainfall and snowfall were 0.41 ± 0.03 mg L−1 and 0.32 ± 0.16 mg L−1, respectively, whereas the average concentrations of DIN were 0.13 ± 0.04 mg L−1 and 0.23 ± 0.09 mg L−1, respectively (Table 1). The average fluxes of DON in rainfall and snowfall amounted to 5.29 ± 0.39 kg N ha−1 period−1 and 2.61 ± 1.60 kg N ha−1 period−1 in each year, respectively, whereas the average fluxes of DIN were 1.52 ± 0.09 kg N ha−1 period−1 and 1.67 ± 0.85 kg N ha−1 period−1, respectively (Table 1). Overall, 11.1 ± 1.71 kg N ha−1 year−1 of dissolved N was deposited onto the study site by BP, with a 78% DON flux contribution and 22% DIN flux contribution (Table 1). In terms of snowfall, average snowfall flux contributed 37% of N deposition (23%, 43%, and 46%, respectively, for the three sampling years) (Figure 3 and Table 1). For DIN, there were no significant relationships between the average monthly concentrations or average fluxes and rainfall (Table 2). For DON, the average monthly concentrations remained almost constant with increasing rainfall, whereas the average fluxes dramatically increased with increasing rainfall. This indicates that wet deposition dominated DON fluxes in BP (Table 2).

3.2. N Fluxes in the Internal Forest Ecosystem

In SF, there were no clear seasonal trends in DON concentrations, whereas DIN concentrations tended to peak around summer in each of the three years (DON concentration range: 0.35–1.36 mg L−1; DIN concentration range: 0.02–0.40 mg L−1) (Figure 5a). The dissolved N flux in SF was extremely low in each sampling period (DON flux range: 0.01–0.04 kg N ha−1 episode−1; DIN flux range: 0.00–0.02 kg N ha−1 episode−1) (Figure 5b).
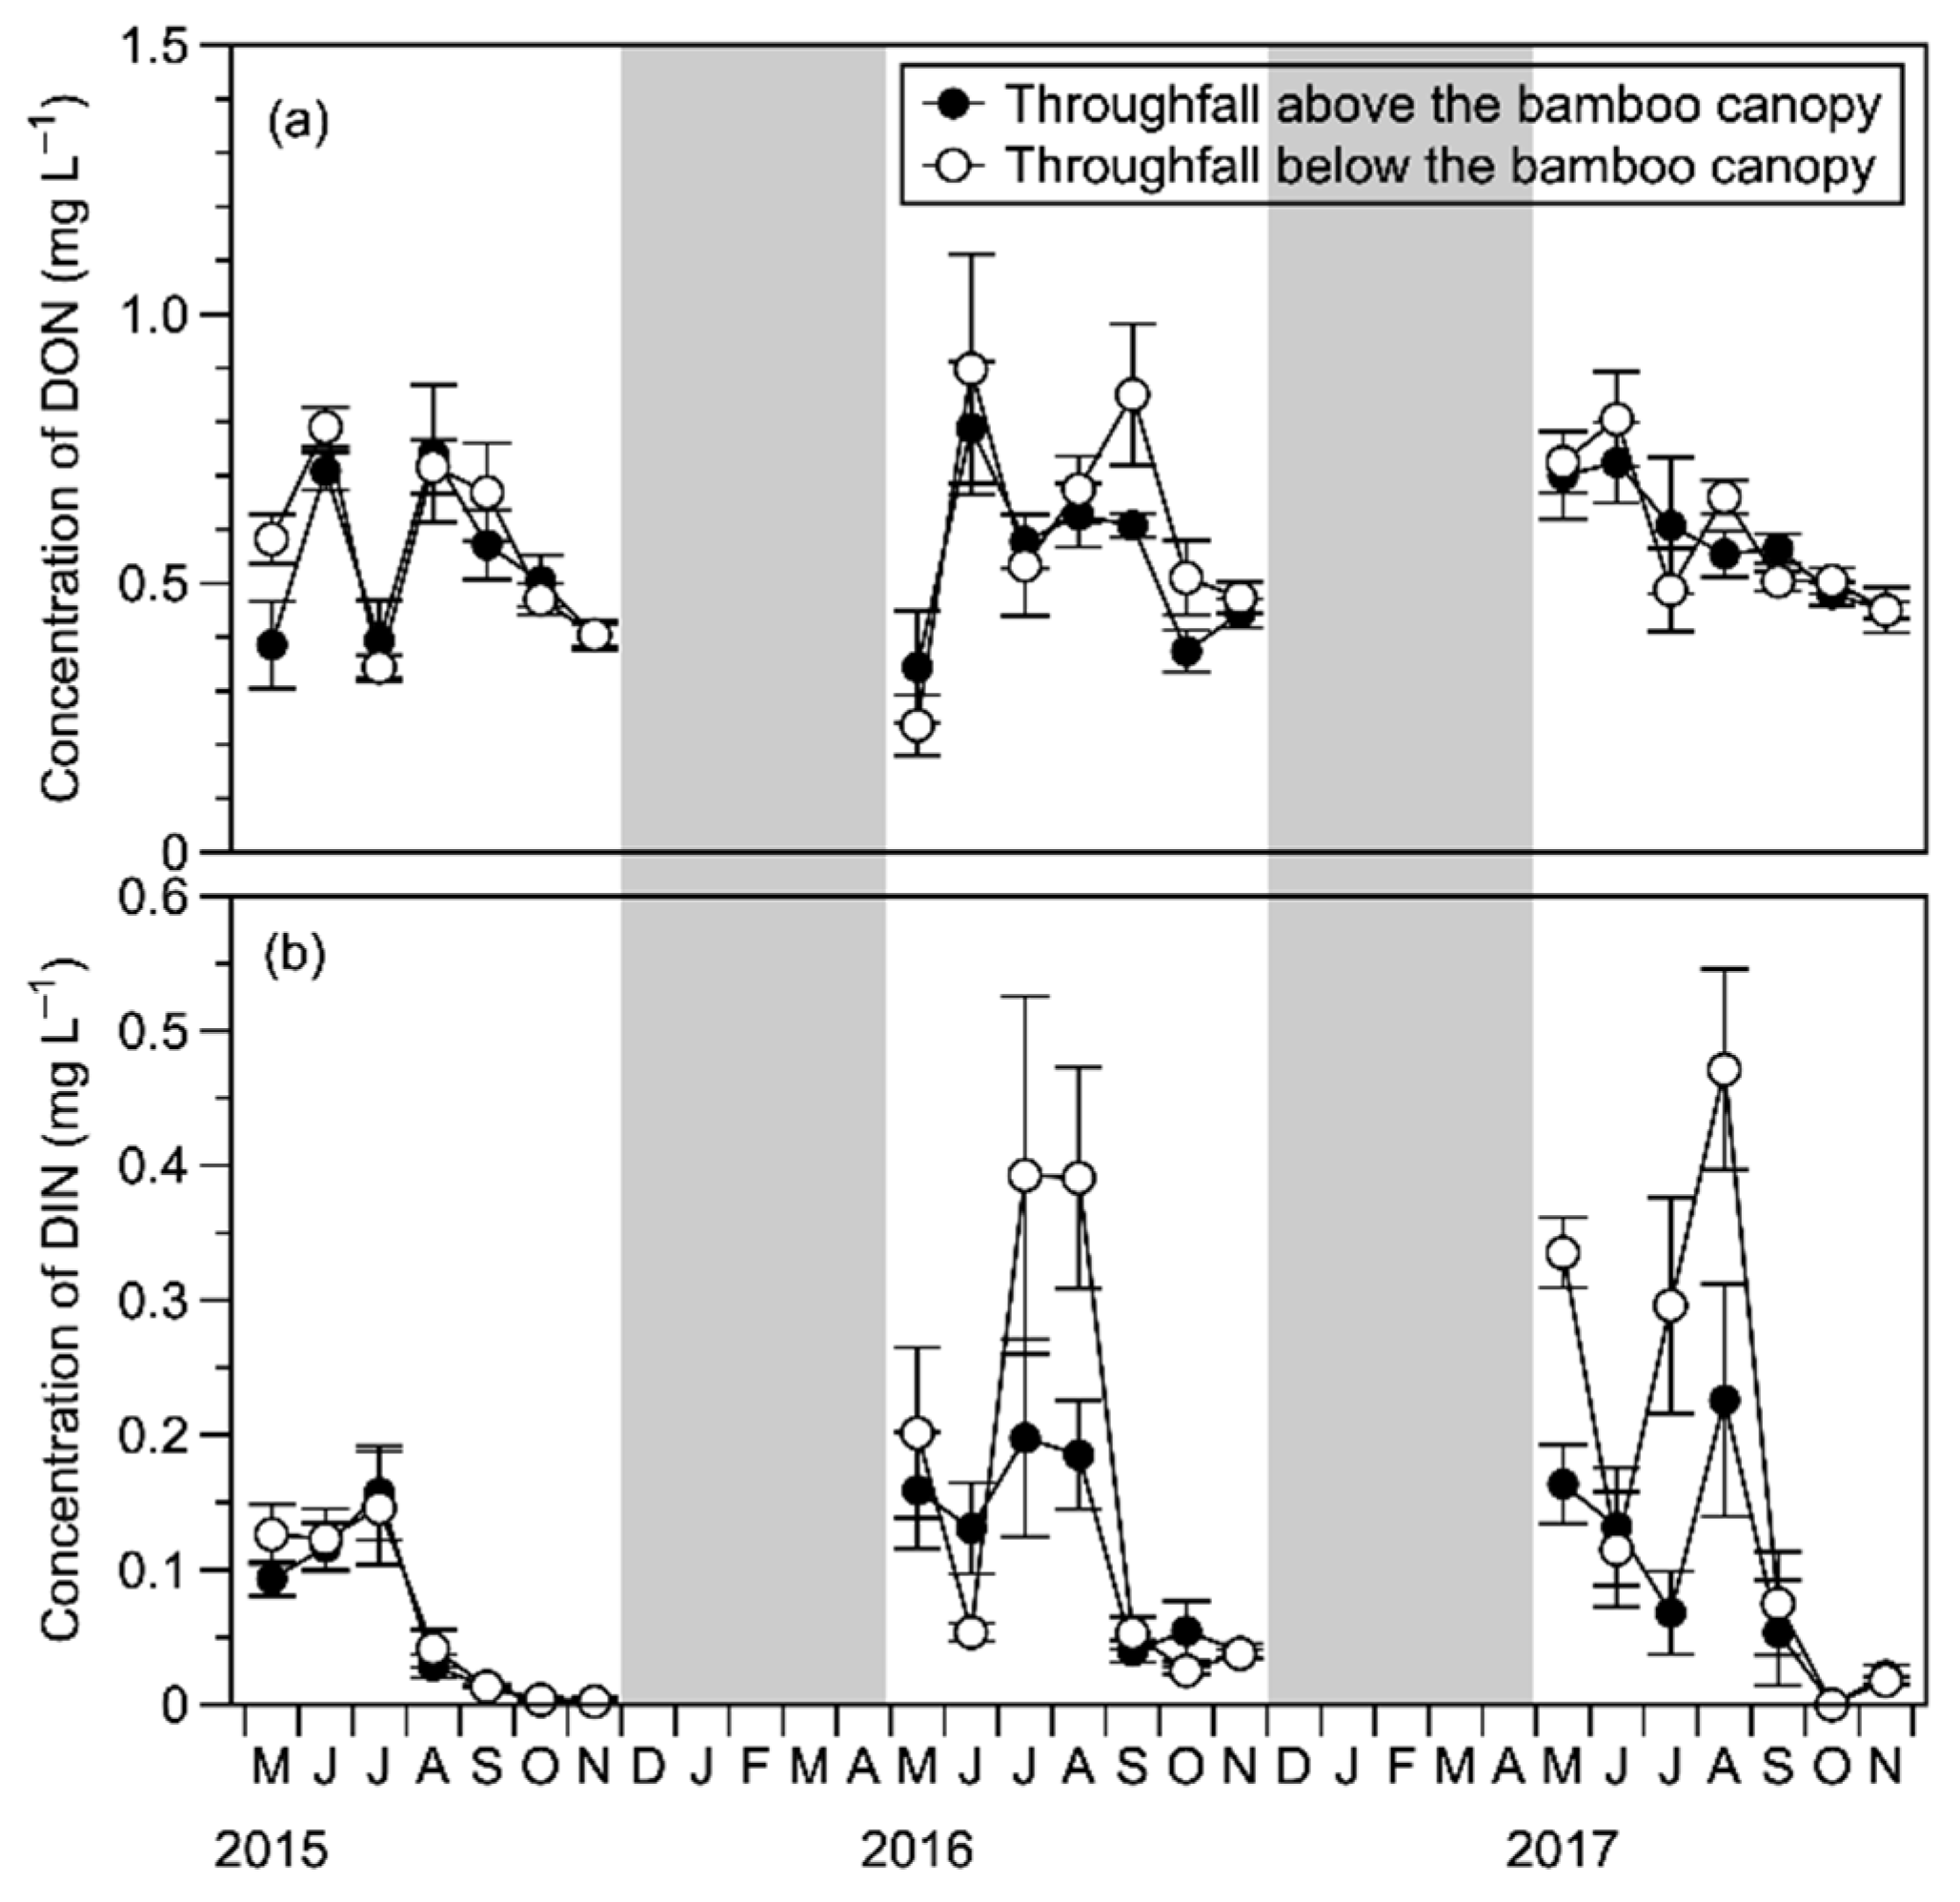
In TF, variations in the concentration of DON in TFa and TFb showed similar tendencies, with two peaks being observed around June and August. There was no clear seasonal variation in DIN concentration. Significant differences between the DIN concentration in TFa and TFb were found for some sampling times in 2016 and 2017 (Figure 6). The DON and DIN fluxes in TF showed the highest contributions during summer, except in 2017, when the DON flux during autumn was also high (Figure 7).
The amount of water flux decreased from BP, TFa, SF to TFb. TFa, and SF intercepted 50 mm of precipitation, with TFb subsequently intercepting 283 mm of precipitation (Table 3). For DIN, the average annual flux of NO3 + NO2–N in net TFa was negative, indicating that the tree canopy consumed 0.73 ± 0.19 kg N ha−1 year−1 as NO3 + NO2–N. However, a positive DIN value (0.35 ± 0.44 kg N ha−1 year−1) was found for net TFb (Table 3). For DON, leaching showed a positive value (2.11 ± 0.42 kg N ha−1 year−1) for net TFa, whereas a negative value (−1.02 ± 0.55 kg N ha−1 year−1) was found for net TFb (Table 3). The results of the Spearman correlations between the rainfall and DON fluxes in net TFa at each sampling time showed a positive relationship but a negative relationship between water fluxes in net TFa and DON fluxes in net TFb (p < 0.05) (Table 4). For the DIN flux, there was no significant correlation between rainfall and DIN fluxes in net TFa, or between water fluxes in TFa and DIN fluxes in net TFb (Table 4).

4. Discussion

4.1. N Deposition into the Takayama Forest Site

4.1.1. DIN and DON Concentrations during the Growing Season

The average monthly DIN concentration (0.13 ± 0.04 mg L−1) in rainfall was lower than that reported for China (0.15–5.10 mg L−1 at 38 forest stands) [8], Europe (0.18–1.33 mg L−1) [38], and Japan (0.49–1.92 mg L−1) [39]. The present study site was in a remote region with active agricultural activities, far from urban areas. The lower DIN concentration coincided with urban hotspots of DIN input [38], indicating that DIN decreased with increasing distance to the nearest large city with heavy traffic or fossil fuel combustion [9]. Although the major global sources of NH3 were emissions from livestock and fertilization use [40], the residence time of NH3 in the atmosphere was relatively short, with NH3 tending to be deposited near to the emission sources [41,42].
In contrast, the average monthly concentration of DON (0.41 ± 0.03 mg L−1) in rainfall was within the range of that reported for China (0.05–0.86 mg L−1 at 3 sites) [43] but higher than that reported for Europe (0.02–0.18 mg L−1 at 18 sites) [38]. Some studies reported that agricultural activities were possible sources of DON because of the higher DON concentration found at the agricultural site compared with other types of sites [25,43]. At this study site, temporal variations in DON concentration showed the highest concentrations in spring at the study site. This is in accordance with agricultural activities, such as the use of compost, which is mainly applied in spring, implying that fertilizer application was a possible source of DON for the study site.

4.1.2. Snow Contribution to N Deposition

Different annual variation patterns were observed with respect to the DIN concentrations at snowpack depths during three years. DIN movements, such as sublimation from the top of the snow layer, downward movement at the subsurface layers, and N mineralization along the ground, would occur upon the accumulation of the snowpack. There is little previous research on the annual variation of the dissolved N concentration at various snow depths. However, the seasonal variability of DIN concentration at snowpack depths in the alpine regions could be explained by air temperature contrasts [44], which would cause atmospheric mixing and air mass movements as well as the percolation of DIN into the subsurface layers [45]. These factors would cause annual variations of the DIN concentrations, which will require further research. The significantly high concentration of NO3 + NO2−N observed at the top of the snow layer in March 2018 implied that the NOx from NO3 photolysis regenerated NO3 in the temporary tops of the snow layer and was ultimately deposited at the top of the snow layer when the snowpack reached its maximum level [46].
There has been little previous research on the contribution of snowfall to N deposition even though Fahey et al. [47] studied the N cycle in lodgepole pine forests of the Medicine Bow Mountains in western North America. The DIN concentration in snowfall in the current study corresponds with that observed by Fahey et al. [47]. However, the DON concentration in the current study was greater than that reported by Fahey et al. [47]. Based on the N fluxes during the snow season, Fahey et al. [47] estimated that the N deposition for the lodgepole pine forest area (mean annual precipitation = 600 mm with a snowfall of 67%) was 1.7 kg N ha−1 year−1 from rainfall and 0.8 kg N ha−1 year−1 from snowfall (snowfall contribution = 32%). In contrast, N deposition in the Takayama forest site was greater, with an abundant annual precipitation of 2215 mm (with 40% snowfall) between 2010 and 2018. N deposition from snowfall was expected to become almost half of the TDN flux in the Takayama forest site, despite the extremely low contribution of snowfall to N fluxes (23%) in the snow season between 2015 and 2016. Large differences in the dissolved N flux were observed during the snow season between 2015 and 2018, indicating the necessity of the long-term estimation of snowfall because of unpredictable year-to-year variations in snowfall. The relatively high contribution of the snow flux (almost half of N deposition) indicates that snow flux should be considered with respect to N deposition in the cool-temperate forests.

4.1.3. Characteristics of Annual Dissolved N Fluxes

The average annual DIN flux (3.19 ± 0.80 kg N ha−1 year−1) was extremely low when compared with that at other study sites across the world [9,48,49,50,51] and slightly low when compared with that at 24 Japanese forested sites (3.5–10.5 kg N ha−1 year−1) [39]. The average annual DON flux (7.90 ± 1.22 kg N ha−1 year−1) was high compared with that in Europe (0.15–1.74 kg N ha−1 year−1 at 18 sites) [38] and in China (6.84 kg N ha−1 year−1 on average at 32 sites) [22]. For the study site, it can be deduced that the low DIN flux was due to low DIN concentrations (despite a high precipitation contribution), whereas the high DON flux was due to both high DON concentrations and a high precipitation contribution.
In all, 11.1 ± 1.71 kg N ha−1 year−1 TDN was input by BP to the Takayama forest. This level is lower than that found in other studies [48,50,51,52] even though it is slightly higher than that found at European sites (1.4–10 kg N ha−1 year−1) [38] because of the low precipitation contribution (an annual average of 802 mm) at the European sites. The contribution of DON to TDN (up to 78%) is higher than that found in most regions [22,38,50,51,52] but agrees well with studies reported by Zhang et al. [48] for forests in the Sichuan province (79%) and Tibet (72%) in China, both of which are located in remote areas. Clearly, DON was dominant at the present study site. Our data verified previous research that denoted that DON was the main component of the dissolved N input into the remote forest regions [21,48], achieving a complete picture and comprehension of N deposition in the forest ecosystems.

4.2. Responses of Forest Structure to N Deposition in the Internal N Cycle

4.2.1. Responses of Tree Canopy to N Deposition

The Spearman correlation between rainfall amount and DIN fluxes in net TFa indicated that dry deposition played a vital role in DIN fluxes for tree canopy interactions. Consumption of DIN by the tree canopy has been reported in many studies [25,28,52,53]. Direct foliage or bark uptake, epiphyte uptake, and microbial action can cause the consumption of DIN fluxes. Enrichment of DIN by the tree canopy also was reported by some studies, possibly due to dry deposition [25,28]. Buffering dry deposition and biological nitrification in tree canopies processing with DIN deposition input were demonstrated by isotopic tracers [54]. The net annual negative value of NO3 + NO2–N in net TFa implied that the annual consumption of NO3 + NO2–N by trees or microbes was greater than any dry deposition or canopy nitrification that might occur. Net consumption of NO3 + NO2–N in the tree canopy amounted to 0.73 ± 0.19 kg N ha−1 year−1, a low level compared with that reported by Lovett and Lindberg [23]. In consideration of the dry deposition and canopy nitrification effects on net TFa, total DIN consumption by the tree canopy should have been more than 0.73 ± 0.19 kg N ha−1 year−1.
For the DON flux, 2.11 ± 0.42 kg N ha−1 year−1 of DON was leached by the tree canopy. The leaching of DON from a canopy is a common phenomenon [23], which originates from pollen, insect excretions, and microbial activities [55,56].

4.2.2. Responses of Dwarf Bamboo Canopy to N Deposition

The Spearman correlation between water fluxes in TFa and DIN fluxes in net TFb indicated that dry deposition also played a vital role in DIN fluxes in dwarf bamboo canopy interactions. This dry deposition may have derived from the washing out of dissolved N gathered on the surfaces of bamboo leaves. Completely opposite responses of the overstory tree canopy and understory dwarf bamboo canopy to DIN deposition were found in the study site. Leaf wettability was determined to be a crucial factor for the ability of foliar DIN uptake at leaf level of evergreen and deciduous tree species [57,58]. The evergreen dwarf bamboo canopy probably hardly absorbed the DIN, as compared with the deciduous tree canopy, because the fibrous foliage was slowly wet as water flowed through the dwarf bamboo canopy.
A significant negative relationship between water fluxes in TFa and DON fluxes in net TFb showed that the consumption of DON by the dwarf bamboo canopy may have occurred. There are two possible reasons for this contradiction to the common leaching process of DON from canopies. Firstly, it was reported that plants can consume some organic N directly from solution without microbial mineralization [25,59,60], which was called “short circuit” in the N cycle of ecosystems by Neff et al. [61]. Agricultural activities were a possible source of DON at the present study site, and these may have produced bioavailable DON, such as amino acids and urea [20], which were readily available to plants or microbes. Secondly, from the perspective of the complete hydrological cycle, TFa should be partitioned into two pathways: TFb and SF of bamboo. It seems that the contribution of dissolved N in SF of the understory bamboo should not be neglected because of the high stem density of the dwarf bamboo at the study site. This was not the same as the distribution of tree stems, which would have provided a negligible contribution of dissolved N in SF in the complete hydrological cycle [62]. Completely opposite responses of the overstory tree canopy and understory dwarf bamboo canopy to DON deposition were found in the study site. Studies on controlling factors for DON exchange at the leaf level were rarely reported. However, the dwarf bamboo canopy seemed to be inclined to consume DON, given the abundant DON supply in the water flows at the study site, and assuming that DON uptake by the understory canopy may be a supplementary pathway when facing fierce competition with overstory trees in the root system.

5. Conclusions

Our results show that N deposition amounted to 11.1 ± 1.71 kg N ha−1 year−1, with a high contribution of DON (78%) and low contribution of DIN (22%). The snowfall contribution was 37% of the total N input to the study site. The large DON contribution indicates that DON estimation is essential for the critical load determination of N deposition, especially in remote areas. The substantial snow contribution shows the importance of N deposition estimation during the snow season. This finding may have deep implications for the estimation of the melted-snow flux at the soil surface in cool-temperate forests.
The canopy layers of the trees and dwarf bamboo played a vital role in N fluxes derived from BP in the internal N cycle of the Takayama forest site. The tree canopy leached DON but consumed DIN, which was in accordance with other studies. DIN was released from the surface of the dwarf bamboo canopy, but DON was consumed by the dwarf bamboo canopy, indicating that the dwarf bamboo canopy has an impact on dissolved N fluxes in the internal N cycle. Field observations and estimations of N fluxes passing through understory plants should be conducted to more accurately assess the N deposition input to soil layers.

Author Contributions

R.C., T.O. and S.Y. conceived and designed the field experiment; S.C. and R.C. performed field survey; and R.C. and T.O. analyzed the data and wrote the paper.

Funding

This research received no external funding.

Acknowledgments

We are grateful to members from the Takayama Forest Research Station for their kind cooperation in the field survey, which belonged to the River Basin Research Center, Gifu university. We would like to thank Enago (www.enago.jp) for the English language review.

Conflicts of Interest

The authors declare no conflict of interest.

References

  1. Gruber, N.; Galloway, J.N. An Earth-system perspective of the global nitrogen cycle. Nature 2008, 451, 293–296. [Google Scholar] [CrossRef] [PubMed]
  2. Phoenix, G.K.; Hicks, W.K.; Cinderby, S.; Kuylenstierna, J.C.I.; Stock, W.D.; Dentener, F.J.; Giller, K.E.; Austin, A.T.; Lefroy, R.D.B.; Gimeno, B.S.; et al. Atmospheric nitrogen deposition in world biodiversity hotspots: The need for a greater global perspective in assessing N deposition impacts. Glob. Chang. Biol. 2006, 12, 470–476. [Google Scholar] [CrossRef]
  3. Aber, J.; McDowell, W.; Nadelhoffer, K.; Magill, A.; Berntson, G.; Kamakea, M.; McNulty, S.; Currie, W.; Rustad, L.; Fernandez, I. Nitrogen saturation in temperate forest ecosystems. Bioscience 1998, 48, 921–934. [Google Scholar] [CrossRef]
  4. Magnani, F.; Mencuccini, M.; Borghetti, M.; Berbigier, P.; Berninger, F.; Delzon, S.; Grelle, A.; Hari, P.; Jarvis, P.G.; Kolari, P.; et al. The human footprint in the carbon cycle of temperate and boreal forests. Nature 2007, 447, 848–850. [Google Scholar] [CrossRef] [PubMed]
  5. Holland, E.A.; Braswell, B.H.; Sulzman, J.; Lamarque, J.F. Nitrogen deposition onto the United States and Western Europe: Synthesis of observations and models. Ecol. Appl. 2005, 15, 38–57. [Google Scholar] [CrossRef]
  6. Kopaček, J.; Procházková, L.; Hejzlar, J.; Blažka, P. Trends and seasonal patterns of bulk deposition of nutrients in the Czech Republic. Atmos. Environ. 1997, 31, 797–808. [Google Scholar] [CrossRef]
  7. Rodà, F.; Avila, A.; Rodrigo, A. Nitrogen deposition in Mediterranean forests. Environ. Pollut. 2002, 118, 205–213. [Google Scholar] [CrossRef]
  8. Du, E.; Jiang, Y.; Fang, J.; de Vries, W. Inorganic nitrogen deposition in China’s forests: Status and characteristics. Atmos. Environ. 2014, 98, 474–482. [Google Scholar] [CrossRef]
  9. Jia, Y.; Yu, G.; He, N.; Zhan, X.; Fang, H.; Sheng, W.; Zuo, Y.; Zhang, D.; Wang, Q. Spatial and decadal variations in inorganic nitrogen wet deposition in China induced by human activity. Sci. Rep. 2014, 4, 1–7. [Google Scholar] [CrossRef]
  10. Waldner, P.; Marchetto, A.; Thimonier, A.; Schmitt, M.; Rogora, M.; Granke, O.; Mues, V.; Hansen, K.; Pihl Karlsson, G.; Žlindra, D.; et al. Detection of temporal trends in atmospheric deposition of inorganic nitrogen and sulphate to forests in Europe. Atmos. Environ. 2014, 95, 363–374. [Google Scholar] [CrossRef] [Green Version]
  11. Zhu, X.; Zhang, W.; Chen, H.; Mo, J. Impacts of nitrogen deposition on soil nitrogen cycle in forest ecosystems: A review. Acta Ecol. Sin. 2015, 35, 35–43. [Google Scholar] [CrossRef]
  12. Thomas, R.Q.; Canham, C.D.; Weathers, K.C.; Goodale, C.L. Increased tree carbon storage in response to nitrogen deposition in the US. Nat. Geosci. 2010, 3, 13–17. [Google Scholar] [CrossRef]
  13. Bobbink, R.; Ashmore, M.R.; Braun, S.; Flückiger, W.; Van den Wyngaert, I.J. Empirical nitrogen critical loads for natural and semi-natural ecosystems: 2002 update. In Book Empirical Critical Loads for Nitrogen; Swiss Agency for Environment, Forest and Landscape: Berne, Switzerland, 2003; pp. 33–34. [Google Scholar]
  14. Liu, X.; Duan, L.; Mo, J.; Du, E.; Shen, J.; Lu, X.; Zhang, Y.; Zhou, X.; He, C.; Zhang, F. Nitrogen deposition and its ecological impact in China: An overview. Environ. Pollut. 2011, 159, 2251–2264. [Google Scholar] [CrossRef] [PubMed]
  15. Kristensen, H.L.; Gundersen, P.; Callesen, I.; Reinds, G.J. Throughfall nitrogen deposition has different impacts on soil solution nitrate concentration in European coniferous and deciduous forests. Ecosystems 2004, 7, 180–192. [Google Scholar] [CrossRef]
  16. Lu, X.; Mao, Q.; Gilliam, F.S.; Luo, Y.; Mo, J. Nitrogen deposition contributes to soil acidification in tropical ecosystems. Glob. Chang. Biol. 2014, 20, 3790–3801. [Google Scholar] [CrossRef] [PubMed]
  17. Tian, D.; Niu, S. A global analysis of soil acidification caused by nitrogen addition. Environ. Res. Lett. 2015, 10, 24019. [Google Scholar] [CrossRef]
  18. Dise, N.B.; Wright, R.F. Nitrogen leaching from European forests in relation to nitrogen deposition. For. Ecol. Manag. 1995, 71, 153–169. [Google Scholar] [CrossRef]
  19. Wright, R.F.; Alewell, C.; Cullen, J.M.; Evans, C.D.; Marchetto, A.; Moldan, F.; Prechtel, A.; Rogora, M. Trends in nitrogen deposition and leaching in acid-sensitive streams in Europe. Hydrol. Earth Syst. Sci. 2001, 5, 299–310. [Google Scholar] [CrossRef] [Green Version]
  20. Cornell, S.E. Atmospheric nitrogen deposition: Revisiting the question of the importance of the organic component. Environ. Pollut. 2011, 159, 2214–2222. [Google Scholar] [CrossRef]
  21. Pacheco, M.; Donoso, L.; Sanhueza, E. Soluble organic nitrogen in Venezuelan rains. Tellus Ser. B Chem. Phys. Meteorol. 2004, 56, 393–395. [Google Scholar] [CrossRef]
  22. Zhang, Y.; Song, L.; Liu, X.J.; Li, W.Q.; Lü, S.H.; Zheng, L.X.; Bai, Z.C.; Cai, G.Y.; Zhang, F.S. Atmospheric organic nitrogen deposition in China. Atmos. Environ. 2012, 46, 195–204. [Google Scholar] [CrossRef]
  23. Lovett, G.M.; Lindberg, S.E. Atmospheric deposition and canopy interactions of nitrogen in forests. Can. J. For. Res. 1993, 23, 1603–1616. [Google Scholar] [CrossRef]
  24. Pelster, D.E.; Kolka, R.K.; Prepas, E.E. Overstory vegetation influence nitrogen and dissolved organic carbon flux from the atmosphere to the forest floor: Boreal Plain, Canada. For. Ecol. Manag. 2009, 259, 210–219. [Google Scholar] [CrossRef]
  25. Izquieta-Rojano, S.; García-Gomez, H.; Aguillaume, L.; Santamaría, J.M.; Tang, Y.S.; Santamaría, C.; Valiño, F.; Lasheras, E.; Alonso, R.; Àvila, A.; et al. Throughfall and bulk deposition of dissolved organic nitrogen to holm oak forests in the Iberian Peninsula: Flux estimation and identification of potential sources. Environ. Pollut. 2016, 210, 104–112. [Google Scholar] [CrossRef] [PubMed]
  26. Verstraeten, A.; Verschelde, P.; De Vos, B.; Neirynck, J.; Cools, N.; Roskams, P.; Hens, M.; Louette, G.; Sleutel, S.; De Neve, S. Increasing trends of dissolved organic nitrogen (DON) in temperate forests under recovery from acidification in Flanders, Belgium. Sci. Total Environ. 2016, 553, 107–119. [Google Scholar] [CrossRef] [PubMed]
  27. Bellot, J.; Escarre, A. Stemflow and throughfall determination in a resprouted Mediterranean holm-oak forest. In Annales des Sciences Forestières; EDP Sciences: Les Ulis, France, 1998; Volume 55, pp. 847–865. [Google Scholar] [CrossRef]
  28. Aguillaume, L.; Izquieta-Rojano, S.; García-Gómez, H.; Elustondo, D.; Santamaría, J.M.; Alonso, R.; Avila, A. Dry deposition and canopy uptake in Mediterranean holm-oak forests estimated with a canopy budget model: A focus on N estimations. Atmos. Environ. 2017, 152, 191–200. [Google Scholar] [CrossRef] [Green Version]
  29. Chen, X.Y.; Mulder, J. Atmospheric deposition of nitrogen at five subtropical forested sites in South China. Sci. Total Environ. 2007, 378, 317–330. [Google Scholar] [CrossRef]
  30. Saigusa, N.; Yamamoto, S.; Murayama, S.; Kondo, H.; Nishimura, N. Gross primary production and net ecosystem exchange of a cool-temperate deciduous forest estimated by the eddy covariance method. Agric. For. Meteorol. 2002, 112, 203–215. [Google Scholar] [CrossRef]
  31. Ohtsuka, T.; Mo, W.; Satomura, T.; Inatomi, M.; Koizumi, H. Biometric based carbon flux measurements and net ecosystem production (NEP) in a temperate deciduous broad-leaved forest beneath a flux tower. Ecosystems 2007, 10, 324–334. [Google Scholar] [CrossRef]
  32. Ohtsuka, T.; Saigusa, N.; Koizumi, H. On linking multiyear biometric measurements of tree growth with eddy covariance-based net ecosystem production. Glob. Chang. Biol. 2009, 15, 1015–1024. [Google Scholar] [CrossRef]
  33. Ohtsuka, T.; Akiyama, T.; Hashimoto, Y.; Inatomi, M.; Sakai, T.; Jia, S.; Mo, W.; Tsuda, S.; Koizumi, H. Biometric based estimates of net primary production (NPP) in a cool-temperate deciduous forest stand beneath a flux tower. Agric. For. Meteorol. 2005, 134, 27–38. [Google Scholar] [CrossRef]
  34. Nishimura, N.; Matsui, Y.; Ueyama, T.; Mo, W.; Saijo, Y.; Tsuda, S.; Yamamoto, S.; Koizumi, H. Evaluation of carbon budgets of a forest floor Sasa senanensis community in a cool-temperate forest ecosystem, central Japan. Jpn. J. Ecol. 2004, 54, 143–158. [Google Scholar] [CrossRef]
  35. Chen, S.; Yoshitake, S.; Iimura, Y.; Asai, C.; Ohtsuka, T. Dissolved organic carbon (DOC) input to the soil: DOC fluxes and their partitions during the growing season in a cool-temperate broad-leaved deciduous forest, central Japan. Ecol. Res. 2017, 32, 713–724. [Google Scholar] [CrossRef]
  36. Tu, L.H.; Hu, T.X.; Zhang, J.; Huang, L.H.; Xiao, Y.L.; Chen, G.; Hu, H.L.; Liu, L.; Zheng, J.K.; Xu, Z.F.; et al. Nitrogen distribution and cycling through water flows in a subtropical bamboo forest under high level of atmospheric deposition. PLoS ONE 2013, 8, 2–12. [Google Scholar] [CrossRef]
  37. Lovett, G.M.; Lindberg, S.E. Dry deposition and canopy exchange in a mixed oak forest as determined by analysis of throughfall. J. Appl. Ecol. 1984, 21, 1013–1027. [Google Scholar] [CrossRef]
  38. Cape, J.N.; Tang, Y.S.; González-Beníez, J.M.; Mitošinková, M.; Makkonen, U.; Jocher, M.; Stolk, A. Organic nitrogen in precipitation across Europe. Biogeosciences 2012, 9, 4401–4409. [Google Scholar] [CrossRef] [Green Version]
  39. Mitchell, M.J.; Iwatsubo, G.; Ohrui, K.; Nakagawa, Y. Nitrogen saturation in Japanese forests: An evaluation. For. Ecol. Manag. 1997, 97, 39–51. [Google Scholar] [CrossRef]
  40. Asman, W.A.H.; Sutton, M.A.; Schjørring, J.K. Ammonia: Emission, atmospheric transport and deposition. New Phytol. 1998, 139, 27–48. [Google Scholar] [CrossRef]
  41. Krupa, S.V. Effects of atmospheric ammonia (NH3) on terrestrial vegetation: A review. Environ. Pollut. 2003, 124, 179–221. [Google Scholar] [CrossRef]
  42. Ferm, M. Atmospheric ammonia and ammonium transport in Europe and critical loads: A review. Nutr. Cycl. Agroecosyst. 1998, 51, 5–17. [Google Scholar] [CrossRef]
  43. Song, L.; Kuang, F.; Skiba, U.; Zhu, B.; Liu, X.; Levy, P.; Dore, A.; Fowler, D. Bulk deposition of organic and inorganic nitrogen in southwest China from 2008 to 2013. Environ. Pollut. 2017, 227, 157–166. [Google Scholar] [CrossRef] [PubMed]
  44. Hiltbrunner, E.; Schwikowski, M.; Körner, C. Inorganic nitrogen storage in alpine snow pack in the Central Alps (Switzerland). Atmos. Environ. 2005, 39, 2249–2259. [Google Scholar] [CrossRef]
  45. Bowman, W.D. Inputs and storage of nitrogen in winter snowpack in an alpine ecosystem. Arct. Alp. Res. 1992, 24, 211–215. [Google Scholar] [CrossRef]
  46. Fibiger, D.L.; Dibb, J.E.; Chen, D.; Thomas, J.L.; Burkhart, J.F.; Huey, L.G.; Hastings, M.G. Analysis of nitrate in the snow and atmosphere at Summit, Greenland: Chemistry and transport. J. Geophys. Res. Atmos. 2016, 5010–5030. [Google Scholar] [CrossRef]
  47. Fahey, T.J.; Yavitt, J.B.; Pearson, J.A.; Knight, D.H. The nitrogen cycle in lodgepole pine forests, southeastern Wyoming. Biogeochemistry 1985, 1, 257–275. [Google Scholar] [CrossRef]
  48. Zhang, Y.; Zheng, L.; Liu, X.; Jickells, T.; Neil Cape, J.; Goulding, K.; Fangmeier, A.; Zhang, F. Evidence for organic N deposition and its anthropogenic sources in China. Atmos. Environ. 2008, 42, 1035–1041. [Google Scholar] [CrossRef] [Green Version]
  49. Ban, S.; Matsuda, K.; Sato, K.; Ohizumi, T. Long-term assessment of nitrogen deposition at remote EANET sites in Japan. Atmos. Environ. 2016, 146, 70–78. [Google Scholar] [CrossRef] [Green Version]
  50. Li, J.; Fang, Y.; Yoh, M.; Wang, X.; Wu, Z.; Kuang, Y.; Wen, D. Organic nitrogen deposition in precipitation in metropolitan Guangzhou city of southern China. Atmos. Res. 2012, 113, 57–67. [Google Scholar] [CrossRef]
  51. Ham, Y.S.; Tamiya, S.; Choi, I.S. Contribution of dissolved organic nitrogen deposition to nitrogen saturation in a forested mountainous watershed in Tsukui, Central Japan. Water. Air. Soil Pollut. 2007, 178, 113–120. [Google Scholar] [CrossRef]
  52. Balestrini, R.; Tagliaferri, A. Atmospheric deposition and canopy exchange processes in alpine forest ecosystems (northern Italy). Atmos. Environ. 2001, 35, 6421–6433. [Google Scholar] [CrossRef]
  53. Fenn, M.E.; Ross, C.S.; Schilling, S.L.; Baccus, W.D.; Larrabee, M.A.; Lofgren, R.A. Atmospheric deposition of nitrogen and sulfur and preferential canopy consumption of nitrate in forests of the Pacific Northwest, USA. For. Ecol. Manag. 2013, 302, 240–253. [Google Scholar] [CrossRef]
  54. Guerrieri, R.; Vanguelova, E.I.; Michalski, G.; Heaton, T.H.E.; Mencuccini, M. Isotopic evidence for the occurrence of biological nitrification and nitrogen deposition processing in forest canopies. Glob. Chang. Biol. 2015, 21, 4613–4626. [Google Scholar] [CrossRef] [PubMed] [Green Version]
  55. Gaige, E.; Dail, D.B.; Hollinger, D.Y.; Davidson, E.A.; Fernandez, I.J.; Sievering, H.; White, A.; Halteman, W. Changes in canopy processes following whole-forest canopy nitrogen fertilization of a mature spruce-hemlock forest. Ecosystems 2007, 10, 1133–1147. [Google Scholar] [CrossRef]
  56. Mellec, A.; Meesenburg, H.; Michalzik, B. The importance of canopy-derived dissolved and particulate organic matter (DOM and POM)–comparing throughfall solution from broadleaved and coniferous forests. Ann. For. Sci. 2010, 67, 411. [Google Scholar] [CrossRef]
  57. Adriaenssens, S.; Staelens, J.; Wuyts, K.; De Schrijver, A.; Van Wittenberghe, S.; Wuytack, T.; Kardel, F.; Verheyen, K.; Samson, R.; Boeckx, P. Foliar nitrogen uptake from wet deposition and the relation with leaf wettability and water storage capacity. Water. Air. Soil Pollut. 2011, 219, 43–57. [Google Scholar] [CrossRef]
  58. Wuyts, K.; Adriaenssens, S.; Staelens, J.; Wuytack, T.; Van Wittenberghe, S.; Boeckx, P.; Samson, R.; Verheyen, K. Contributing factors in foliar uptake of dissolved inorganic nitrogen at leaf level. Sci. Total Environ. 2015, 505, 992–1002. [Google Scholar] [CrossRef] [PubMed]
  59. Vonk, J.A.; Middelburg, J.J.; Stapel, J.; Bouma, T.J. Dissolved organic nitrogen uptake by seagrasses. Limnol. Oceanogr. 2008, 53, 542–548. [Google Scholar] [CrossRef] [Green Version]
  60. Hinko-Najera Umana, N.; Wanek, W. Large canopy exchange fluxes of inorganic and organic nitrogen and preferential retention of nitrogen by epiphytes in a tropical lowland rainforest. Ecosystems 2010, 13, 367–381. [Google Scholar] [CrossRef]
  61. Neff, J.C.; Chapin, F.S., III; Vitousek, P.M. Breaks in the cycle: Dissolved organic nitrogen in terrestrial ecosystems. Front. Ecol. Environ. 2007, 1, 205. [Google Scholar] [CrossRef]
  62. Rodrigo, A.; Àvila, A.; Rodà, F. The chemistry of precipitation, throughfall and stemflow in two holm oak (Quercus ilex L.) forests under a contrasted pollution environment in NE Spain. Sci. Total Environ. 2003, 305, 195–205. [Google Scholar] [CrossRef]
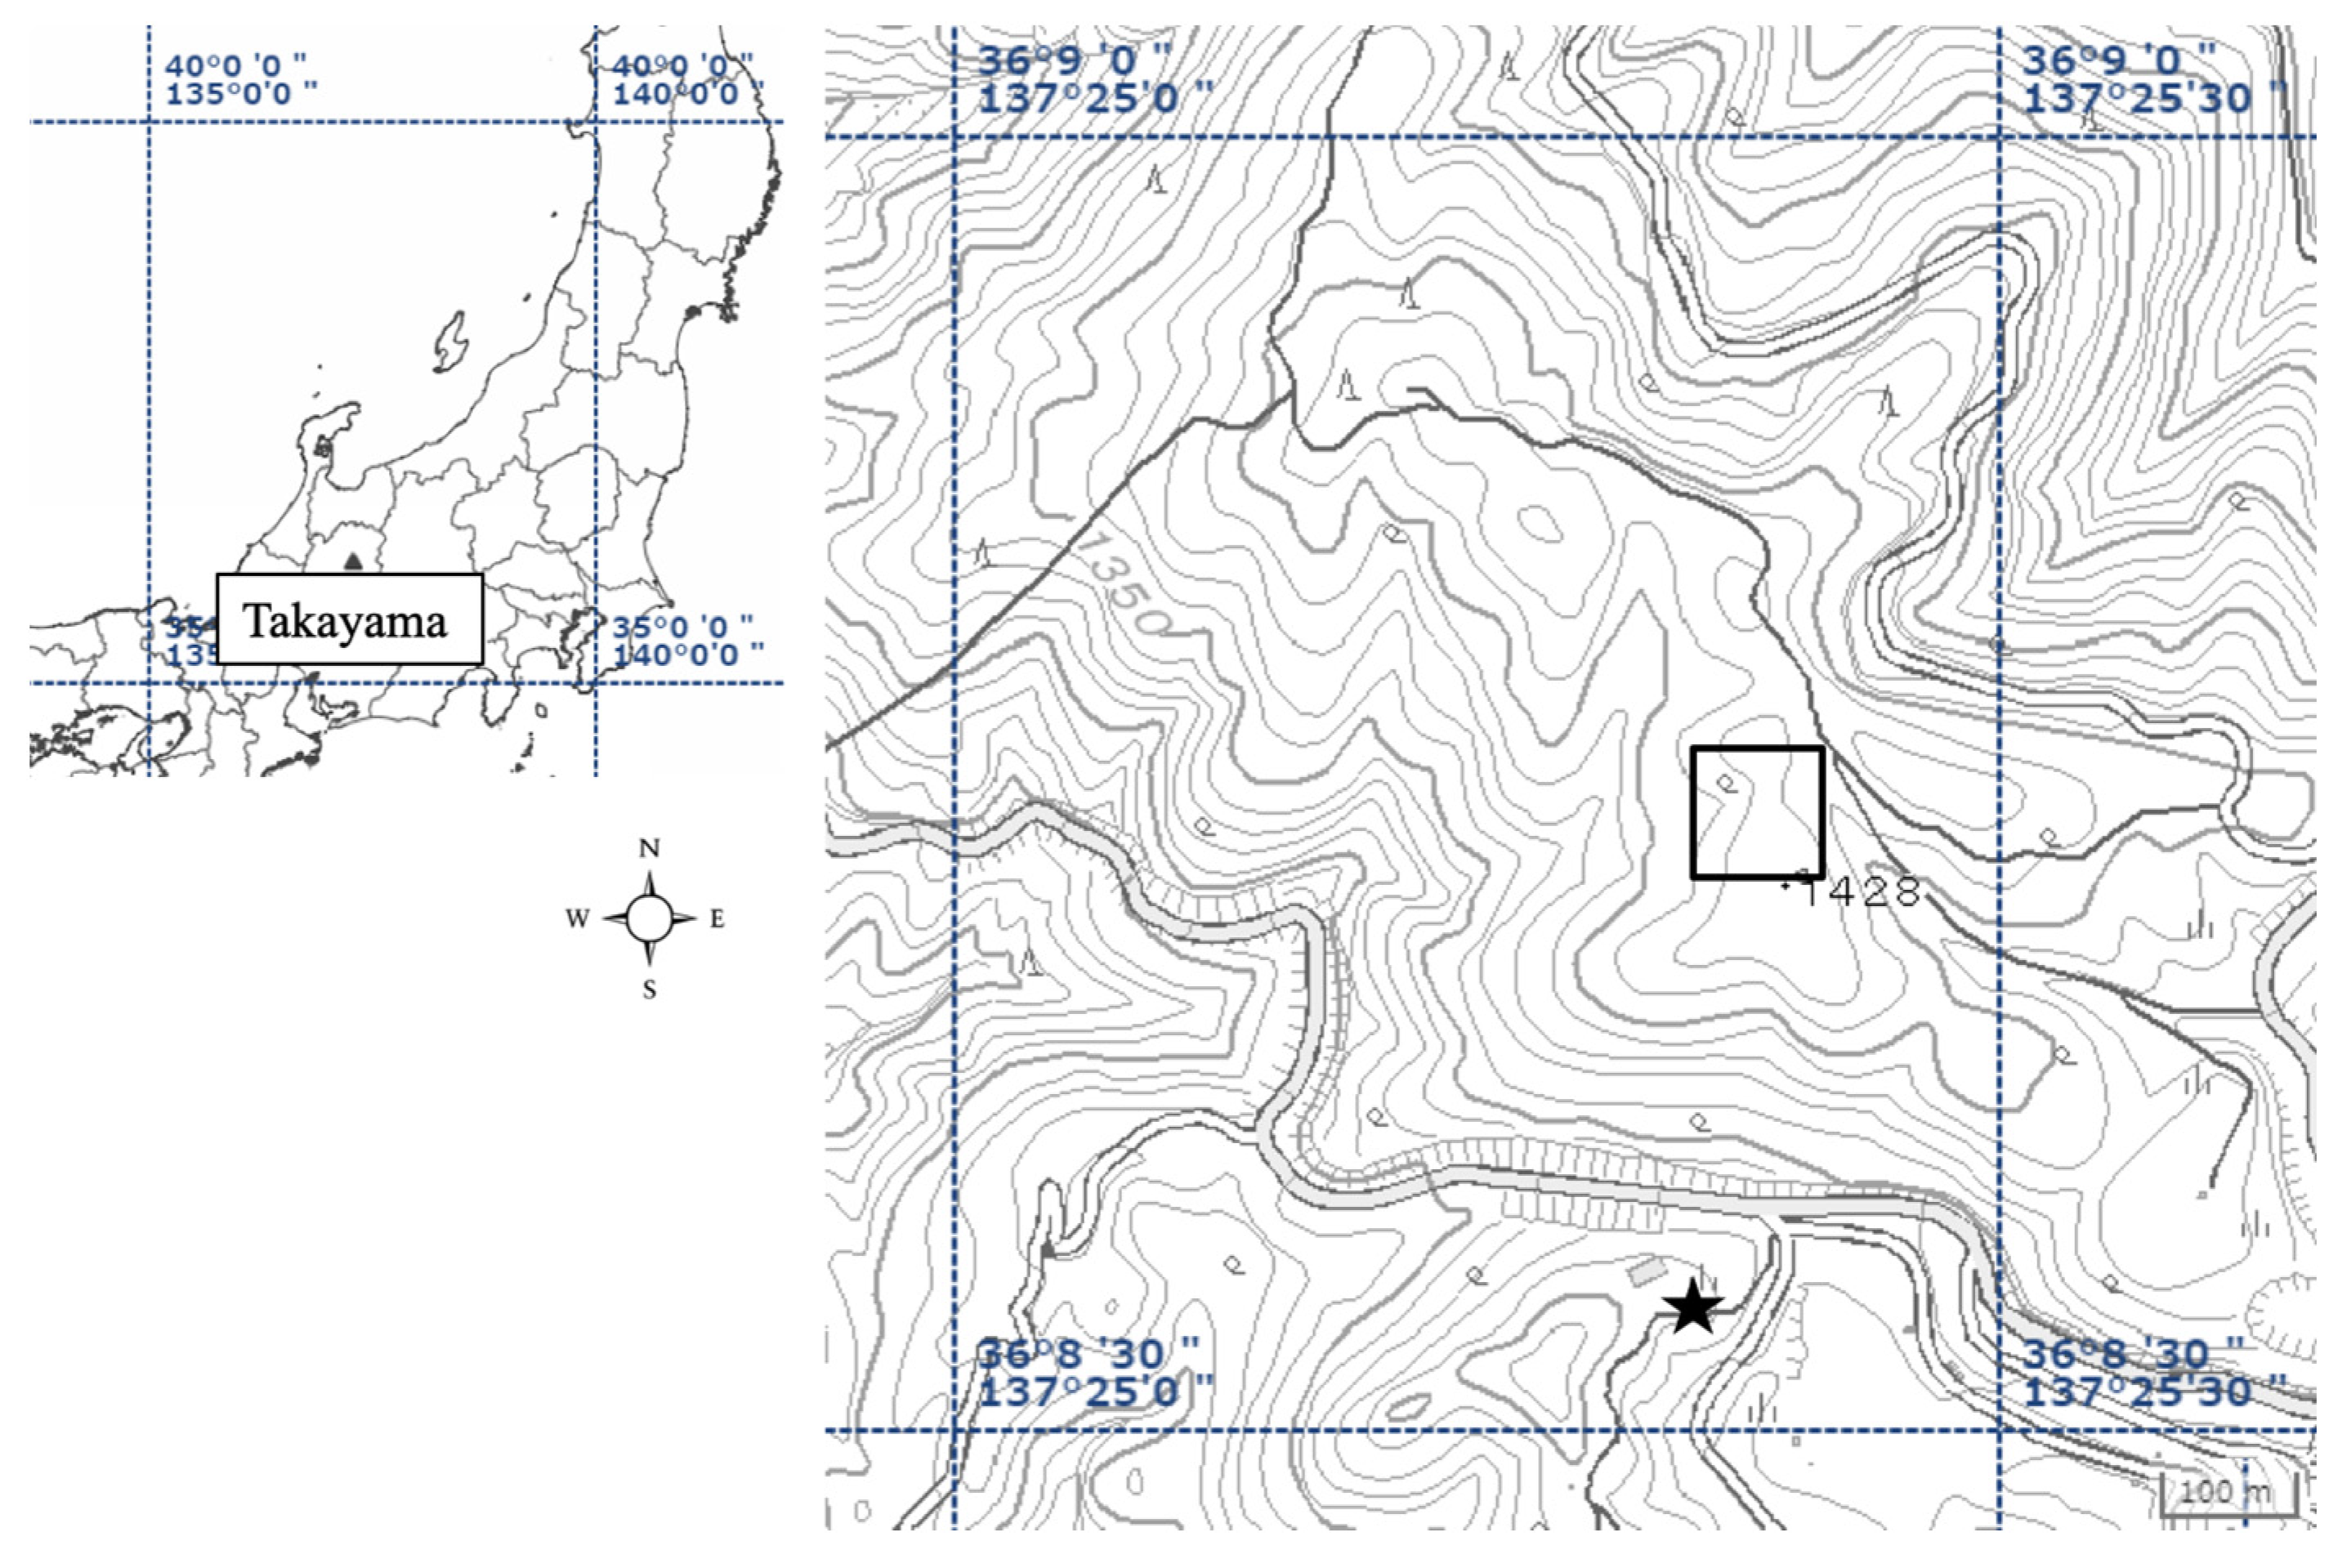
Figure 1. Location of the study site at Takayama Forest Research Station (★). A square indicates a permanent plot (100 m × 100 m). Map is from the Geospatial Information Authority of Japan.
Forests 10 00631 g001
Figure 2. Precipitation (mm) and air temperature (°C) at the study site from May 2015 to April 2018. Data were obtained from the meteorological station at the Takayama Field Station.
Forests 10 00631 g002
Figure 3. Average monthly concentration (mg L−1) (a) and average flux (kg N ha−1 episode−1) (b) of dissolved nitrogen in bulk precipitation from May 2015 to April 2018. Shaded areas show snow seasons. Sampling in the snow season was once per season. Error bars show standard error (n = 3). DON = Dissolved organic nitrogen; DIN = Dissolved inorganic nitrogen.
Forests 10 00631 g003
Figure 4. Average concentration (mg L−1) of dissolved nitrogen at each snowpack depth in January 2016 (a), January 2017 (b), and March 2018 (c). Error bars show standard error (n = 3). DON = Dissolved organic nitrogen. Dashed lines show snow depth. Different letters indicate significant differences of dissolved nitrogen concentration among snow depths at p < 0.05.
Forests 10 00631 g004
Figure 5. Average monthly concentration (mg L−1) (a) and average flux (kg N ha−1 episode−1) (b) of dissolved nitrogen in stemflow from May 2015 to November 2017. Shaded areas show the snow seasons. Error bars show the standard error (n = 9). DON = Dissolved organic nitrogen; DIN = Dissolved inorganic nitrogen.
Forests 10 00631 g005
Figure 6. Average monthly concentration (mg L−1) of dissolved organic nitrogen (DON) (a) and dissolved inorganic nitrogen (DIN) (b) in throughfall above and below the bamboo canopy from May 2015 to November 2017. Shaded areas show the snow seasons. Error bars show the standard error (n = 9).
Forests 10 00631 g006
Figure 7. Average flux (kg N ha−1 episode−1) of dissolved organic nitrogen (DON) (a) and dissolved inorganic nitrogen (DIN) (b) in throughfall above and below the bamboo canopy from May 2015 to November 2017. Shaded areas show the snow seasons. Error bars show the standard error (n = 9).
Forests 10 00631 g007
Table 1. Precipitation (mm), average nitrogen concentration (mg L−1), and average flux (kg N ha−1 period−1) in bulk precipitation during three years (May 2015–April 2018). Values in parentheses are standard deviation (n = 3). DON = Dissolved organic nitrogen, DIN = Dissolved inorganic nitrogen, TDN = Total dissolved nitrogen.
RainfallSnowfallTotalContribution of Snowfall
Precipitation (mm)1344 (25.6)776 (107)2120 (117)0.37 (0.03)
Concentration (mg L−1)
DON0.41 (0.03)0.32 (0.16)
DIN0.13 (0.04)0.23 (0.09)
TDN0.55 (0.04)0.53 (0.19)
Flux (kg N ha−1 period−1)
DON5.29 (0.39)2.61 (1.60)7.90 (1.22)0.32 (0.15)
DIN1.52 (0.09)1.67 (0.85)3.19 (0.80)0.50 (0.13)
TDN6.81 (0.32)4.28 (1.97)11.1 (1.71)0.37 (0.13)
Contribution of DON0.78 (0.02)0.59 (0.13)0.78 (0.02)
Table 2. Spearman correlations between rainfall (mm) and average monthly concentrations of dissolved nitrogen (mg L−1) or average fluxes of dissolved nitrogen (kg N ha−1 episode−1) in bulk precipitation (n = 21). DIN = Dissolved inorganic nitrogen; DON = Dissolved organic nitrogen.
NH4–NNO3 + NO2–NDINDON
Concentrations−0.15−0.32−0.24−0.04
Fluxes 0.08−0.060.020.67 *
* indicates significant at p < 0.05.
Table 3. Water flux (mm), dissolved nitrogen fluxes (kg N ha−1 year−1) in bulk precipitation (BP), stemflow (SF), throughfall above the bamboo canopy (TFa), throughfall below the bamboo canopy (TFb), net TFa, and net TFb during the three study years. Dissolved nitrogen fluxes in TFa and TFb during the snow seasons were assumed the same as those in BP during the snow seasons; SF was assumed to be equal to zero during the snow seasons. Values in parentheses are standard deviation (n = 3). DIN = Dissolved inorganic nitrogen; DON = Dissolved organic nitrogen.
Water Flux (mm)NH4–N (kg N ha−1 Year−1)NO3 + NO2–N (kg N ha−1 Year−1)DIN (kg N ha−1 Year−1)DON (kg N ha−1 Year−1)
BP2120 (117)1.66 (0.68)1.53 (0.12)3.19 (0.80) 7.90 (1.22)
SF21.4 (3.53)0.02 (0.01)0.00 (0.00)0.02 (0.01) 0.14 (0.03)
TFa2048 (114)2.05 (0.91)0.80 (0.30)2.82 (1.21) 9.87 (1.67)
TFb1764 (104)2.22 (1.12)0.98 (0.39)3.17 (1.52) 8.85 (1.86)
Net TFa−50.0 (11.7)0.41 (0.24)−0.73 (0.19)−0.35 (0.41) 2.11 (0.42)
Net TFb−283 (57.0)0.17 (0.28)0.18 (0.18)0.35 (0.44) −1.02 (0.55)
Table 4. Spearman correlations between rainfall amount (mm) and fluxes of dissolved nitrogen in net throughfall above the bamboo canopy (Net TFa) (kg N ha−1 episode−1), or between water fluxes in net TFa (mm) and fluxes of dissolved nitrogen in net throughfall below the bamboo canopy (Net TFb) (kg N ha−1 episode−1) (n = 21). DIN = Dissolved inorganic nitrogen; DON = Dissolved organic nitrogen.
NH4–NNO3 + NO2–NDINDON
Net TFa0.11−0.010.360.46 *
Net TFb0.040.080.20−0.63 *
* indicates significant relationships at p < 0.05.