Article

The Northern White-Cedar Recruitment Bottleneck: Understanding the Effects of Substrate, Competition, and Deer Browsing

1
Department of Forest Resources, University of Minnesota, St. Paul, MN 55108, USA
2
U.S. Forest Service, Northern Research Station, Rhinelander, WI 54501, USA
3
U.S. Forest Service, Northern Research Station, Bradley, ME 04411, USA
4
Wisconsin Department of Natural Resources, Rhinelander, WI 54501, USA
*
Author to whom correspondence should be addressed.
Forests 2019, 10(6), 501; https://doi.org/10.3390/f10060501
Submission received: 25 April 2019 / Revised: 28 May 2019 / Accepted: 7 June 2019 / Published: 12 June 2019
(This article belongs to the Section Forest Ecology and Management)

Abstract

:
Research Highlights: Regenerating northern white-cedar (Thuja occidentalis L.) is challenging throughout much of its range. This study attempts to relate differences in natural regeneration to stand- and seedbed-level factors. Background and Objectives: Lack of regeneration of northern white-cedar is often attributed to overbrowsing by white-tailed deer (Odocoileus virginianus Zimmerman) because white-cedar is a preferred winter browse species. However, there are many other factors that may contribute to regeneration failure for white-cedar including its specific seedbed requirements and competition from other, often faster-growing trees and shrubs. Materials and Methods: We surveyed five mature white-cedar stands in Wisconsin, USA that have had little to no management in the past 50+ years to find stem densities of natural white-cedar regeneration in three height classes. We also collected data at each stand on potential predictor variables including overstory attributes, competitive environment, seedbed, and browsing by deer. We used model selection to create separate models to predict stem density of each white-cedar regeneration height class. Results: None of the measures of deer browsing used in this study were found to be associated with white-cedar regeneration. Soil pH, competition from other seedlings and saplings, and stem density of white-cedar in the overstory were found to be potentially associated with white-cedar regeneration. Conclusions: While browsing by deer is likely a factor affecting white-cedar regeneration in many areas, this study highlights the challenge of quantifying deer browse effects, as well as showing that other factors likely contribute to the difficulty of regenerating white-cedar.

1. Introduction

Northern white-cedar (Thuja occidentalis L.) is widely recognized for ecological, cultural, and commodity-production values. This species contributes to biodiversity through its association with rare plants such as the showy lady slipper (Cypripedium reginae Walter) [1], is a preferred winter browse for white-tailed deer (Odocoileus virginianus Zimmerman), and has traditionally been used by Native American peoples for ceremonies, tools, and medicinal healing. In addition to these non-commodity values, white-cedar’s unique wood properties make it highly resistant to decay after harvesting and thus desirable for production of house siding, log homes, fence posts, and specialty products such as outdoor furniture [2]. However, our understanding of white-cedar ecology and management across its range is incomplete, especially with regard to the conditions that favor successful regeneration establishment and growth.
A long-lived, shade-tolerant tree, white-cedar has a native range that spans across the northeast portion of the United States into Canada and as far west as the Great Lakes [2]. White-cedar is an ecologically versatile species that can grow in both early and secondary successional forests, and in well-drained upland or poorly-drained wetland settings. In the Great Lakes region, where this study is focused, most white-cedar harvested for timber products grows in alkaline wetlands as nearly-pure stands [2,3].
Establishment and growth of white-cedar regeneration are problematic in many parts of its range [4,5,6]. As a result, there is concern that harvested white-cedar will not be maintained in the future forest. Regeneration failures have been linked to several factors and combinations of factors including germination substrate, overstory, and stand attributes, understory competition, browsing by whitetail deer, and hydrologic conditions in wetlands [5,7,8,9].
Substrate requirements for germination by white-cedar are thought to be very specific. This light-seeded species germinates best in moist environments, which on drier sites may include decaying wood or exposed mineral soil [9,10,11]. On wetland sites, seed rot and seedling mortality from seasonal flooding can occur and therefore white-cedar regeneration is positively correlated with the number of hummocks or proportion of area with hummocks [8]. While substantial work on white-cedar substrates in the eastern portions of the range has been conducted [11,12,13], the importance of substrate traits may not be consistent across the entire range of the species. Therefore, further understanding of substrate traits that are important for regeneration success in the Great Lakes region is needed.
White-cedar regeneration may also be affected by other stand-level attributes including overstory stocking, composition, and competition. In the overstory, white-cedar is the seed source for regeneration, but higher light transmittance in thinned canopies can lead to increased growth rates for white-cedar [7]. As a slow-growing species, white-cedar is vulnerable to competition from other tree species and shrubs, especially in gaps and larger openings [8,13,14].
In many areas, white-cedar seedlings rarely make it to the sapling height class [7]. White-tailed deer browsing is thought to be a main impediment to white-cedar regeneration. Since the mid-1990s, white-tailed deer populations in northern Wisconsin have been 2–3 times higher than they were in the 1950s and 1960s and as much as 12 times higher than pre-settlement populations [15,16]. This long period of high deer populations has likely significantly affected sapling recruitment of white-cedar and other palatable species [17]. Browsing is considered a significant bottleneck to white-cedar regeneration across its range [5,18].
Assessing the level of deer browsing pressure on tree regeneration can be challenging, especially for foresters and land managers with limited time and resources. Deer population estimates based on deer harvest data collected on a county level are too coarse to determine browsing pressure within a particular stand. Alternatively, stem browsing indices can be collected for one or multiple tree species, such as the sugar maple (Acer saccharum Marshall) browse index [19], but these data are only applicable when there are enough stems and/or species to browse. Many dense stands lack understory regeneration and especially palatable species due to their stage of stand development rather than browsing pressure. At the stand level, regeneration tallies by species and height class may show that some species are not reaching heights tall enough to escape browse pressure [e.g., 8]. In this case, deer exclosures often show dramatic differences from unprotected areas but represent an unnaturally altered condition and are often impractical on a large scale [20]. The use of indicator plants such as Trillium and Maianthemum spp. has been shown as an effective measure of deer browse pressure in some locations [21,22], but this practice may be time-consuming for a forester and can only be used during a limited part of the year in stands where these species are present. Additionally, Kirschbaum and Anacker found that indicator species characteristics were not correlated with signs of browse in a study in McKean County, Pennsylvania, USA, possibly because of the effects of additional environmental factors or legacy effects of historically high deer populations [23].
The objectives of this study were to (1) quantify natural regeneration in mature white-cedar stands and (2) assess relationships between density and height of white-cedar regeneration and explanatory factors such as deer population density, browsing intensity, available regeneration substrate, and competitive environment. We hypothesized that the amount of bare soil and deadwood substrate would be positively related to white-cedar regeneration, while local deer population size and browsing intensity would be negatively related. In addition, we anticipated that stand-level browsing intensity would be a stronger predictor of white-cedar regeneration than other metrics such as county deer population estimates.

2. Materials and Methods
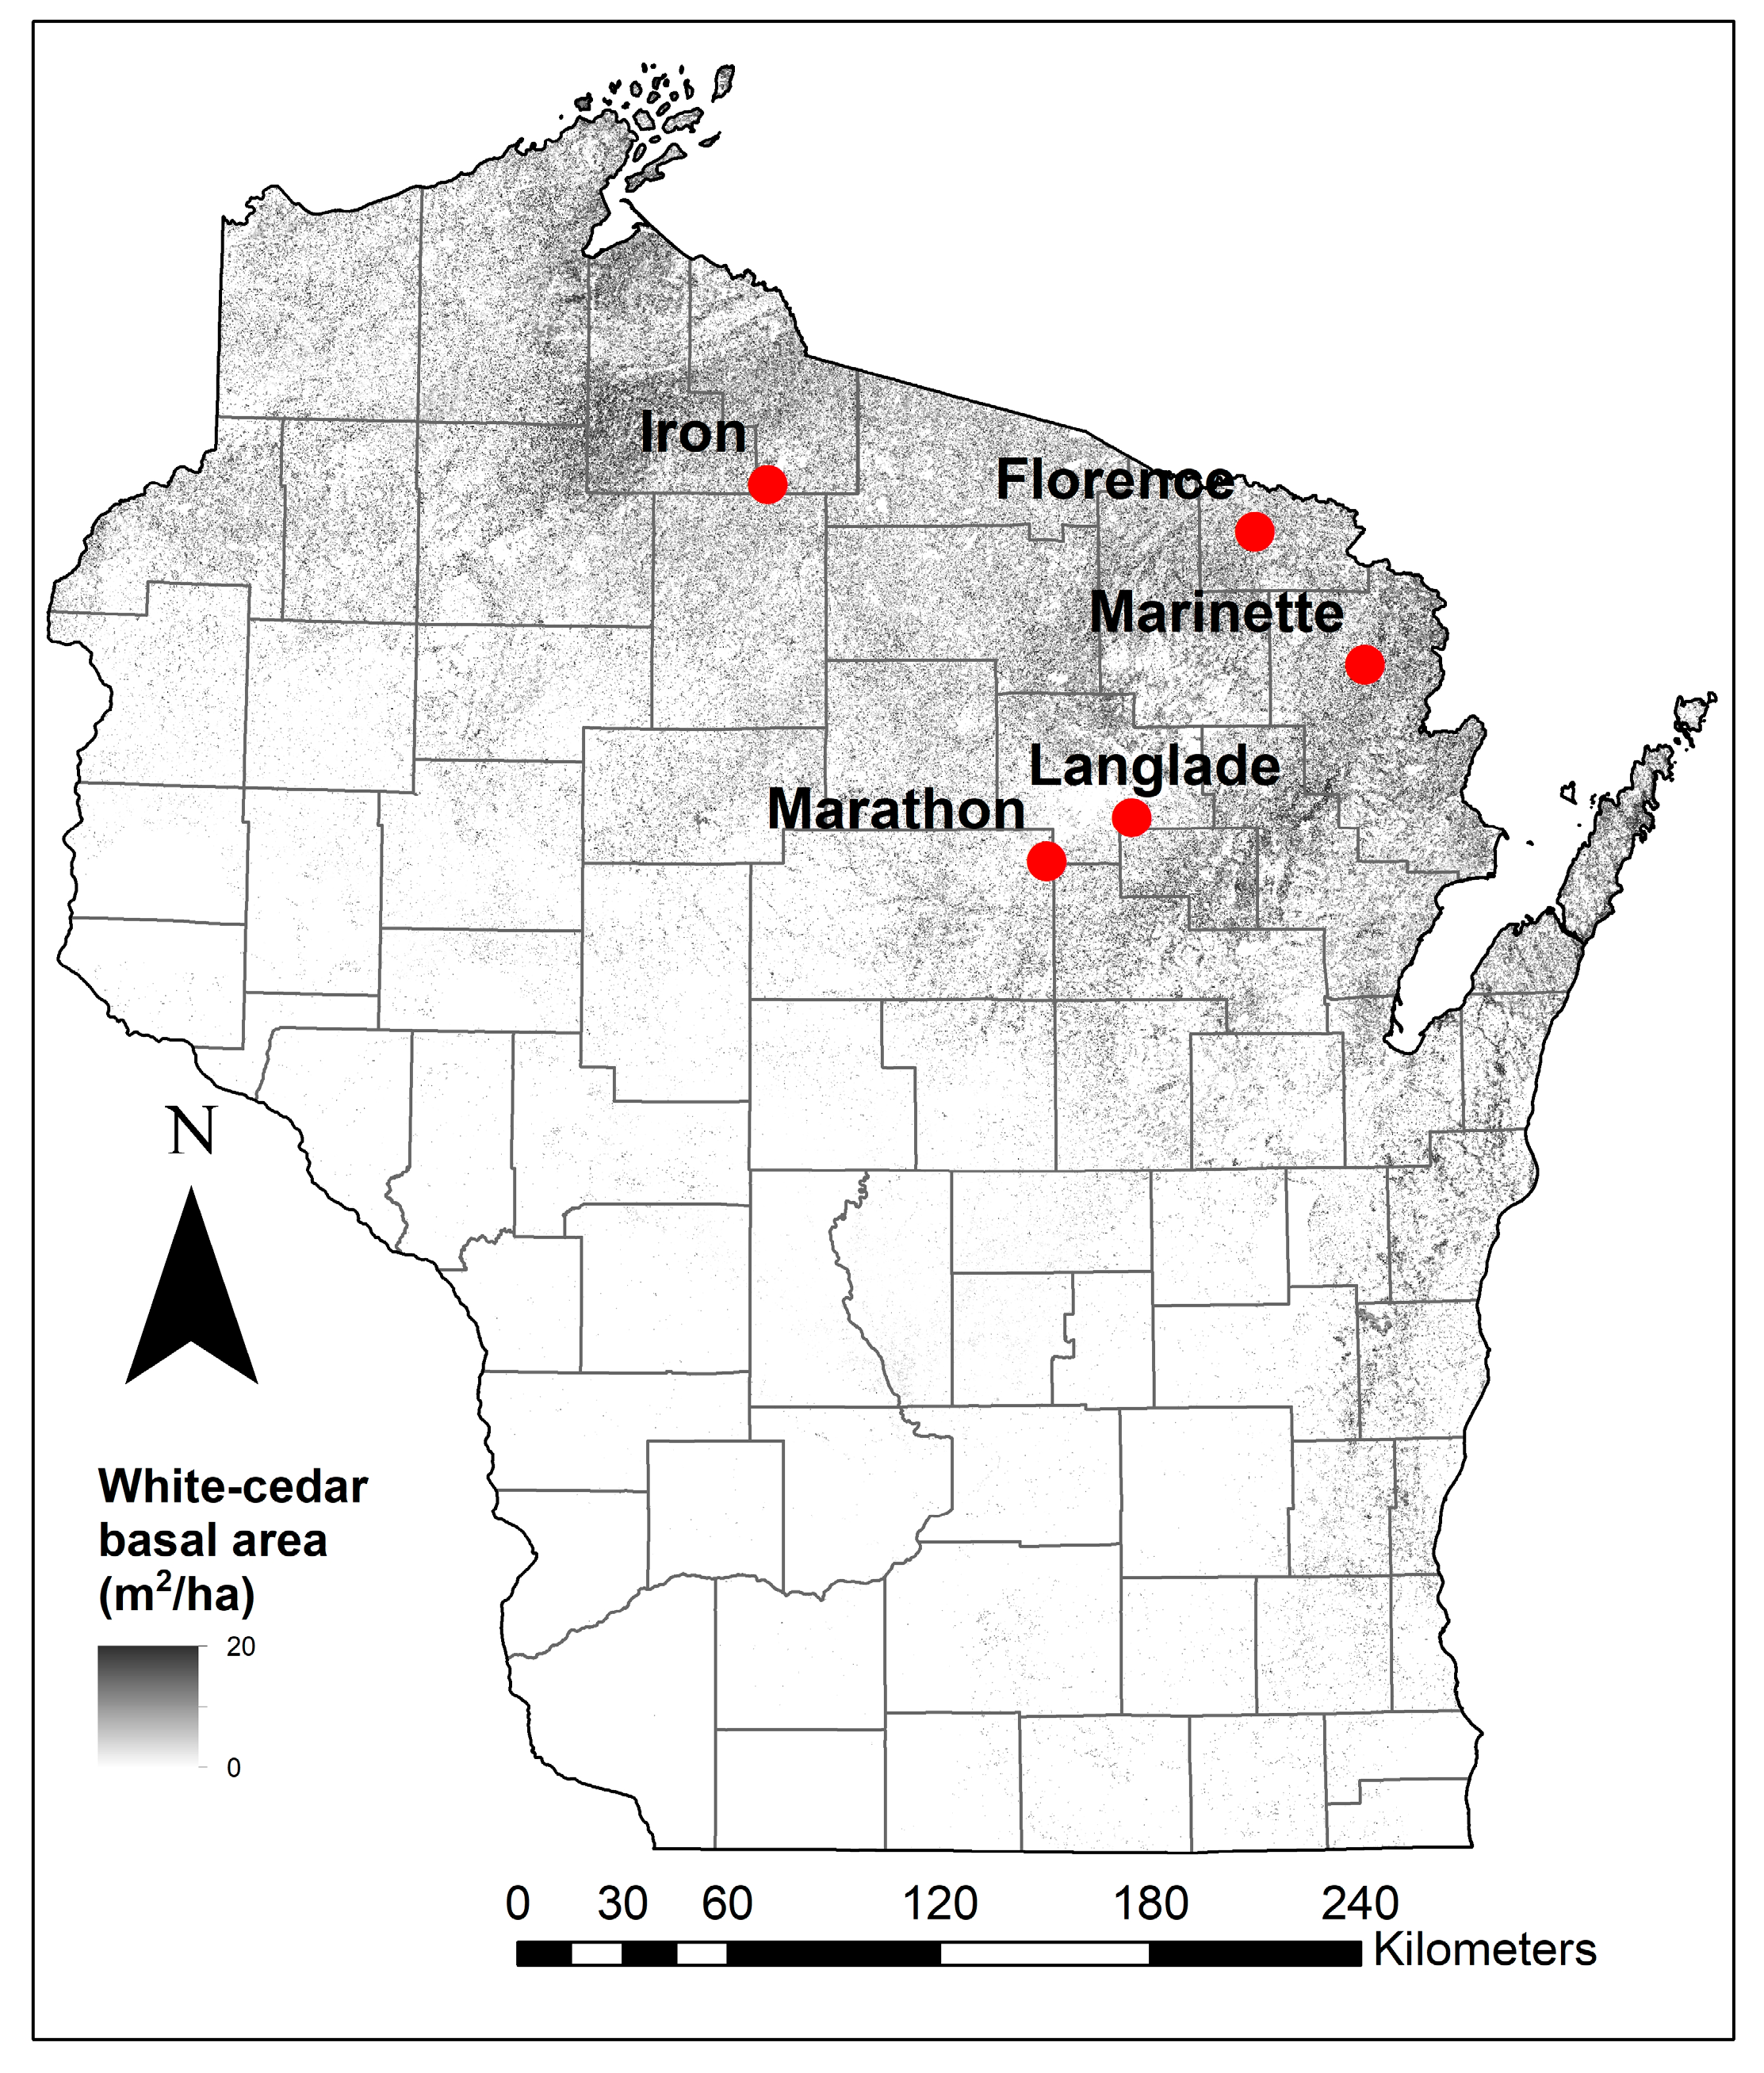
2.1. Study Sites

Five white-cedar stands in northern Wisconsin were selected for in situ measurements (Figure 1). Climate conditions for the selected stands varied in average annual temperature from 4.4 to 6.4 °C, with precipitation varying from 750 to 820 mm (Table 1). Variation in average annual snowfall was high among the five stands, with an average of 151 cm per year at the southernmost sites (Marathon and Langlade Counties), and 281 cm per year at the northernmost site (Iron County; Table 1). Soils in these stands were mostly Lupton and Cathro poorly drained organic soils on 0 to 1% slopes [24].
Site selection criteria for our study required that stands be at least 24 ha in size with at least 60% of overstory basal area being white-cedar (Table 1). Basal area of all trees greater than 10 cm diameter at breast height (dbh, 1.4 m) ranged from 33.6 to 44.3 m2 ha−1 across study stands. Each stand is considered a study site. Other overstory species included tamarack (Larix laricina (Du Roi) K. Koch) and balsam fir (Abies balsamea (L.) Mill.). Woody species frequently occurring in the understory were balsam fir, mountain maple (Acer spicatum Lam.), bog Labrador tea (Ledum groenlandicum Oeder), and black ash (Fraxinus nigra Marshall). Estimated county level deer densities ranged from 2 to 12 deer km−2 [27] (Table 1). All study sites occurred in lowland swamp areas with organic soils and had little to no management in the last 50 years.

2.2. Field Methods

Six plots were located systematically on a grid across each study site. The distance between adjacent plot centers ranged from 175 to 615 m depending on the size and shape of the site. In each plot trees greater than 10 cm dbh were recorded in a 400 m2 area. Saplings (height ≥ 1.83 m, dbh < 10 cm) of all woody species were tallied by species in a 100 m2 subplot and were considered to have escaped from browsing by deer based on personal observation. All woody plants within browsing range as defined for this study (<1.83 m) were tallied by species in four 7 m2 subplots on each 400 m2 plot (10 m from plot center in each cardinal direction). Because small seedlings are often unavailable to deer during the winter months due to snowfall, all seedling counts were divided into two classes: small seedlings <20 cm tall (potentially hidden by a snow layer [28] and large seedlings 20 cm to <1.83 m tall (potentially exposed year-round).
Site-level deer browsing was determined using a categorical measure for palatable tree species between 20 cm and 1.83 m tall in each of the 400 m2 plots. Palatable species were identified as species with a browse preference I or II rating according to Dahlberg and Guettinger [29]. The most common palatable species found in this study were mountain maple, Ilex spp., red maple (Acer rubrum L.), and white-cedar. Deer browsing on twigs can be visually differentiated from hare browsing as deer tear off twigs leaving a frayed edge, while hares use their incisors and leave a sharp, smooth cut [30]. Deer browsing categories included 1 = None: no visible evidence; 2 = Low: light browsing evidence (1%–25% stems browsed); 3 = Medium: browsing evidence observed but not common, seedlings are present (26%–50% stems browsed); 4 = High: browsing evidence common, and/or seedlings are rare (51%–75% stems browsed); 5 = Very High, browsing evidence omnipresent, severe browse line (>75% stems browsed) [31]. County-level deer density estimates were provided by the Wisconsin Department of Natural Resources [27]. We also used the WISCLAND 2 land cover dataset to determine the area of agricultural land and grassland/grazing land, both land cover types that may support a greater number of deer [32]. Based on the deer home range size of 178 ha found by Larson et al. in Wisconsin [33], the amount of agriculture or grassland area was calculated in 1.5 km wide buffers around each study site.
Substrate and competing vegetation were measured at four 1 m2 subplots per 400 m2 plot. Percent cover of graminoids, ferns and fern allies, moss, trailing woody species, other forbs, standing water, and leaf litter were all recorded within the 1 m2 subplots. Percent cover categories included 0 = 0%, 1 = 1%–25%, 2 = 26%–50%, 3 = 51%–75%, and 4 ≥ 75%. Standing water was estimated as the percent of the plot regularly covered by standing water as evidenced by standing water impeding the growth of vegetation. In each 1 m2 subplot, leaf litter layer was recorded as mostly deciduous, coniferous, or mixed coniferous/deciduous. Depth of undecomposed leaf litter (Oi soil horizon) was measured to the nearest 0.5 cm at three locations in each subplot, for a total of 12 litter depth measurements per plot. Spherical convex densiometer readings were taken as an indicator of light levels in the understory. Densiometer measurements were taken at breast height (1.4 m) at each cardinal direction, 5 m from plot center using the method of Strickler [34]. Coarse woody debris (CWD, diameter ≥ 10.4 cm) was measured on four 20 m transects per plot. Decay class (1–5, [35]) was evaluated and it was noted whether or not the CWD was white-cedar. Total volume of CWD, volume of white-cedar CWD, and volume of white-cedar CWD in decay classes 3–5 were calculated using the line-intercept method of Marshall et al. [36], with the assumption that all pieces lay horizontally.
One soil sample was collected at the center of each plot. Samples were taken just below the duff layer at a depth of 0–30 cm using a 5 cm diameter soil corer. Soils were dried and ground with a mortar and pestle. They were then analyzed at the University of Wisconsin-Madison Soil and Plant Analysis Laboratory to determine pH, percent organic matter, Ca2+, K+, Mg2+, P, and cation exchange capacity (CEC).

2.3. Model Selection

We created three models to determine the effect of predictor variables on stem density of white-cedar saplings, large white-cedar seedlings, and small white-cedar seedlings. The VSURF package in R was used to pare down from the full list of potential predictor variables to the variables in the VSURF “prediction” step [37]. A list of all predictor variables can be found in Table 2. The variables selected with VSURF were then used to create linear mixed models using the lme4 package in R [38]. Small and large white-cedar seedlings were measured at the subplot level, so plot nested within site was used as a random effect. White-cedar saplings were measured at the plot level, so site was used as a random effect. In all models, the response variable was transformed with a square root transformation in order to meet assumptions of constant variance in the residuals. All possible models with all interactions using the variables selected with VSURF were compared using the Akaike information criterion, corrected for small sample sizes (AICc). These models were also compared to models that used each of the three measures of deer browse pressure from this study: estimated county-level deer population density (CTY_DEER), acres of agriculture and grassland within at 1.5 km buffer of the stand (BUFF_AG.GRASS), and categorical estimate of percent of palatable stems browsed (DEER_BROWSE). Of the models that scored within 10 of the lowest AICc score, the model with the fewest predictor variables and interactions was selected.

3. Results

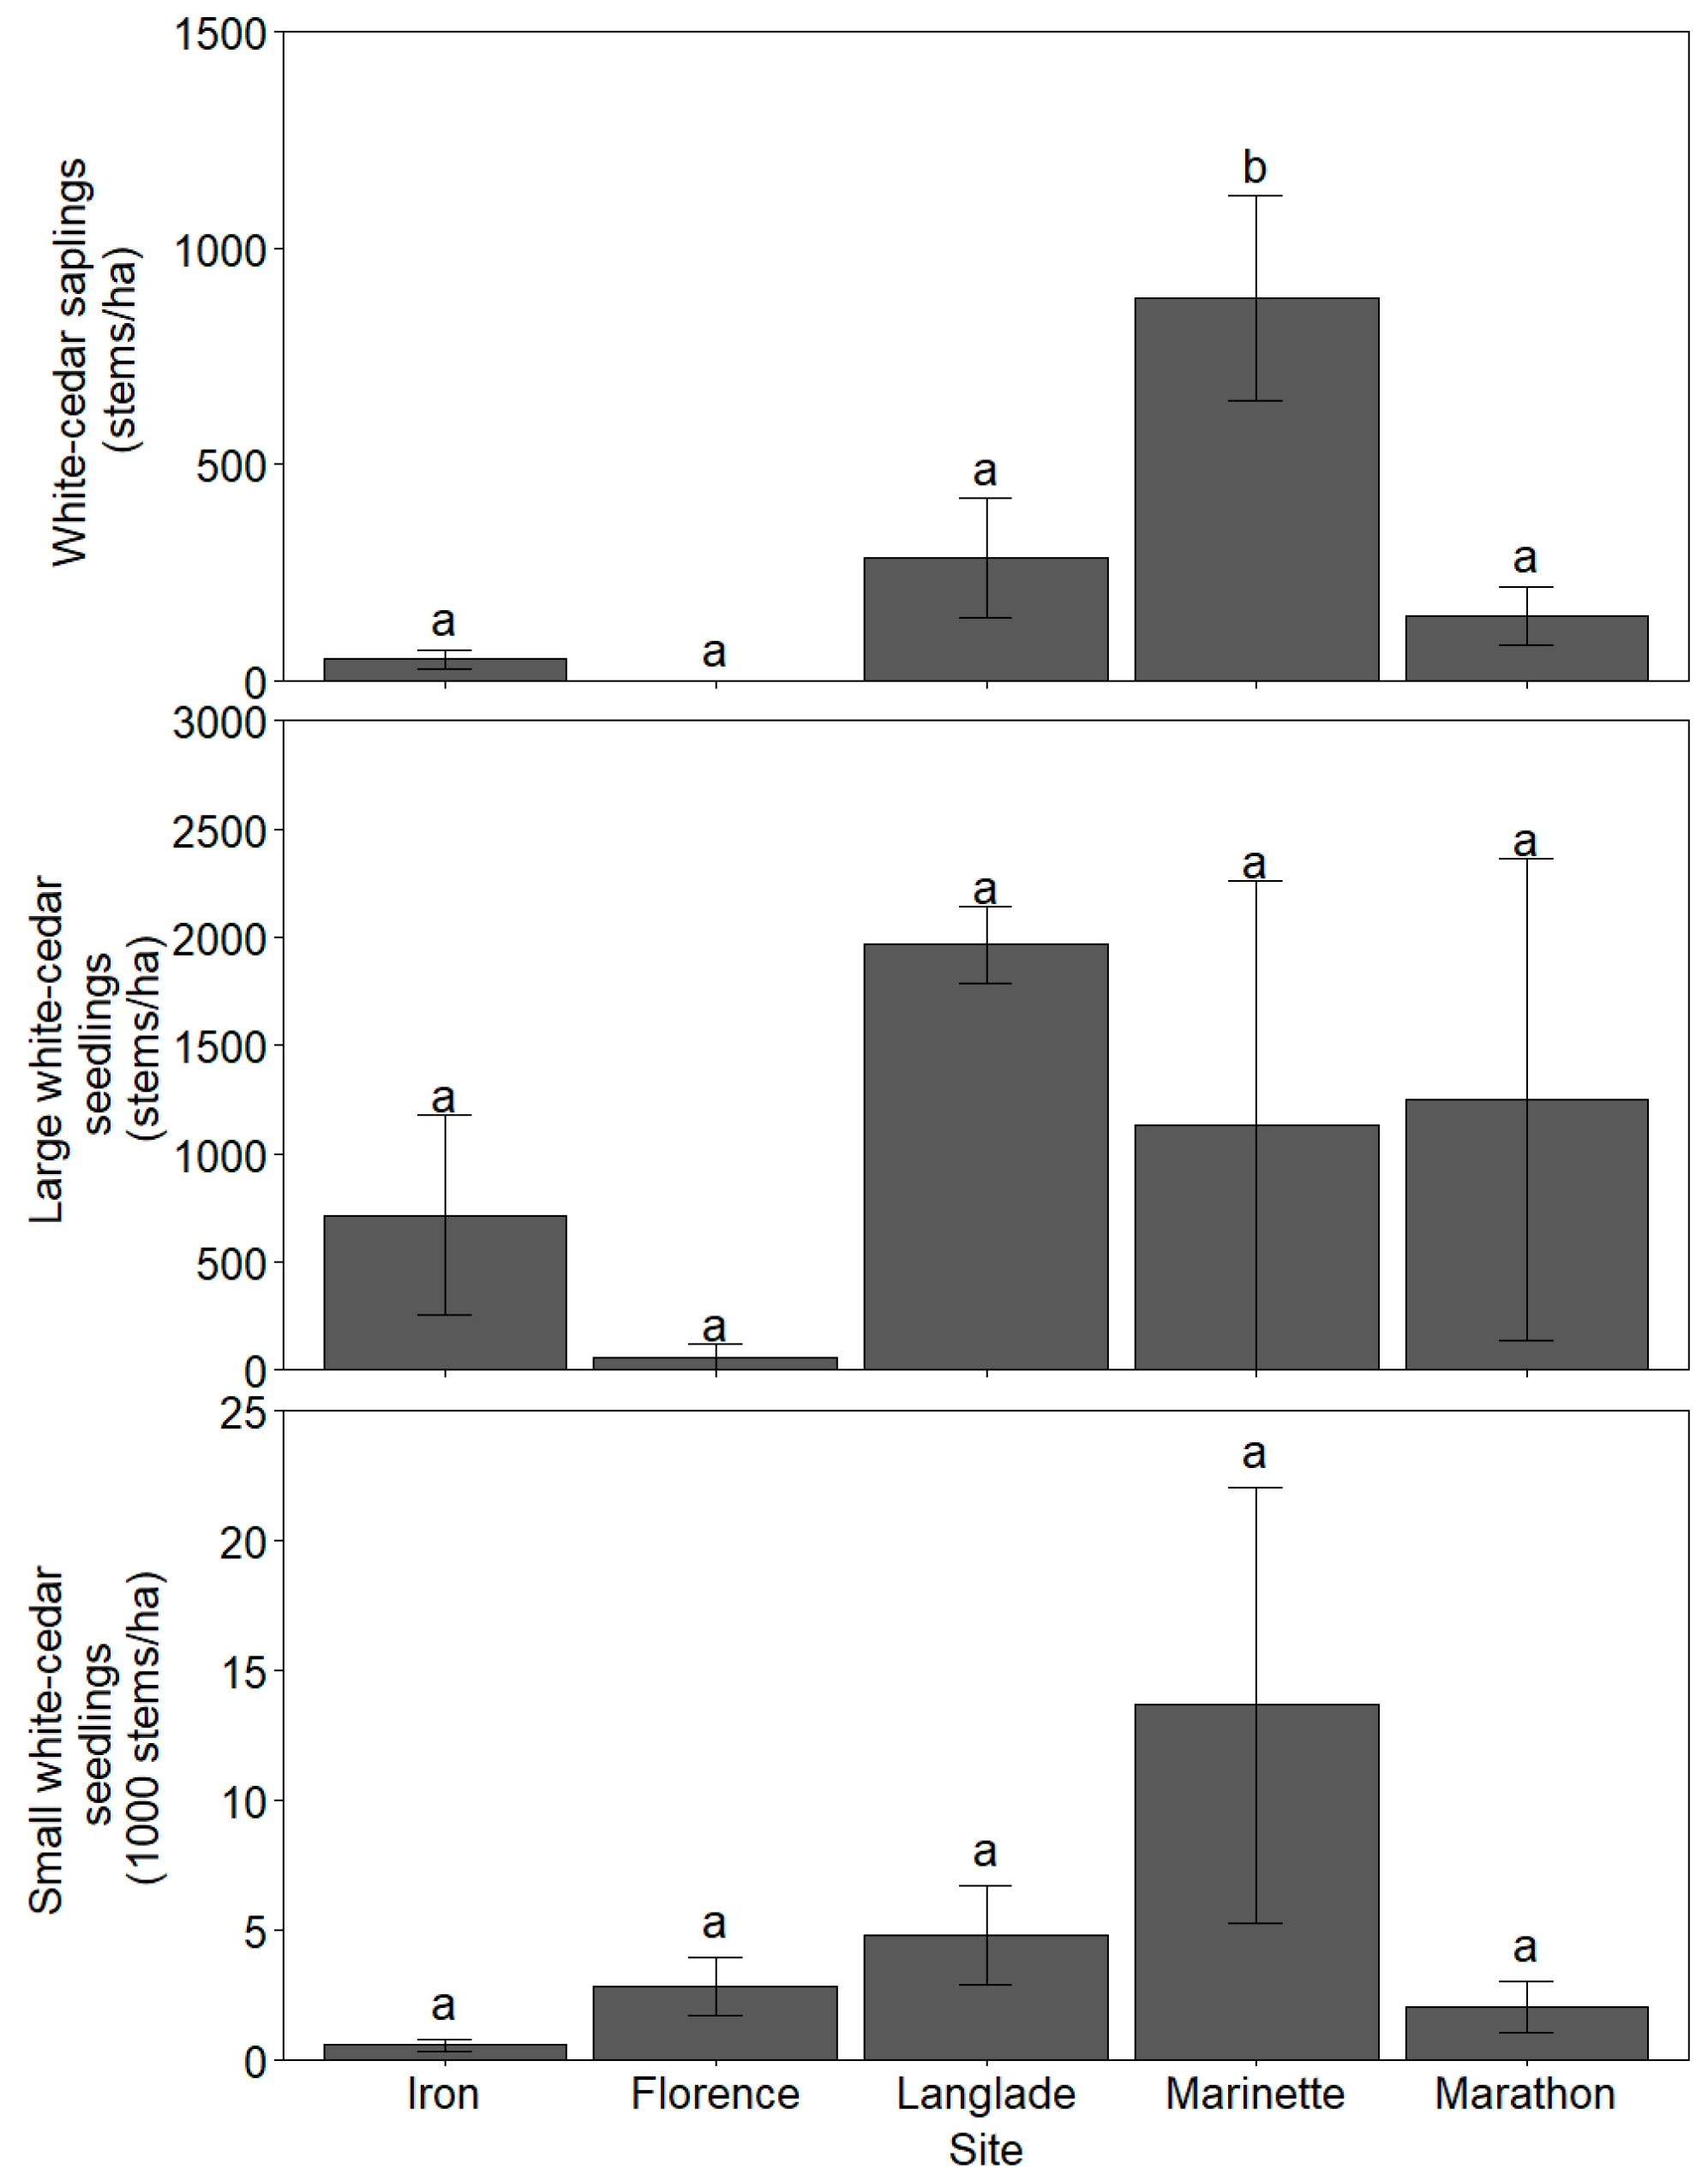
3.1. White-Cedar Regeneration

Total stem densities of white-cedar regeneration, which ranged from 1300 stems ha−1 at the Iron County site to 15,600 stems ha−1 at the Marinette County site, were not significantly different between sites, though within-site variation was high. When stratified by height class, we found that the Marinette County site had significantly more white-cedar saplings than the other four sites, with an average of 880 saplings ha−1. Large white-cedar seedling density ranged from an average of 60 stems ha−1 at the Florence County site to just under 2000 stems ha−1 at the Langlade County site but were also highly variable (Figure 2). For example, five of six plots at the Florence County site had no large white-cedar seedlings and plot densities ranged from 0 to 6800 stems ha−1 at the Marathon and Marinette County sites. Small white-cedar seedlings were absent on at least one plot at all sites, except Marinette County which had white-cedar seedlings in this height class present on all six plots; plot-level stem density of small white-cedar seedlings at the Marinette County site ranged from 1000 to 54,000 stems ha−1. Overall, stem density of white-cedar regeneration generally decreased with increasing height class.

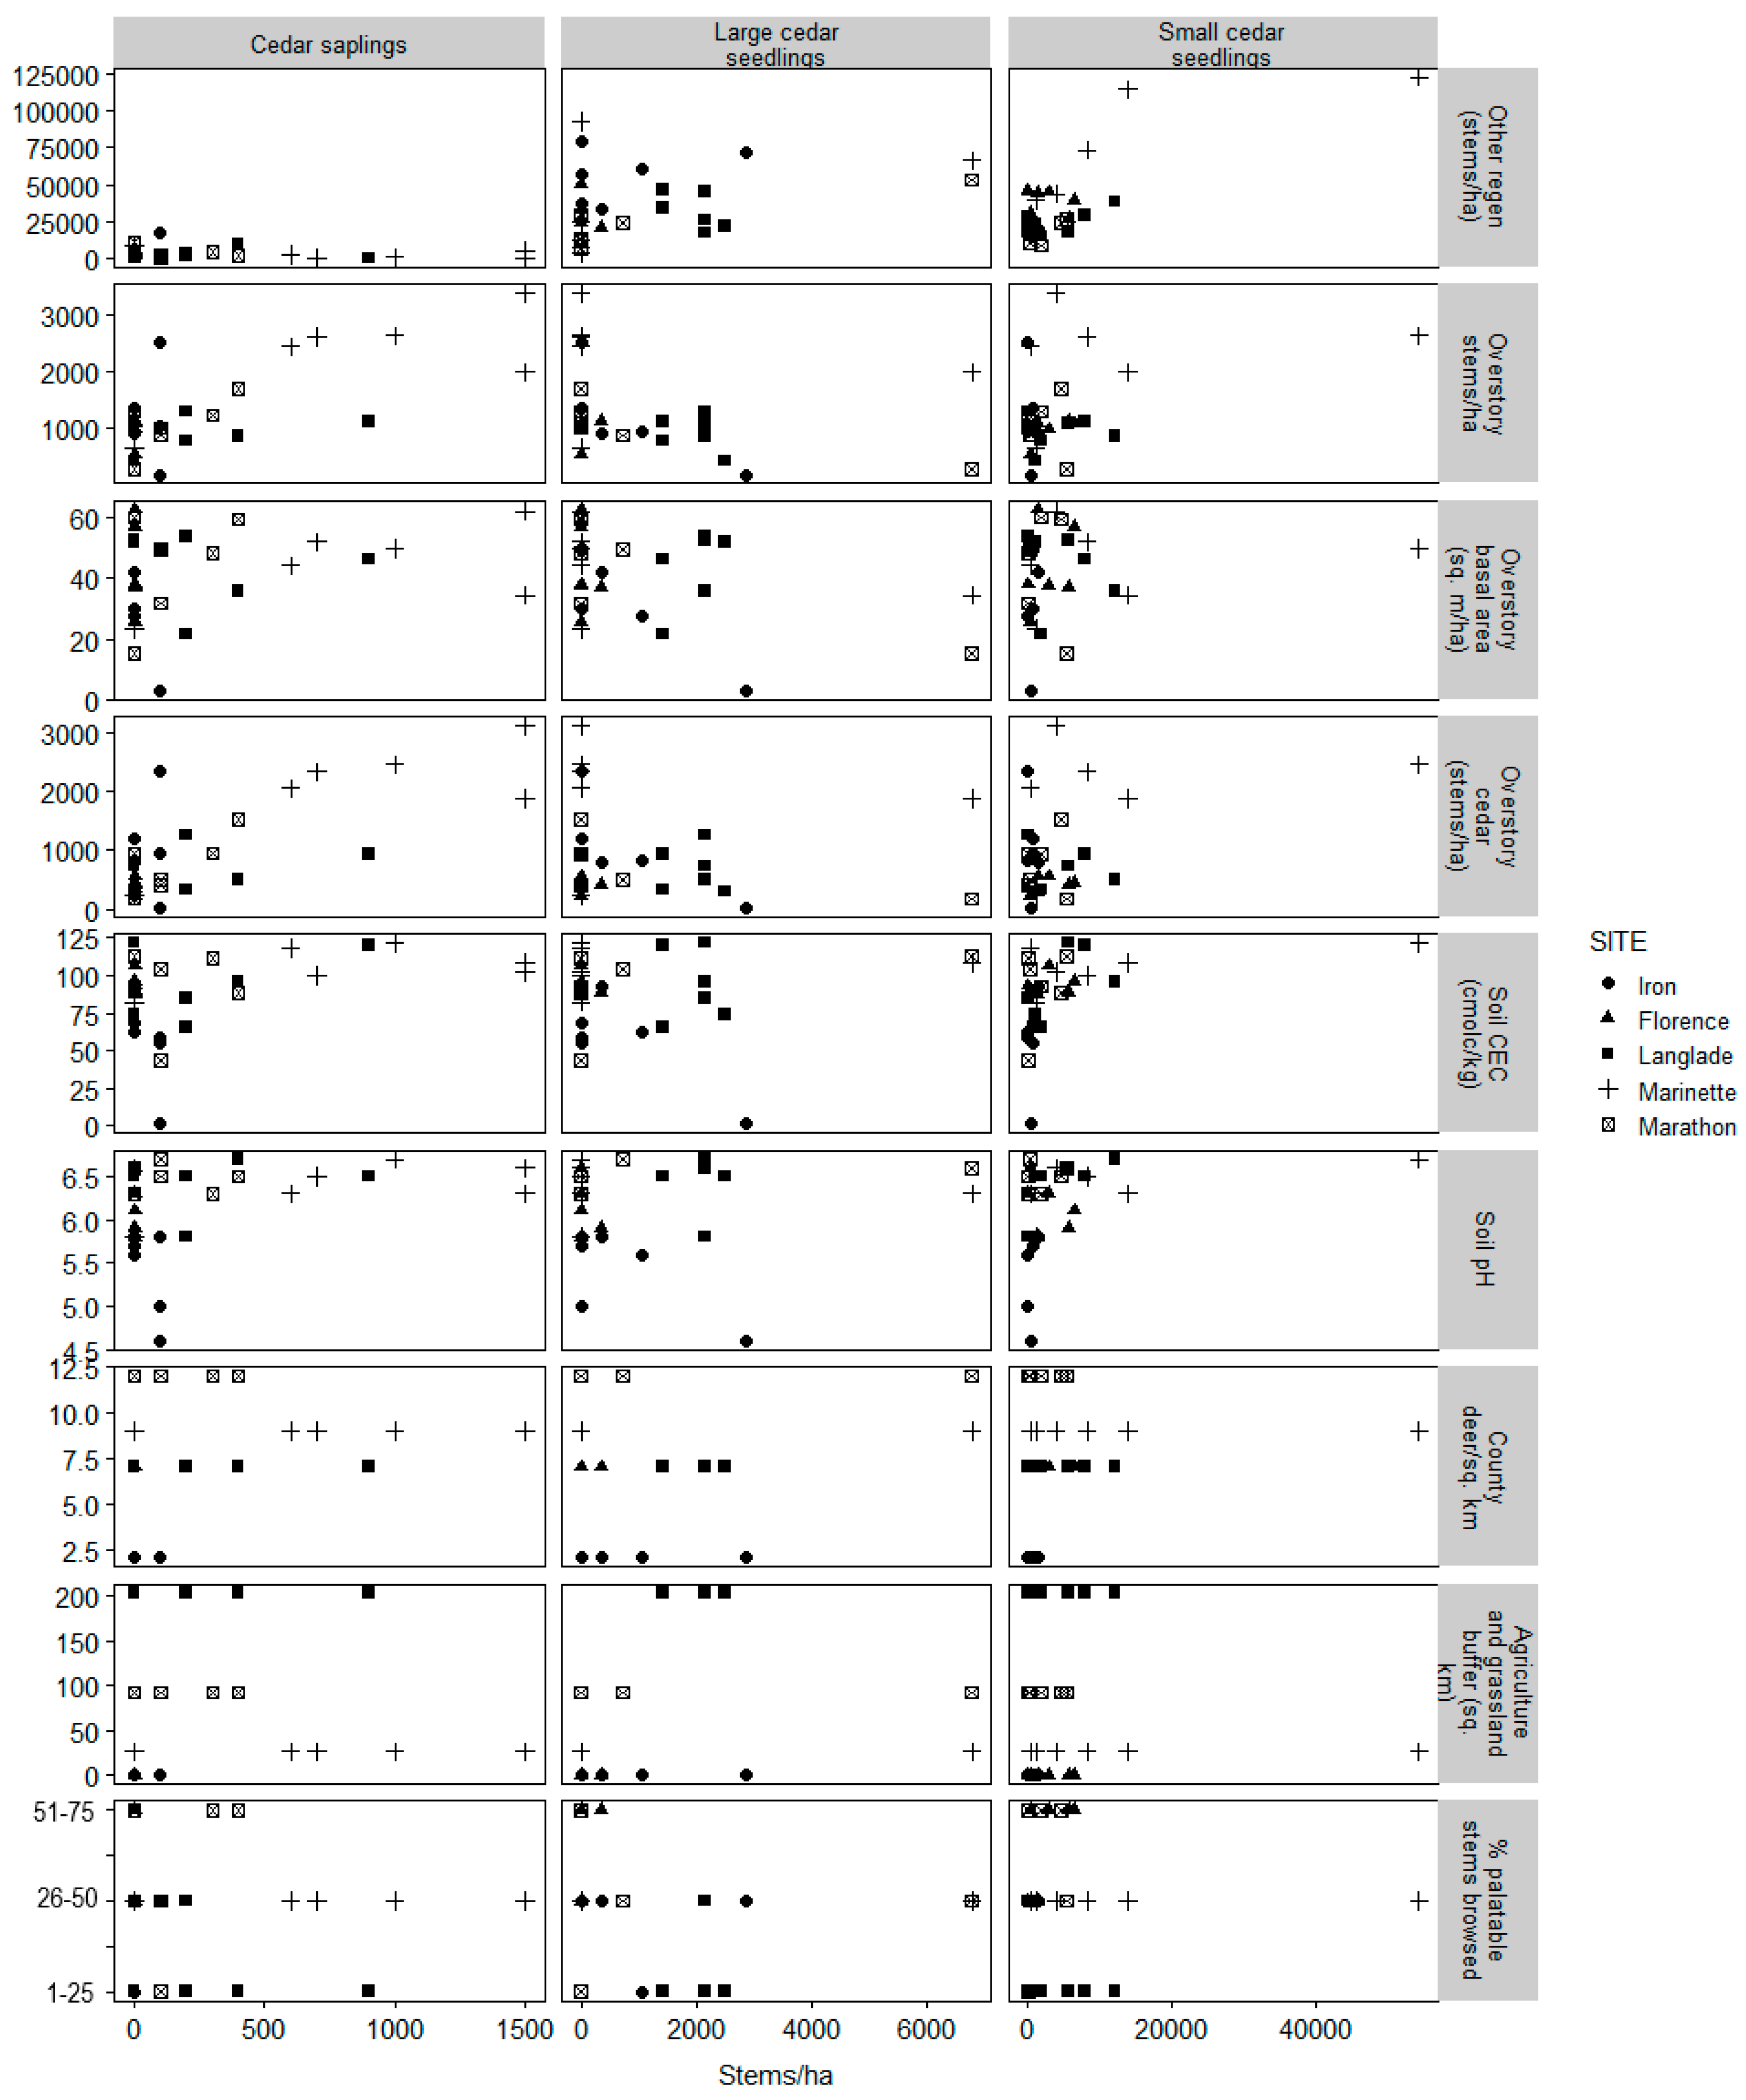
3.2. Model Selection

A comparison of white-cedar regeneration to all variables used as model parameters in at least one model is shown in Figure 3. Site level means for all measured variables can be found in Table A1.
The VSURF package was used in initial variable selection utilizing the list of site measures (Table 2) as potential predictors of white-cedar regeneration. Two variables were selected as potentially describing stem density of white-cedar saplings; those variables were soil CEC (CEC) and stem density of white-cedar in the overstory (CEDAR_STHA). When AICc was compared for all possible models including the predictor variables listed above, the selected most parsimonious model included only the predictor variable for stem density of overstory white-cedar (Table 3). When AICc of the selected model was compared with the null model (intercept only), it was shown that the selected model had significantly more explanatory power (Table 3). The selected model also had a lower AICc score than any model of deer browse effects (Table 3). In the selected model, stem density of white-cedar in the overstory was found to be positively related to stem density of white-cedar saplings (Table 4).
The variables that were most related to stem density of large white-cedar seedlings using VSURF were soil CEC (CEC), stem density of other large seedlings (OTHERLGSEED), overstory basal area (BSLA), depth of leaf litter (LITTER_DEPTH), and plot cover by graminoids (GRAM). When AICc was compared for all possible models including the predictor variables listed above, the selected most parsimonious model included only the predictor variable for density of other large seedlings (Table 3). When AICc of the selected model was compared with the null model (intercept only), it was shown that the selected model had significantly more explanatory power (Table 3). The selected model also had a lower AICc score than any model of deer browse effects (Table 3). In the selected model, stem density of large seedlings of other species was found to be positively related to stem density of large white-cedar seedlings (Table 4).
Based on the VSURF package, four predictor variables potentially affecting small white-cedar seedling density were identified: density of other small seedlings (OTHERSMSEED), overstory stem density (CANOPY_STHA), soil pH (pH), and soil cation exchange capacity (CEC). When AICc was compared for all possible models including the predictor variables listed above, the selected most parsimonious model included predictor variables for density of other small seedlings and soil pH (Table 3). When AICc of the selected model was compared with the null model (intercept only), it was shown that the selected model had significantly more explanatory power (Table 3). The selected model also had a lower AICc score than any model of deer browse effects (Table 3). In the selected model, both pH and stem density of other small seedlings were found to be positively related to stem density of small white-cedar seedlings (Table 4).

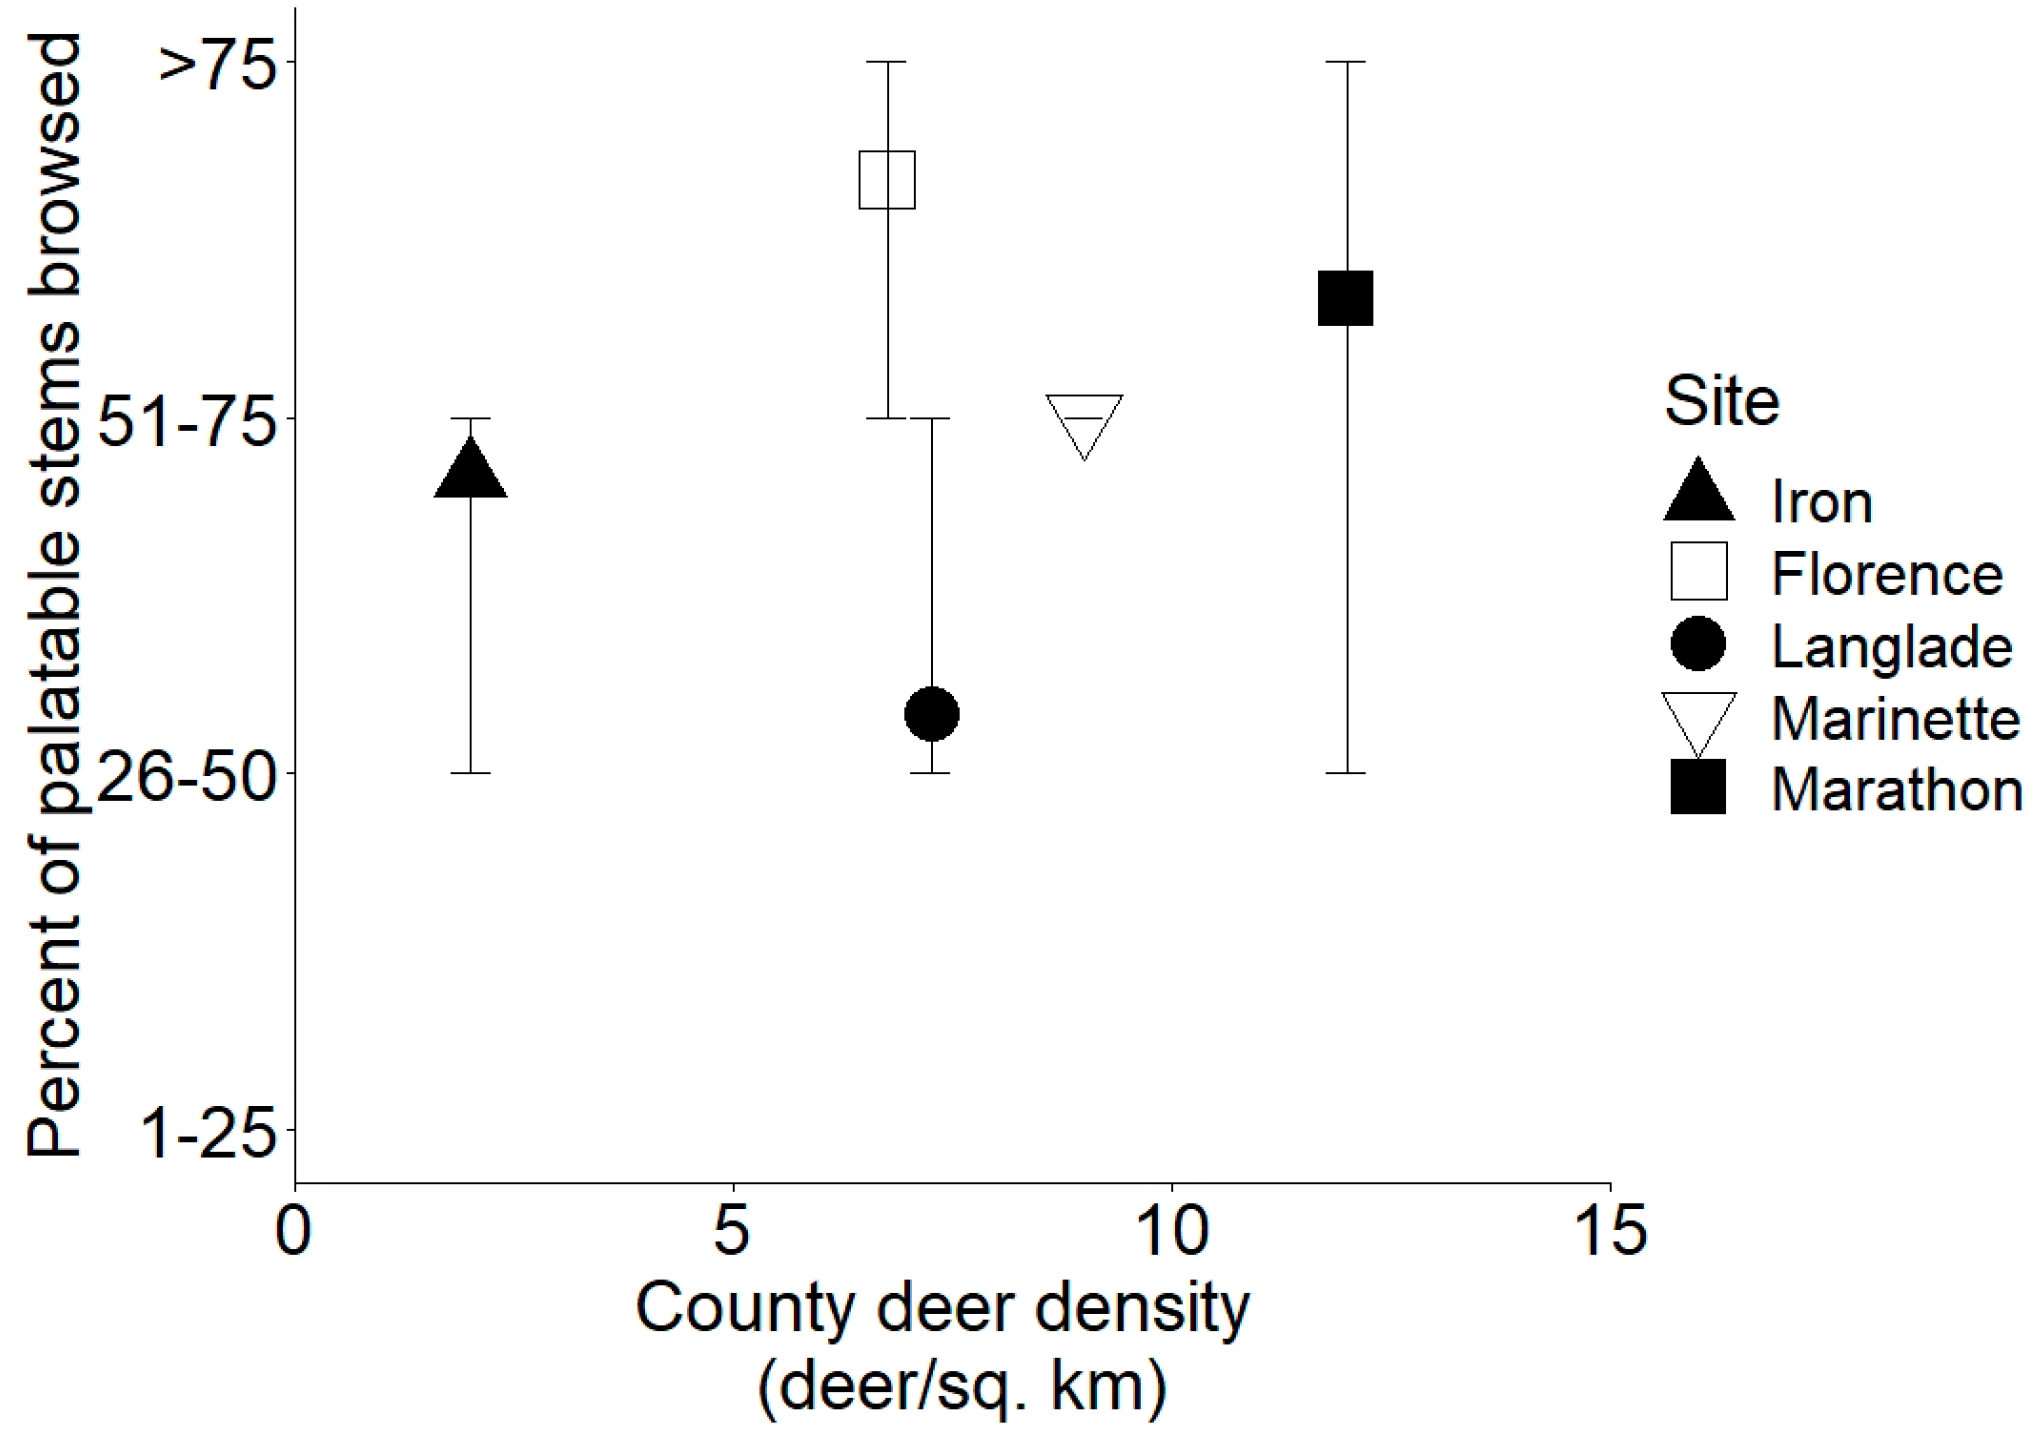
3.3. Measures of Browsing by Deer

This study used the following variables as direct or indirect measures of browse pressure at each site: percent of palatable woody stems browsed (DEER_BROWSE), county deer population density (CTY_DEER), and amount of agricultural and grassland in a 1.5 km buffer around the site (BUFF_AG.GRASS). None of these variables were significant predictors in the selected models for white-cedar seedling or sapling stem densities. Models of white-cedar regeneration using measures of browsing by deer also did not perform well. We found that at each plot in the study the percent of palatable stems browsed was at least 25%–50% and as high as 75%–100%, but observed browse was not correlated with white-cedar regeneration in any height class (Figure 3). County-level deer density estimates were not a good predictor of white-cedar regeneration but were also not related to observed browsing level at the site (Figure 4).

4. Discussion

White-cedar serves important roles in social and ecological systems. Its value as a decay resistant building material and its traditional uses by Native American peoples make it an important forest product. However, this species is often difficult to regenerate. Our study focused on inventories of mature stands of white-cedar to uncover factors related to success or failure of natural white-cedar regeneration. Based on existing studies, we anticipated white-cedar regeneration densities to increase with more exposed soil (minimal litter layer) and coarse woody debris [10,11] and decrease with higher deer densities [7]. The inventoried stands in Wisconsin did not meet our expectations but were influenced by other biotic and abiotic factors that we discuss in the following paragraphs.
One of the most surprising findings from this study was that none of the measures of deer abundance or deer browse pressure were associated with density of white-cedar regeneration. The negative effect of deer browsing on white-cedar has been well documented in many studies and is often cited by foresters as the biggest challenge to white-cedar regeneration [4,5,7,9,18]. However, deer browsing pressure can be difficult to quantify and varies seasonally and year-to-year [39]. While the stands in this study were not known to be used as deer yards and deer yarding is likely to be less common in this area than farther north [40,41], the use of white-cedar stands as winter deer yards can further complicate attempts to quantify deer browsing pressure. This study attempted to quantify deer impacts in three ways, using county-level deer population estimates, estimating browse intensity on palatable species at the plot level, and by using surrounding land-use as a proxy for deer habitat. County-level deer estimates did not relate to stem density of white-cedar regeneration or to observed browsing level in the stand. It is not surprising because these measures of deer populations are coarse, and we would not expect them to represent the deer browsing pressure in an individual stand. While we do recognize that the chances of over-browsing increase with increasing county-level deer population, when measuring a highly palatable species like white-cedar, even stands where county-level deer populations are low may still have high white-cedar browse impact due to deer congregating in white-cedar-rich stands. Additionally, we estimated browse intensity in 25% classes (ex. 1%–25% of stems browsed) and estimated most of the plots in the study to have 51%–75% of palatable stems browsed. These estimates of browse intensity may not be fine enough to capture differences that are important ecologically. We did observe a large decrease in white-cedar stem density between the small seedling height class (which is protected from browsing by snow for much of the winter [28]) and the large seedling height class, which is vulnerable to browsing year-round. This drop off in seedling density could have been due to browsing by deer but could also be related to many other factors such as nutritional demands and competition [8,42]. Other measures of browse pressure, such as density and diversity of seedlings by height class [31] or browsing quantified at the species level may be necessary to better understand stand-specific challenges.
Regeneration of white-cedar was poor overall and highly variable among plots within sites. Large white-cedar seedlings were found on only 19% of the subplots in this study. Management guidelines suggest that adequate stocking can be achieved with 60% milacre (4 m2) stocking of young, seed-origin seedlings greater than 30 cm tall [43]. In this study, no sites achieved at least 60% white-cedar stocking in the large seedling height class. The Langlade County site had the highest stocking of large white-cedar seedlings, with 46% of subplots having at least one seedling present, while at the Florence County site, only one subplot of the 24 sampled subplots (4%) had any white-cedar seedlings in the large seedling height class.
While stem densities of white-cedar regeneration were low in all height classes, they were comparable to stem densities found in other recent studies. Site-level mean stem densities ranged from 500–13,500 small white-cedar seedlings per hectare and 60–1200 large white-cedar seedlings per hectare in this study. In mixedwood stands in Quebec and Maine, Larouche and Ruel observed natural regeneration densities of about 3000–8000 white-cedar seedlings per hectare [7]. In a lowland white-cedar stand in Wisconsin, Forester et al. observed a median stem density for small white-cedar seedlings of 1800 stems ha−1 [44]. A study conducted in poorly drained stands in Wisconsin in the early 1980s found much higher densities of white-cedar regeneration in unharvested stands, with mean stem densities of over 30,000 stems ha−1 [9].
Of the 30 potential factors analyzed in this study, three were found to be related to the density of at least one height class of white-cedar regeneration: soil pH, stem density of regeneration of other species, and stem density of mature white-cedar in the overstory. Soil samples in this study had pH values from 4.6 to 6.7 and stem density of small white-cedar seedlings increased with increasing soil pH. These results are similar to other studies both in the Lake States and in the Northeast. In Michigan, Nelson found lower densities of white-cedar seedlings when the soil pH was less than 6.0 [45]. In Maine, Kell found that white-cedar growth was positively correlated with pH [46], and Curtis found optimal white-cedar growth when soil pH was between 5.5 and 6.7 [47].
Stem density of mature white-cedar in the overstory was positively related to stem density of white-cedar saplings in the study. One potential reason for this positive correlation could be increased seed rain with more white-cedar in the overstory. In some cases, seed rain may be the most limiting factor to white-cedar regeneration, or at least very high seed rain may increase the likelihood of some individuals surviving against other challenges [13]. Cornett et al. found an effective seed rain dispersal distance of about 20 m for white-cedar [48], which could lead to a strong correlation between overstory white-cedar and regeneration at the plot level. Alternately, since we did not age the saplings in this study, it is possible that they are older, suppressed individuals that established at the same time as the larger, mature trees in the overstory after a disturbance or extended period of low browsing intensity [49]. Finally, layering (asexual reproduction resulting from branches rooting to the ground) has been reported as the predominant white-cedar regeneration mechanism on some wet sites [45,47]; this could explain the correlation we observed between density of overstory white-cedar and regeneration of this species. Mode of regeneration was not determined in the present study.
We found both small and large white-cedar seedlings to increase with increasing stem density of regeneration of other species in the same height classes. This seems to be inconsistent with other studies that found negative impacts of competition on white-cedar regeneration [14,42]. Chimner and Hart also found that white-cedar seedlings decreased when shrub density increased [8]. The findings in this study could mean that there were additional (unmeasured) factors that made certain plots or sites more favorable to regeneration overall, not just regeneration of white-cedar or there could be associational resistance to deer browsing due to increasing stem density of other species [50].
Microtopography has been found to be an important factor for white-cedar regeneration in several studies. In swamps and on wetter sites, the increased presence of hummocks has been associated with increased white-cedar survival and growth [51] and decreased competition from shrubs and hardwoods [8]. On drier and upland sites where white-cedar seedlings are more susceptible to desiccation, decaying logs have been found to be a better seedbed [48,52,53] and soil moisture has been suggested as one of the most important factors affecting white-cedar germination and early seedling survival [10,13]. This study took place on sites with poorly drained, organic soils. While we did not find the amount of standing water in a plot to have a significant effect white-cedar regeneration, we did observe the majority of white-cedar seedlings growing on either hummocks or decaying logs.
There are several additional factors that may be important to white-cedar regeneration that were not measured in this study. Hydrology, fire, and fire history of a stand may also play a significant role in site preparation for white-cedar regeneration [8,9], but the fire history of the sites in this study is not known and hydrology data were not collected for this study. Browsing by snowshoe hares (Lepus americanus Erxleben) was not evaluated in this study but has historically had the potential to be as or more important in affecting white-cedar regeneration than browsing from deer [54]. We also acknowledge that this study was of limited geographic scope, with only five sites across northern Wisconsin, USA. Additional study sites across a broader geographic area would increase the robustness of this study.

5. Conclusions

This study suggests that in some locations site-level factors may potentially be as or more important than deer densities in determining the success of natural white-cedar regeneration. Local (stand-level) browsing pressure is difficult to quantify but is likely much more important in determining regeneration success than broader population estimates, such as those done at the county level. Based on this study, opportunities for regenerating white-cedar may be identified by other evidence in the stand, sufficient white-cedar seed source must exist in the overstory, and higher densities of regeneration of other species may indicate good regeneration conditions overall that may also benefit white-cedar regeneration.

Author Contributions

L.F.R., C.C.K., L.S.K., and D.R.B. contributed to study conceptualization and development of methodology. L.F.R. carried out formal analysis of data. L.F.R., C.C.K., L.S.K., and D.R.B. contributed to the writing of the paper.

Funding

This research received no external funding.

Acknowledgments

Thanks to Teresa Pearson for leading field data collection as well as Jacob Coonen and Meghan Sullivan for their work in the field. We greatly appreciate the assistance with data analysis provided by Aaron Weiskittel. Thanks to Rodney Chimner and Jeanette Allogio for providing valuable editorial suggestions. Funding was provided by the U.S. Forest Service, Northern Research Station and the Wisconsin Department of Natural Resources.

Conflicts of Interest

The authors declare no conflict of interest.

Appendix A

Table A1. Site-level means for all potential predictor variables measured. See Table 2 for definitions of variable symbols.
Potential Predictor Variable SymbolIronFlorenceLangladeMarinetteMarathon
OTHERSMSEED19,40538,45225,11968,81019,226
OTHERLGSEED56,31031,07131,60734,46423,095
OTHERSAP58333217235029503450
CANOPY_STHA115497992522961063
BSLA33.642.943.644.344.0
DENSIOMETER7683878987
GRAM11111
FERN11101
FORB11211
MOSS33232
VINE11111
CEDAR_BA32.031.830.637.629.4
CEDAR_STHA10214216712004746
VOL_CWD8.181.947.37.730.8
VOL_CWD_CEDAR4.466.66.14.013.2
VOL_CWD_3PLUS3.350.824.53.414.8
WATER11011
L_LITTER22323
LITTER_DEPTH2.52.42.82.53.0
CEC5498103115102
CA18973213435034774338
pH5.46.26.46.46.5
OM6171647158
P565610
K4692434052
MG3717731114798873
CTY_DEER277912
BUFF_AG.GRASS0.50203.225.891.6
DEER_BROWSE45344

References

  1. Epstein, E.; Smith, W.; Dobberpuhl, J.; Galvin, A. Biotic Inventory and Analysis of the Northern Highland- American Legion State Forest; Wisconsin Natural Heritage Inventory Program, Bureau of Endangered Resources, Department of Natural Resources: Madison, WI, USA, 1999; p. 83.
  2. Johnston, W.F. Northern White-Cedar. In Silvics of North America: 1; Burns, R.M., Honkala, B.H., Eds.; Agriculture Handbook 654; U.S. Department of Agriculture, Forest Service: Washington, DC, USA, 1990. [Google Scholar]
  3. Pregitzer, K.S. The ecology of northern white-cedar. In Proceedings of the Northern White Cedar in Michigan, Sault Ste. Marie, MI, USA, 21–22 February 1990; Lantagne, D.O., Ed.; Michigan State University Agricultural Experiment Station: East Lansing, MI, USA, 1991; pp. 7–12. [Google Scholar]
  4. Cornett, M.W.; Frelich, L.E.; Puettmann, K.J.; Reich, P.B. Conservation implications of browsing by Odocoileus virginianus in remnant upland Thuja occidentalis forests. Biol. Conserv. 2000, 93, 359–369. [Google Scholar] [CrossRef]
  5. Larouche, C.; Kenefic, L.S.; Ruel, J.C. Northern White-Cedar Regeneration Dynamics on the Penobscot Experimental Forest in Maine: 40-Year Results. North. J. Appl. For. 2010, 27, 5–12. [Google Scholar] [Green Version]
  6. Dupuis, S.; Arseneault, D.; Sirois, L. Change from pre-settlement to present-day forest composition reconstructed from early land survey records in eastern Québec, Canada. J. Veg. Sci. 2011, 22, 564–575. [Google Scholar] [CrossRef]
  7. Larouche, C.; Ruel, J.C. Development of northern white-cedar regeneration following partial cutting, with and without deer browsing. Forests 2015, 6, 344–359. [Google Scholar] [CrossRef]
  8. Chimner, R.A.; Hart, J.B. Hydrology and microtopography effects on northern white-cedar regeneration in Michigan’s Upper Peninsula. Can. J. For. Res. 1996, 26, 389–393. [Google Scholar] [CrossRef]
  9. Davis, A.; Puettmann, K.; Perala, D. Site preparation Treatments and Browse Protection Affect Establishment and Growth of Northern White-Cedar; Paper NC-330; USDA Forest Service Research: St. Paul, MN, USA, 1998; p. 9.
  10. Cornett, M.W.; Reich, P.B.; Puettmann, K.J.; Frelich, L.E. Seedbed and moisture availability determine safe sites for early Thuja occidentalis (Cupressaceae) regeneration. Am. J. Bot. 2000, 87, 1807–1814. [Google Scholar] [CrossRef] [PubMed]
  11. Simard, M.-J.; Bergeron, Y.; Sirois, L. Substrate and litterfall effects on conifer seedling survivorship in southern boreal stands of Canada. Can. J. For. Res. 2003, 681, 672–681. [Google Scholar] [CrossRef]
  12. Simard, M.-J.; Bergeron, Y.; Sirois, L. Conifer seedling recruitment in a southeastern Canadian boreal forest: The importance of substrate. J. Veg. Sci. 1998, 9, 575–582. [Google Scholar] [CrossRef]
  13. Larouche, C.; Ruel, J.-C.; Lussier, J.-M. Factors affecting northern white-cedar (Thuja occidentalis) seedling establishment and early growth in mixedwood stands. Can. J. For. Res. 2011, 41, 568–582. [Google Scholar] [CrossRef]
  14. Kneeshaw, D.D.; Bergeron, Y. Ecological factors affecting the abundance of advance regeneration in Quebec’s southwestern boreal forest. Can. J. For. Res. 1996, 26, 888–898. [Google Scholar] [CrossRef]
  15. Rolley, R. Wisconsin deer status report, 2015. In Proceedings of the Midwest Deer & Wild Turkey Study Group Meeting, Carrollton, KY, USA, 22–25 August 2016; Kentucky Department of Fish and Wildlife Resources: Frankfort, KY, USA, 2016; pp. 123–133. [Google Scholar]
  16. Rooney, T.P. Deer impacts on forest ecosystems: A North American perspective. Forestry 2001, 74, 201–208. [Google Scholar] [CrossRef]
  17. Bradshaw, L.; Waller, D.M. Impacts of white-tailed deer on regional patterns of forest tree recruitment. For. Ecol. Manag. 2016, 375, 1–11. [Google Scholar] [CrossRef]
  18. Rooney, T.P.; Solheim, S.L.; Waller, D.M. Factors affecting the regeneration of northern white cedar in lowland forests of the Upper Great Lakes region, USA. For. Ecol. Manag. 2002, 163, 119–130. [Google Scholar] [CrossRef]
  19. Frelich, L.E.; Lorimer, C.G. Current and predicted long-term effects of deer browsing in hemlock forests in Michigan, USA. Biol. Conserv. 1985, 34, 99–120. [Google Scholar] [CrossRef]
  20. Frerker, K.; Sabo, A.; Waller, D. Long-term regional shifts in plant community composition are largely explained by local deer impact experiments. PLoS ONE 2014, 9, 1–17. [Google Scholar] [CrossRef] [PubMed]
  21. Anderson, R.C. Height of White-Flowered Trillium (Trillium grandiflorum) as an Index of Deer Browsing Intensity. Ecol. Appl. 1994, 4, 104–109. [Google Scholar] [CrossRef]
  22. Balgooyen, C.P.; Waller, D.M. The Use of Clintonia borealis and Other Indicators to Gauge Impacts of White-Tailed Deer on Plant Communities in Northern Wisconsin, USA. Nat. Areas J. 1995, 15, 308–318. [Google Scholar]
  23. Kirschbaum, C.D.; Anacker, B.L. The Utility of Trillium and Maianthemum as Phyto-Indicators of Deer Impact in Northwestern Pennsylvania, USA. For. Ecol. Manag. 2005, 217, 54–66. [Google Scholar] [CrossRef]
  24. Soil Survey Staff, Natural Resource Conservation Service, United States Department of Agriculture. Web Soil Survey. Available online: https://websoilsurvey.sc.egov.udsa.gov/ (accessed on 12 September 2016).
  25. Wilson, B.T.; Lister, A.J.; Riemann, R.I.; Griffith, D.M. Live Tree Species Basal Area of the Contiguous United States (2000–2009); USDA Forest Service, Northern Research Station: Newtown Square, PA, USA, 2013.
  26. Midwestern Regional Climate Center Historical Climate Summaries 1981–2010. Available online: https://mrcc.illinois.edu/mw_climate/climateSummaries/climSumm.jsp (accessed on 6 August 2018).
  27. Wisconsin Department of Natural Resources Fall Deer Population Density 2015. Available online: https://dnr.wi.gov/topic/wildlifeHabitat/reports.html (accessed on 4 April 2016).
  28. National Operational Hydrologic Remote Sensing Center Northern Great Lakes Snow Depth Observations for Florence and Antigo, Wisconsin. Available online: https://www.nohrsc.noaa.gov/nsa/ (accessed on 6 August 2018).
  29. Dahlberg, B.L.; Guettinger, R.C. The White-Tailed Deer in Wisconsin; Technical Wildlife Bulletin 14; Wisconsin Conservation Department: Madison, WI, USA, 1956; p. 282.
  30. Anderson, R.C.; Corbett, E.A.; Anderson, M.R.; Corbett, G.A.; Kelley, T.M. High White-Tailed Deer Density Has Negative Impact on Tallgrass Prairie Forbs. J. Torrey Bot. Soc. 2001, 128, 381–392. [Google Scholar] [CrossRef]
  31. McWilliams, W.H.; Westfall, J.A.; Brose, P.H.; Dey, D.C.; Hatfield, M.; Johnson, K.; Laustsen, K.M.; Lehman, S.L.; Morin, R.S.; Nelson, M.D.; et al. A Regeneration Indicator for Forest Inventory and Analysis: History, Sampling, Estimation, Analytics, and Potential Use in the Midwest and Northeast United States; Techinical Report NRS-148; USDA Forest Service General: Newtown Square, PA, USA, 2015; 74p.
  32. Wisconsin Department of Natural Resources Wiscland 2 Land Cover Data. Available online: ftp://dnrftp01.wi.gov/geodata/landcover/wiscland2/ (accessed on 10 April 2017).
  33. Larson, T.J.; Rongstad, O.J.; Terbilcox, F.W. Movement and Habitat Use of White-Tailed Deer in Southcentral Wisconsin. J. Wildl. Manag. 1978, 42, 113. [Google Scholar] [CrossRef]
  34. Strickler, G. Use of the Densiometer to Estimate Density of Forest Canopy on Permanent Sample Plots; USDA Forest Service Research Note 180: Portland, OR, USA, 1959; p. 5.
  35. USDA Forest Service. Forest Inventory and Analysis National Core Field Guide. Volume II: Field Data Collection Procedures for Phase 3 Plots. Version 5.1; U.S. Department of Agriculture Forest Service, Forest Inventory and Analysis Program: Washington, DC, USA, 2011; Section 25; p. 13.
  36. Marshall, P.L.; Davis, G.; LeMay, V.M. Using Line Intersect Sampling for Coarse Woody Debris; Techinical Report 003; British Columbia Forest Service: Nanaimo, BC, Canada, 2000; p. 37.
  37. Genuer, R.; Poggi, J.-M.; Tuleau-Malot, C. VSURF: An R Package for Variable Selection Using Random Forests. R J. 2015, 7, 19–33. [Google Scholar] [CrossRef] [Green Version]
  38. Bates, D.; Mächler, M.; Bolker, B.M.; Walker, S.C. Fitting Linear Mixed-Effects Models using lme4. J. Stat. Softw. 2015, 67. [Google Scholar] [CrossRef]
  39. Conover, M.R.; Kania, G.S. Annual variation in white-tailed deer damage in commercial nurseries. Agric. Ecosyst. Environ. 1995, 55, 213–217. [Google Scholar] [CrossRef]
  40. Van Deelen, T.R.; Campa, H., II; Hamady, M.; Haufler, J.B. Migration and Seasonal Range Dynamics of Deer Using Adjacent Deeryards in Northern Michigan. J. Wildl. Manag. 1998, 62, 205–213. [Google Scholar] [CrossRef]
  41. Sabine, D.L.; Morrison, S.F.; Whitlaw, H.A.; Ballard, W.B.; Forbes, G.J.; Bowman, J. Migration Behavior of White-Tailed Deer under Varying Winter Climate Regimes in New Brunswick. J. Wildl. Manag. 2002, 66, 718–728. [Google Scholar] [CrossRef]
  42. Verme, L.J.; Johnston, W.F. Regeneration of Northern White Cedar Deeryards in Upper Michigan. J. Wildl. Manag. 1986, 50, 307–313. [Google Scholar] [CrossRef]
  43. Johnston, W.F. Managers Handbook for Northern White-Cedar in the North Central States; Techinical Report NC-35; USDA Forest Service General: St. Paul, MN, USA, 1977; p. 18.
  44. Forester, J.D.; Anderson, D.P.; Turner, M.G. Landscape and Local Factors Affecting Northern White Cedar (Thuja Occidentalis) Recruitment in The Chequamegon-Nicolet National Forest, Wisconsin (U.S.A.). Am. Midl. Nat. 2008, 160, 438–453. [Google Scholar] [CrossRef]
  45. Nelson, T.C. A Reproduction Study of Northern White Cedar Including Results of Investigations under Federal Aid in Wildlife Restoration Project Michigan 49-R; Department of Conservation Game Division: Lansing, MI, USA, 1951; 100p.
  46. Kell, J. Soil-Site Influences on Northern White-Cedar (Thuja Occidentalis, L.) Stem Quality and Growth. Masters’s Thesis, University of Maine, Orono, ME, USA, 2009. [Google Scholar]
  47. Curtis, J.D. Preliminary Observations on Northern White Cedar in Maine. Ecology 1946, 27, 23–36. [Google Scholar] [CrossRef]
  48. Cornett, M.W.; Reich, P.B.; Puettmann, K.J. Canopy feedbacks and microtopography regulate conifer seedling distribution in two Minnesota conifer-deciduous forests. Ecoscience 1997, 4, 353–364. [Google Scholar] [CrossRef]
  49. Hofmeyer, P.V.; Kenefic, L.S.; Seymour, R.S. Historical Stem Development of Northern White-Cedar (Thuja occidentalis L.) in Maine. North. J. Appl. For. 2010, 27, 92–96. [Google Scholar]
  50. Herfindal, I.; Tremblay, J.-P.; Hester, A.J.; Lande, U.S.; Wam, H.K. Associational relationships at multiple spatial scales affect forest damage by moose. For. Ecol. Manag. 2015, 348, 97–107. [Google Scholar] [CrossRef] [Green Version]
  51. Kangas, L.C.; Schwartz, R.; Pennington, M.R.; Webster, C.R.; Chimner, R.A. Artificial microtopography and herbivory protection facilitates wetland tree (Thuja occidentalis L.) survival and growth in created wetlands. New For. 2016, 47, 73–86. [Google Scholar] [CrossRef]
  52. Scott, M.L.; Murphy, P.G. Regeneration Patterns of Northern White Cedar, an Old-Growth Forest Dominant. Am. Midl. Nat. 1987, 117, 10–16. [Google Scholar] [CrossRef]
  53. Cornett, M.W.; Puettmann, K.J.; Frelich, L.E.; Reich, P.B. Comparing the importance of seedbed and canopy type in the restoration of upland Thuja occidentalis forests of Northeastern Minnesota. Restor. Ecol. 2001, 9, 386–396. [Google Scholar] [CrossRef]
  54. Johnston, W.M. Balsam fir Dominant Species under Rethinned Northern White-Cedar; Research Note NC-133; USDA Forest Service North Central Forest Experiment Station: St. Paul, Minnesota, USA, 1972; p. 4.
Figure 1. Locations of 2016 Wisconsin white-cedar study sites (red) and basal area of white-cedar across the state [25].
Forests 10 00501 g001
Figure 2. White-cedar regeneration by height class at each study site. Letters indicate significant differences (p < 0.05) in stem densities among study sites using Tukey’s HSD. Error bars indicate one standard deviation. Saplings were 1.83 m tall to less than 10 cm dbh, large seedlings were 20 cm to <1.83 m tall, and small seedlings were less than 20 cm tall. Note that y-axes differ in each row.
Forests 10 00501 g002
Figure 3. White-regeneration in three height classes versus variables tested as model parameters in at least one model. Saplings were 1.83 m tall to less than 10 cm dbh, large seedlings were 20 cm to <1.83 m tall, and small seedlings were less than 20 cm tall. Note that y-axes differ in each row. In the first row, white-cedar regeneration is compared to regeneration of other woody species (trees and shrubs) in the same height class.
Forests 10 00501 g003
Figure 4. Estimated county-level deer density at each site [27] versus mean percent of palatable stems browsed at each site. Error bars indicate range of browse level across all plots in each site.
Forests 10 00501 g004
Table 1. Climate and stand conditions at five study site locations included in this work. Climate data are averages from 1981 to 2010 [26].
SiteAnnual Temperature (°C)Annual Precipitation (mm)Annual Snowfall (cm)Stand Basal Area (m2 ha−1)White-Cedar Basal Area (m2 ha−1)County Deer Density (deer km−2)
Iron4.481028133.632.02
Florence5.775017542.931.87
Langlade5.582015143.630.67
Marinette5.775018944.337.69
Marathon6.482015144.029.412
Table 2. List of potential predictor variables for stem density of white-cedar regeneration. Factors are defined as follows: CE = competitive environment, SS = seed source, Sbed = seedbed, Br = deer browse.
FactorSymbolDescription
CEOTHERSMSEEDStem density of small seedlings of other species (stems ha−1, <20 cm tall)
CEOTHERLGSEEDStem density of large seedlings of other species (stems ha−1, 0 cm ≤ height < 1.83 m)
CEOTHERSAPStem density of saplings of other species (stems ha−1, 1.83 m tall to <10 cm dbh)
CECANOPY_STHAStem density of all trees ≥ 10 cm dbh (stems ha−1)
CEBSLABasal area (m2 ha−1) of all trees ≥ 10 cm dbh
CEDENSIOMETERPercent canopy closure as measured with densiometer
CEGRAMPercent cover of plot by graminoids
CEFERNPercent cover of plot by ferns and fern allies
CEFORBPercent cover of plot by other forbs (not including ferns or graminoids)
CEMOSSPercent cover of plot by moss
CEVINEPercent cover of plot by woody vines
SSCEDAR_BABasal area (m2 ha−1) of all white-cedar ≥ 10 cm dbh
SSCEDAR_STHAStem density of all white-cedar ≥ 10 cm dbh (stems ha−1)
SbedVOL_CWDVolume of all coarse woody debris (m3 ha−1)
SbedVOL_CWD_CEDARVolume of white-cedar coarse woody debris (m3 ha−1)
SbedVOL_CWD_3PLUSVolume of coarse woody debris in decay classes 3–5 (m3 ha−1)
SbedWATERPercent of the subplot regularly covered by standing water
SbedL_LITTERPercent cover of subplots by undecomposed leaf litter
SbedLITTER_TYPEMain type of leaf litter on the plot: Deciduous, Conifer, Mixed
SbedLITTER_DEPTHMean depth of litter layer in centimeters
SbedCECSoil cation exchange capacity (cmol kg−1)
SbedCASoil calcium (ppm)
SbedpHSoil pH
SbedOMPercent organic matter in top 30 cm of soil
SbedPSoil phosphorus (ppm)
SbedKSoil potassium (ppm)
SbedMGSoil magnesium (ppm)
BrCTY_DEEREstimated deer population density (deer km−2) in county where stand occurs
BrBUFF_AG.GRASSTotal hectares of agricultural land and grassland in a 1.5 km buffer around the stand
BrDEER_BROWSECategorical browse assessment, percent of stems browsed on palatable species
Table 3. Comparison of models for white-cedar regeneration density by height class created using the predictors selected by VSURF; k is the number of parameters, AICc is Akaike information criterion corrected for small sample size, and ΔAICc is the difference in AICc from the model with the lowest value. This table includes the model with the lowest AICc, the null model that includes only random effects (site for saplings, plot nested within site for large and small seedlings), three models of deer effects, and the model selected with ΔAICc < 10.
Regeneration Height ClassModelModel Parameters (Fixed Effects)kAICcΔAICc
SaplingsLowest AICcCEDAR_STHA + CEC + CEDAR_STHA*CEC6218.62
NullIntercept only3235.1116.49
County deerCTY_DEER4236.9118.30
Habitat bufferBUFF_AG.GRASS4237.5618.95
Deer browseDEER_BROWSE4237.7519.13
Selected modelCEDAR_STHA4221.753.13
Large seedlingsLowest AICcBSLA + CEC + OTHERLGSEED + BSLA∙CEC + BSLA∙OTHERLGSEED + CEC∙OTHERLGSEED + BSLA∙CEC∙OTHERLGSEED111122.02
NullIntercept only41152.9130.89
County deerCTY_DEER51155.0833.06
Habitat bufferBUFF_AG.GRASS51148.5826.56
Deer browseDEER_BROWSE51150.0928.07
Selected modelOTHERLGSEED51128.316.29
Small seedlingsLowest AICcpH + OTHERSMSEED + CANOPY_STHA + OTHERSMSEED∙CANOPY_STHA81284.09
NullIntercept only41303.0818.99
County deerCTY_DEER51303.9319.84
Habitat bufferBUFF_AG.GRASS51305.2421.15
Deer browseDEER_BROWSE51305.1921.11
Selected modelpH + OTHERSMSEED61289.905.82
Table 4. Most parsimonious models predicting stem density of white-cedar regeneration by height class. Confidence intervals (CI) are two standard deviations. All models also included random effects for site (saplings) or plot nested within site (small and large seedlings). β = model coefficient, SE = standard error.
Response Variable (White-Cedar Density)Fixed EffectsβSELower CIUpper CIt Value
Saplings 1Intercept0.7183.023−5.3286.7650.238
CEDAR_STHA0.0100.0020.0060.0154.905
Large seedlings 1Intercept−2.4184.895−12.2087.373−0.494
OTHERLGSEED0.0004120.00007470.0002630.0005615.515
Small seedlings 1Intercept−151.1564.82−280.80−21.50−2.332
pH26.5610.595.3647.742.507
OTHERSMSEED0.0007060.0001580.0003910.0010224.480
1 In all models, the response variable was transformed with a square root transformation.

