Article

Impact of Water Holding Capacity and Moisture Content of Soil Substrates on the Moisture Content of Wood in Terrestrial Microcosms

by
Christian Brischke
* and
Friedrich L. Wegener
Wood Biology and Wood Products, University of Goettingen, Buesgenweg 4, D-37077 Goettingen, Germany
*
Author to whom correspondence should be addressed.
Forests 2019, 10(6), 485; https://doi.org/10.3390/f10060485
Submission received: 20 May 2019 / Revised: 27 May 2019 / Accepted: 30 May 2019 / Published: 4 June 2019
(This article belongs to the Special Issue Wood Protection and Preservation)

Abstract

:
Terrestrial microcosms (TMCs) are frequently used for testing the durability of wood and wood-based materials, as well as the protective effectiveness of wood preservatives. In contrary to experiments in soil ecology sciences, the experimental setup is usually rather simple. However, for service life prediction of wood exposed in ground, it is of imminent interest to better understand the different parameters defining the boundary conditions in TMCs. This study focused, therefore, on soil–wood–moisture interactions. Terrestrial microcosms were prepared from the same compost substrate with varying water holding capacities (WHCs) and soil moisture contents (MCsoil). Wood specimens were exposed to 48 TMCs with varying WHCs and MCsoil. The wood moisture content (MCwood) was studied as well as its distribution within the specimens. For this purpose, the compost substrate was mixed with sand and peat and its WHC was determined using two methods in comparison, i.e., the “droplet counting method” and the “cylinder sand bath method” in which the latter turned out advantageous over the other. The MCwood increased generally with rising MCsoil, but WHC was often negatively correlated with MCwood. The distance to water saturation Ssoil from which MCwood increased most intensively was found to be wood-species specific and might, therefore, require further consideration in soil-bed durability-testing and service life modelling of wood in soil contact.

1. Introduction

For determining the durability of wood or the protective effectiveness of wood preservatives against soft rot fungi and other soil-inhabiting micro-organisms, terrestrial microcosms (TMCs) can be used. For this purpose, natural top soil or a fertile loam-based horticultural soil should be used and various requirements need to be fulfilled with respect to the soil substrate.
It is well known that many parameters affect the decay activity of soils [1,2,3,4,5]. Therefore, it is recommended to consider more than one in-ground field test site for durability testing of wood and more than one soil substrate for laboratory studies using TMCs [2,6,7,8,9].
Consequently, for standardized test protocols several parameters are more or less strictly defined. For instance, according to the European standard CEN/TS 15083-2 [10], the following soil-related boundary conditions need to be assured:
  • pH 6–8
  • no added agrochemical
  • water holding capacity (WHC): 25–60%
  • natural soils: peat or top 50 mm removed and not taken from a depth below 200 mm
  • soil collected in moist conditions
  • soil passed through a sieve of nominal aperture size 12.5 mm
  • storage of soil prior to use only in closed moisture proof containers
  • thorough mixing of soil before use
  • horticultural soil which was sterilized during its preparation needs to be replenished with 20% natural soil
  • soil not used before
Finally, a moisture content of the soil (MCsoil) equivalent to 95% of its WHC is required and the TMC should be stored at 27 °C ± 2 °C and 70% ± 5% relative humidity (RH) during the whole period of exposure in a dark room.
A previous study by Wälchli [11] showed that MCwood decreased with both decreasing MCsoil and WHC as determined for two different soils and five different MCsoil. However, mass loss (ML) by decay of untreated and differently copper–chromium–boron (CCB)-treated Scots pine sapwood was neither correlated with MCwood nor with MCsoil. Similarly, Mieß [12] found an increase in MCwood with rising MCsoil in three different soil types and for different untreated and modified timbers. Furthermore, she found a gradient of MCwood in untreated wood from the highest MCwood in the bottom part and lowest MCsoil in the top part of the buried test stakes. In contrast, a remarkable 20% of the Scots pine sapwood specimens showed the highest MCwood in the top or central part of the specimens. Mieß [12] suggested that the MCwood gradients were the consequence of vertical gradients of MCsoil, which were differently severe due to the different soil wetting and re-drying regimes. It is further likely that the gradients were the consequence of ML gradients along the stake-shaped specimens, because the MCwood of the different specimen segments had been determined not before the end of the test after 17 weeks of incubation when significant ML had already occurred.
Gray [13] performed durability tests in TMCs using different soils at different MCsoil and found that the highest ML occurred at an MCsoil between 108% and 148% of the WHC of the respective soil. The highest MCwood after harvesting was found at an MCsoil between 120% and 218% of its WHC referring to an MCsoil at approximately 40% in all soil types used. Thus, ML increased with increasing MCsoil, but found an optimum, which was, however, far beyond the recommended 95% WHC. Again, MCwood data are needed to obtain a set perspective, since they refer to the different severely decayed specimens after harvesting.
In summary, it becomes evident that both WHC and MCsoil influence MCwood and ML through fungal decay, and do seemingly interact. Clear relationships between the three moisture-related parameters have not yet been established.
Others [6,12,14,15] previously demonstrated that all three rot types, i.e., brown, white, and soft rot, occur in TMCs complemented by tunneling, erosion, and cavity bacteria. However, neither MCwood nor MCsoil seemed to limit their occurrence. Solely, soft rot apparently copes better with very high moisture contents, which are not favorable for brown and white rot fungi. Nevertheless, soft rot fungi can degrade wood in a rather large moisture range. They are early colonizers, so-called “ruderal organisms” [16], which, in contrast to basidiomycetes (‘combative organisms’), are rarely able to take over a substrate [17].
The WHC of soil substrates can vary remarkably, and therefore, it needs to be determined before each test. In both standards, CEN/TS 15083–2 [10] as well as ENV 807 [18], a suitable method for determining the WHC of soil is described: the so-called “droplet counting method”. The method is based on determining the ability of a sample of a test substrate to retain water against the pull of a vacuum pump, as a measure of its WHC. However, the method is rather laborious and time consuming. Furthermore, the standards lack a definition of the vacuum that needs to be applied, wherefore one might question the reproducibility of the test results.
Within this study, we conducted comparative WHC measurements on a series of different mixtures of compost and silica sand using the “droplet counting method” and an alternative method according to ISO 11268-2 [19], where wet soil samples are allowed to drain on a sand bath. Based on this comparison of methods, TMCs should be prepared representing soil substrates of varying WHCs and MCsoil. The overall objective of this study was to establish relationships between WHC, MCsoil, and the resulting MCwood of different wood species after exposure in the TMC.

2. Materials and Methods

2.1. Soil Substrates

Three soil substrates were used to prepare TMCs of defined water holding capacities (WHCs). The basis substrate was a compost produced by the University of Goettingen from horticultural waste (i.e., leaf litter, grass, cut softwoods, and hardwoods, sand). To lower its WHC, silica sand (grain size > 0.2 mm) was added; to increase its WHC, peat (moderately-to-severely decomposed high-moor peat (H3–H8), total nitrogen 0.35%, magnesium 0.15%, organic substance 30%) was added. Both peat and compost were passed through a sieve of a nominal aperture size 8.5 mm. The soil moisture content (MCsoil) and the WHC were determined according to the “droplet counting method” and the “cylinder sand bath method”.

2.2. Determination of the soil Moisture Content (MCsoil)

Soil samples of 7–64 g (depending on the soil density) were taken for determining the soil moisture content (MCsoil). Three replicate samples were taken, weighed to the nearest 0.01 g, oven-dried at 103 °C, and weighed again. MCsoil was calculated as follows:
MC soil = m soil ,   wet m soil , 0 m soil , 0 × 100   [ % ]
where MCsoil is the soil moisture content, in %; msoil,wet is the wet soil mass, in g; msoil,0 is the oven-dry soil mass, in g.

2.3. Determination of the Water Holding Capacity (WHC) of Soil

2.3.1. “Droplet Counting Method”

A small quantity of water was added to soil samples of 200 g, the substrate was mixed well, and the operation was repeated until the soil particles stuck to another (crumb structure). Further, 25 mL water were added, mixed well, and allowed to stand for 2 h. A coarse filter paper was placed in the bottom of a Buchner funnel (100 mm diameter) and moistened to seal the filter paper to the funnel. The prepared test sample was transferred into the funnel and spread evenly. The bottom of the Buchner funnel was covered by soil substrate to a height of at least 10 mm. Suction was applied using a vacuum pump until no more than five drops of water per minute were being withdrawn from the sample, increasing the suction slowly to avoid perforation of the filter paper. The sample was transferred to an aluminum container of known mass and weighed. The container was oven-dried at 103 °C ± 2 °C and weighed again. The WHC of n = 5 peat samples and n = 3 sand and compost samples was determined and calculated as follows:
W H C = m soil ,   saturated m soil , 0 m soil , 0 × 100   [ % ]
where WHC is the water holding capacity, in %; msoil,saturated is the soil mass at saturation, in g; msoil,0 is the oven-dry soil mass, in g.

2.3.2. “Cylinder Sand Bath Method”

Soil was inserted into polyethylene cylinders with 4 cm diameters. The bottoms of the cylinders were covered with a fine polymer grid and filter paper (MN 640 W 70 mm). All cylinders were placed in a vat for 3 h, which was filled with water to a height 1 cm above the soil filling height of 7 cm. After soaking the soil in water, the cylinders were placed on a water-saturated sand bath for 2 h to allow the unbound water to drain. The soil samples were then weighed wet, oven-dried at 103 °C ± 2 °C, and the WHC of the soil was calculated according to Equation (2) analogously to the “droplet counting method”.

2.4. Preparation of Mixed Soil Substrates

For a comparison of the “Droplet counting method” and the “cylinder sand bath method” and for establishing a regression between mixing ratios of the different soil substrates and their resulting WHC, a total of 22 soil substrate mixtures were prepared as summarized in Table 1.
For preparing mixed soil substrates, the following equation was used:
m s o i l   x , t a r g e t ,   w e t = m t a r g e t ,   t o t a l ,   0 × ( a t a r g e t , 0 100 ) × ( 100 100 M C s o i l   x )   ( g )
where msoil x,target, wet is the target mass of the wet substrate x, in g; mtarget, total, 0 is the target oven-dry mass of the total mix, in g; atarget,0 is the target percentage of substrate x based on the oven-dry mass, in %. MCsoil x, is the soil moisture content of substrate x, in %.

2.5. Terrestrial Microcosms (TMCs)

Miniature terrestrial microcosms were prepared in polypropylene containers of 110 (height) × 110 × 80 mm3 and a volume of 500 mL. In total, 48 different substrates were filled in the containers each to a height of 100 mm. The combinations of the parameters WHC and MCsoil are summarized in Table 2, where the latter is expressed as (%WHC). The containers were weighed to the nearest 0.01 g, closed with a lid, and their total mass maintained over a period of three weeks.
The WHC of the substrates used for TMCs were determined exclusively according to ISO 11268-2 [19]. The basic substrate was compost. Silica sand and peat were added according to the regression obtained by comparative WHC measurements as described in Section 2.4 (Figure 1).
The following regression functions were used (see also Section 3.1):
W H C m i x : c o m p o s t - s a n d = 0.586 × a t a r g e t ,   s a n d ,   0 + 80.81   ( % )
W H C m i x : c o m p o s t - t u r f = 2.499 × a t a r g e t ,   t u r f ,   0 + 87.15   ( % )
where WHCmix:compost-sand is the water holding capacity of compost mixed with silica sand, in %; WHCmix:compost-peat is the water holding capacity of compost mixed with peat, in %; atarget, sand, 0 is the target percentage of sand based on the oven-dry mass, in %; atarget, peat, 0 is the target percentage of peat based on the oven-dry mass, in %.
The soil mixtures used for the TMCs are summarized in Table 3.

2.6. Preparation and Exposure of Wood Specimens

Specimens of 5 × 10 × 100 (ax.) mm3 were prepared from Scots pine sapwood (Pinus sylvestris L.), Douglas fir heartwood (Pseudotsuga menziesii Franco), English oak heartwood (Quercus robur L.), and European beech (Fagus sylvatica L.). All specimens were free from defects such as cracks, decay, and discoloration. For each of the 48 combinations of WHC and MCsoil, n = 5 replicate specimens of each species were prepared, which corresponded to a total of 960 specimens.
In total, 48 soil substrates, i.e., combinations of WHC and MCsoil, were prepared and each was used to fill two containers (miniature TMCs). Wood specimens were conditioned at 20 °C/65% RH until constant mass before soil exposure. Afterwards, ten wood specimens were buried to 4/5 of their length in each container and exposed for three weeks. The MCsoil was maintained by adding water about every third day if needed.

2.7. Determination of the Wood Moisture Content (MCwood)

Specimens from selected TMCs were used to determine the MCwood distribution within the specimens. Therefore, after harvest, the specimens were cleaned from adhering soil particles, cut into five segments of 20 mm length using ratchet scissors, weighed, dried, and weighed again in each step separately. Segment-wise MCwood was determined on specimens after exposure in TMC with substrates of 30, 60, and 90% WHC, and a MCsoil of 30, 75, and 95% of its WHC.
MC wood = m wood ,   wet m wood ,   0 m wood , 0 × 100   ( % )
where MCwood is the wood moisture content, in %; mwood,wet is the wet mass of the wood specimen, in g; mwood,0 is the oven-dry wood mass, in g.

2.8. Statistical Analysis

Regression functions between different variables were established using the method of least squares to achieve the best fit. Statistical differences between collectives were considered significant at a probability of error less than 5% according to a modified Student t-test (Welch test).

3. Results and Discussion

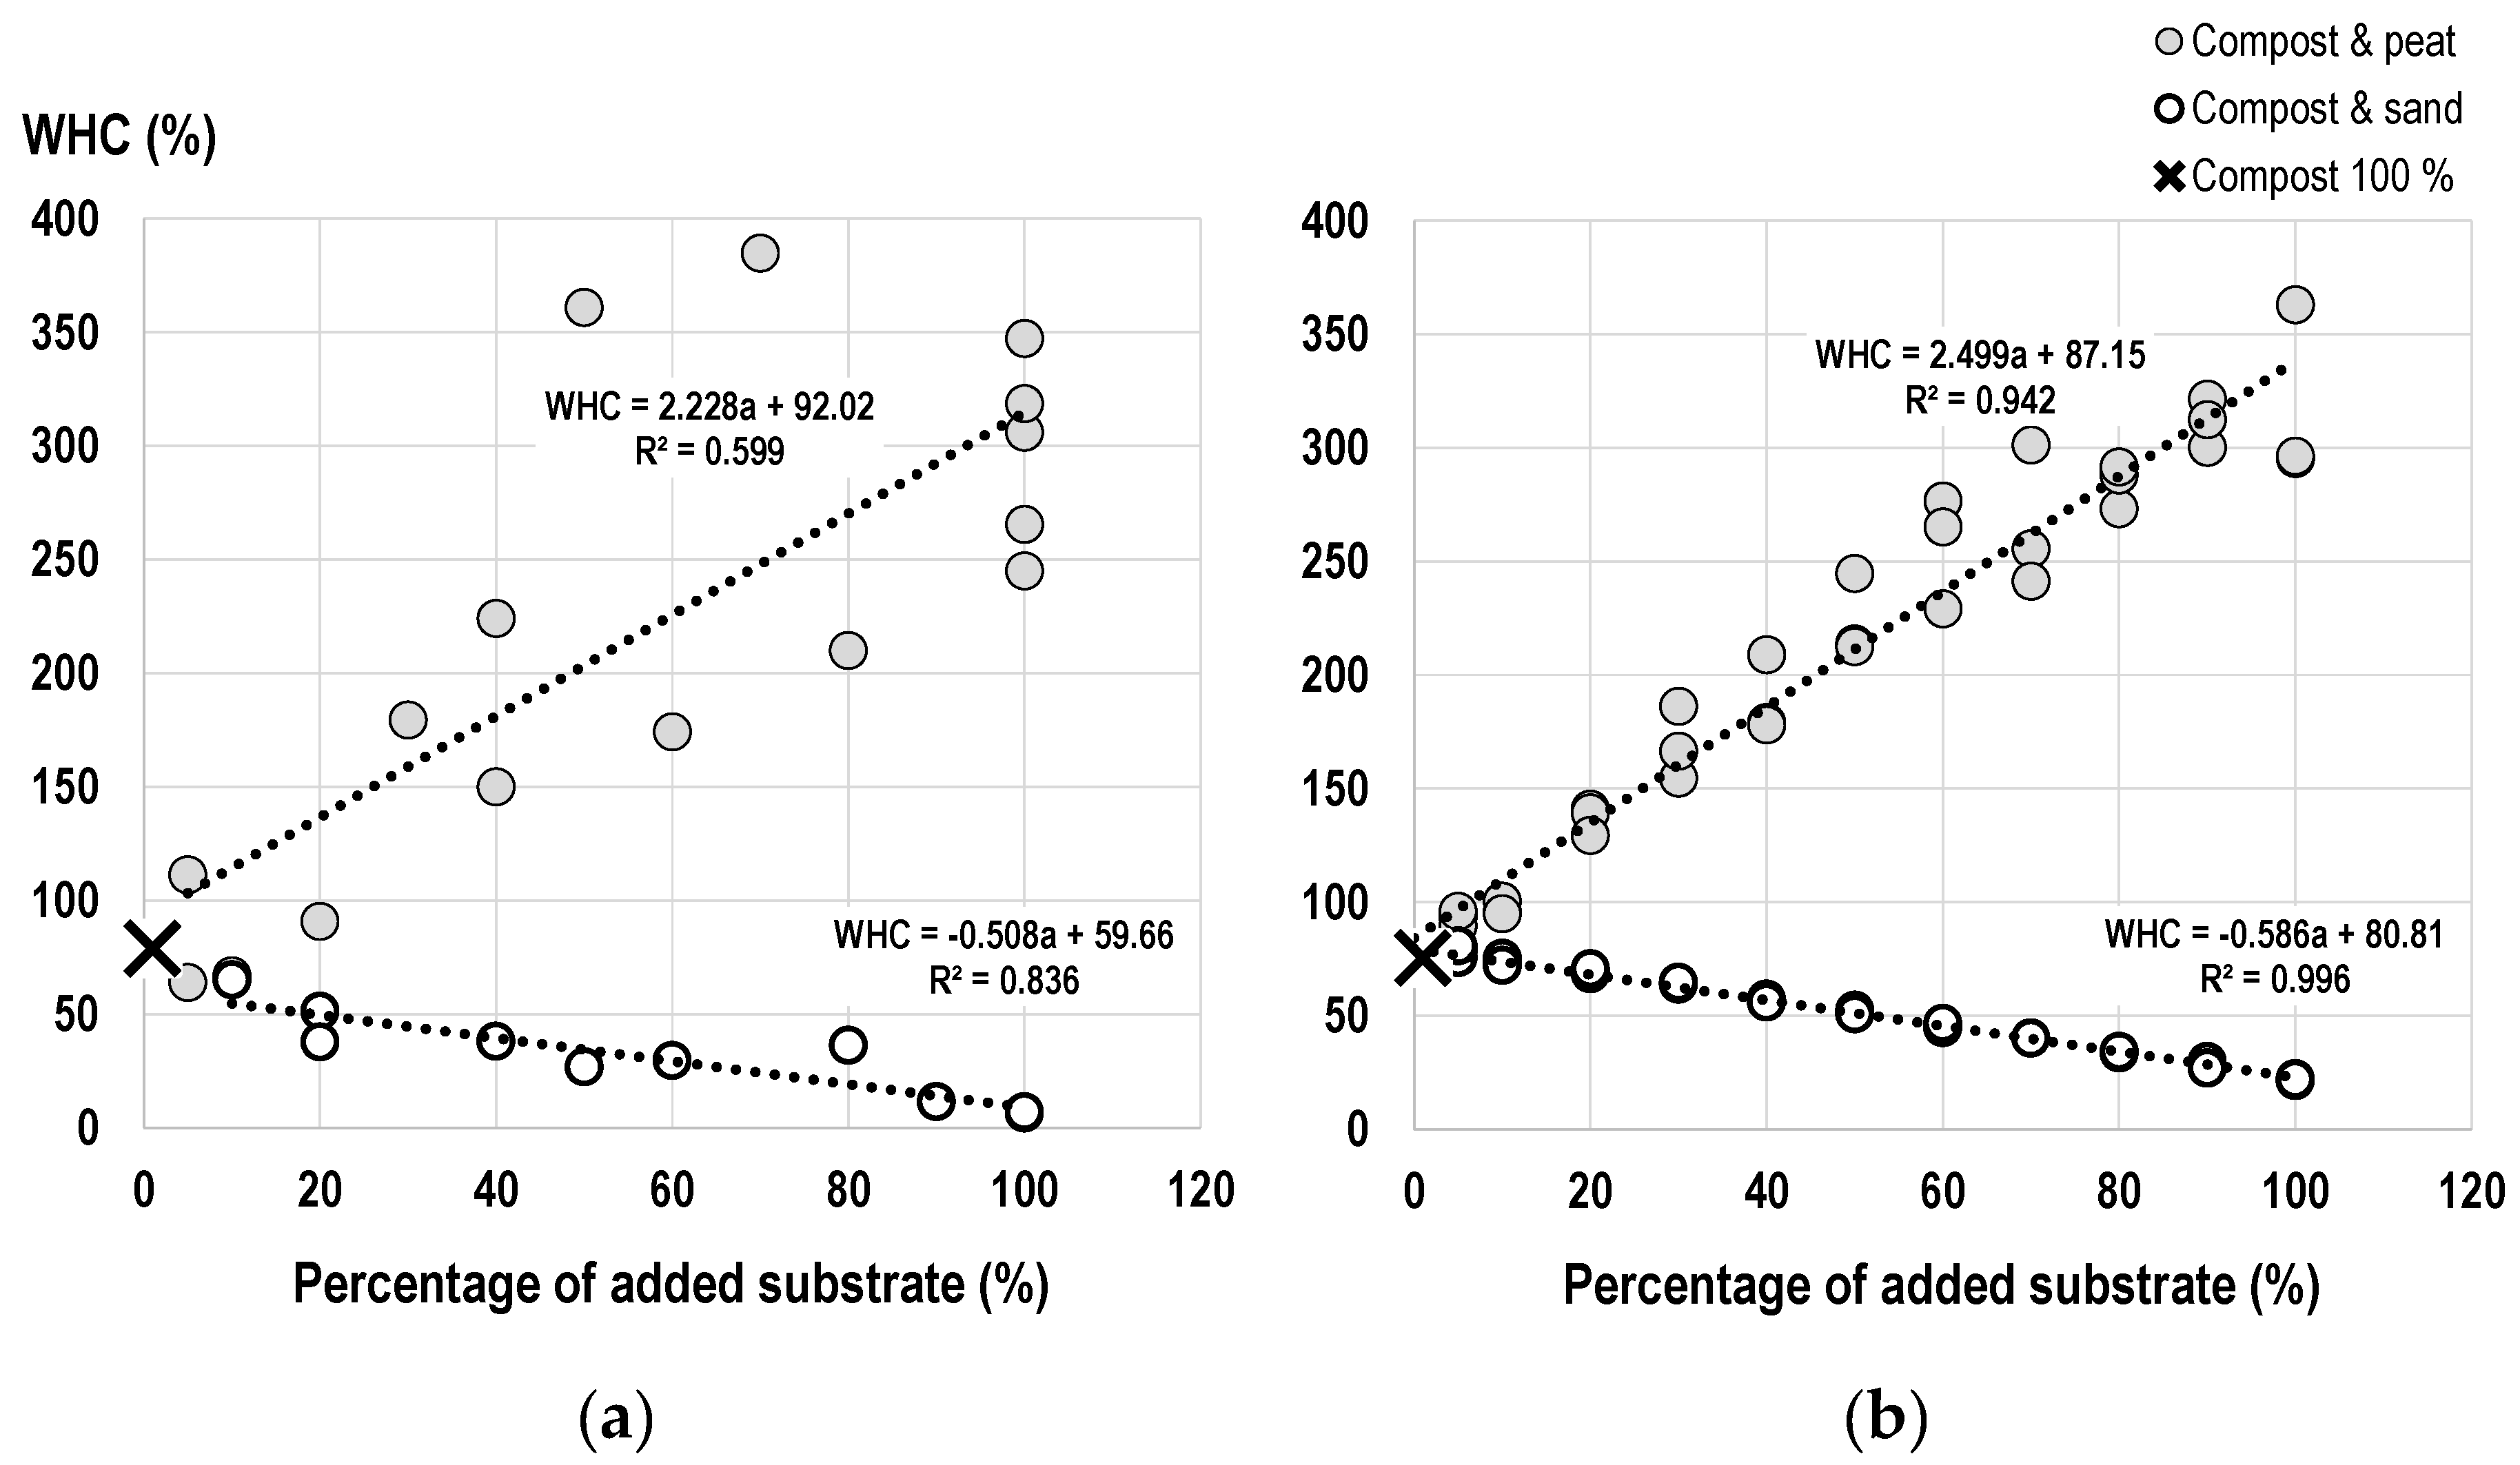
3.1. Water Holding Capacity (WHC) of Soil Mixtures

The WHC of the three initial substrates was highest for peat, followed by compost and sand according to both methods applied (Table 4).
According to both methods, the WHC of the different soil mixtures was linearly correlated with the percentage of added sand or peat, respectively. With increasing percentage of sand and decreasing percentage of peat, the WHC decreased (Figure 1).
It became evident that: (1) single WHC values scattered more and (2) the regression between substrate ratios and WHC was less pronounced when using the “droplet counting method”. Furthermore, the following advantages of the “cylinder sand bath method” over the “droplet counting method” became apparent:
  • Less time consumption: 7 min/sample compared to more than 60 min/sample using the “droplet counting method”.
  • Consistency of the test setup: Time for counting droplets varied between 6 and 60 min/sample. Intervals between single droplets varied partly drastically, especially when testing substrates of high WHC. In contrast, up to several hundred cylinders can be used in parallel and the duration of test was always constant.
  • Clear description of setup: Simple, less expensive, and well described setup. In contrast, the description of the “droplet counting method” suffers from some vagueness: size of Buchner funnel, applied vacuum, and type of filter paper are not specified, but likely affect the test results.
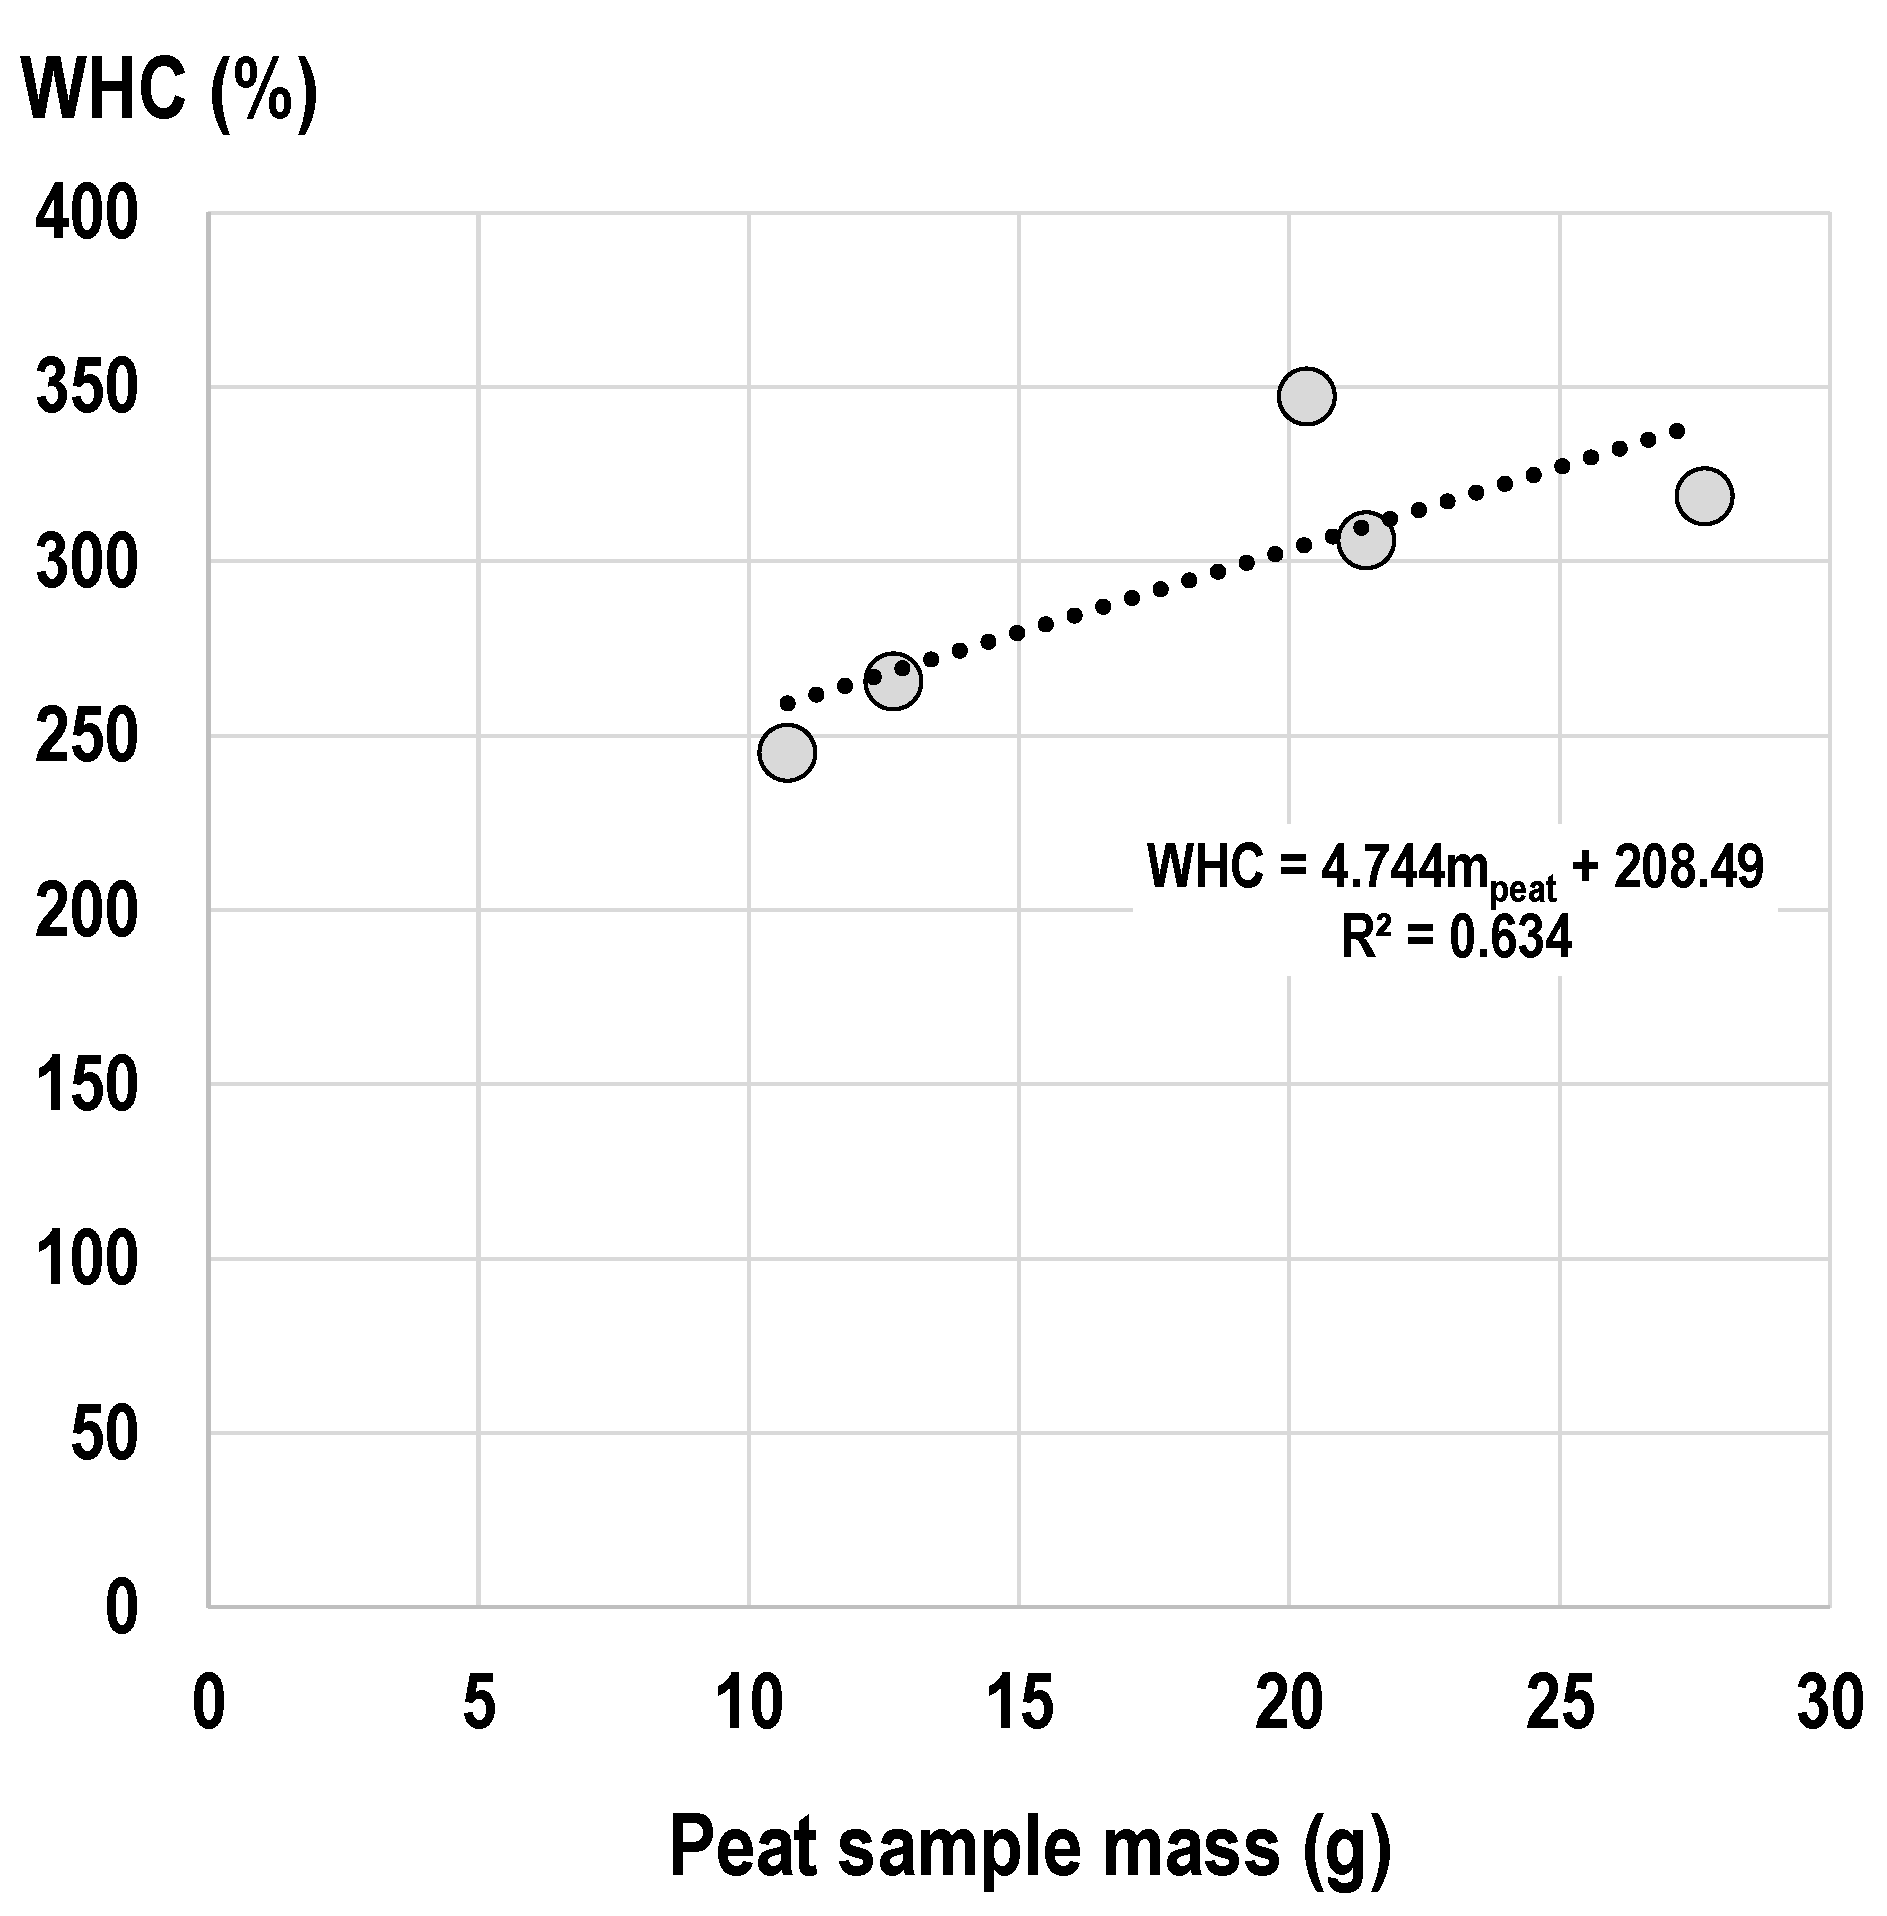
  • Independency from sample size and volume: In contrast, the given sample thickness according to the “droplet counting method” led to strongly varying mass of the soil sample in the Buchner funnel and affected the WHC, as shown for peat in Figure 2. With increasing sample size (= sample mass) the WHC increased.
Generally, it was observed that substrates with very high WHC, such as peat, require longer wetting periods than specified by the standards, i.e., 1–2 h according to CEN/TS 15083-2 [10] and 3 h according to ISO 11268-2 [19]. After 3 h of submersion, the peat was still not fully water saturated when oven-dried before, which consequently led to an underestimation of its WHC.
The WHC determined according to both methods were highly correlated, especially for WHC below 200%, as shown in Figure 3. Therefore, and regarding its numerous advantages, in the following, all WHC measurements were conducted using the “cylinder sand bath method”.

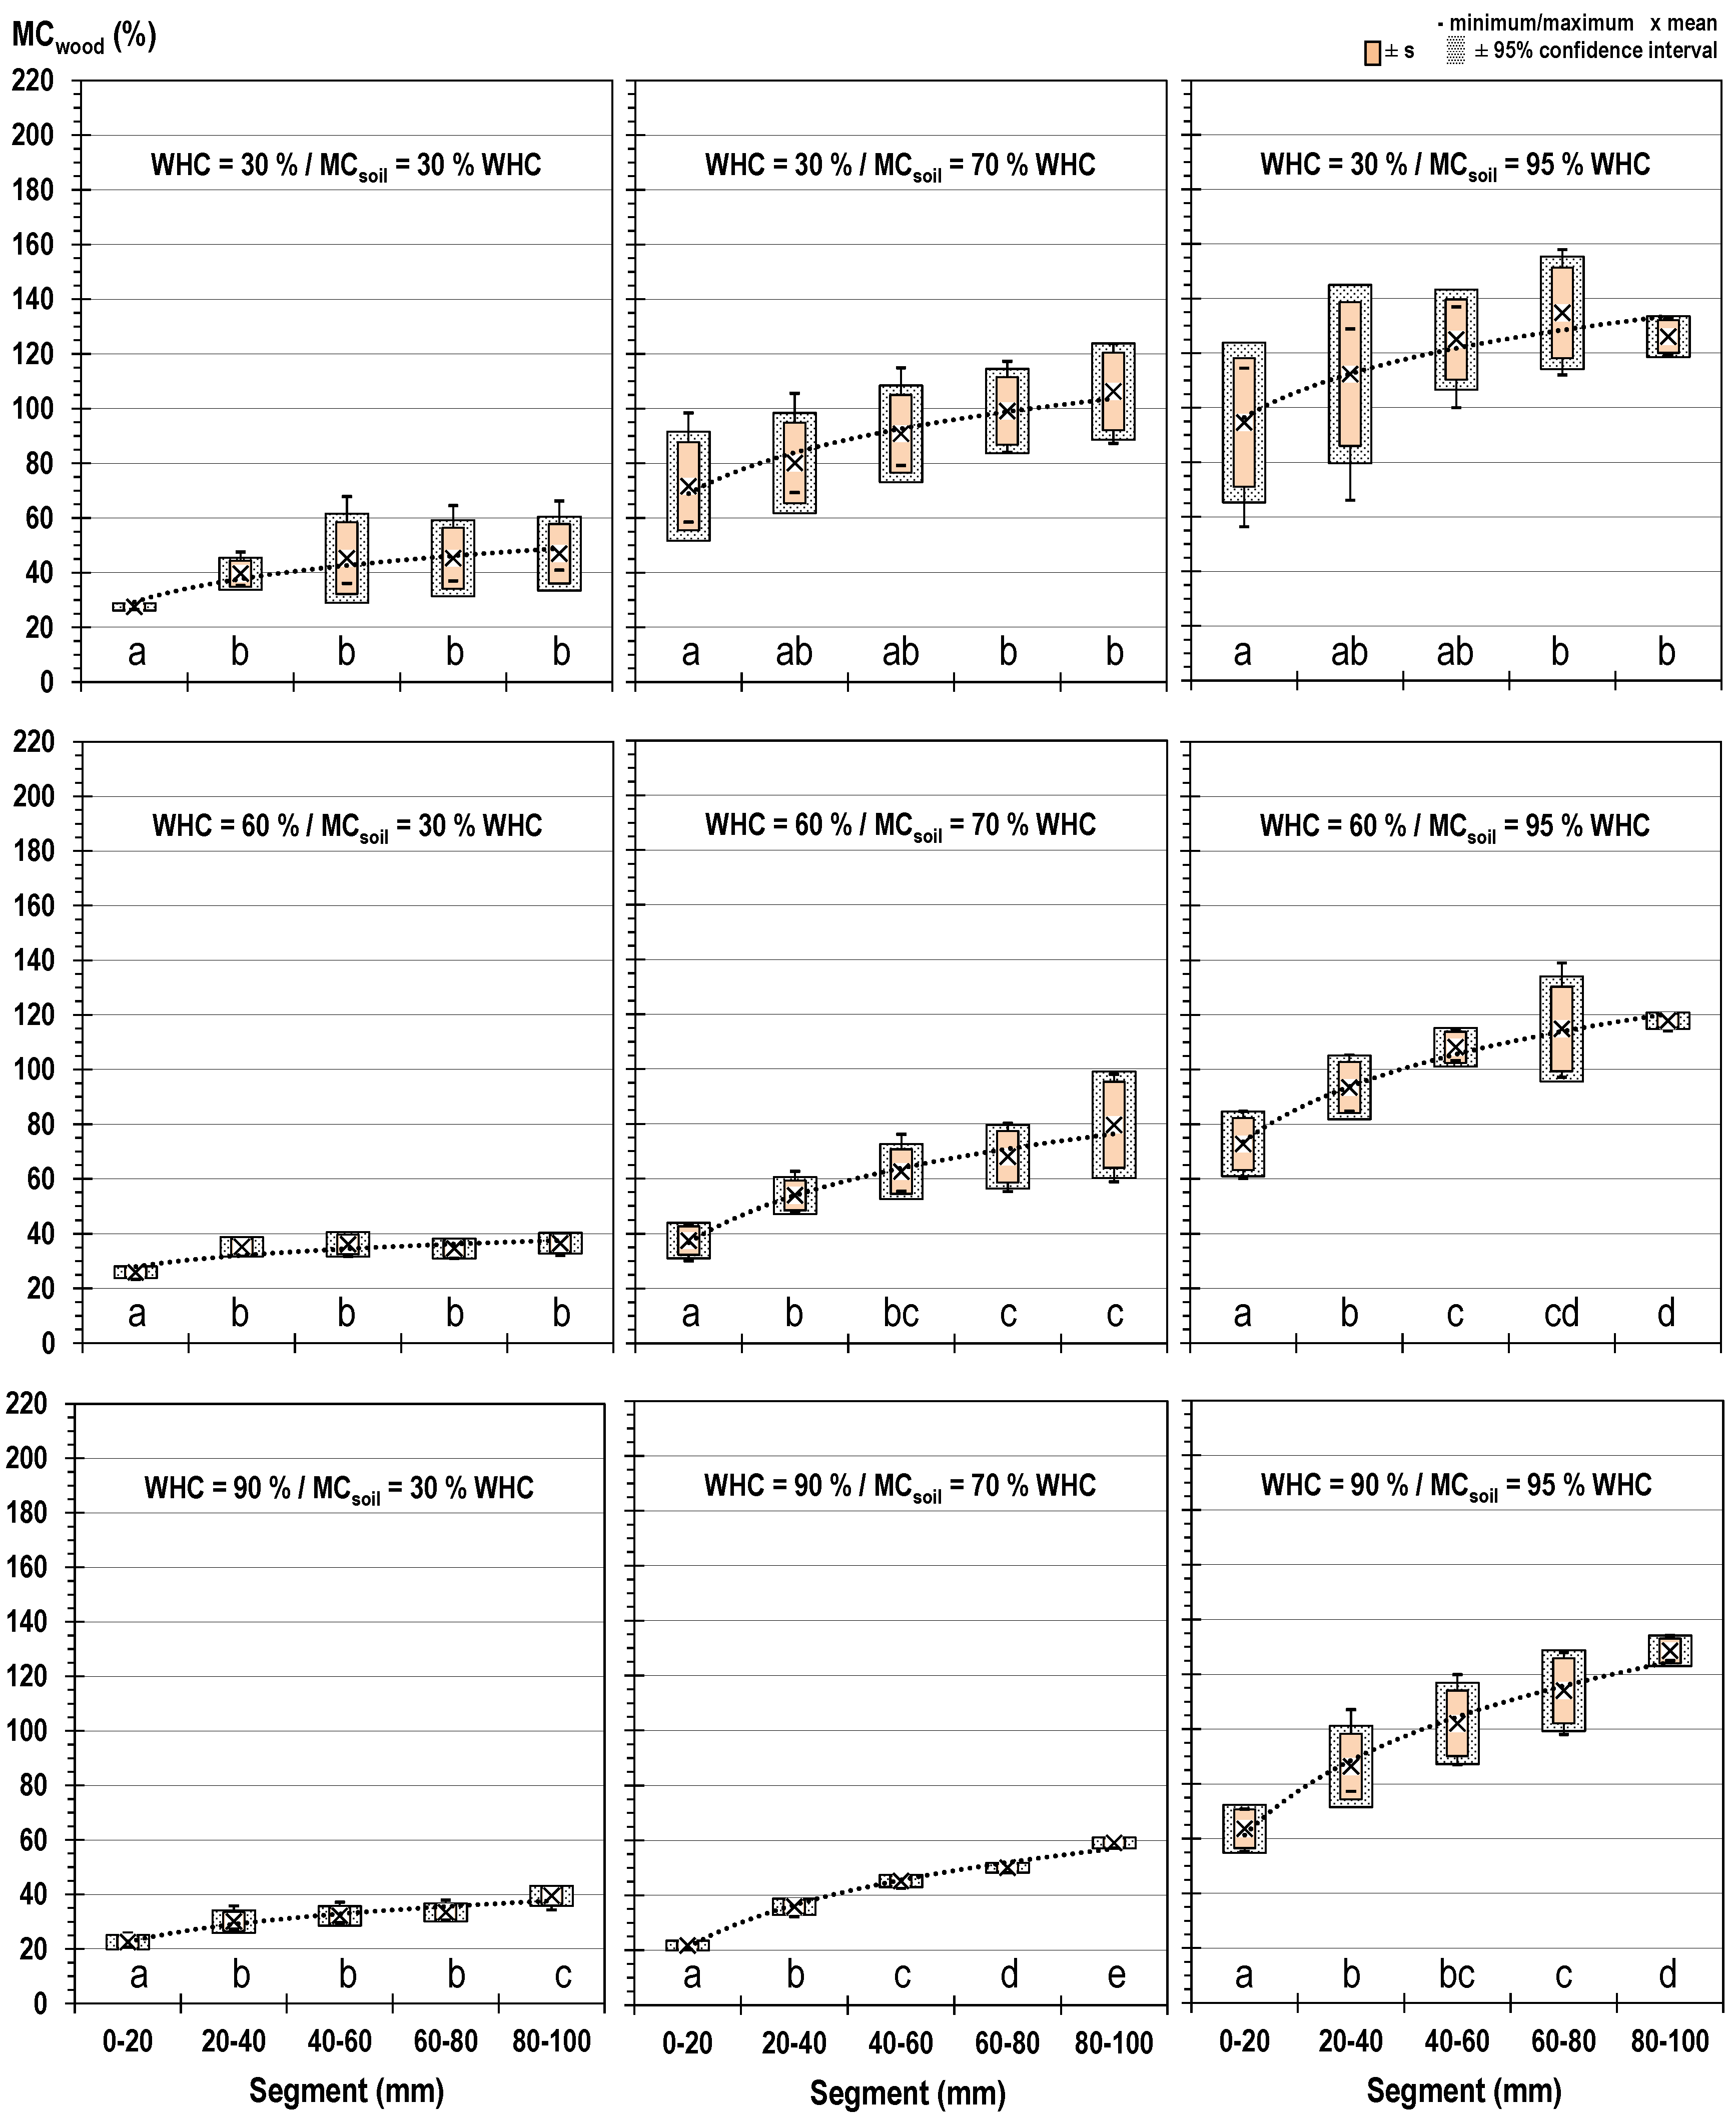
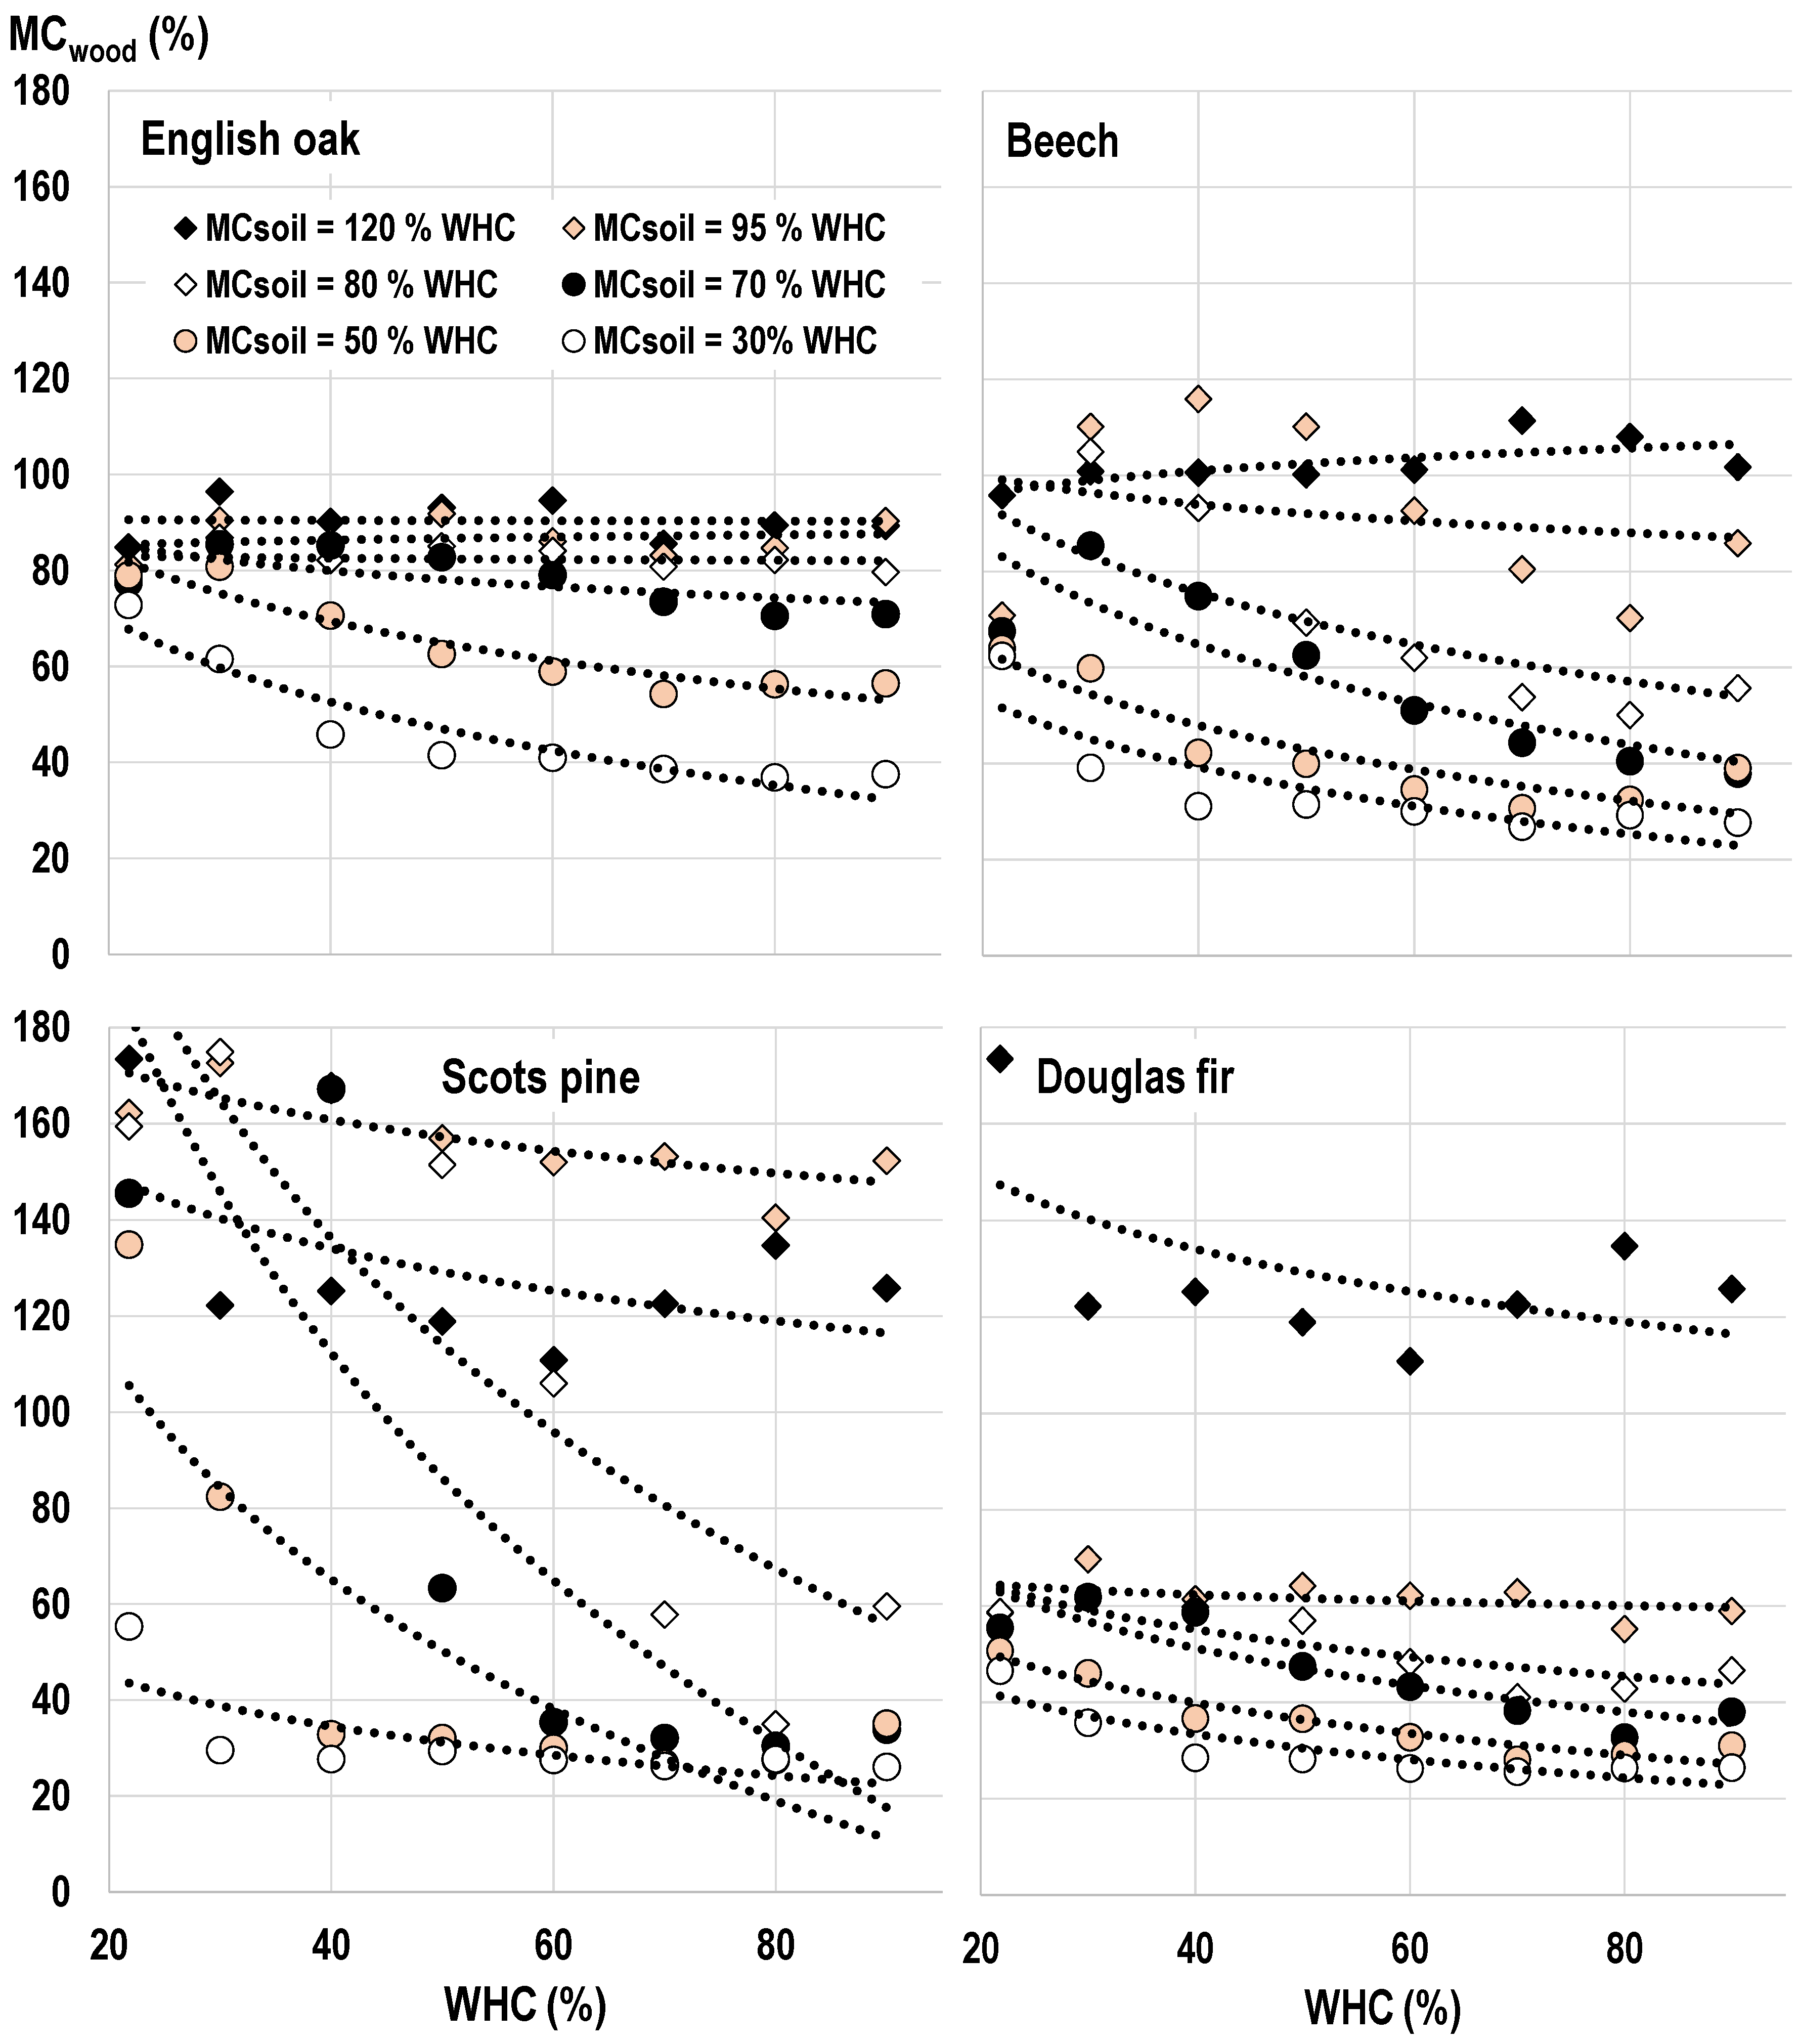
3.2. Impact of WHC and MCsoil on the Moisture Content of Wood (MCwood) Exposed in TMCs

After three weeks of exposure in different TMCs, the average MCwood was highest in Scots pine sapwood (88%), followed by English oak (75%), Beech (67%), and Douglas fir (48%). In general, MCwood increased with increasing MCsoil, but was strongly dependent on the WHC of the soil. The lower the WHC, the higher was the MCwood at a given MCsoil, which coincided with previous findings [12]. Lower WHC in this study corresponded with a higher percentages of silica sand, which can only physically absorb water in contrast to organic soil substrates such as compost soil and peat, which also form chemical bonds with water [20]. The capacity to bind water is therefore higher in organic substrates which restricts the amount of available water which potentially wets the wood specimens.
This effect became especially prominent when considering MCsoil as a percentage of the WHC of the soil as illustrated in Figure 4. The lower MCsoil (%WHC), the lower the MCwood was at a given WHC of the substrate in the TMCs. However, it also became apparent that the effect of MCsoil became more pronounced at higher WHCs, i.e., the range of MCwood between 30% and 120% MCsoil expressed as percentage of its WHC was higher by up 2 factors in substrates of high WHC (120%) compared to those with very low WHC (30%).
The difference between MCwood results achieved after three weeks of in-soil exposure was surprisingly small between Beech and English oak heartwood, because the latter is known to take up water more slowly due to the formation of tyloses in the vessels. In contrast, Beech wood—apart from false heartwood which was excluded in this study— usually takes up liquid water very easy, although its vessel diameters are much smaller compared to the early wood vessels of English oak. Similarly, the maximum MCwood of Douglas fir heartwood was in the same range of that of Scots pine sapwood when exposed in soil at an MCsoil of 120% WHC. Solely, at a lower MCsoil, the more permeable Scots pine sapwood showed higher MCwood compared to the refractory heartwood of Douglas fir. In summary, it became evident that already after a short exposure period of three weeks in wet soil, wood anatomy-induced differences in moisture uptake diminished confirming previous findings [12].
To further illustrate the interdependency between WHC and MCsoil and their effect on MCwood, the distance to water saturation of the soil substrate (Ssoil) was determined according to Equation (7) and correlated with MCwood (Figure 5).
S s o i l = MC soil WHC   ( % points )
where Ssoil is the distance to water saturation of the soil substrate, in %-points; MCsoil is the soil moisture content, in %; WHC is the water holding capacity, in %.
Generally, with increasing Ssoil, the MCwood increased as well, but followed wood species-specific curves with differently steep increases and a plateau at Ssoil = 0%, i.e., soil water saturation. For English oak, Beech, and Douglas fir, the MCwood stayed approximately constant at Ssoil > 0%. Solely, for Scots pine sapwood, MCwood dropped significantly after exceeding the saturation point, although unlimited uptake of liquid water was expected to be provided above this threshold.
The distance to water saturation from which MCwood remarkably rose differed also between wood species and was approximately at −55%-points for English oak, −25%-points for Beech and Douglas fir, and −20%-points for Scots pine sapwood. Scots pine sapwood showed also by far the highest increase in MCwood with increasing Ssoil, i.e., between 32% and up to 180% MCwood between −20 and 0% Ssoil.

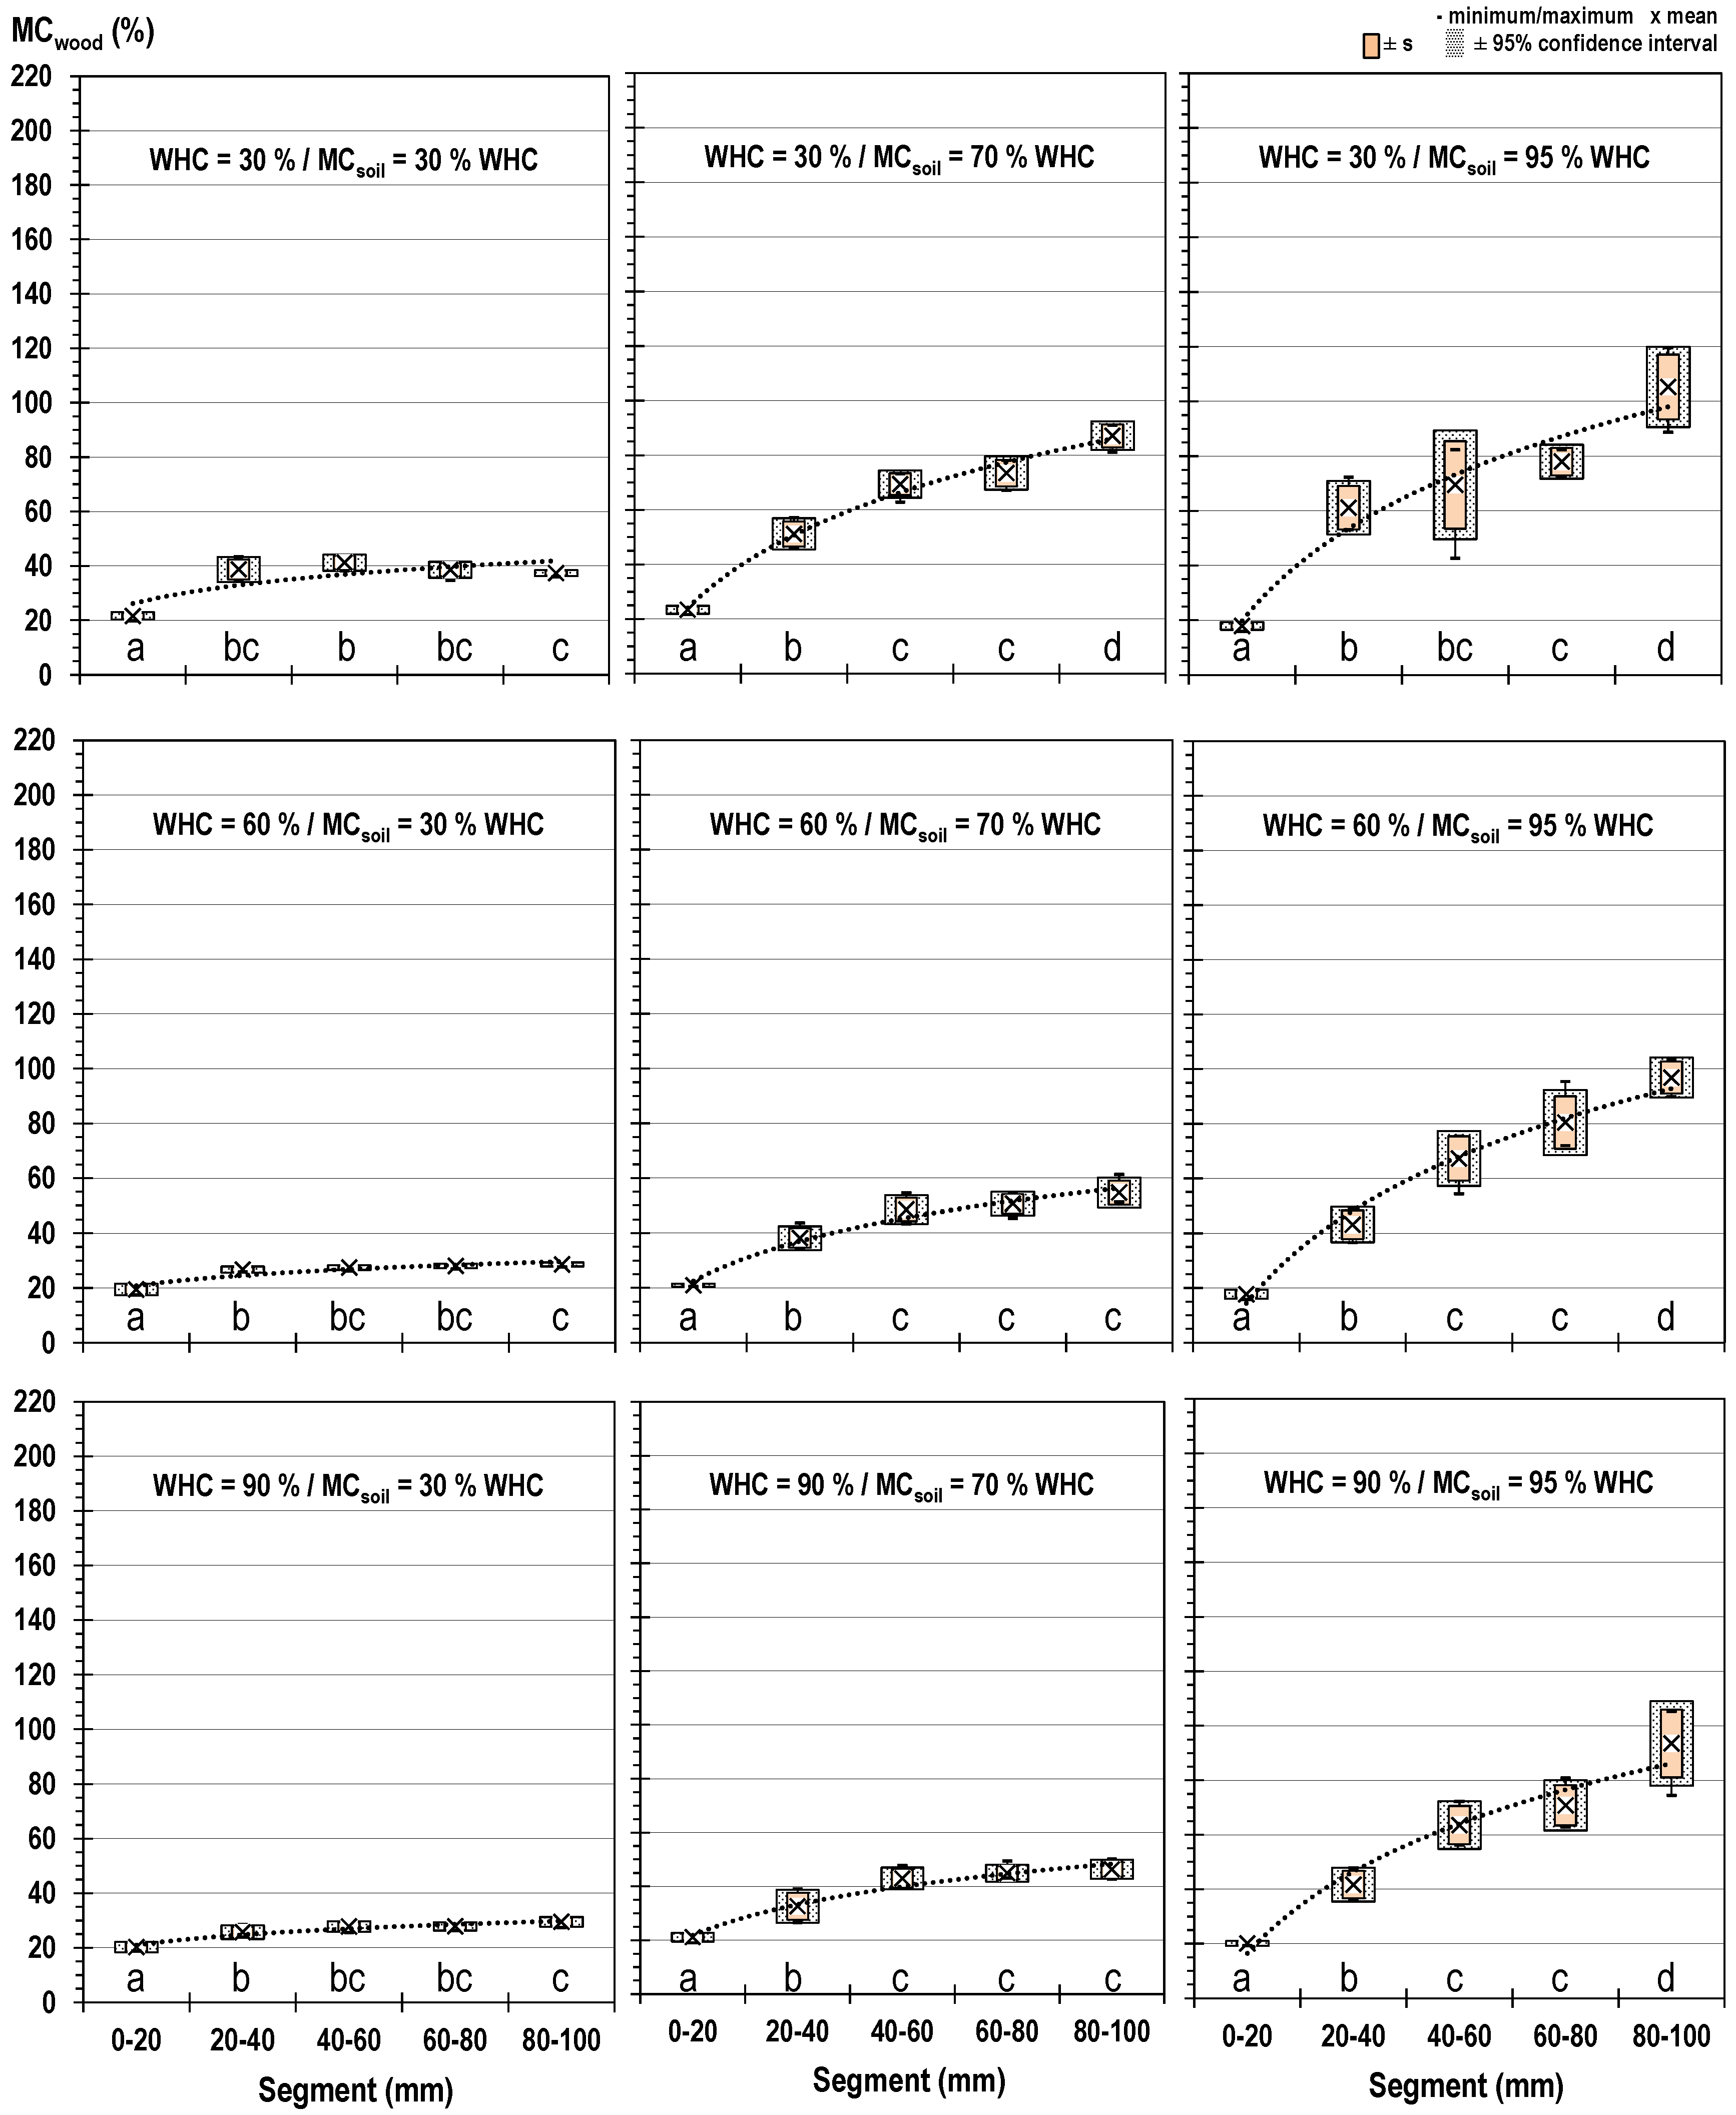
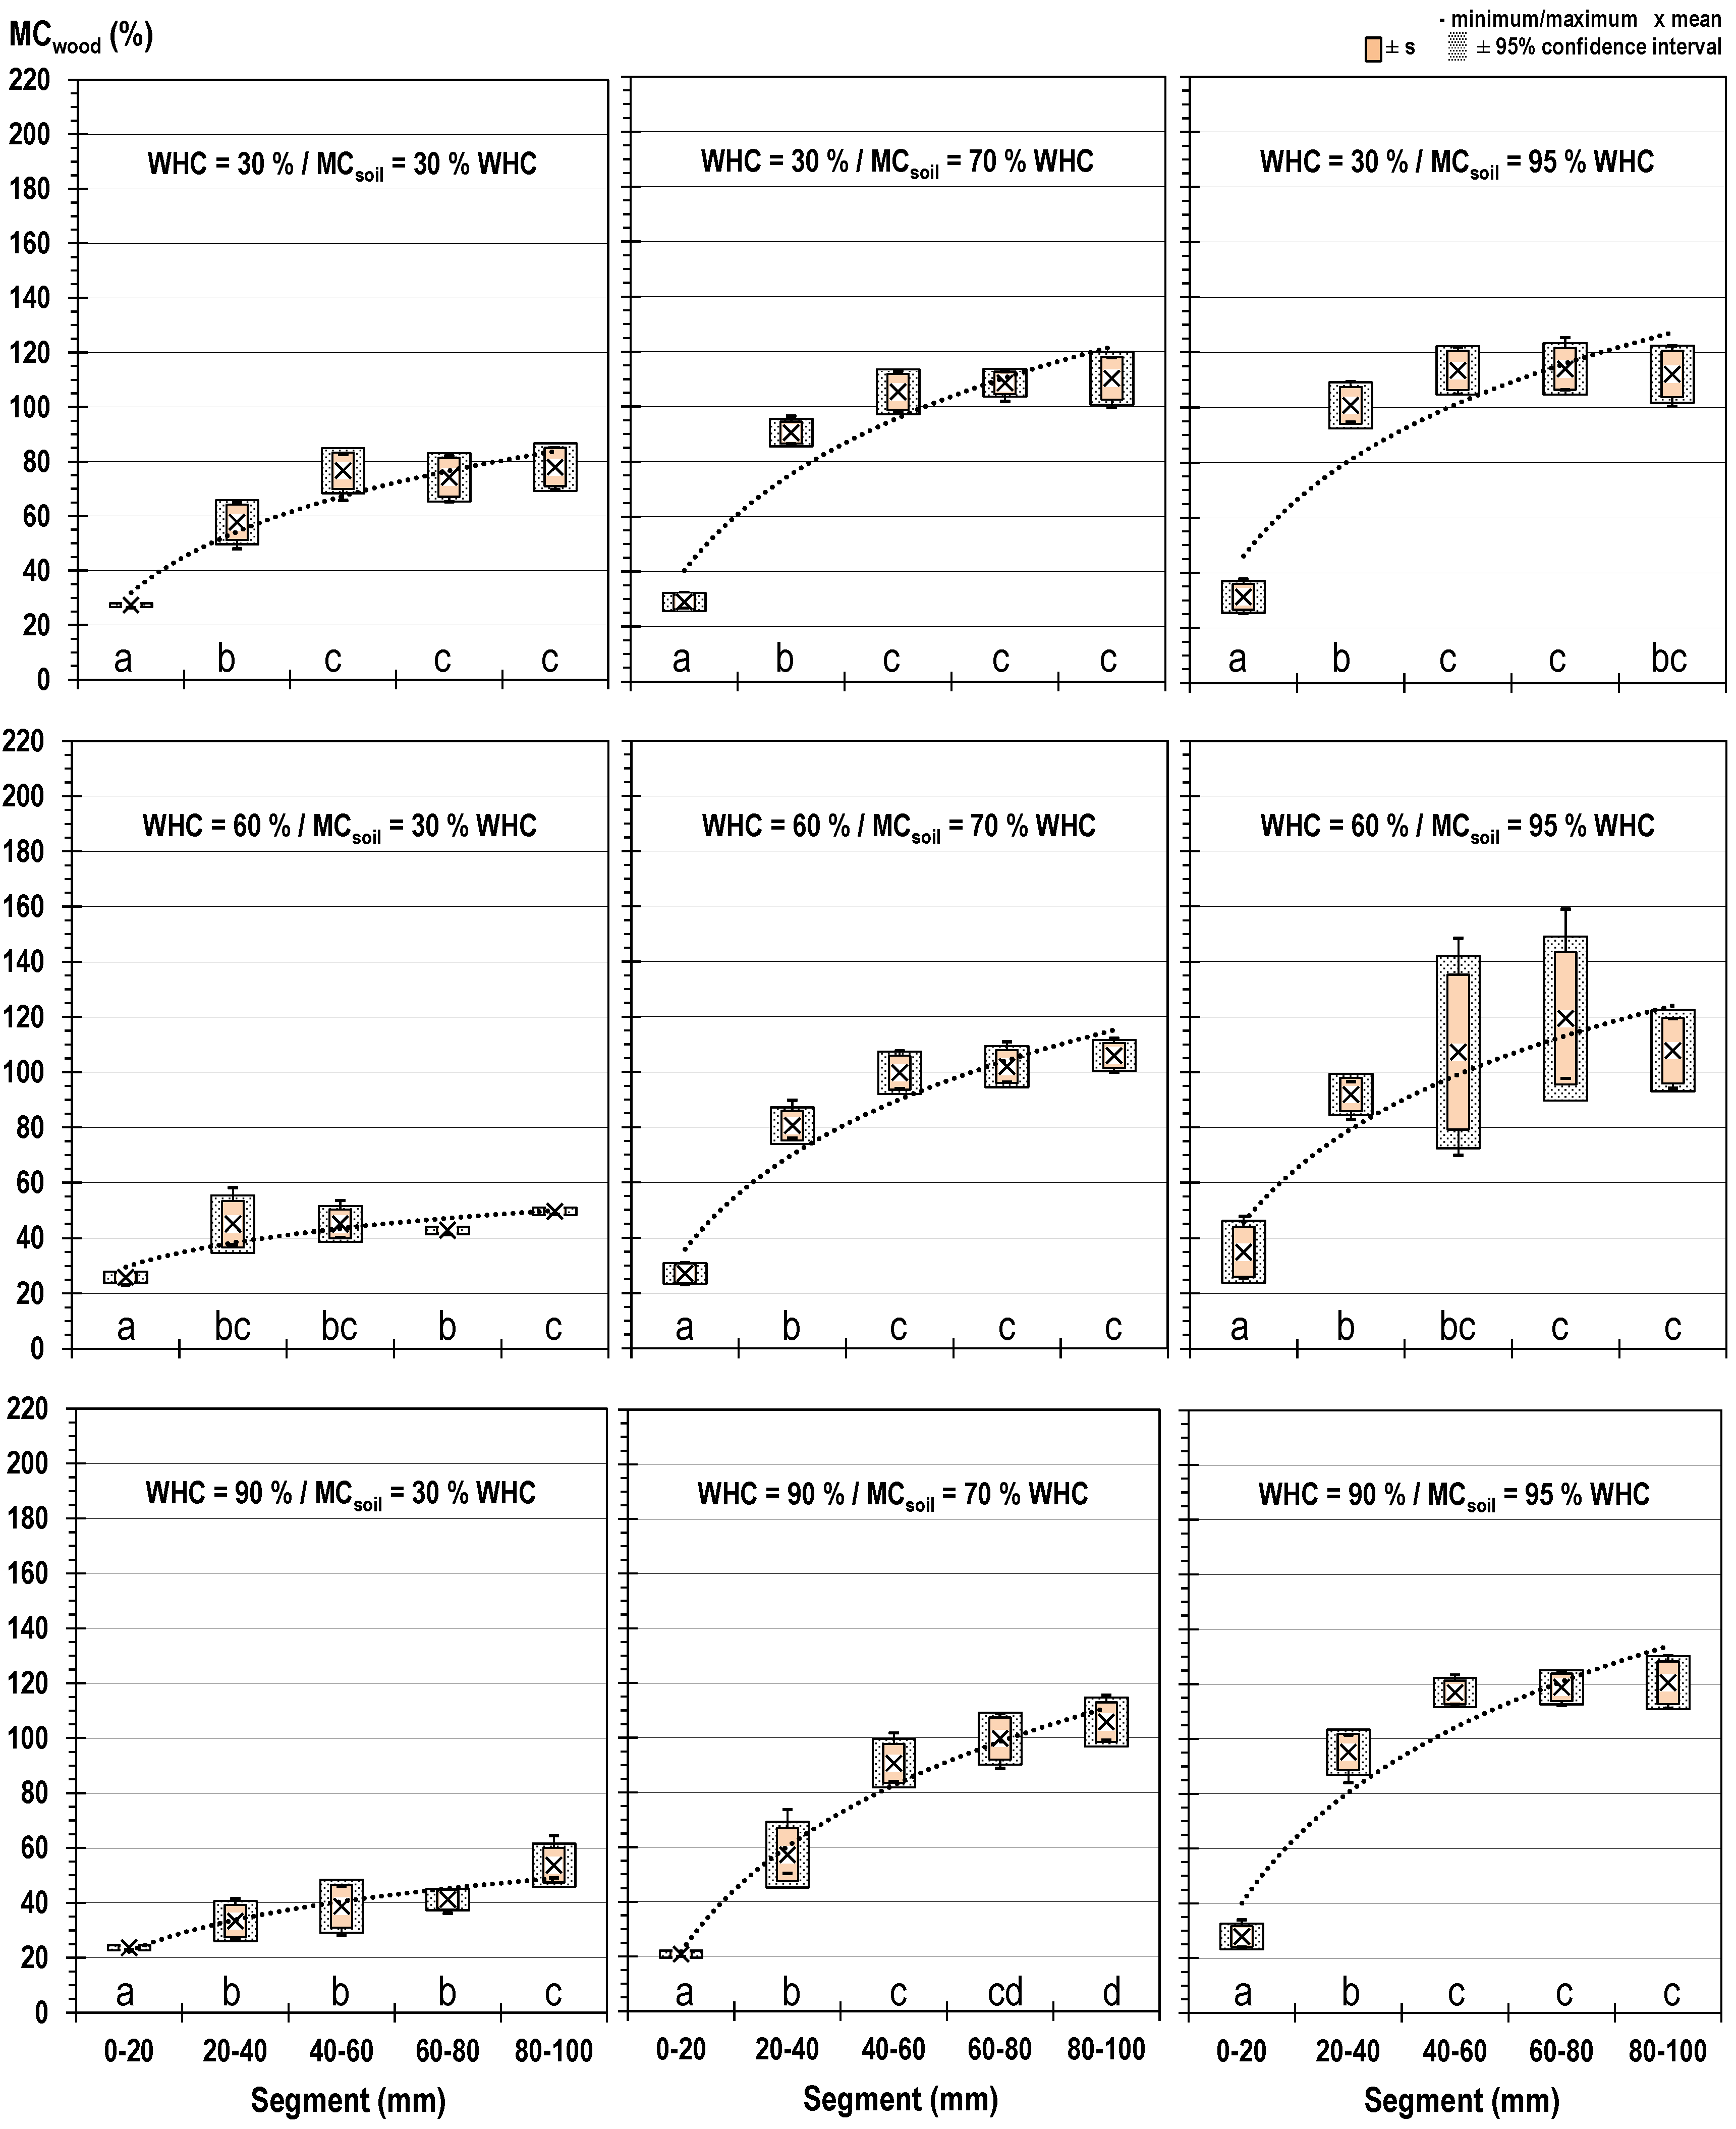
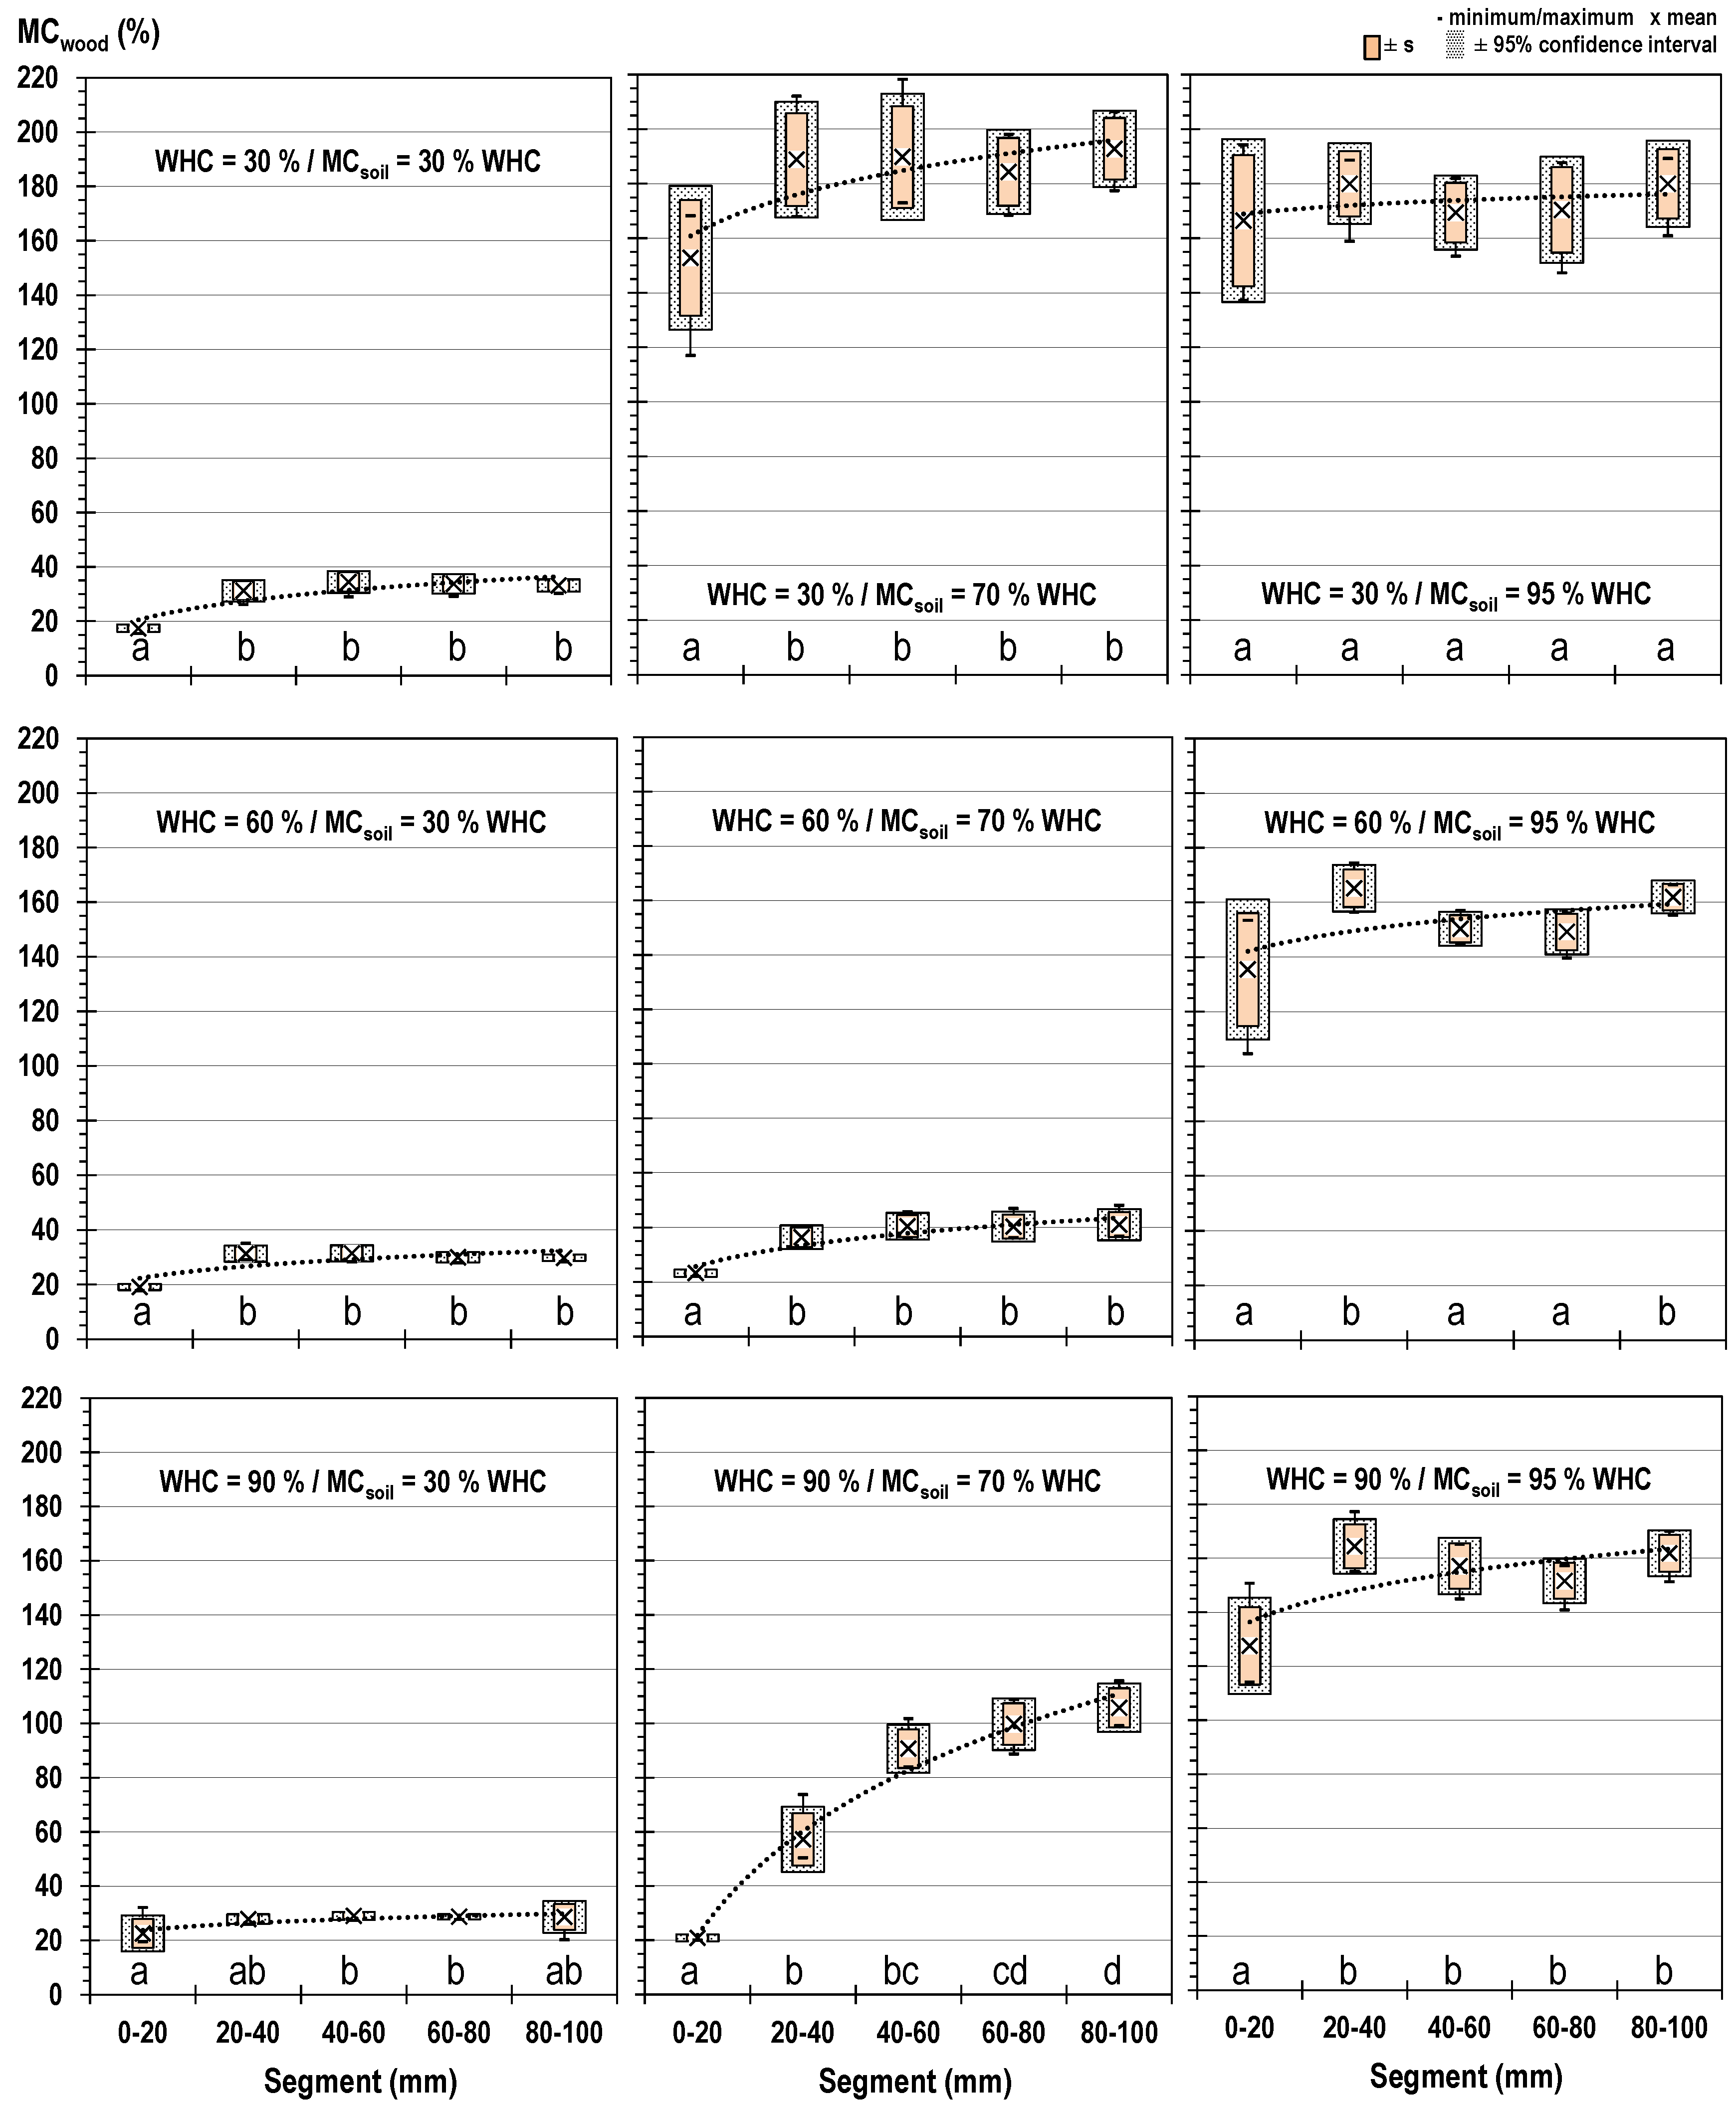
3.3. Moisture Content Gradients in Buried Wood Specimens

The MCwood in specimens buried to 4/5 of their length in TMCs showed partly drastic gradients from high moisture content in the bottom to less in the upper part, which was not buried (Figure 6, Figure 7, Figure 8 and Figure 9). Solely, Scots pine sapwood specimens exposed at high MCsoil (95%WHC) showed barely significant gradients, but very high MCwood in all parts of the specimen. Similarly, deviating MCwood gradients were reported by Mieß [12] for Scots pine sapwood specimens. As expected, generally, the highest difference in MCwood was found between the upper segments and upper next segments.
The MCwood in the upper segments of English oak and Douglas fir specimens was in the range of their equilibrium moisture content (EMC) at fiber saturation. In contrast, the upper segments of Scots pine sapwood and Beech specimens showed MCwood up to 180 and 80% respectively, indicating strong capillary water transport along the specimen axis.
The MCwood gradient in the specimens was positively correlated with MCsoil (%WHC). However, two types of MC gradients became apparent: (1) increasing MCwood from the upper to the next segment, but rather constant MCwood below (e.g., English oak at WHC = 30%), and (2) a steady increase of MCwood from the upper to the bottom segment (e.g., Beech and Scots pine sapwood).

4. Conclusions

The findings from this laboratory study on the soil–wood–moisture interactions in terrestrial microcosms led us to the following conclusions:
  • The more advantageous “Cylinder sand bath method” should consequently be seen as an adequate alternative for the “Droplet counting method”, which turned out disadvantageous regarding practical applicability, reproducibility, and reliability.
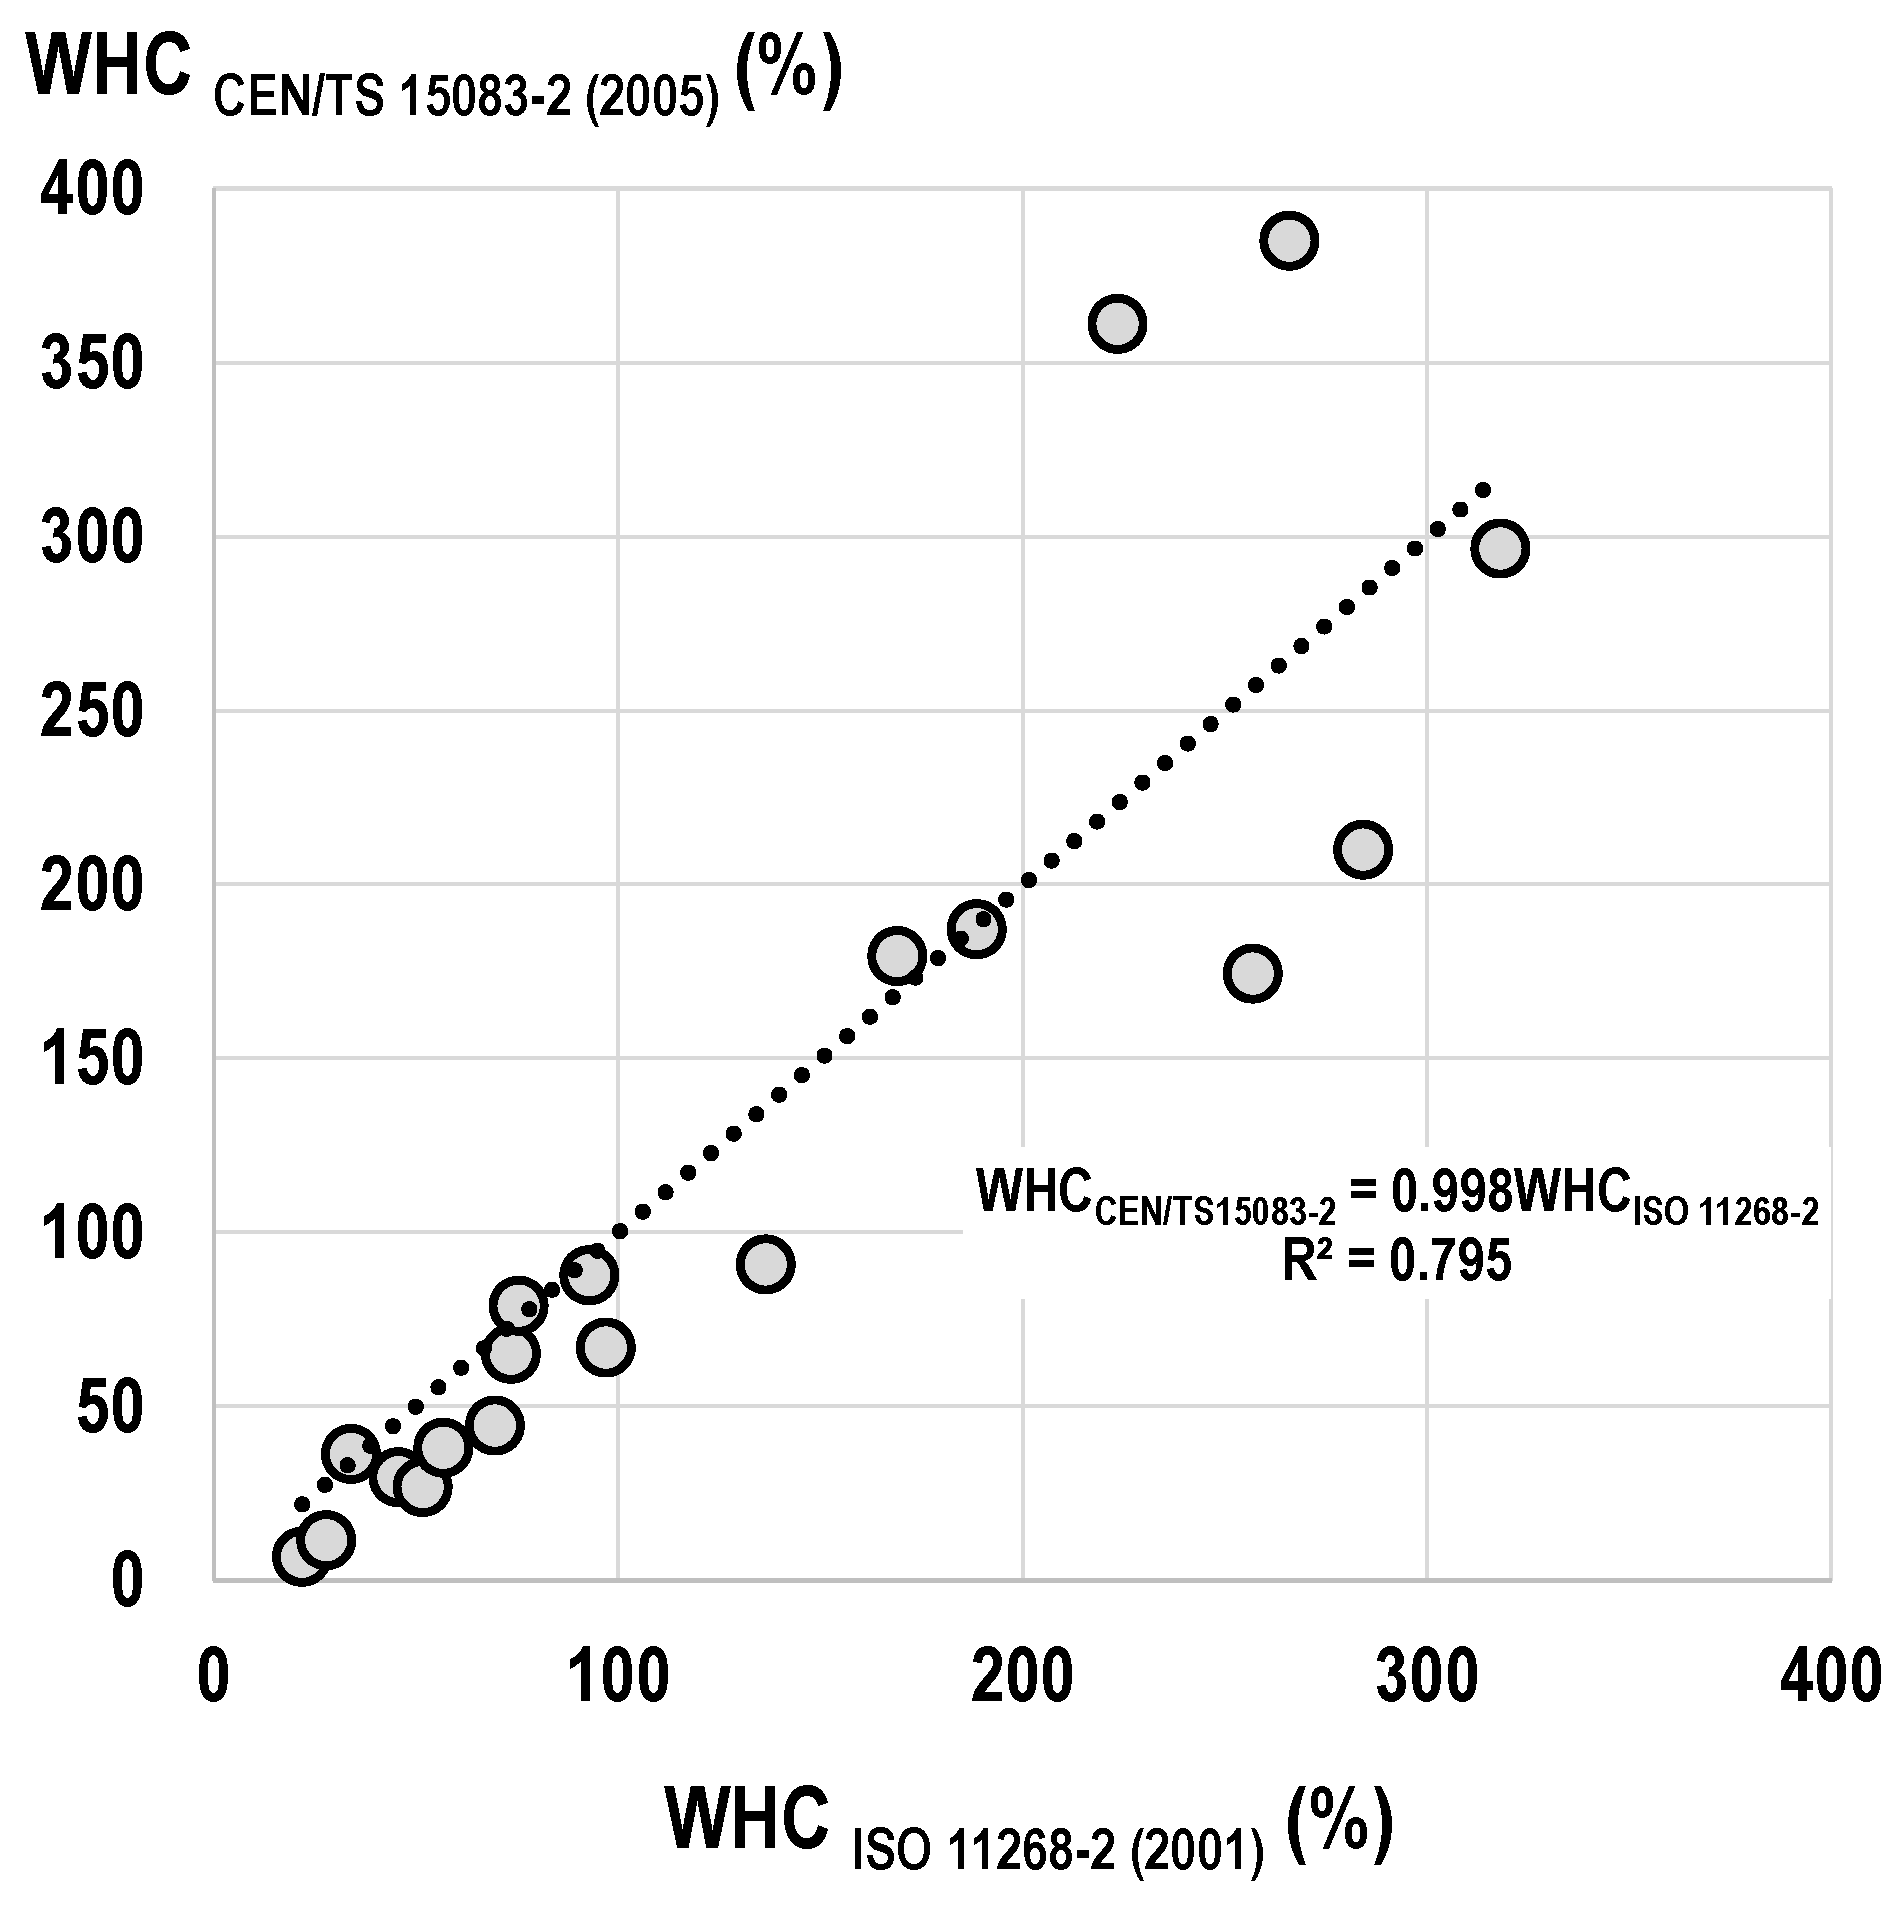
  • Water holding capacityvalues obtained from both test methods applied seemed to be easily transferable to each other. It is, therefore, recommended to replace the “droplet counting method” with the “cylinder sand bath method”.
  • The average MCwood of specimens buried in TMCs increased with rising MCsoil, but WHC was often negatively correlated with MCwood.
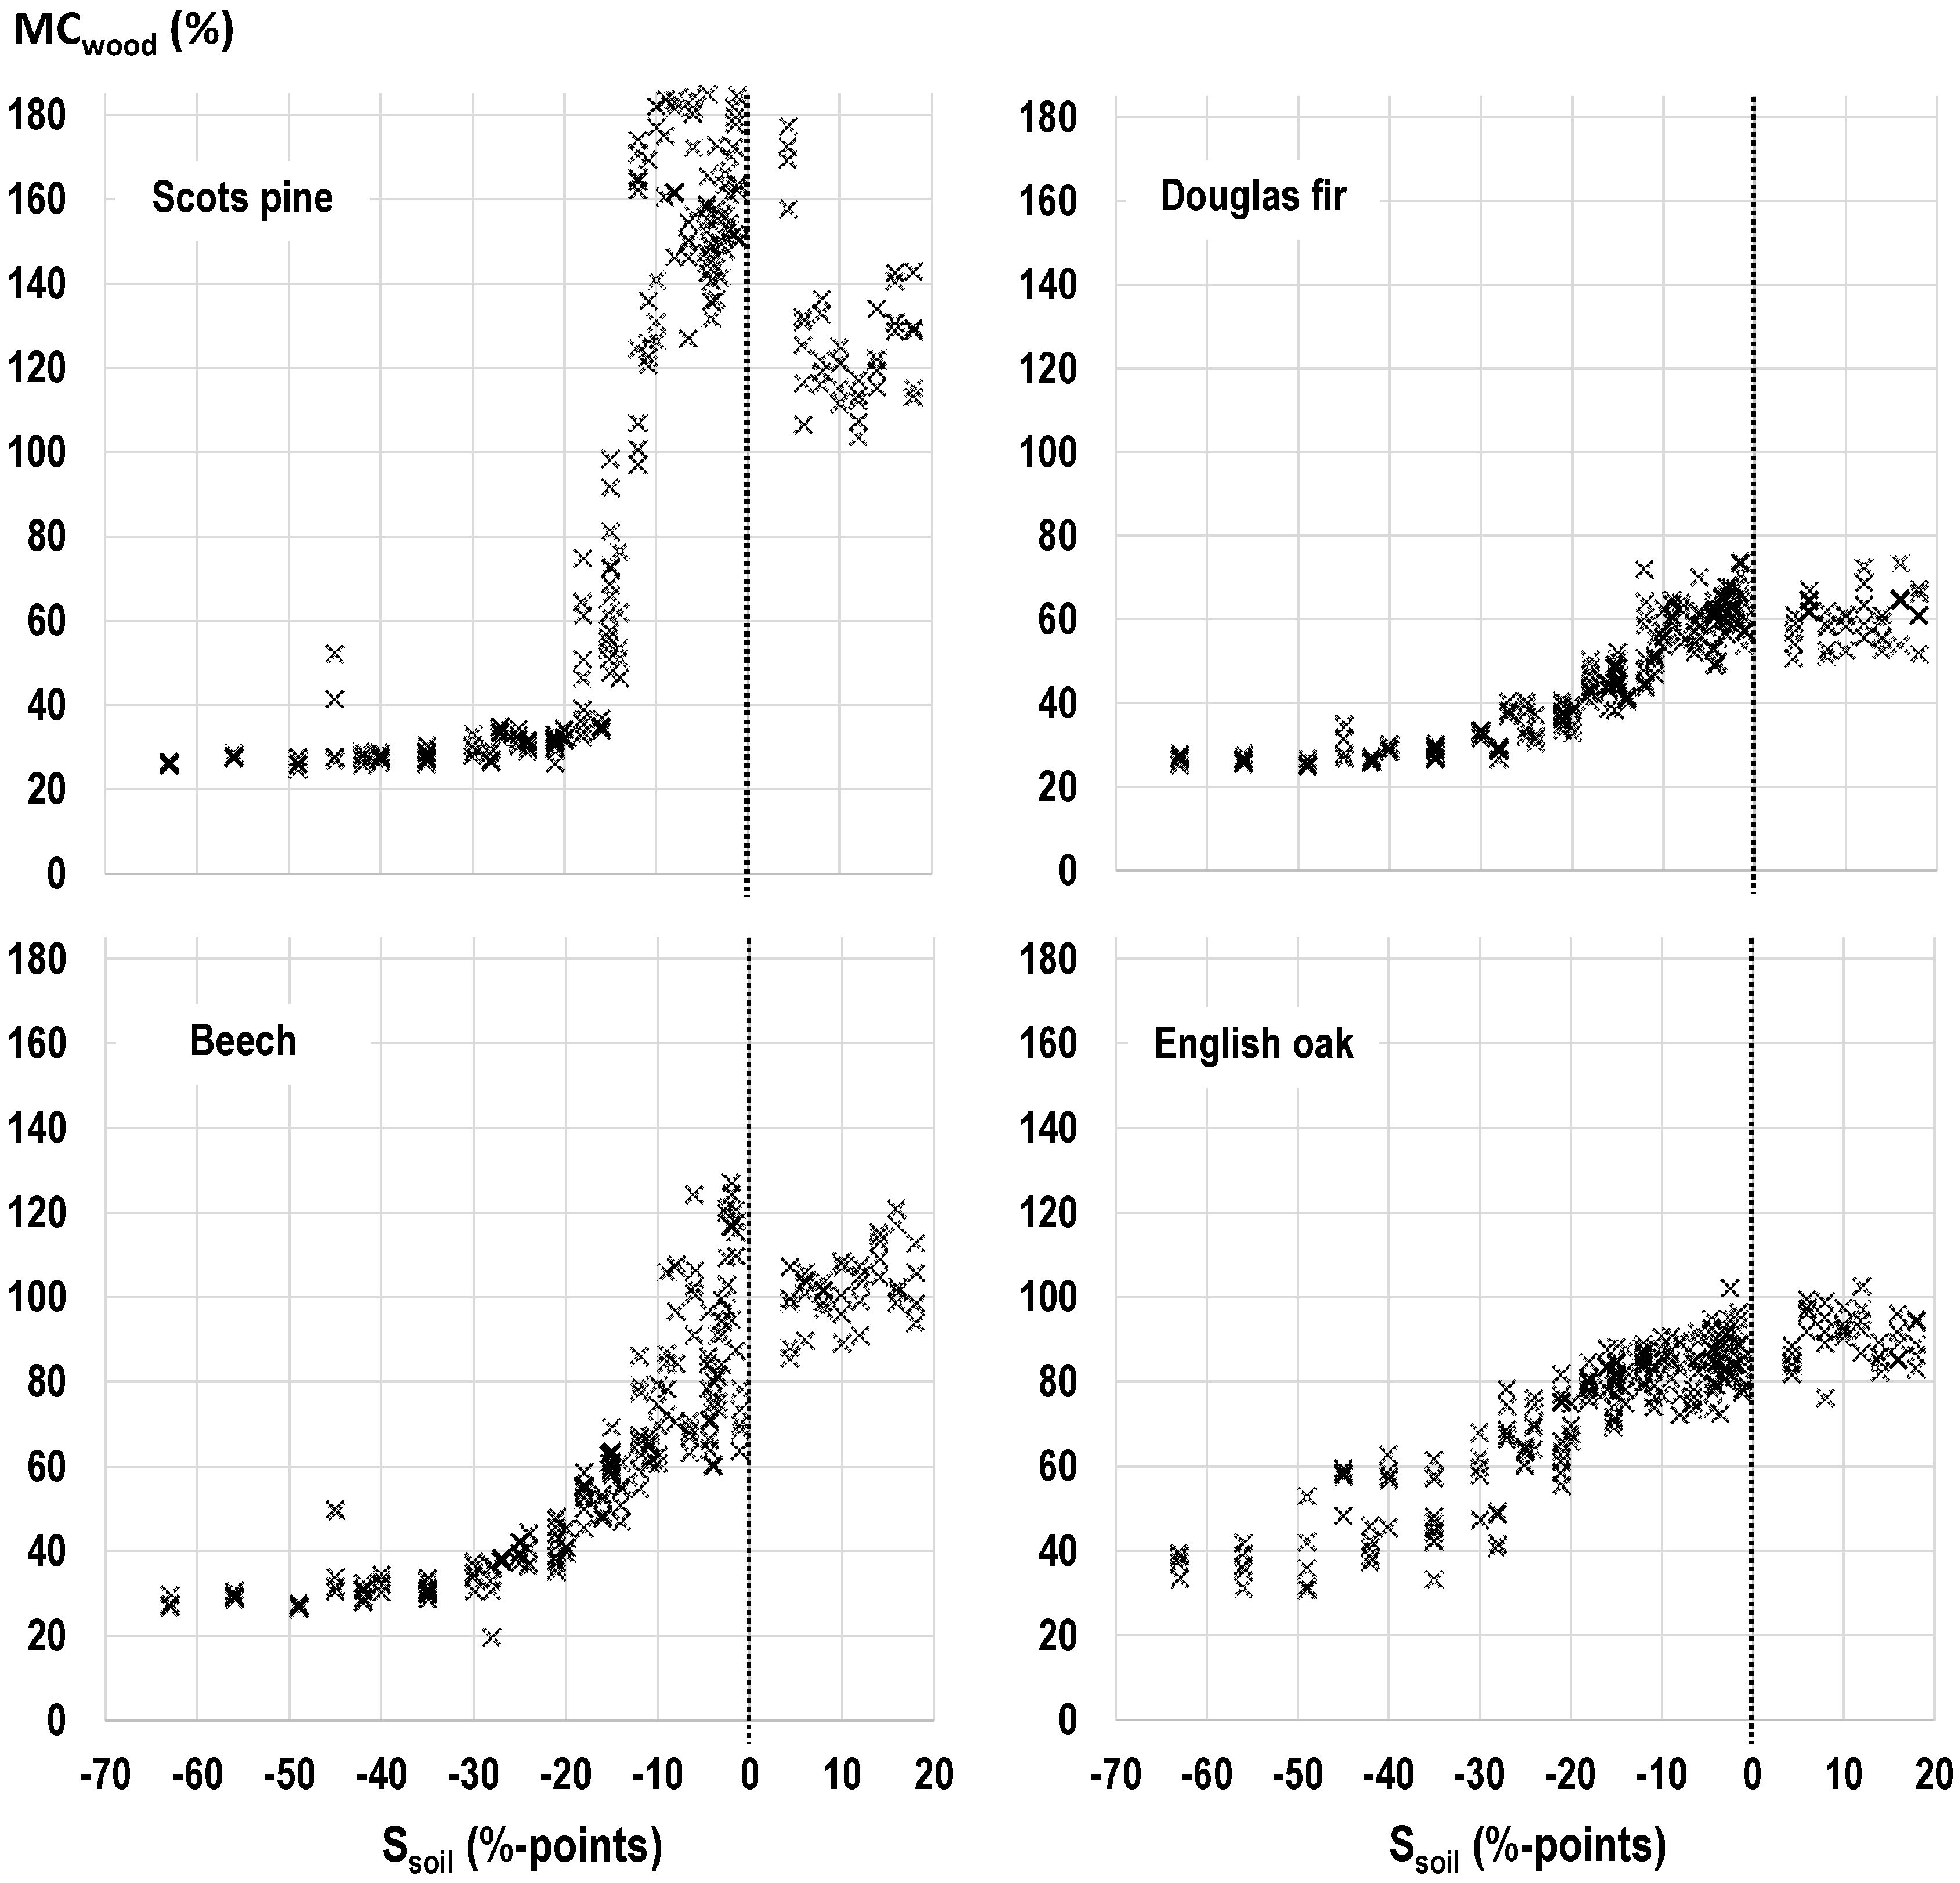
  • The distance to water saturation Ssoil appeared as a more predictive measure for MCwood.
  • With increasing Ssoil the MCwood increased but followed wood species-specific curves with differently steep increase and a plateau at Ssoil = 0%.
  • The distance to water saturation Ssoil from which MCwood increased most intensively was found to be wood-species specific and might, therefore, require further consideration in soil-bed durability testing. Thus, Ssoil can likely be used to establish moisture conditions which are favorable for a specific decay type, i.e., brown, white or soft rot.
  • The segment-wise determination of MCwood revealed that a combination of low MCsoil and high WHC of the soil can easily lead to moisture conditions which are not favorable, neither for fungal decay in general, nor for soft rot decay in particular. They should, therefore, be avoided in durability testing, but might be of interest for the service life prediction of wood exposed to soil.
Based on the findings from this study, further experiments have been initiated to examine the effect of soil–wood–moisture interactions on fungal decay, in particular soft rot decay. In addition, the outstanding role of soil and wood temperature on decay in constantly wet wood will be further investigated.

Author Contributions

F.W. together with C.B. were mainly responsible for the conceptualization, methodology used, data evaluation, data validation, and formal analysis. Investigations and data curation were conducted by F.W. The original draft of this article was prepared by C.B. who was also responsible for the review and editing process of this article. C.B. and F.W. oversaw the visualization.

Funding

Parts of the research were funded in the frame of the research project ‘CEMWOGEO—Cement coating of wood for geotechnical applications’—Funding Program for Renewable Resources—by the German Federal Ministry of Food and Agriculture. Fachagentur Nachwachsende Rohstoffe e.V. (FNR)—Project reference number: 22007617.

Acknowledgment

The authors gratefully acknowledge support with the TMC experiments from Brendan Marais.

Conflicts of Interest

The authors declare no conflict of interest.

References

  1. Wälchli, O. Influence of the Content of Organic Matter of Soil on the Degradation of Wood by Soft Rot Fungi. In Proceedings of the IRG Annual Meeting, Nancy, France, 29–30 September 1970. IRG/WP 70–27, 7 pp. [Google Scholar]
  2. Edlund, M.-L.; Evans, F.G.; Henriksen, K.; Nilsson, T. Testing Durability of Treated Wood According to EN 252-Interpretation of Data from Nordic Test Fields. In Proceedings of the IRG Annual Meeting, Tromsø, Norway, 18–22 June 2006. IRG/WP 06–20341, 17 pp. [Google Scholar]
  3. Wakeling, R. Is Field Test Data from 20 × 20mm Stakes Reliable? Effects of Decay Hazard, Decay Type and Preservative Depletion Hazard. In Proceedings of the IRG Annual Meeting, Tromsø, Norway, 18–22 June 2006. IRG/WP 06–20327, 20 pp. [Google Scholar]
  4. Augusta, U. Untersuchung der natürlichen Dauerhaftigkeit wirtschaftlich bedeutender Holzarten bei Verschiedener Beanspruchung im Außenbereich. Ph.D. Thesis, University Hamburg, Hamburg, Germany, 2007. [Google Scholar]
  5. Brischke, C.; Olberding, S.; Meyer, L.; Bornemann, T.; Welzbacher, C.R. Intra-site variability of fungal decay on wood exposed in ground contact. Int. Wood Prod. J. 2013, 4, 37–45. [Google Scholar] [CrossRef]
  6. Edlund, M.-L.; Nilsson, T. Testing the durability of wood. Mat. Struct. 1998, 31, 641–647. [Google Scholar] [CrossRef]
  7. Westin, M.; Alfredsen, G. Durability of Modified Wood in UC3 and UC4-Results from Lab Natural Durability in soil-bed Assay. In Proceedings of the IRG Annual Meeting, Queenstown, New Zealand, 8–12 May 2011. IRG/WP 11–40562, 9 pp. [Google Scholar]
  8. Meyer, L.; Brischke, C.; Melcher, E.; Brandt, K.; Lenz, M.T.; Soetbeer, A. Durability of English oak (Quercus robur L.)—Comparison of decay progress and resistance under various laboratory and field conditions. Int. Biodeter. Biodegr. 2014, 86, 79–85. [Google Scholar] [CrossRef]
  9. EN 252. Wood Preservatives. Field Test Methods for Determining the Relative Protective Effectiveness in Ground Contact; European Committee for Standardisation: Brussels, Belgium, 2015. [Google Scholar]
  10. CEN/TS 15083-1. Durability of Wood and Wood-Based Products-Determination of the Natural Durability of Solid Wood against Wood-Destroying Fungi, Test Methods-Part 2: Soft Rotting Micro-Fungi; European Committee for Standardisation: Brussels, Belgium, 2005. [Google Scholar]
  11. Wälchli, O. Soft Rot–Soil Burial Tests–Influence of the Water Content of the Soil on Wood Decay. In Proceedings of the IRG Annual Meeting, West-Berlin, Germany, 26–28 October 1972. IRG/WP 72–212, 14 pp. [Google Scholar]
  12. Mieß, S. Einfluß des Wasserhaushaltes auf Abbau und Fäuletypen von Holz in Terrestrischen Mikrokosmen. Diploma thesis, University Hamburg, Hamburg, Germany, 1997. [Google Scholar]
  13. Gray, S.M. Effect of Soil Type and Moisture Content on Soft Rot Testing. In Proceedings of the IRG Annual Meeting, Avignon, France, 25–30 May 1986. IRG/WP 86–2270, 27 pp. [Google Scholar]
  14. Nilsson, T.; Daniel, G. Decay Types Observed in Small Stakes of Pine and Alstonia scholaris Inserted in Different Types of Unsterile Soil. In Proceedings of the IRG Annual Meeting, Rotorua, New Zealand, 13–19 May 1990. IRG/WP 90-1443, 8 pp. [Google Scholar]
  15. Edlund, M.-L.; Nilsson, T. Performance of copper and non-copper based wood preservatives in terrestrial microcosms. Holzforschung 1999, 53, 369–375. [Google Scholar] [CrossRef]
  16. Rayner, A.D.; Boddy, L. Fungal Decomposition of Wood. Its biology and ecology; John Wiley & Sons Ltd.: Bath, UK, 1988. [Google Scholar]
  17. Eaton, R.A.; Hale, M.D. Wood: Decay, Pests and Protection; Chapman and Hall Ltd.: London, UK, 1993. [Google Scholar]
  18. ENV 807. Wood Preservatives-Determination of the Effectiveness against Soft Rotting Micro-Fungi and Other Soil Inhabiting Micro-Organisms; European Committee for Standardisation: Brussels, Belgium, 2001. [Google Scholar]
  19. ISO 11268-2. Soil Quality-Effects of Pollutants on Earthworms-Part 2: Determination of Effects on Reproduction of Eisenia fetida/Eisenia andrei; International Organization for Standardization (ISO): Geneve, Switzerland, 2012. [Google Scholar]
  20. Essington, M.E. Soil and Water Chemistry: An Integrative Approach; CRC press: Boca Raton, FL, USA, 2015. [Google Scholar]
Figure 1. Interrelationship between the percentage of added sand and peat and the WHC of the substrate mixtures: (a) WHC determined according to the “droplet counting method” [10]. (b) WHC determined according to the “cylinder sand bath method” [19].
Forests 10 00485 g001
Figure 2. Interrelationship between the WHC of peat according to the ‘droplet counting method’ (CEN/TS 15083-2, 2005) and the mass of the peat sample.
Forests 10 00485 g002
Figure 3. Interrelationship between the WHC of different substrate mixtures according to the “droplet counting method” [10] and the “cylinder sand bath method” [19].
Forests 10 00485 g003
Figure 4. The interrelationship between wood moisture content (MCwood) and WHC for different MCsoil expressed as a percentage of the WHC of the TMC (regression functions are shown in Table 5).
Forests 10 00485 g004
Figure 5. The interrelationship between the distance to water saturation of the soil substrates (Ssoil) and the wood moisture content (MCwood).
Forests 10 00485 g005
Figure 6. Distribution of MCwood in English oak specimens buried to 4/5 of their length (20–100 mm) in different TMCs. Different letters indicating significant differences between groups at p < 5% according to a Student t-test for non-paired samples.
Forests 10 00485 g006
Figure 7. Distribution of MCwood in Beech specimens buried to 4/5 of their length (20–100 mm) in different TMCs. Different letters indicating significant differences between groups at p < 5% according to a Student t-test for non-paired samples.
Forests 10 00485 g007
Figure 8. Distribution of MCwood in Douglas fir specimens buried to 4/5 of their length (20–100 mm) in different TMCs. Different letters indicating significant differences between groups at p < 5% according to a Student t-test for non-paired samples.
Forests 10 00485 g008
Figure 9. Distribution of MCwood in Scots pine sapwood specimens buried to 4/5 of their length (20–100 mm) in different TMCs. Different letters indicating significant differences between groups at p < 5% according to a Student t-test for non-paired samples.
Forests 10 00485 g009
Table 1. Mixing ratios of soil substrates for water holding capacity (WHC) tests. Percentage is based on the oven-dried mass.
Percentage Compost (%)10095908070605040302010
Percentage silica sand/peat (%)05102030405060708090
Table 2. Soil moisture content MCsoil (%) for combinations of target WHC 1 and target MCsoil expressed as (%WHC).
MCsoil (%WHC) 1WHC (%) 1
21.8 230.040.050.060.070.080.090.0
30.06.59.012.015.018.021.024.027.0
50.010.915.020.025.030.035.040.045.0
70.015.321.028.035.042.049.056.063.0
80.017.424.032.040.048.056.064.072.0
95.020.728.538.047.557.066.576.085.5
120.026.236.048.060.072.084.096.0108.0
1 WHC determined according to the “cylinder sand bath method” according to ISO 11268-2 [19]. 2 WHC of pure silica sand was 21.8% and consequently the lowest WHC achieved.
Table 3. WHC of different mixtures of compost with sand and peat.
WHC (%) 1
21.8 230.040.050.060.070.080.090.0
Percentage compost (%)0.013.230.347.464.581.698.698.6
Percentage sand (%)100.086.869.752.635.518.51.40.0
Percentage peat (%)0.00.00.00.00.00.00.01.4
1 WHC determined according to the “cylinder sand bath method” according to ISO 11268-2 [19]. 2 WHC of pure silica sand was 21.8% and consequently the lowest WHC achieved.
Table 4. WHC (%) of the initial soil substrates determined according to the “droplet counting method” and the “cylinder sand bath method”. Standard deviation in parentheses.
WHC (%) 1
Silica SandCompostPeat
Droplet counting method6.7 (0.3)78.9 (1.3)296.6 (40.9)
Cylinder sand bath method21.8 (0.4)75.5 (1.1)318.3 (38.8)
1 Number of replicate samples was n = 3 and n = 5 for peat tested according to the droplet counting method.
Table 5. Regression functions for fitting curves shown in Figure 5 (y = wood moisture content MCwood; x = water holding capacity WHC).
MCsoil
(%WHC)
English OakBeechScots Pine SapwoodDouglas Fir
120−0.20ln(x) + 91.206.81ln(x) + 75.78−16.06ln(x) + 220.01−21.77ln(x) + 214.39
951.56ln(x) + 80.56−8.52ln(x) + 125.38−21.77ln(x) + 214.39−3.25ln(x) + 74.33
80−0.65ln(x) + 84.98−26.67ln(x) + 173.92−99.34ln(x) + 502.65−14.01ln(x) + 106.82
70−8.17ln(x) + 110.07−30.11ln(x) + 175.84−116.8ln(x) + 543.26−19.14ln(x) + 121.88
50−20.27ln(x) + 144.18−22.67ln(x) + 131.58−66.53ln(x) + 310.55−15.69ln(x) + 97.79
30−25.01ln(x) + 144.87−20.20ln(x) + 113.81−14.83ln(x) + 89.25−13.02ln(x) + 81.44

