Article

Relationship between Soil Burn Severity in Forest Fires Measured In Situ and through Spectral Indices of Remote Detection

by
Jose Antonio Sobrino
1,*,
Rafael Llorens
1,
Cristina Fernández
2,
José M. Fernández-Alonso
2 and
José Antonio Vega
2
1
Global Change Unit, Image Processing Laboratory, University of Valencia, E-46980 Paterna, Spain
2
Centro de Investigación Forestal de Lourizán, Xunta de Galicia, E-36156 Pontevedra, Spain
*
Author to whom correspondence should be addressed.
Forests 2019, 10(5), 457; https://doi.org/10.3390/f10050457
Submission received: 15 April 2019 / Revised: 22 May 2019 / Accepted: 23 May 2019 / Published: 26 May 2019
(This article belongs to the Section Forest Inventory, Modeling and Remote Sensing)

Abstract

:
Forest fires in Galicia have become a serious environmental problem over the years. This is especially the case in the Pontevedra region, where in October 2017 large fires (>500 hectares) burned more than 15,000 Ha. In addition to the area burned being of relevance, it is also very important to know quickly and accurately the different severity degrees that soil has suffered in order to carry out an optimal restoration campaign. In this sense, the use of remote sensing with the Sentinel-2 and Landsat-8 satellites becomes a very useful resource due to the variations that appear in soil after a forest fire (changes in soil cover are noticeably appreciated with spectral information). To calculate these variations, the spectral indices NBR (Normalized Burn Ratio) and NDVI (Normalized Difference Vegetation Index) are used, both before and after the fire and their differences (dNBR and dNDVI, respectively). In addition, as a reference for a correct discrimination between severity degrees, severity data measured in situ after the fire are used to classified at 5 levels of severity and 6 levels of severity. Therefore, this study aims to establish a methodology, which relates remote-sensing data (spectral indices) and severity degrees measured in situ. The R2 statistic and the pixel classification accuracy results show the existing synergy of the Sentinel-2 dNBR index with the 5 severity degrees classification (R2 = 0.74 and 81% of global accuracy) and, for this case, the good applicability of remote sensing in the forest fire field.

1. Introduction

Forest fires are one of the most important problems in countries of southern Europe such as Spain [1]. In this geographic area, summers are increasingly hot and dry, causing a significant increase in area affected by fires [2]. These kinds of fires are the cause of environmental and economic losses [3,4,5]. In addition, these phenomena are actively involved in greenhouse effect (CO2 emission) and climate change [6].
Methods to map burned area, prior to remote sensing, were characterized as expensive and slow. Presently, it has been proven that satellite data is the only way to monitor burned surfaces at regional or global scales (free downloadable data and fast and reliable results) [7,8]. Furthermore, these data allow quick, reliable and economic estimates to plan restoration work. Most burned area estimation methods from remote sensing have been carried out using post-fire images, alone or in comparison with pre-fire images. This is because satellite measurements can capture vegetation damage once the event has passed [9,10,11,12]. Among the methods of estimating burned surfaces from post-fire images, spectral indices are widely used. There is a remarkable group of spectral indices specifically designed to discriminate different degrees in surfaces affected by fire [13]. This is the case of the normalized burn ratio (NBR) and dNBR (differenced NBR) algorithms, which integrate information in near-infrared (NIR) and short-wave infrared (SWIR) regions [14]. In addition to NBR and dNBR indices, other spectral indices are used in this study, such as the normalized difference vegetation index (NDVI) and their respective differences (dNDVI). The dNDVI index is very useful for studying the state of recovery of burnt vegetation [15,16]. These indices can be calculated are calculated using data from the Sentinel-2 satellite developed by the European Space Agency (ESA) and Landsat-8 satellite developed by the National Aeronautics and Space Administration (NASA). On one hand, Sentinel-2 is a constellation of two satellites (Sentinel-2A and Sentinel-2B), launched on 23 June 2015 and 7 March 2017, respectively, and both orbiting Earth at an altitude of 786 km but 180° apart [17]. This configuration optimizes coverage and global revisit times. As a constellation, the same spot over the equator is revisited every 5 days, and this is even faster at higher latitudes [17]. Sentinel-2 satellites carry an optical instrument payload (MSI) that samples 13 spectral bands. On the other hand, the Landsat-8 satellite launched on 11 February 2013 orbits Earth at an altitude of 705 km and revisits the same point on the surface every 16 days with a delay of 8 days with respect to the Landsat 7 satellite [18]. This satellite carries two push-broom instruments: The Operational Land Imager (OLI) and the Thermal Infrared Sensor (TIRS). In this study, only the OLI sensor is used. The spectral bands of the OLI sensor provide enhancement from prior Landsat instruments, with the addition of two additional spectral bands: a deep blue visible channel (band 1) specifically designed for water resources and coastal zone investigation, and a new shortwave infrared channel (band 9) for the detection of cirrus clouds [19,20,21].
As a reference for a correct discrimination between fire severity degrees in spectral indices, fire severity at field points measured in situ are a good choice. Fire severity is defined as a measure of the physical change [22] or environmental impact [23] in an area caused by burning. This kind of severity describes the immediate effects of fire on vegetation, litter, or soils. A number of methods are used to assess fire severity, integrating information of fire impact on vegetation, forest floor and soil [24,25].
Soil burn severity is an essential component of fire severity and its assessment is critical to determine the hydrological response following fire [26,27]. The capability of remoted-sensed spectral indexes to reflect different degrees of fire severity has been repeatedly shown, e.g., [28,29,30,31,32,33,34]. However, their suitability for evaluation of soil burn severity has been questioned [35,36,37].
Thus, this article aims to establish relationships between the soil burn severities of Pontevedra wildfires (October 2017, Spain), and calculated common remote-sensing spectral indexes by the use of data from Sentinel-2 and Landsat-8 satellites.

2. Materials and Methods
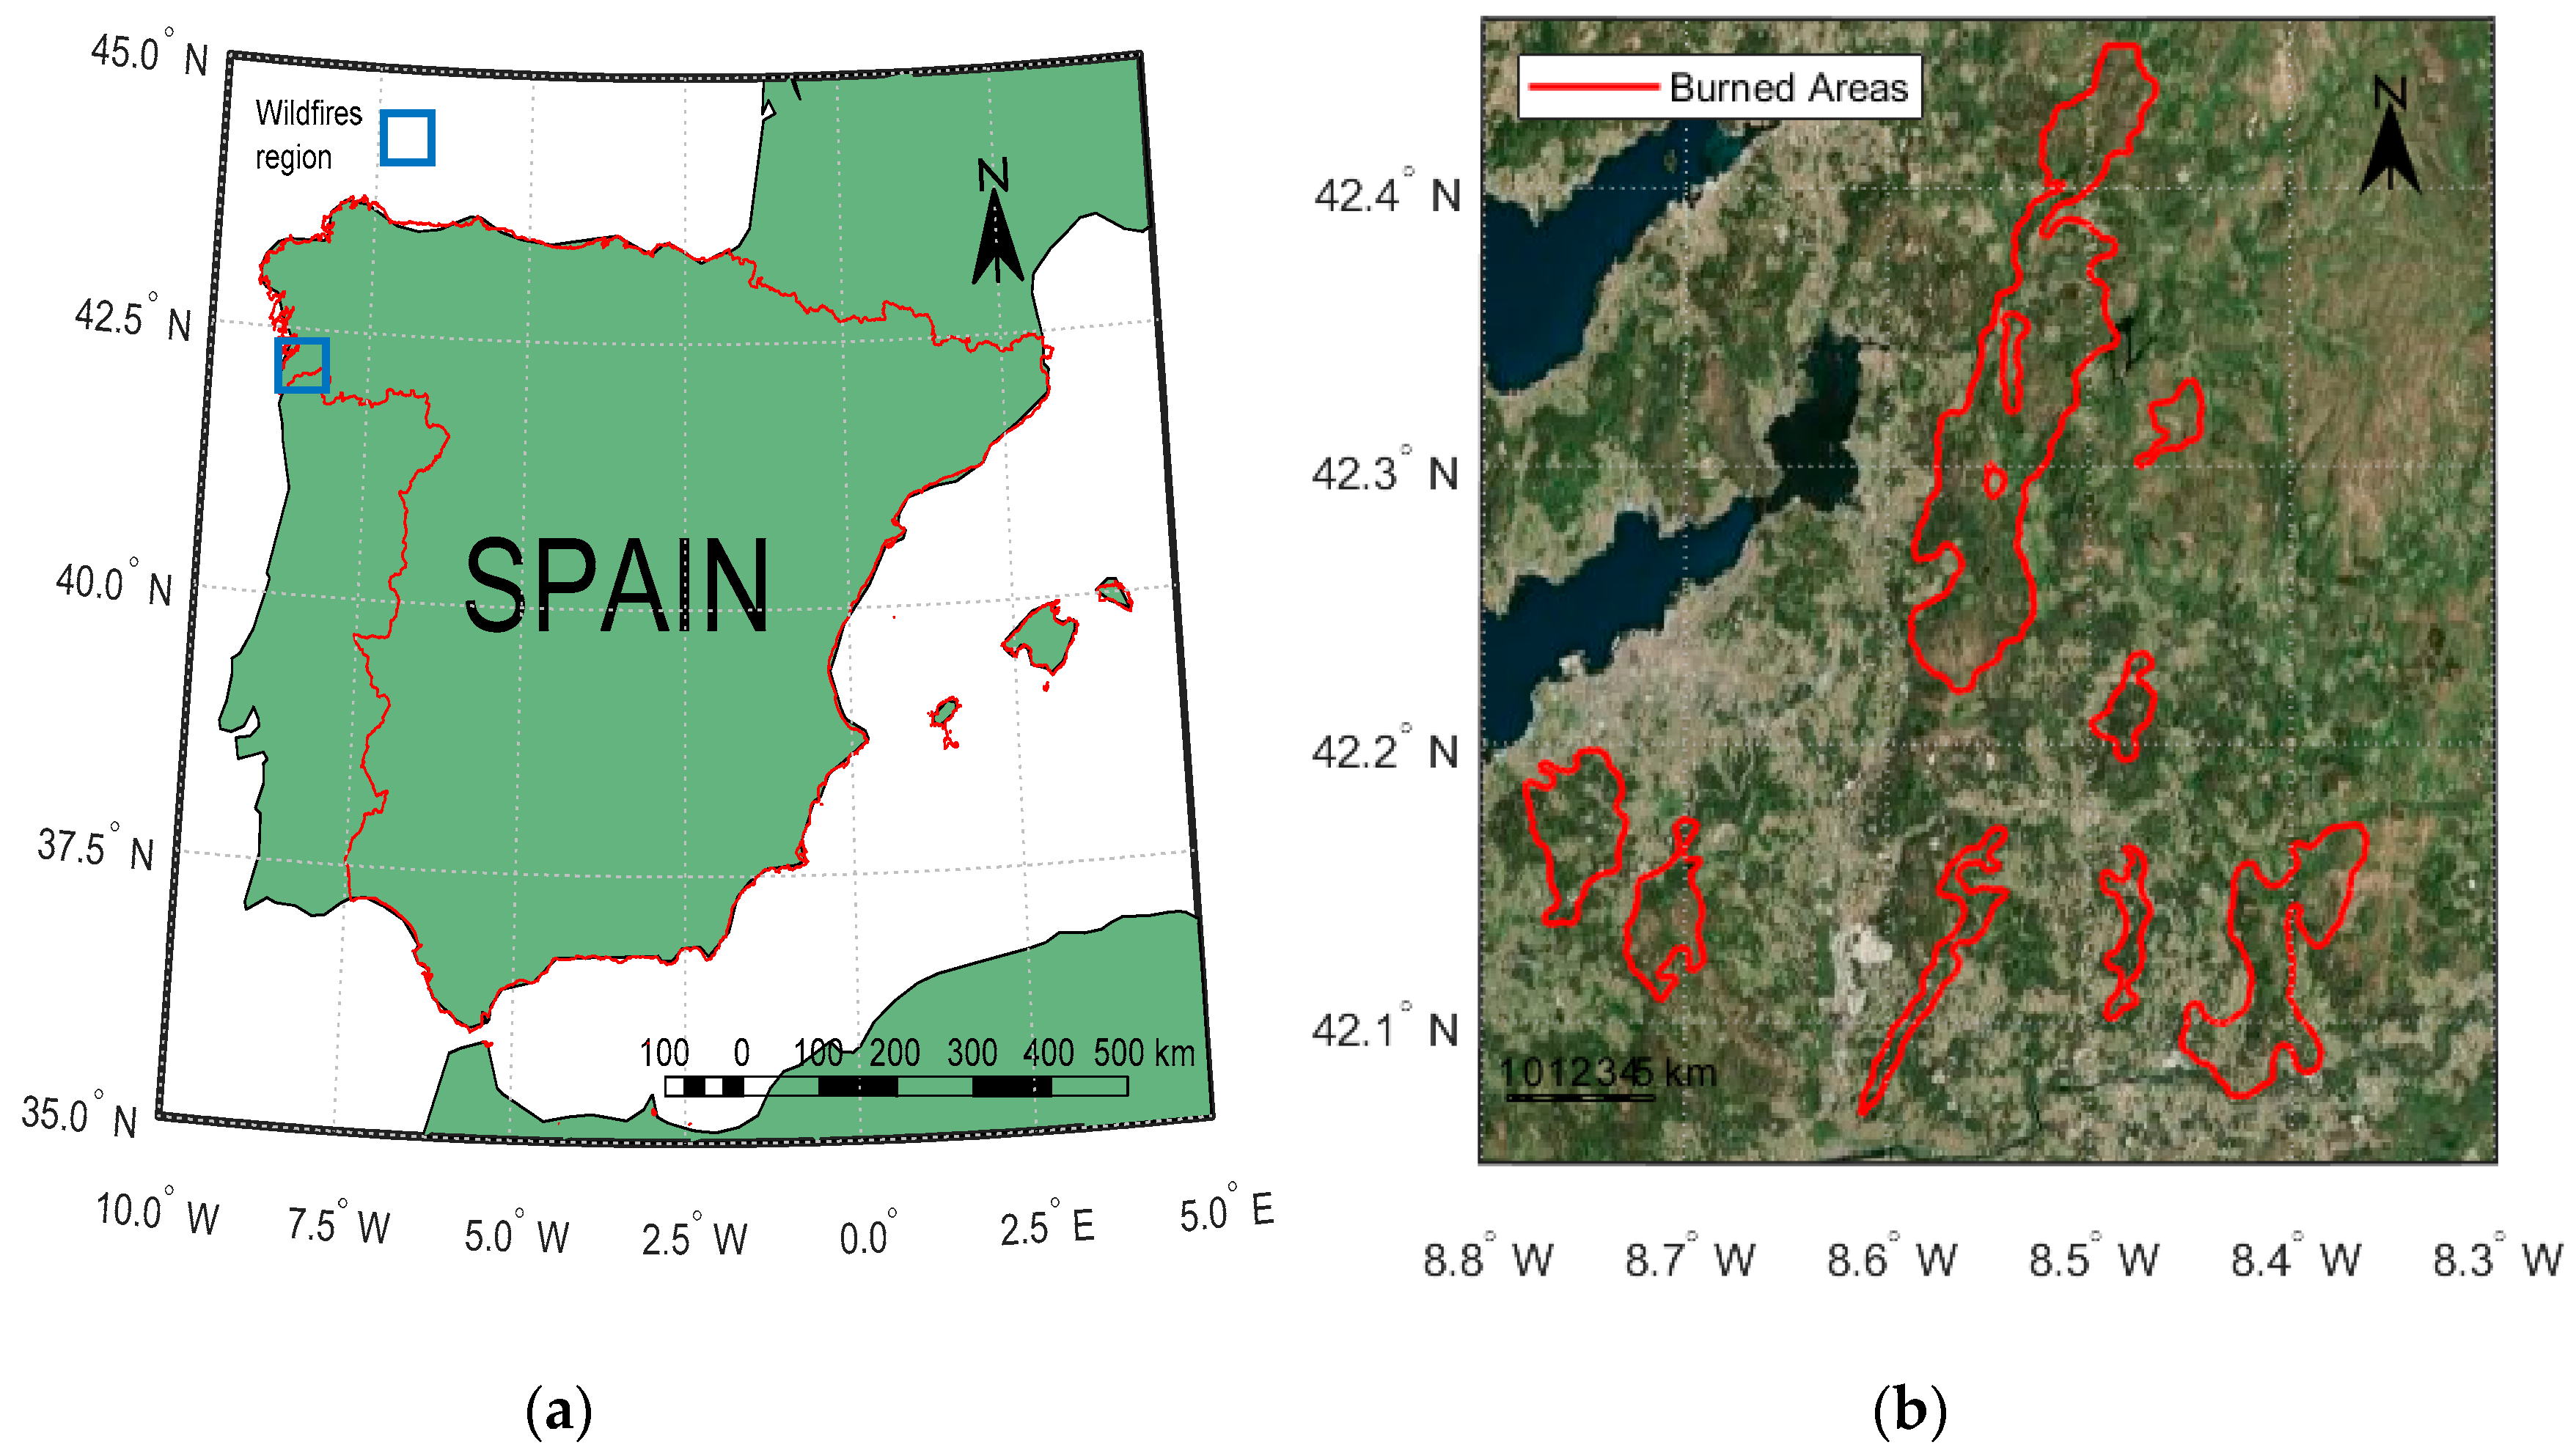
2.1. Study Area

The work that is described was carried out in wildfires occurred in Pontevedra (Galicia, northwestern Spain) during the autumn of 2017, three of them large fires (>500 Ha). Those fires burned over 15,650 Ha from 15 to 17 October (Figure 1), affecting both forest and wildland–urban interface areas. According to the Third National Forest Inventory (1997–2006), about 70% area in Galicia is forest, 64% of which is covered by trees (coniferous and eucalyptus, mainly) [38]. The fires selected for this study affected mainly Pinus pinaster Ait. (maritime pine) and Eucalyptus globulus Labill. (blue gum) stands. The understory vegetation was dominated by Pteridium aquilinum (L.) Kuhn and Ulex europaeus L. In this region, forest fires tend to be frequent, it being the Spanish area where usually more wildfires occur.
Burned areas perimeters have been provided by the European Forest Fire Information System (EFFIS). The EFFIS perimeters algorithm was initially implemented in 2003 to map burned areas during the fire season by analyzing Moderate Resolution Imaging Spectroradiometer (MODIS) daily images at 250 m spatial resolution. For the monitoring of burned areas during the summer, daily images from the MODIS instruments on board TERRA and AQUA satellites are acquired and processed few hours after the acquisition. EFFIS provides the daily update of the perimeters of burnt areas in Europe for fires of about 30 ha or larger, twice every day. Small burnt or un-burnt areas below the spatial resolution of the MODIS imagery are not mapped; these may include small unburned islands inside the burnt area. Clouds of MODIS data are removing using a cloud mask based on the MOD35 product at 1 km resolution [39].

2.2. Sentinel-2 Data

The MSI sensor aboard the Sentinel-2 satellite is characterized by having 13 spectral bands in different spatial resolutions (10, 20 and 60 m) [40]. All of the images used have been downloaded from the ESA portal [41] and are Level 2A (bottom of atmosphere (BOA) reflectance images derived from the associated Level-1C products [42].
Cloud correction, in Sentinel-2 case, is performed using the scene classification image (SCL), which spatial resolution is 20 m [43,44]. Pixel values classified as clouds or pixels with errors are masked to avoid possible errors in calculation of spectral indices.

2.3. Landsat-8 Data

The OLI sensor aboard the Landsat-8 satellite is characterized by having eight spectral bands in different spatial resolutions (in this case, 30 m). All the images used have been downloaded from the Earth Explorer portal [45] and are Level 1. Atmospheric correction based on dark object subtraction (DOS) is used to convert data from Level 1 to Level 2 (correcting the effect of electromagnetic energy scattering on water particles suspended in the atmosphere) [29,46,47].
Cloud correction, in the Landsat-8 case, is performed using a quality assessment band (BQA) which indicates which pixels could be affected by, basically, cloud contamination) [46].

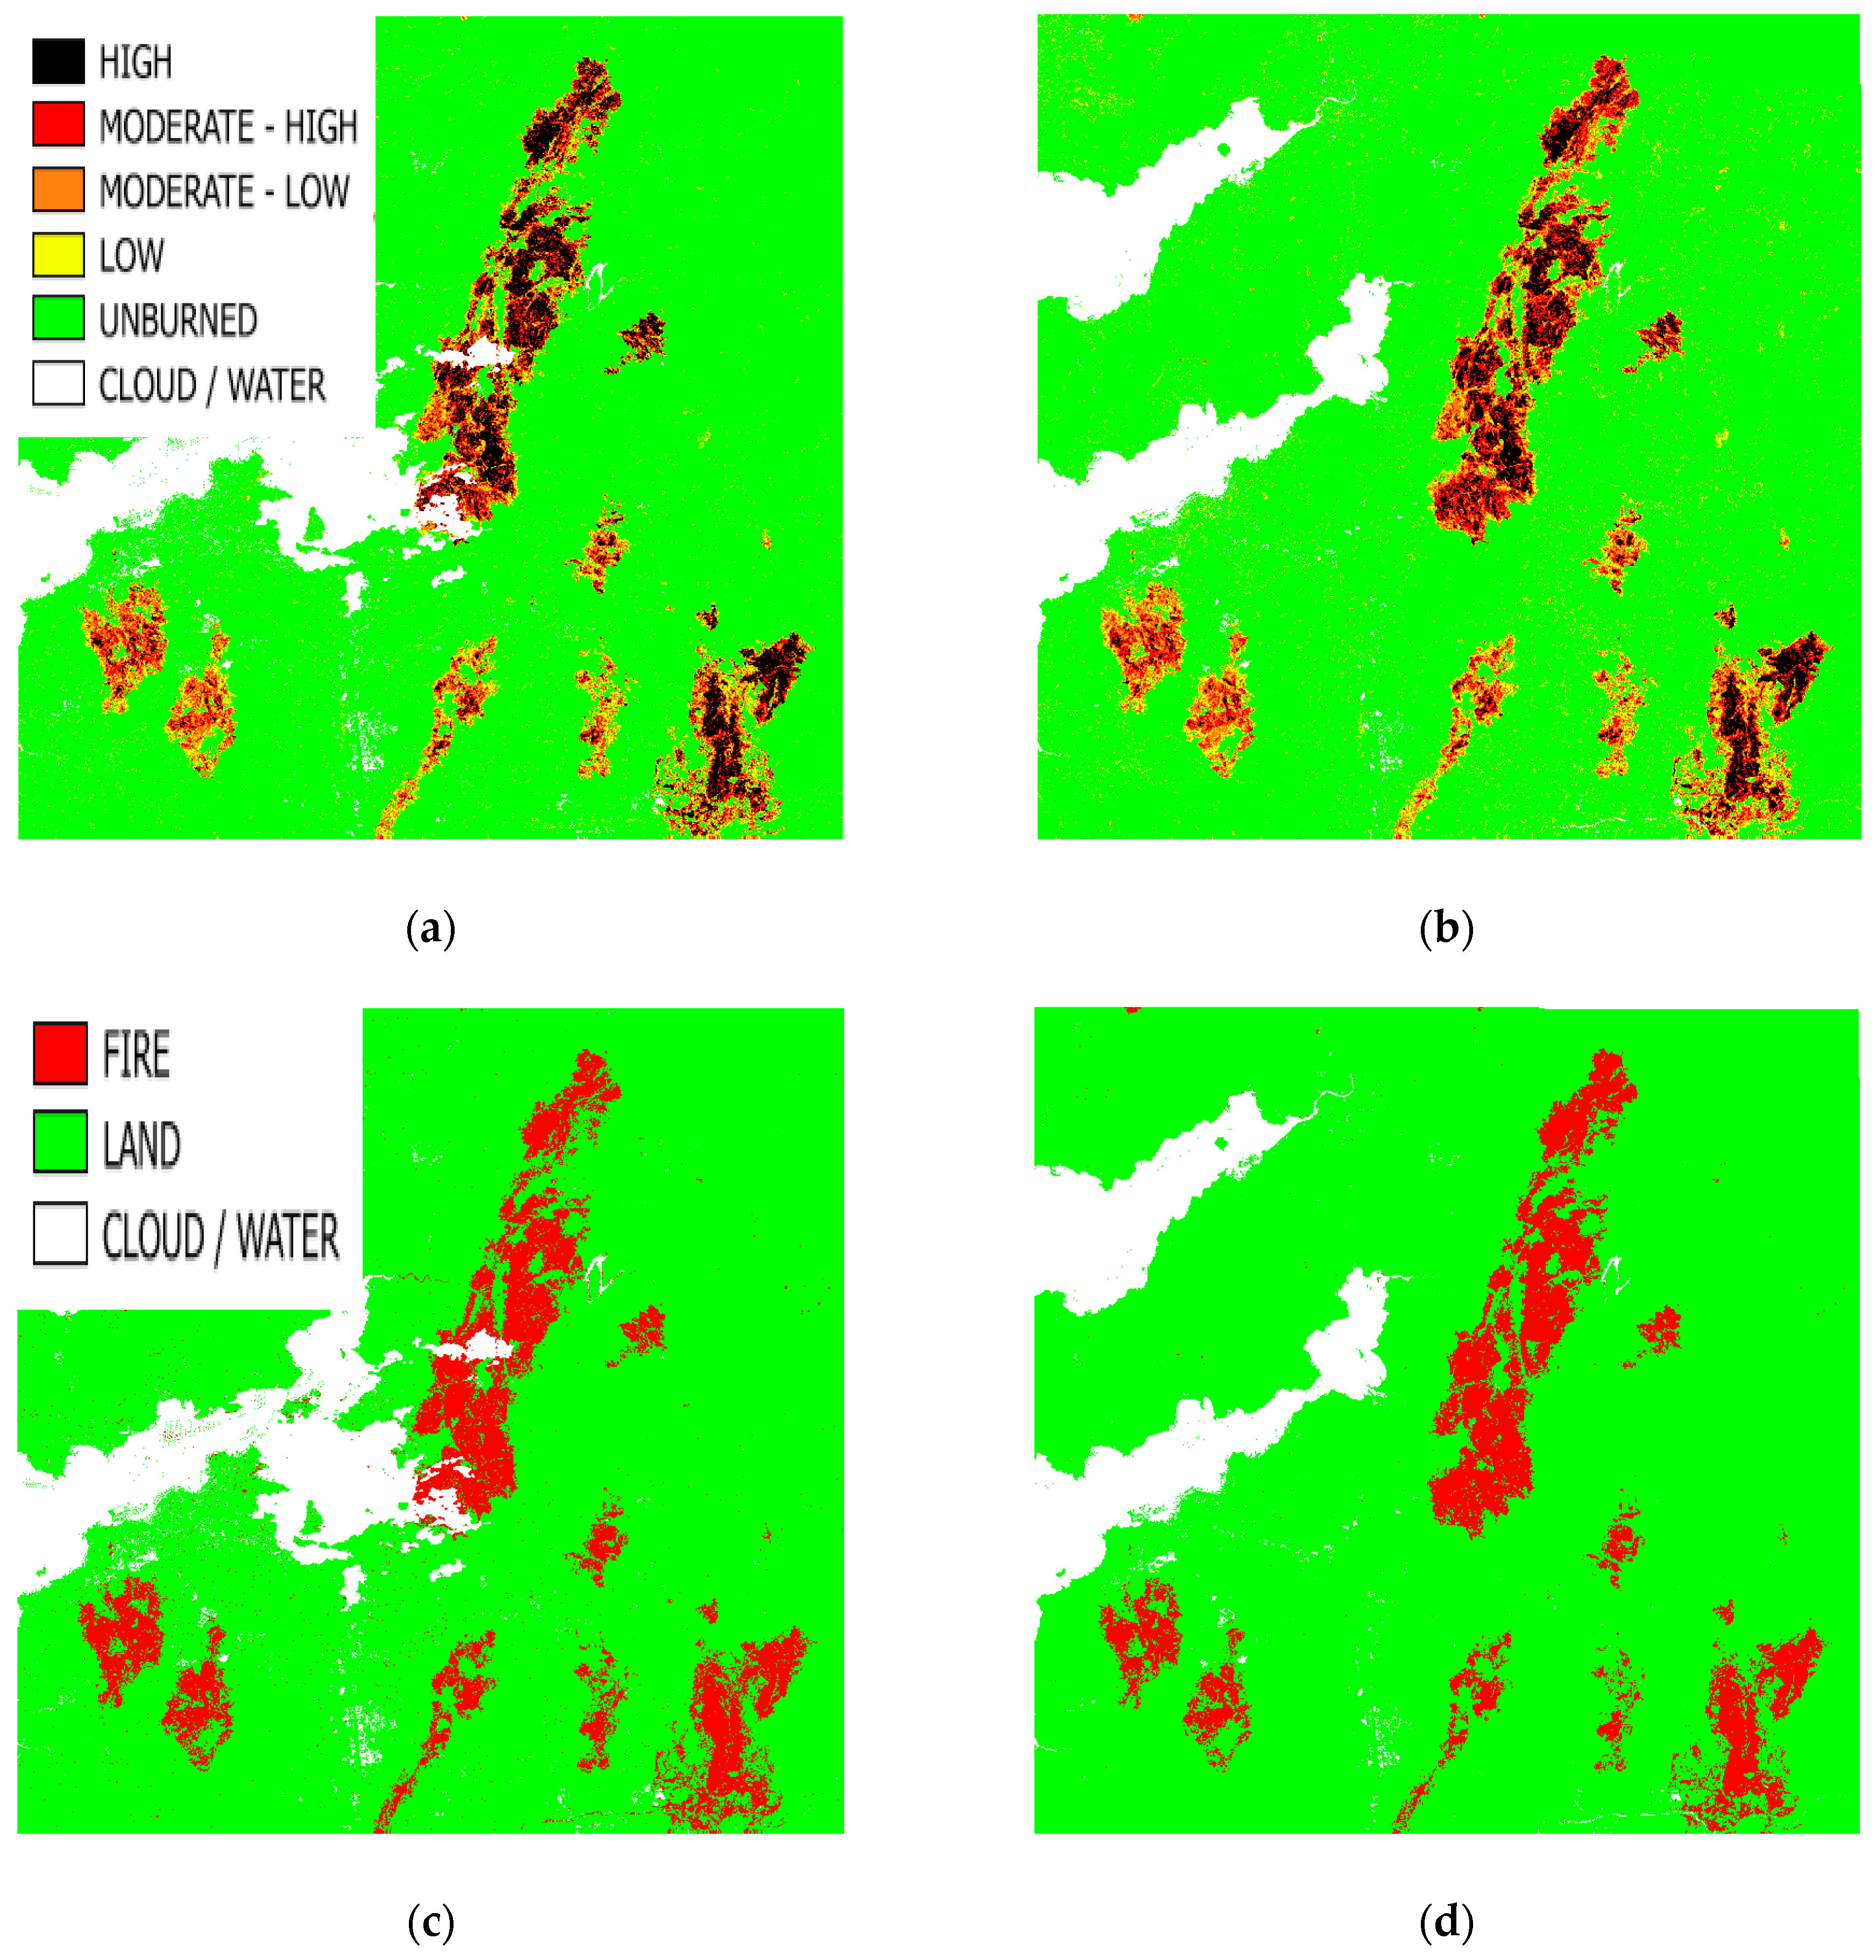
2.4. Remote Sensing Indices
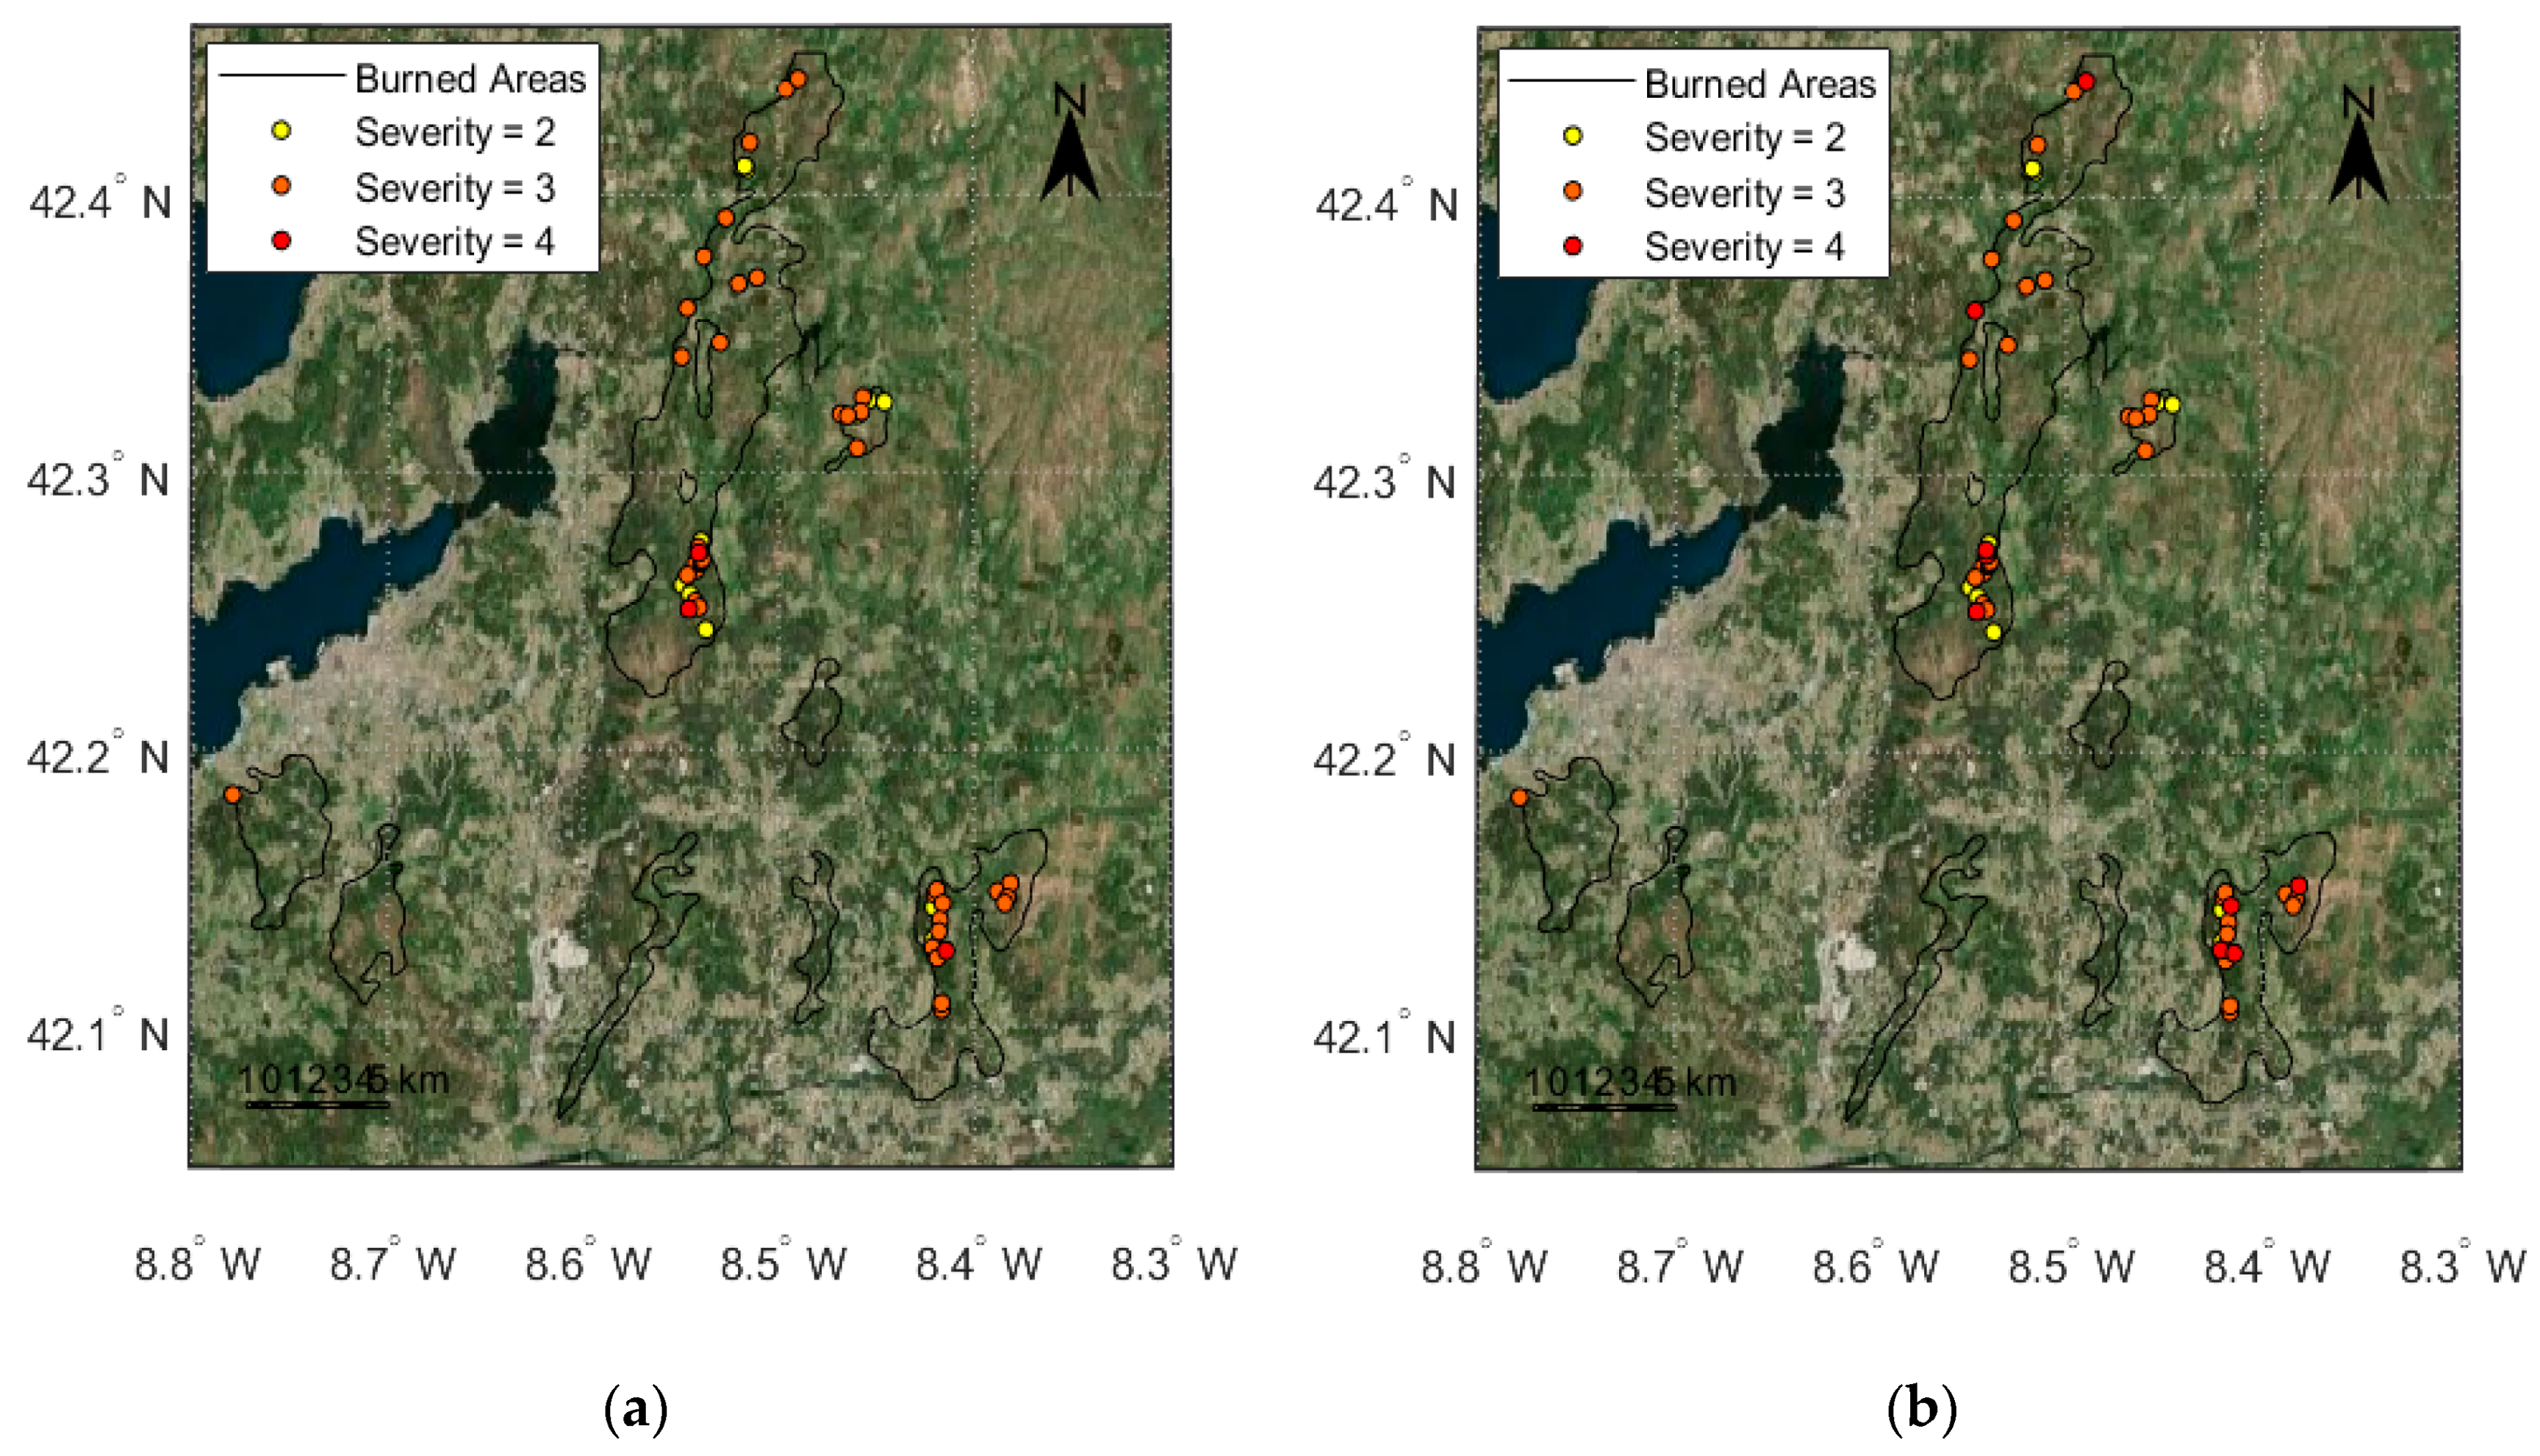
Within remote sensing applied to forest fires, it is observed that the ideal spectral indices algorithms for different soil severity degrees discrimination should contain, mainly, the red, NIR and SWIR bands (higher reflectance difference between burned and no burned area) [48]. For this reason, the spectral indices used are NBR (Equation (1)) and NDVI (Equation (2)) [14,15,16].
N B R = ( N I R S W I R ) ( N I R + S W I R )
N D V I = ( N I R R e d ) ( N I R + R e d )
In addition to the NBR and NDVI indices, subtracting a post-fire from a pre-fire image derived index produces a measure of absolute change (more reliable) which then can be used to estimate burned areas, burn severity, total carbon release, biomass loss or smoke production, among others [31,49,50,51]. For this reason, dNBR and dNDVI indices are the final algorithms used (Equations (3) and (4)).
d N B R = N B R P R E F I R E N B R P O S T F I R E
d N D V I = N D V I P R E F I R E N D V I P O S T F I R E
The dNBR image can be classified according to the classification proposed by the United States Geological Survey (USGS) [46]. The USGS dNBR classification thresholds work for both satellites. This classification groups the pixels into different levels of burn severity (Table 1).
The dNDVI index can also be classified. In this case, pixel values greater than 0 mean that there has been a negative change in vegetation cover (post-fire NDVI values are lower due to the vegetation amount decrease caused, mainly, by fire influence in the area). Since not all vegetation cover decreases is necessarily related to the appearance of forest fires (they could be due to agricultural processes, pests or periods of drought, among others), any pixel value higher than 0.1 shall be considered a fire.
As in the case of clouds and pixels with errors eliminated, in the study area there are water regions that can cause confusion in spectral indices’ algorithms. To eliminate water bodies the normalized difference water index (NDWI) is proposed (Equation (5)) [52].
N D W I = ( G r e e n N I R ) ( G r e e n + N I R )
A mask is created where values greater than zero are classified as water. This water mask is combined with cloud masks and applied to dNBR and dNDVI images as can be seen in Figure 2.

2.5. Severity Data

Fire severity data collection started with a random sampling within burned areas, assigning sampling plots to areas where vegetation burned with homogenous severity. For that purpose, the dNBR index was calculated from satellite images (if possible Sentinel-2) to delimit homogenous areas (minimum size 3 × 3 pixels must be considered) of high severity on vegetation, i.e., areas where the vegetation was fully consumed. Once those areas of interest where identified, the center coordinates of each sampling plot were assigned. In fieldwork, soil burn severity was assessed in 20 m radius plots by using center coordinates. Within the plot, two transects of 40 m perpendicular to each other were established (using random direction) and soil severity was measured with 1 m interval along those transects. The degree of burn severity was evaluated by the mean value assigned to each quadrant of the same burn severity. There are two different types of classification. On the one hand, the five burn severity degrees [53] are as follows: 1 (very low severity) is highly decomposed organic material of unidentifiable origin (Oa) partially or totally intact; mineral soil undisturbed, 2 (low severity) is Oa layer totally charred and covering mineral soil; possibly some ash; mineral soil undisturbed, 3 is (medium severity) forest floor completely consumed (bare soil) but soil organic matter not consumed and surface soil intact, 4 is (high severity) forest floor that has been completely consumed and there is no charred residue; bare soil and soil structure affected and 5 (Very High severity) is as 4 with color altered (reddish). On the other hand, six burn severity degrees classification [27] is a modification of five burn severity degrees classification but, in this case, the four degree classification is divided in two sublevels (4 and 5) where four degree has the affected soil thickness less than 1 cm and 5 degree has the affected soil thickness equal to or more than 1 cm. The six degree classification is the same that five degree in five burn severity degrees classification. Table 2 summarizes both classifications and the number of points measured in situ.
In this study area, there are three different burn severity degrees (low, medium and high severity) for the two classifications (Table 2). Figure 3 shows points distribution.

2.6. Statistical Analysis
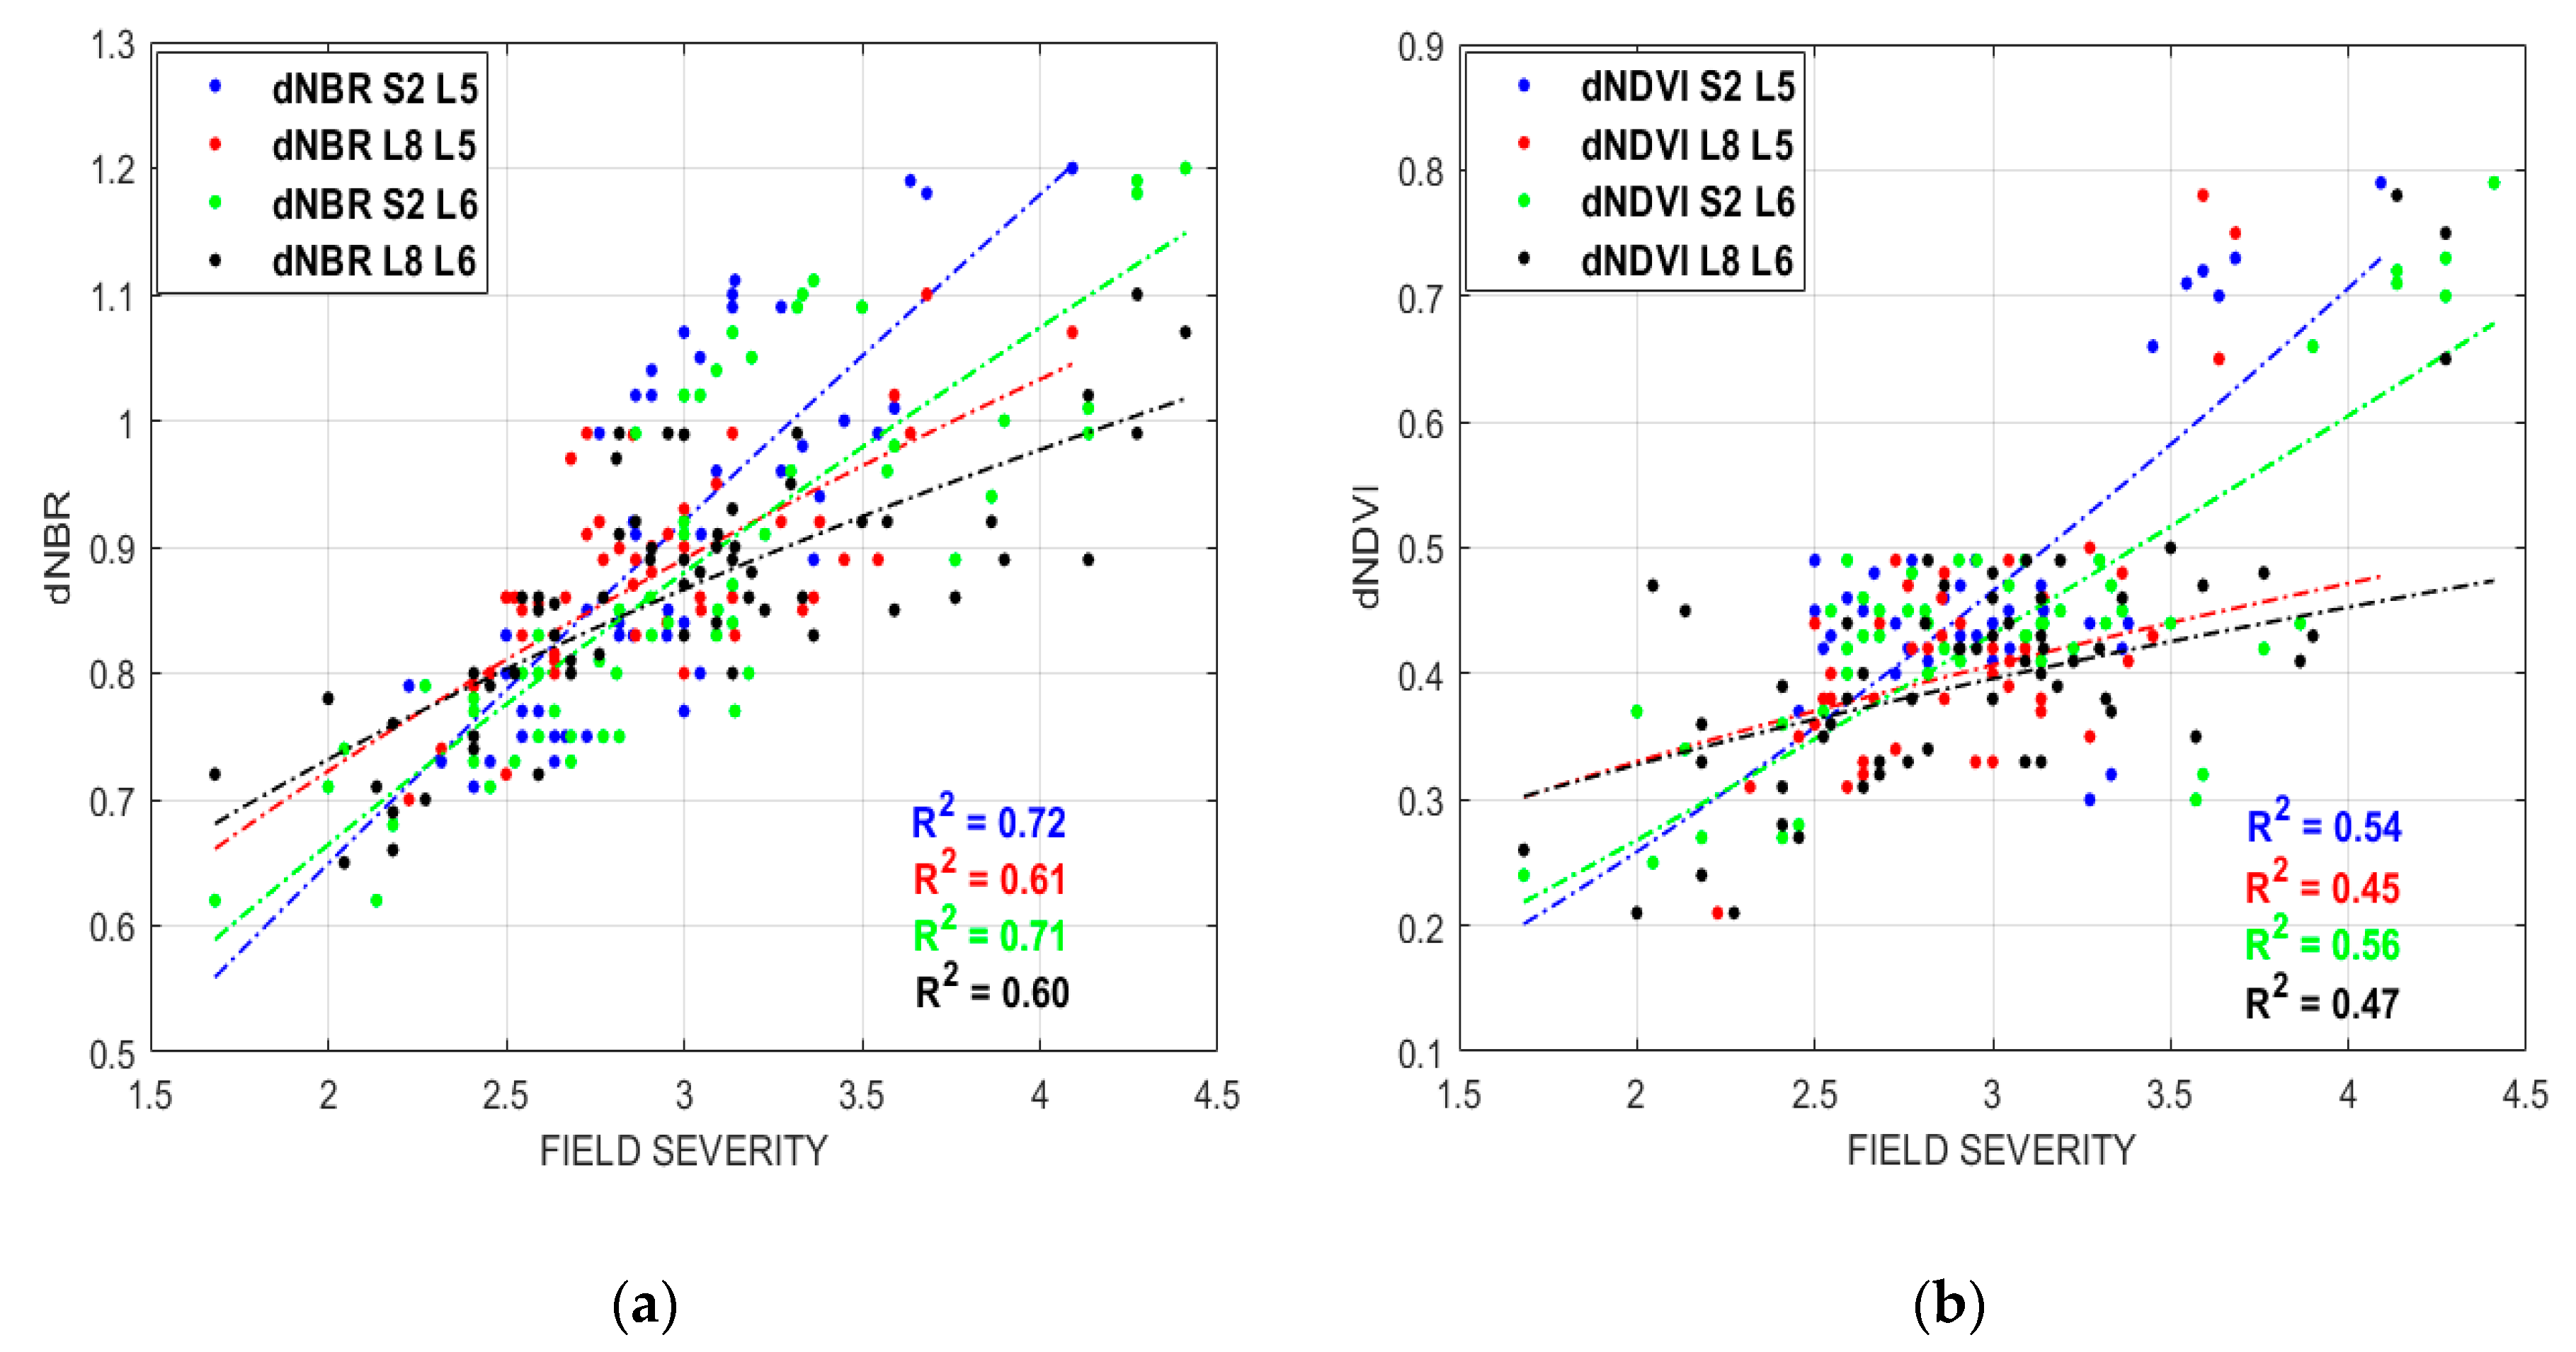
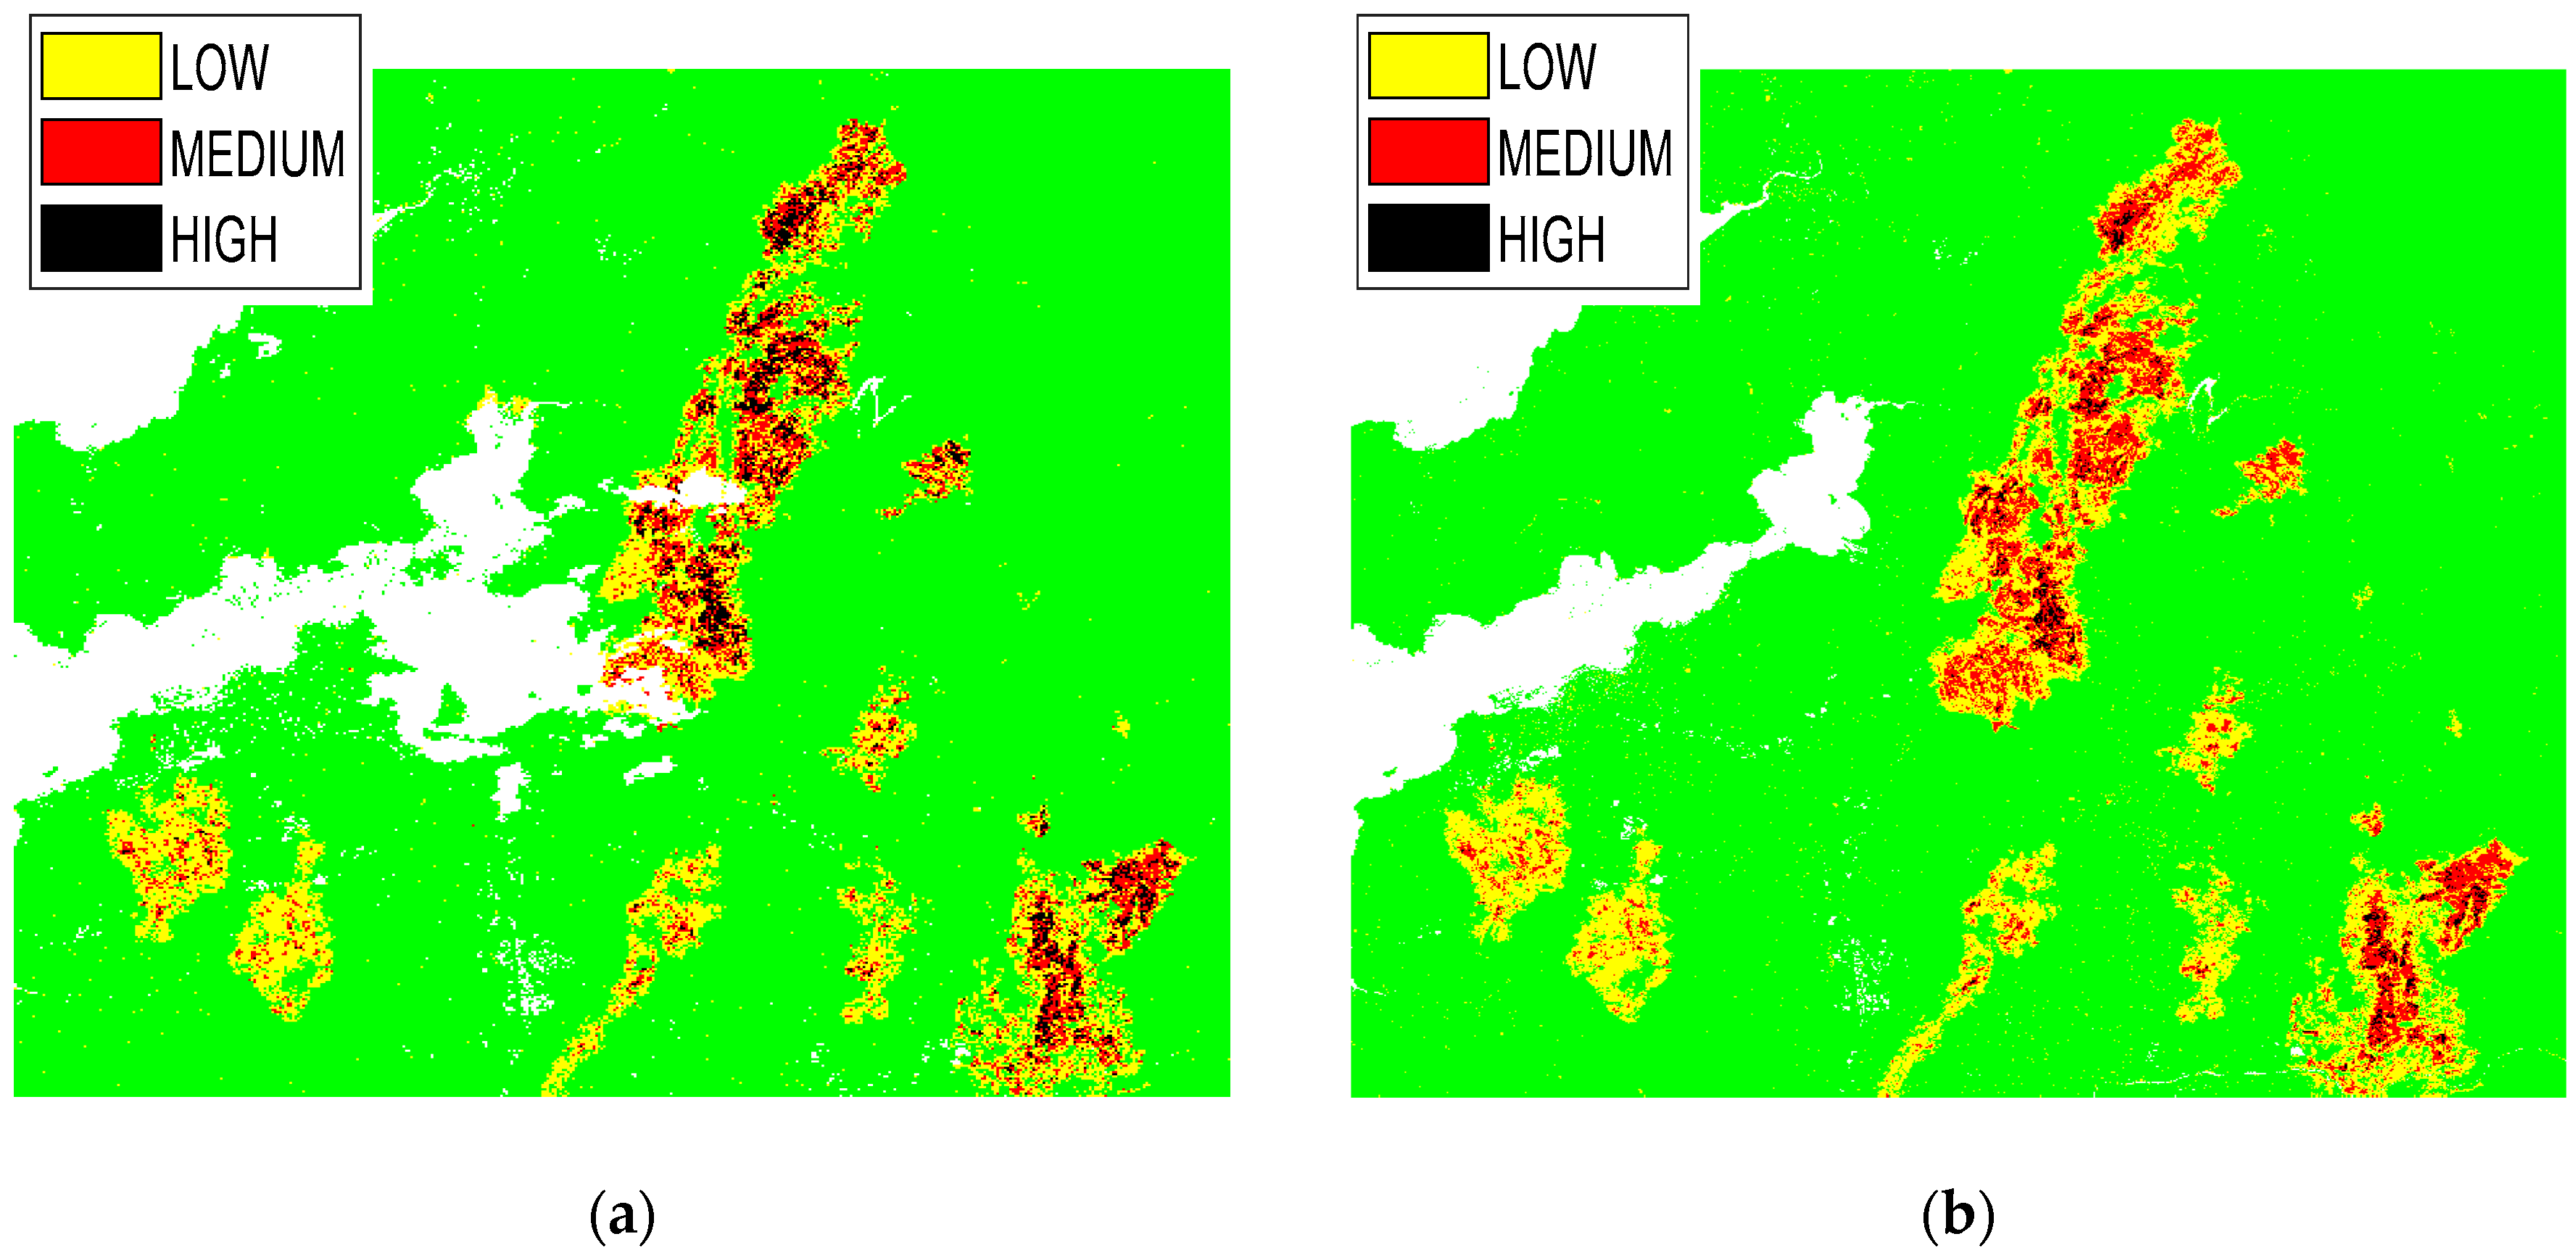
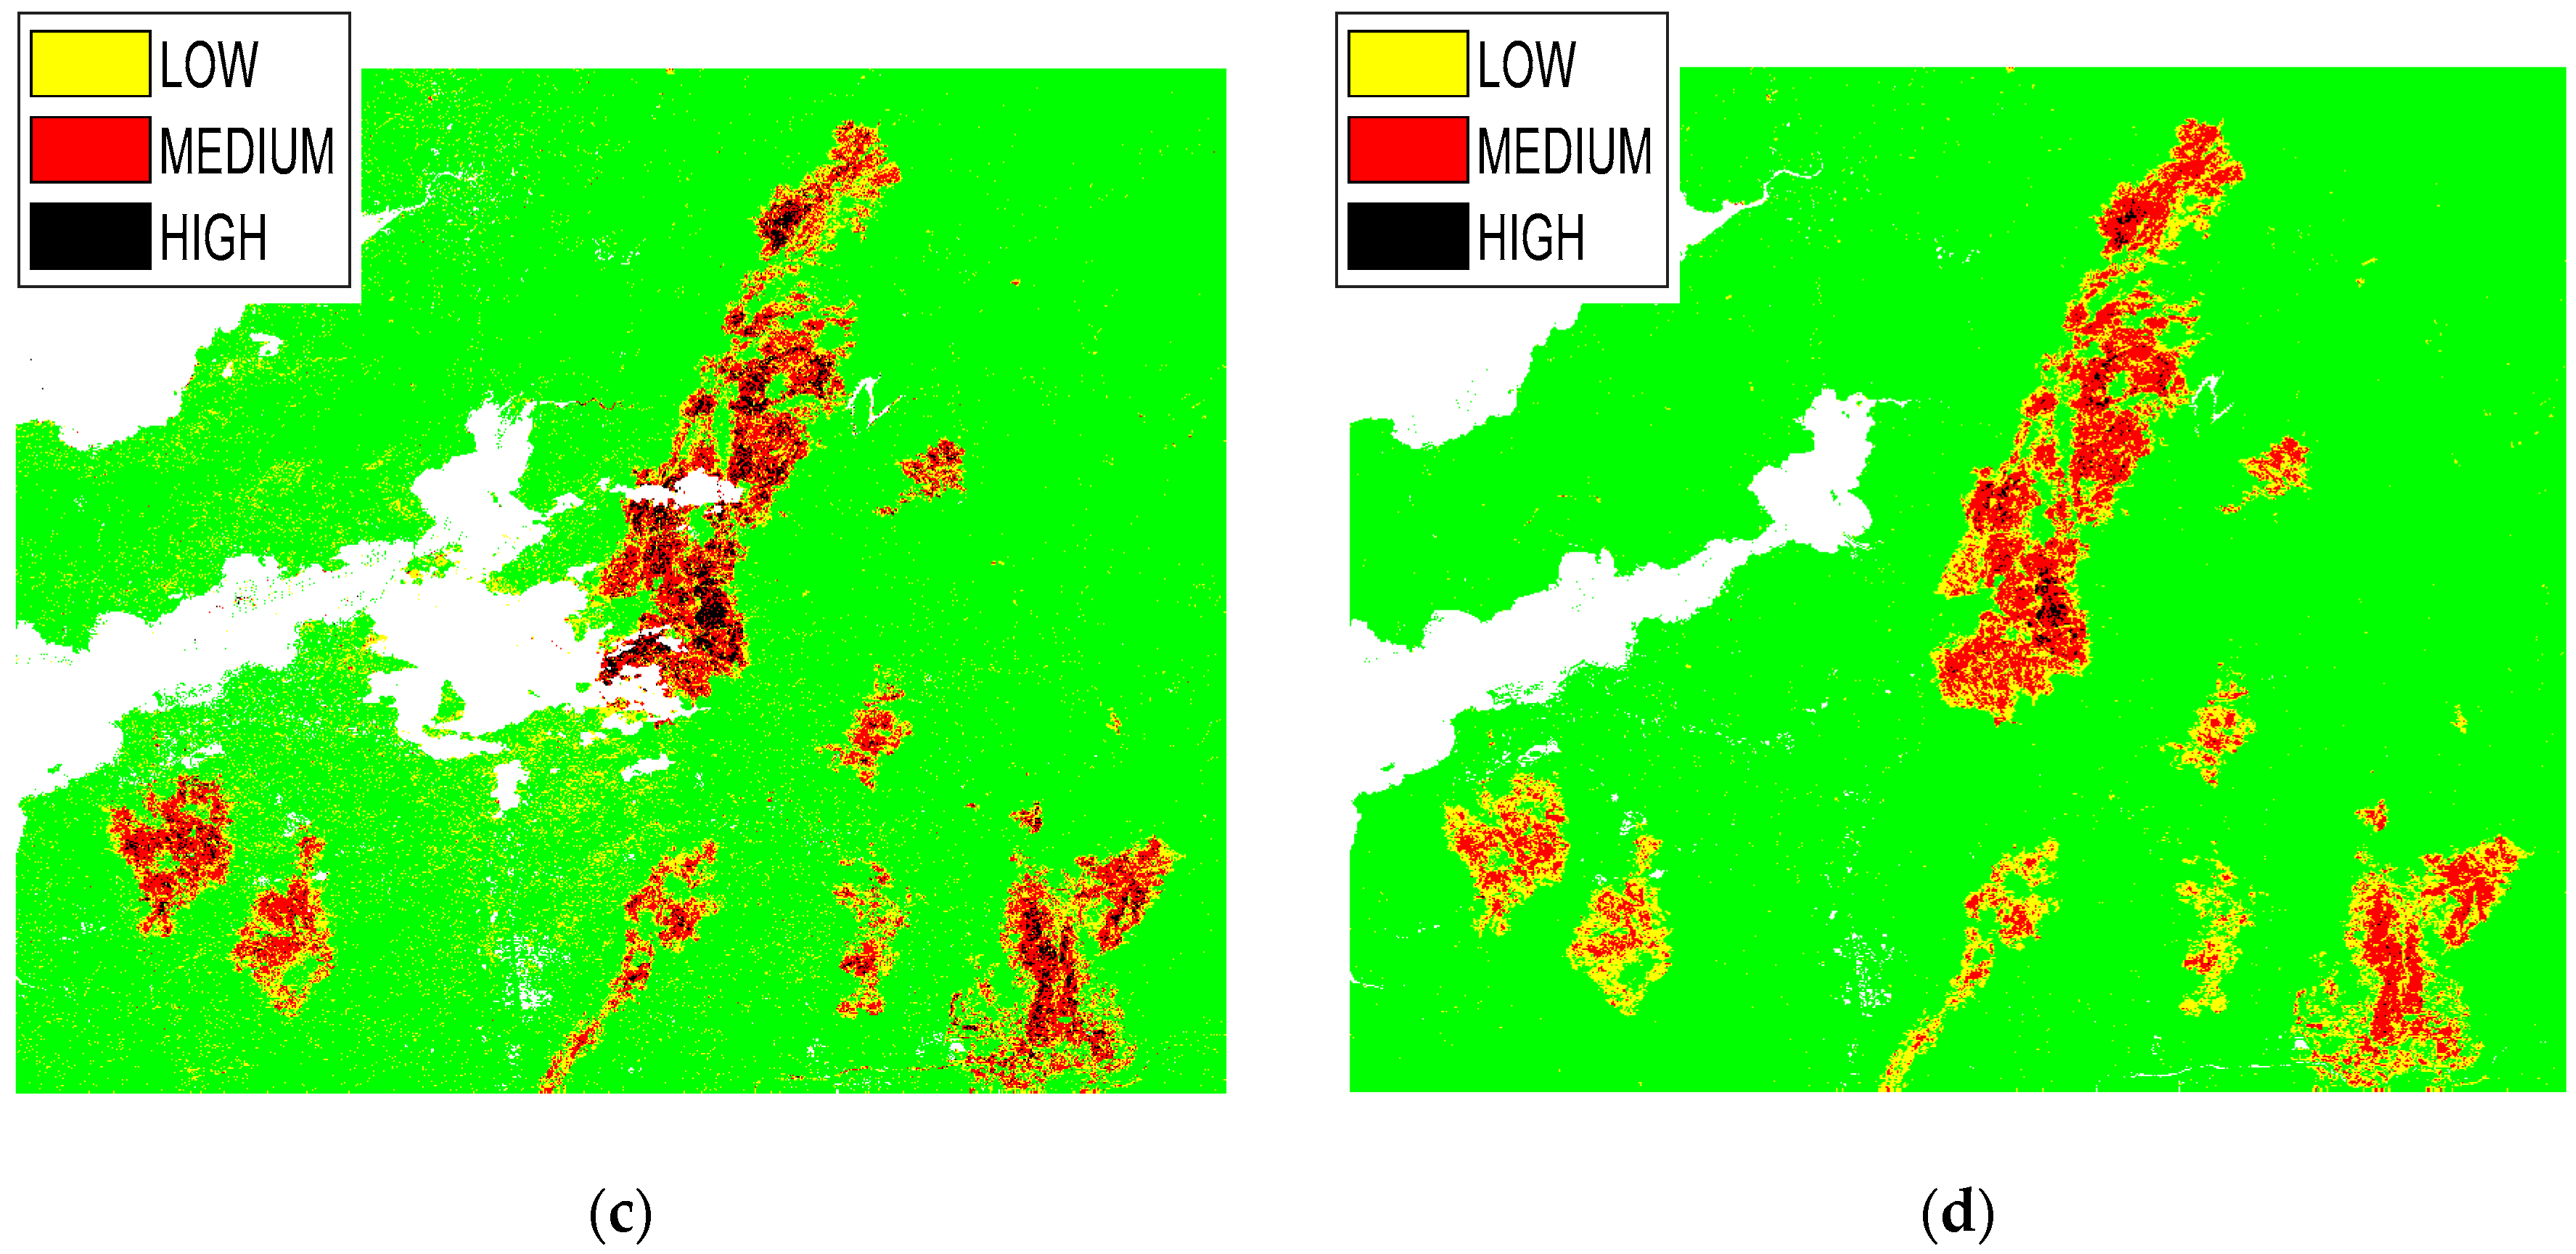
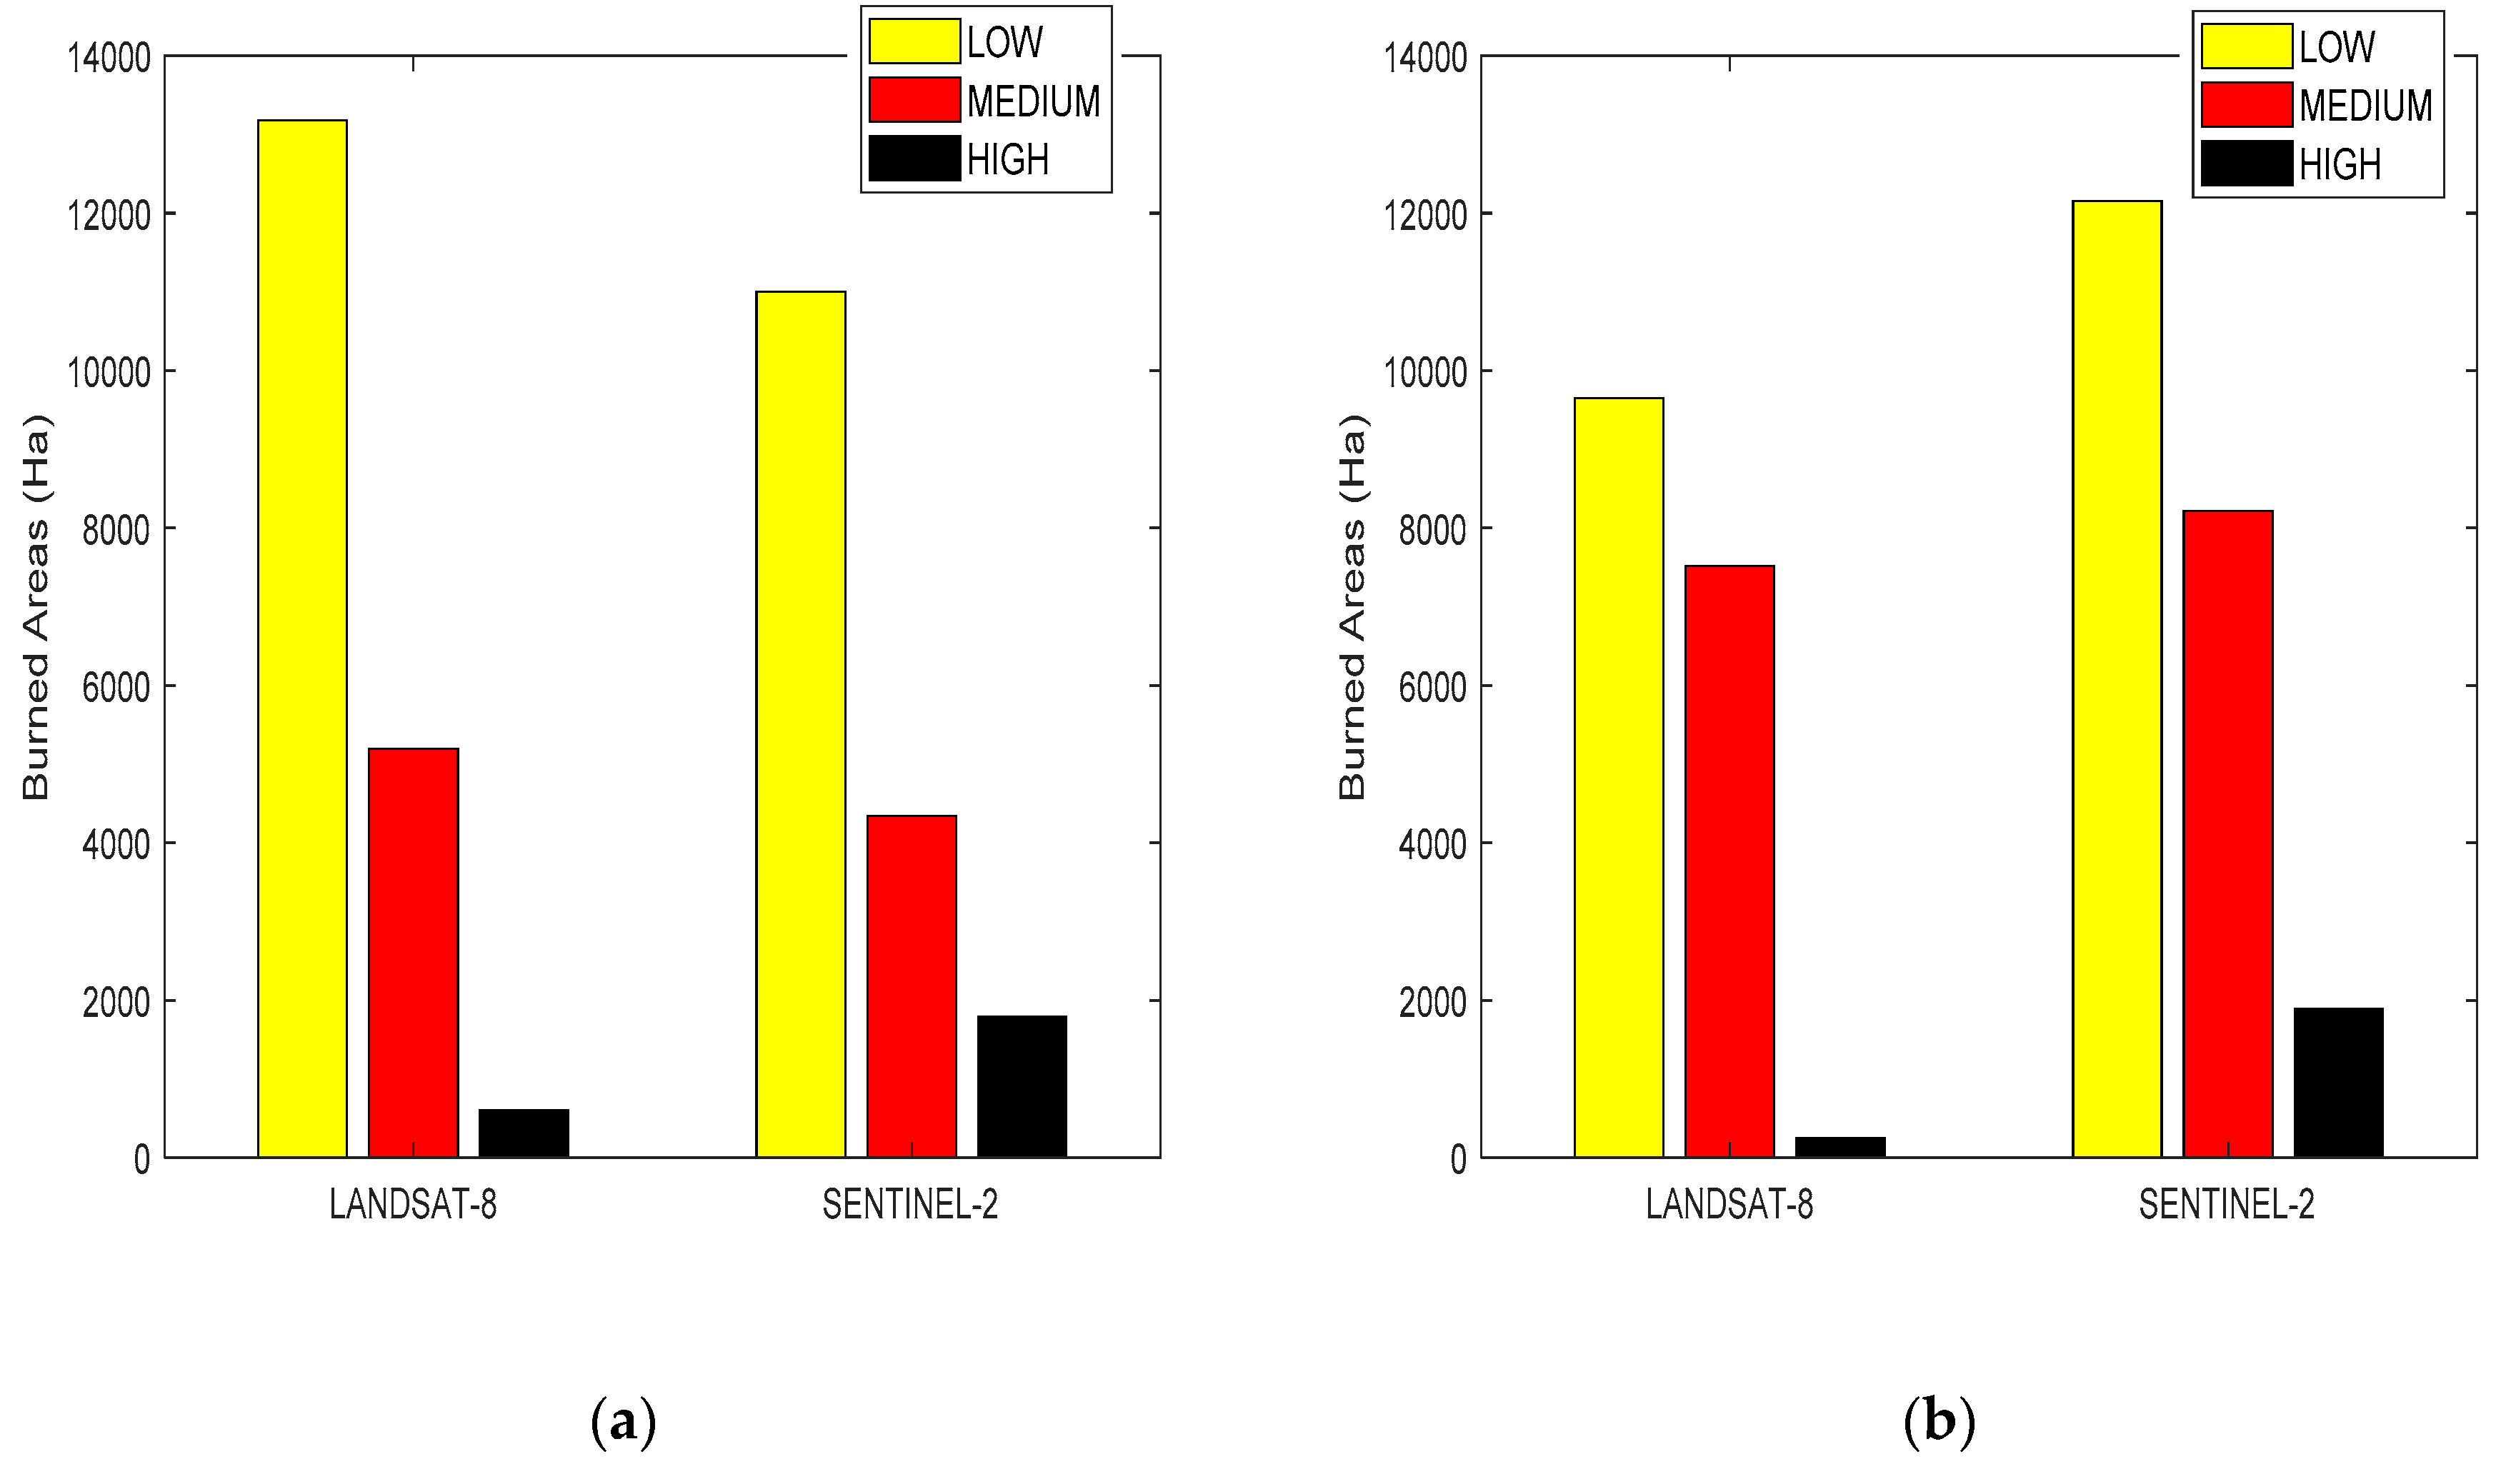
In order to establish relationships between remote sensing and field data, regression models were used. In this case, field data were chosen as predicted values (high correlation with reality) and satellite information (dNBR and dNDVI) as dependent variables. After carrying out different tests, the conclusion was reached that (since there is no linear relationship between variables) the statistical method that offers the best results in determination coefficient and root square mean error (high R2 and low RMSE) should be chosen (Table 3). Taking into account the above criteria, the regression model that offers the best results is the power regression (Equation (6)).
y = a x b
The y variable is the dependent variable (remote sensing data), x is the predicted value (field severity) and, a and b variables are the coefficients (with 95% confidence bounds). In addition to regression models, to select the spectral index that best relates to field severity, an accuracy pixel classification table (Table 5) is calculated using the thresholds of each index (mean and standard deviation as a function of the field severity degrees shown in Table 2) to evaluate the accuracy pixel classification using Matlab software.

3. Results

The Pontevedra fires have an average soil burn severity value of 2.9 (average between the five- and six-field severity classification). In other words, the average severity (obtained from 61 field plots) corresponds to medium category (Table 2).
The regression models of spectral indices (dNBR and dNDVI) with field severity (FS) are presented in the values shown in Table 3 and Figure 4.
In order to obtain the thresholds for each spectral index that best discriminates the different field severity degrees, the FS value in Table 3 is replaced for all field points, and the mean and standard deviation are obtained (Table 4).
As a result of the minimal difference in the equations (Table 3) between indices as a function of field severity degrees (5 or 6), thresholds are the same in both cases. Figure 5 shows the images classification for each index using the Table 4 thresholds.
In addition to images below, Table 5 shows the percentage of field sites correctly classified of each spectral index and severity degrees classification used, and Figure 6 shows the number of hectares burned.
Figure 6 shows that the dNDVI image obtained with Sentinel-2 data detects more burnt area than the dNDVI image obtained with Landsat-8 data despite the presence of clouds. This is due to the presence of noise pixels (classified as low severity) that increase the burned surface.

4. Discussion

First, this study incorporates as an innovation the field data protocol proposed by Vega et al., 2013 [52], focused on the evaluation of soil burn severity in areas where vegetation was completely consumed by fire. Therefore, the analysis differs from previous studies using the Composite Burn Index (CBI) or a modified version (GeoCBI), which combine vegetation and soil severities measures [28,29,30,31,32,33,54,55,56,57].
The use of a statistical analysis based on a potential regression is due to the low linear relationship between remote-sensing data and field measurements as found in previous published research [28,33]. This fact is due to different factors such as saturation in the SWIR bands and the NIR bands values decreasing (especially in high-severity areas) [57].
The R2 coefficient obtained are lower (range 0.56 to 0.72 for dNBR and range 0.47 to 0.56 for dNDVI) than obtained by Mallinis et al., 2018 (range 0.83 to 0.86 for dNBR and range 0.78 to 0.8 for dNDVI) [57]. In other previous studies [28,34], despite the use of other remote-sensing data (for example, Landsat 7 or Landsat TM), the R2 similarity obtained is greater (0.69 for dNBR and 0.46 for dNDVI, respectively).
On the other hand, the dNBR thresholds obtained are influenced by the data collection protocol (all the field points measured are located in areas whose severity dNBR was classified as high severity, i.e., dNBR ≥ 0.66). Despite this, the dNBR and dNDVI thresholds obtained are very similar to those obtained by Navarro et al., 2017 (low severity ≤ 0.5, 0.5 < medium severity ≤ 0.9, high severity > 0.9 in dNBR case, and low severity ≤ 0.4, 0.4 < medium severity ≤ 0.5, high severity > 0.5 in dNDVI case), the only considerable difference is the dNBR low class value [58].
Finally, because there are no studies that analyse classification accuracy using the dNDVI index in forest fires, the classification success percentage results (Table 5) can only be compared for the dNBR index. The results obtained are very similar to those obtained by Mallinis et al., 2018 study (73.5% in Sentinel-2 and 71% in Landsat-8) [57]. The classification accuracy is higher in all classes except for low and high classes in Landsat-8 satellite case (77% and 88%, respectively). In addition, in this study, the dNBR index detects more burned area for the low class (12,100 Ha) and less burned area for the medium class (5100 Ha) than the dNDVI index (11,050 and 7970 Ha, respectively).

5. Conclusions

The use of synergy between field-measured severity data and remote-sensing data has become a fundamental tool for the burned areas’ restoration. It is concluded that remote-sensing information that best discriminates between different severity degrees is the Sentinel-2 data. The reason for this is that the Sentinel-2 spatial resolution (20 m) is similar to the field measurement area (20 m of radius).
In addition, the strong relationship between dNBR index and forest fires improves the dNDVI index results. This is a consequence of the essential information provided by the SWIR spectral range where reflectance increase after a forest fire occurrence (vegetation becomes soil and reduces considerably the H20 absorption phenomenon). Despite this, dNDVI index obtained by Sentinel-2 data provides good results in severity map classification, especially for medium and high classes (86% and 80%, respectively). This makes it, together with the dNBR index, a reliable algorithm for works related to erosion derived after a forest fire (higher erosion when increase the fire severity).
As far as field measurements are concerned, the 5 degrees of fire severity classification provides, in general, slightly better results in R2 than the 6 degrees of fire severity classification. Although, a priori, it would be logical for remote-sensing data not to be able to differentiate between two severity degrees which are different only by the depth of damage, it would be necessary to carry out more tests using many plots and in areas with different climates to clarify this fact.
Finally, this study provides a new line of research where field data are more focused on fire severity suffered by soil (the CBI index, used in most works, is focused on vegetation). This represents a new approach for future works where, in addition to the management of a post-fire zone, relationships between fire severity and the soil texture alteration together with existing soil chemical components will be the objective. This will require, as in the case of field measurements, a larger and more heterogeneous field database and the integration of new spectral indices by remote-sensing data.

Author Contributions

Conceptualization, J.A.S. and C.F.; Formal analysis, R.L.; Funding acquisition, J.A.S. and C.F.; Investigation, J.A.S., C.F., J.M.F.-A. and J.A.V.; Methodology, J.A.S., C.F. and J.A.V.; Project administration, J.A.S.; Resources, J.A.S.; Software, R.L.; Supervision, J.A.S., C.F. and J.A.V.; Visualization, R.L.; Writing—Original draft, J.A.S. and R.L.; Writing—Review and editing, J.A.S., R.L., C.F., J.M.F.-A. and J.A.V.

Funding

This research was funded by the research project EPyRIS, which is part of the Interreg SUDOE program of the European Union, project number SOE2/P5/E0811.

Acknowledgments

The authors thank the editor-in-chief, the anonymous associate editor, and the reviewers for their systematic review and valuable comments.

Conflicts of Interest

The authors declare no conflict of interest

References

  1. Chuvieco, E.; Aguado, I.; Yebra, M.; Nieto, H.; Salas, J.; Martín, M.P.; Vilar, L.; Martínez, J.; Martín, S.; Ibarra, P.; et al. Development of a framework for fire risk assessment using remote sensing and geographic information system technologies. Ecol. Model. 2010, 221, 46–58. [Google Scholar] [CrossRef]
  2. FAO. Fire Management Global Assessment 2006; FAO Forestry Paper No. 151; FAO: Rome, Italy, 2007. [Google Scholar]
  3. Omi, P.N. Theory and Practice of Wildland Fuels Management. Curr. For. Rep. 2015, 1, 100–117. [Google Scholar] [CrossRef] [Green Version]
  4. Pyne, S.J. Essays on science and society: The fires this time, and next. Science 2001, 294, 1005–1006. [Google Scholar] [CrossRef] [PubMed]
  5. Westerling, A.L. Warming and Earlier Spring Increase Western U.S. Forest Wildfire Activity. Science 2006, 313, 940–943. [Google Scholar] [CrossRef] [PubMed] [Green Version]
  6. Chuvieco, E. Satellite Observation of Biomass Burning. In Earth Observation of Global Change; Springer: Dordrecht, The Netherlands, 2008; pp. 109–142. [Google Scholar]
  7. Chuvieco, E.; Riaño, D.; Van Wagtendok, J.; Morsdof, F. Fuel loads and fuel type mapping. In Wildland Fire Danger Estimation and Mapping: The Role of Remote Sensing Data; World Scientific Publishing Co Pte Ltd.: Washington, DC, USA, 2003; pp. 119–142. [Google Scholar]
  8. Chuvieco, E. Global impacts of fire. In Earth Observation of Wildland Fires in Mediterranean Ecosystems; Springer: Berlin/Heidelberg, Germany, 2009; pp. 1–10. [Google Scholar]
  9. Goetz, S.J.; Mack, M.C.; Gurney, K.R.; Randerson, J.T.; Houghton, R.A. Ecosystem responses to recent climate change and fire disturbance at northern high latitudes: Observations and model results contrasting northern Eurasia and North America. Environ. Res. Lett. 2007, 2, 045031. [Google Scholar] [CrossRef]
  10. Hicke, J.A.; Asner, G.P.; Randerson, J.T.; Tucker, C.; Los, S.; Birdsey, R.; Field, C. Trends in North American net primary productivity derived from satellite observations, 1982–1998. Glob. Biogeochem. Cycles 2002, 16. [Google Scholar] [CrossRef]
  11. Kennedy, R.E.; Cohen, W.B.; Schroeder, T.A. Trajectory-based change detection for automated characterization of forest disturbance dynamics. Remote Sens. Environ. 2007, 110, 370–386. [Google Scholar] [CrossRef]
  12. Kennedy, R.E.; Yang, Z.; Cohen, W.B. Detecting trends in forest disturbance and recovery using yearly Landsat time series: 1. LandTrendr—Temporal segmentation algorithms. Remote Sens. Environ. 2010, 114, 2897–2910. [Google Scholar] [CrossRef]
  13. French, N.H.; Kasischke, E.S.; Hall, R.J.; Murphy, K.A.; Verbyla, D.L.; Hoy, E.E.; Allen, J.L. Using Landsat data to assess fire and burn severity in the North American boreal forest region: An overview and summary of results. Int. J. Wildland Fire 2008, 17, 443–462. [Google Scholar] [CrossRef]
  14. Key, C.H.; Benson, N.C. Landscape assessment: Remote sensing of severity, the normalized burn ratio and ground measure of severity, the composite burn index. In FIREMON: Fire Effects Monitoring and Inventory System; USDA Forest Service, Rocky Mountain Res. Station: Ogden, UT, USA, 2005. [Google Scholar]
  15. Kushla, J.D.; Ripple, W.J. Assessing wildfire effects with Landsat thematic mapper data. Int. J. Remote Sens. 1998, 19, 2493–2507. [Google Scholar] [CrossRef]
  16. Díaz-Delgado, R.; Lloret, F.; Pons, X. Influence of fire severity on plant regeneration by means of remote sensing imagery. Int. J. Remote Sens. 2003, 24, 1751–1763. [Google Scholar] [CrossRef]
  17. Drusch, M.; Del Bello, U.; Carlier, S.; Colin, O.; Fernandez, V.; Gascon, F.; Hoersch, B.; Isola, C.; Laberinti, P.; Martimort, P.; et al. Sentinel-2: ESA’s optical high-resolution mission for GMES operational services. Remote Sens. Environ. 2012, 120, 25–36. [Google Scholar] [CrossRef]
  18. Barsi, J.A.; Lee, K.; Kvaran, G.; Markham, B.L.; Pedelty, J.A. The spectral response of the Landsat-8 operational land imager. Remote Sens. 2014, 6, 10232–10251. [Google Scholar] [CrossRef]
  19. Chavez, P.S., Jr. An improved dark-object subtraction technique for atmospheric scattering correction of multispectral data. Remote Sens. Environ. 1988, 24, 459–479. [Google Scholar] [CrossRef]
  20. Ding, H.; Shi, J.; Wang, Y.; Wei, L. An improved dark-object subtraction technique for atmospheric correction of Landsat 8. In MIPPR 2015: Remote Sensing Image Processing, Geographic Information Systems, and Other Applications; International Society for Optics and Photonics: Bellingham, WA, USA, 2015. [Google Scholar]
  21. Gao, B.C.; Kaufman, Y.J. Selection of the 1.375 micrometer MODIS Channel for Remote Sensing of Cirrus Clouds and Stratospheric Aerosols from Space. J. Atmos. Sci. 1995, 52, 4231–4237. [Google Scholar] [CrossRef]
  22. Sousa, W.P. The role of disturbance in natural communities. Annu. Rev. Ecol. Syst. 1984, 15, 353–391. [Google Scholar] [CrossRef]
  23. Keeley, J.E. Fire intensity, fire severity and burn severity: A brief review and suggested usage. Int. J. Wildland Fire 2009, 18, 116–126. [Google Scholar] [CrossRef]
  24. Lutes, D.C.; Keane, R.E.; Caratti, J.F.; Key, C.H.; Benson, N.C. (Eds.) FIREMON: Fire effects monitoring and inventory system. In Gen. Tech. Rep.; RMRS-GTR-164-Cd; USDA Forest Service; Rocky Mountain Research Station: Fort Collins, CO, USA, 2006; pp. 1–55. [Google Scholar]
  25. De Santis, A.; Chuvieco, E. GeoCBI: A modified version of the Composite Burn Index for the initial assessment of the short-term burn severity from remotely sensed data. Remote Sens. Environ. 2009, 113, 554–562. [Google Scholar] [CrossRef]
  26. Moody, J.A.; Shakesby, R.A.; Robichaud, P.R.; Cannon, S.H.; Martin, D.A. Current research issues related to post-wildfire runoff and erosion processes. Earth Sci. Rev. 2013, 122, 10–37. [Google Scholar] [CrossRef]
  27. Fernández, C.; Vega, J.A. Modelling the effect of soil burn severity on soil erosion at hillslope scale in the first year following wildfire in NW Spain. Earth Surf. Process. Landf. 2016, 41, 928–935. [Google Scholar] [CrossRef]
  28. Arellano, S.; Vega, J.A.; Rodríguez y Silva, F.; Fernández, C.; Vega-Nieva, D.; Álvarez-González, J.G.; Ruiz-González, A.D. Validación de los índices de teledetección dNBR y RdNBR para determinar la severidad del fuego en el incendio forestal de Oia-O Rosal (Pontevedra) en 2013. Rev. Teledetección 2017, 49, 49–61. [Google Scholar] [CrossRef]
  29. Holden, Z.A.; Morgan, P.; Evans, J.S. A predictive model of burn severity based on 20-year satellite-inferred burn severity data in a large southwestern US wilderness area. For. Ecol. Manag. 2009, 258, 2399–2406. [Google Scholar] [CrossRef]
  30. Hudak, A.T.; Morgan, P.; Bobbitt, M.J.; Smith, A.M.S.; Lewis, S.A.; Lentile, L.B.; Robichaud, P.R.; Clark, J.T.; McKinley, R.A. The relationship of multiespectral satellite imagery to immediate fire effects. Fire Ecol. 2007, 3, 64–90. [Google Scholar] [CrossRef]
  31. Miller, J.D.; Thode, A.E. Quantifying burn severity in a heterogeneous landscape with a relative version of the delta Normalized Burn Ratio (dNBR). Remote Sens. Environ. 2007, 109, 66–80. [Google Scholar] [CrossRef]
  32. Picotte, J.J.; Robertson, K.M. Validation of remote sensing of burn severity in south-eastern US ecosystems. Int. J. Wildland Fire 2011, 20, 453–464. [Google Scholar] [CrossRef]
  33. Van Wagtendonk, J.W.; Root, R.R.; Key, C.H. Comparison of AVIRIS and Landsat ETM+ detection capabilities for burn severity. Remote Sens. Environ. 2004, 92, 397–408. [Google Scholar] [CrossRef]
  34. Veraverbeke, S.; Lhermitte, S.; Verstraeten, W.W.; Goossens, R. Evaluation of pre/post-fire differenced spectral indices for assessing burn severity in a Mediterranean environment with Landsat Thematic Mapper. Int. J. Remote Sens. 2011, 32, 3521–3537. [Google Scholar] [CrossRef] [Green Version]
  35. Lewis, S.A.; Hudak, A.T.; Ottmar, R.D.; Robichaud, P.R.; Lentile, L.B.; Hood, S.M.; Cronan, J.B.; Morgan, P. Using hyperspectral imagery to estimate forest floor consumption from wildfire in boreal forests of Alaska, USA. Int. J. Wildland Fire 2011, 20, 255–271. [Google Scholar] [CrossRef] [Green Version]
  36. Marcos, E.; Fernández-García, V.; Fernández-Manso, A.; Quintano, C.; Valbuena, L.; Tárrega, R.; Calvo, L. Evaluation of Composite Burn Index and Land Surface Temperature for Assessing Soil Burn Severity in Mediterranean Fire-Prone Pine Ecosystems. Forests 2018, 9, 494. [Google Scholar] [CrossRef]
  37. Robichaud, P.R.; Lewis, S.A.; Laes, D.Y.M.; Hudak, A.T.; Kokaly, R.F.; Zamudio, J.A. Postfire soil burn severity mapping with hyperspectral image unmixing. Remote Sens. Environ. 2007, 108, 467–480. [Google Scholar] [CrossRef] [Green Version]
  38. Manuel, C.; Dıaz-Fernández, P.; Gil, L. Dirección General de Conservación de la Naturaleza. In Tercer Inventario Forestal Nacional 1997–2006, Barcelona; Ministerio de Medio Ambiente: Madrid, Spain, 2006. [Google Scholar]
  39. Ackerman, S.A. Remote sensing aerosols using satellite infrared observations. J. Geophys. Res. Atmos. 1997, 102, 17069–17079. [Google Scholar] [CrossRef]
  40. ESA. Sentinel-2 User Handbook; ESA Standard Document. 64; European Spatial Agency: Noordwijk, The Netherlands, 2015. [Google Scholar]
  41. Copernicus Open Access Hub. Available online: https://scihub.copernicus.eu/dhus/#/home (accessed on 10 January 2019).
  42. Kaufman, Y.; Sendra, C. Algorithm for automatic atmospheric corrections to visible and near-IR satellite imagery. Int. J. Remote Sens. 1988, 9, 1357–1381. [Google Scholar] [CrossRef]
  43. Gascon, F.; Bouzinac, C.; Thépaut, O.; Jung, M.; Francesconi, B.; Louis, J.; Languille, F. Copernicus Sentinel-2A calibration and products validation status. Remote Sens. 2017, 9, 584. [Google Scholar] [CrossRef]
  44. Muller-Wilm, U.; Louis, J.; Richter, R.; Gascon, F.; Niezette, M. Sentinel-2 level 2A prototype processor: Architecture, algorithms and first results. In Proceedings of the 2013 ESA Living Planet Symposium, Edinburgh, UK, 9–13 September 2013. [Google Scholar]
  45. Earthexplorer. Available online: https://earthexplorer.usgs.gov (accessed on 10 January 2019).
  46. U.S. Geological Survey. Landsat—Earth Observation Satellites; Version 1.1; U.S. Geological Survey Fact Sheet 2015–3081; U.S. Geological Survey: Washingotn, DC, USA, 2016.
  47. Song, C.; Woodcock, C.E.; Seto, K.C.; Lenney, M.P.; Macomber, S.A. Classification and change detection using Landsat TM data: When and how to correct atmospheric effects? Remote Sens. Environ. 2001, 75, 230–244. [Google Scholar] [CrossRef]
  48. Wang, S.; Baig, M.H.A.; Liu, S.; Wan, H.; Wu, T.; Yang, Y. Estimating the area burned by agricultural fires from Landsat 8 Data using the Vegetation Difference Index and Burn Scar Index. Int. J. Wildland Fire 2018, 27, 217–227. [Google Scholar] [CrossRef]
  49. Loboda, T.; O’neal, K.J.; Csiszar, I. Regionally adaptable dNBR-based algorithm for burned area mapping from MODIS data. Remote Sens. Environ. 2007, 109, 429–442. [Google Scholar] [CrossRef]
  50. Álvarez Taboada, M.F.; Rodríguez Pérez, J.R.; Castedo Dorado, F. Semi-Automatización de los Procesos de Monitorización Empleando Imágenes de Satélite en un Entorno Orientado a Objetos. Cartografía, Cuantificación y Clasificación de Áreas Quemadas en Galicia (2006); IX Congreso Nacional Top-Cart: Valencia, España, 2008. [Google Scholar]
  51. Key, C.H.; Benson, N.C. Landscape assessment (LA). In FIREMON: Fire Effects Monitoring and Inventory System; US Department of Agriculture, Forest Service, Rocky Mountain Research Station: Fort Collins, CO, USA, 2006. [Google Scholar]
  52. McFeeters, S.K. The use of the Normalized Difference Water Index (NDWI) in the delineation of open water features. Int. J. Remote Sens. 1996, 17, 1425–1432. [Google Scholar] [CrossRef]
  53. Vega, J.A.; Fontúrbel, M.T.; Merino, A.; Fernández, C.; Ferreiro, A.; Jiménez, E. Testing the ability of visual indicators of soil burn severity to reflect changes in soil chemical and microbial properties in pine forests and shrubland. Plant Soil 2013, 369, 73–91. [Google Scholar] [CrossRef]
  54. Warner, T.A.; Skowronski, N.S.; Gallagher, M.R. Gallagher High spatial resolution burn severity mapping of the New Jersey Pine Barrens with WorldView-3 near-infrared and shortwave infrared imagery. Int. J. Remote Sens. 2017, 38, 598–616. [Google Scholar] [CrossRef]
  55. Epting, J.; Verbyla, D.; Sorbel, B. Evaluation of remotely sensed indices for assessing burn severity in interior Alaska using Landsat TM and ETM+. Remote Sens. Environ. 2005, 96, 328–339. [Google Scholar] [CrossRef]
  56. Hall, R.J.; Freeburn, J.T.; De Groot, W.J.; Pritchard, J.M.; Lynham, T.J.; Landry, R. Remote sensing of burn severity: Experience from western Canada boreal fires. Int. J. Wildland Fire 2008, 17, 476–489. [Google Scholar] [CrossRef]
  57. Mallinis, G.; Mitsopoulos, I.; Chrysafi, I. Evaluating and comparing Sentinel 2A and Landsat-8 Operational Land Imager (OLI) spectral indices for estimating fire severity in a Mediterranean pine ecosystem of Greece. GISci. Remote Sens. 2018, 55, 1–18. [Google Scholar] [CrossRef]
  58. Navarro, G.; Caballero, I.; Silva, G.; Parra, P.C.; Vázquez, Á.; Caldeira, R. Evaluation of forest fire on Madeira Island using Sentinel-2A MSI imagery. Int. J. Appl. Earth observ. Geoinf. 2017, 58, 97–106. [Google Scholar] [CrossRef] [Green Version]
Figure 1. (a) Wildfires study region (color blue) located in Pontevedra (Galicia) in northwestern Spain; (b) zoom of wildfires region with burned areas perimeters (red color). The reference coordinate system is WGS84 (EPSG: 4326).
Forests 10 00457 g001
Figure 2. (a) Sentinel-2 dNBR image; (b) Landsat-8 dNBR image; (c) Sentinel-2 differences in normalized difference vegetation index (dNDVI) image; (d) Landsat-8 dNDVI image.
Forests 10 00457 g002
Figure 3. (a) Points distribution based on five severity degrees classification; (b) points distribution based on six severity degrees’ classification.
Forests 10 00457 g003
Figure 4. (a) Regression model between dNBR indices and field severity; (b) regression model between dNDVI (Differenced Normalized Difference Vegetation Index) indices and field severity.
Forests 10 00457 g004
Figure 5. (a) Sentinel-2 dNBR image classified; (b) Landsat-8 dNBR image classified; (c) Sentinel-2 dNDVI image classified; (d) Landsat-8 dNDVI image classified.
Forests 10 00457 g005aForests 10 00457 g005b
Figure 6. (a) Burned areas using dNBR image classified for Landsat-8 and Sentinel-2; (b) burned areas using dNDVI image classified for Landsat-8 and Sentinel-2.
Forests 10 00457 g006
Table 1. Differences in normalized burn ratio (dNBR) classification proposed by the United States Geological Survey (USGS).
Pixel ValuesSeverity Level
−0.5 ≤ dNBR < −0.25High Regrowth
−0.25 ≤ dNBR < −0.1Low Regrowth
−0.1 ≤ dNBR < 0.1Unburned
0.1 ≤ dNBR < 0.27Low
0.27 ≤ dNBR < 0.44Moderate-Low
0.44 ≤ dNBR < 0.66Moderate-High
0.66 ≤ dNBR < 1.33High
Table 2. Burn severity measured in situ classifications.
Five Burn Severity Degrees ClassificationSix Burn Severity Degrees Classification
Severity DegreeDescriptionNumber of PointsSeverity DegreeDescriptionNumber of Points
1Very Low01Very Low0
2Low132Low12
3Medium433Medium38
4High54High (<1 cm)11
5High (>1 cm)0
5Very High06Very High0
Table 3. Regression models results (equations, R2 and Root Mean Square Error (RMSE)) between spectral indices (Differenced Normalized Burn Ratio and Differenced Normalized Difference Vegetation Index) and field severity (FS) measures in the Pontevedra fire.
SatellitesIndicesBurn Severity Degrees ClassificationEquationsR2RMSE
Sentinel-2dNBRFive burn severity degrees0.357 × (FS0.861)0.720.08
Six burn severity degrees0.411 × (FS0.693)0.710.08
dNDVIFive burn severity degrees0.095 × (FS1.450)0.540.09
Six burn severity degrees0.119 × (FS1.175)0.560.09
Landsat-8dNBRFive burn severity degrees0.506 × (FS0.512)0.610.06
Six burn severity degrees0.548 × (FS0.417)0.560.06
dNDVIFive burn severity degrees0.231 × (FS0.515)0.450.12
Six burn severity degrees0.237 × (FS0.466)0.470.12
Table 4. Thresholds for each satellite and index in Pontevedra fire.
Thresholds
SatellitesIndicesLowMediumHigh
Sentinel-2dNBRX ≤ 0.70.7 < X ≤ 0.9X > 0.9
dNDVIX ≤ 0.350.35 < X ≤ 0.55X > 0.55
Landsat-8dNBRX ≤ 0.70.7 < X ≤ 0.95X > 0.95
dNDVIX ≤ 0.350.35 < X ≤ 0.5X > 0.5
Table 5. Success accuracy (%) for each field severity class in Pontevedra fire.
SatellitesIndicesLow (%)Medium (%)High (%)Global (%)
Sentinel-2dNBR776510081
dNDVI62868076
Landsat-8dNBR54986071
dNDVI62816068

