Article

Degradation of Ecosystem Services and Deforestation in Landscapes With and Without Incentive-Based Forest Conservation in the Ecuadorian Amazon

1
Institute of Silviculture, Department of Ecology and Ecosystem Sciences, TUM School of Life Sciences Weihenstephan, Technische Universität München, 85354 Freising, Germany
2
Thünen Institute of International Forestry and Forest Economics, 21031 Hamburg, Germany
*
Author to whom correspondence should be addressed.
Forests 2019, 10(5), 442; https://doi.org/10.3390/f10050442
Submission received: 20 March 2019 / Revised: 30 April 2019 / Accepted: 17 May 2019 / Published: 22 May 2019
(This article belongs to the Section Forest Ecology and Management)

Abstract

:
Anthropogenic activities such as logging or forest conversion into agricultural lands are affecting Ecuadorian Amazon forests. To foster private and communal conservation activities an economic incentive-based conservation program (IFC) called Socio Bosque was established. Existing analyses related to conservation strategies are mainly focused on deforestation; while degradation and the role of IFC to safeguard ecosystem services are still scarce. Further on, there is a lack of landscape-level studies taking into account potential side effects of IFC on different forest types. Therefore we assessed ecosystem services (carbon stocks, timber volume) and species richness in landscapes with and without IFC. Additionally, we evaluated potential side-effects of IFC in adjacent forest types; hypothesizing potential leakage effects of IFC. Finally, we tested if deforestation rates decreased after IFC implementation. Forest inventories were conducted in 72 plots across eight landscapes in the Ecuadorian Central Amazon with and without IFC. Plots were randomly selected within three forest types (old-growth, logged and successional forests). In each plot all individuals with a diameter at breast height greater than 10 cm were measured. Old-growth forests in general showed higher carbon stocks, timber volume and species richness, and no significant differences between old-growth forests in IFC and non-IFC landscapes were found. Logged forests had 32% less above-ground carbon (AGC) and timber volume in comparison to old-growth forests. Surprisingly, logged forests near IFC presented higher AGC stocks than logged forests in non-IFC landscapes, indicating positive side-effects of IFC. Successional forests contain 56% to 64% of AGC, total carbon and timber volume, in comparison to old-growth forests, and 82% to 87% in comparison to logged forests. Therefore, successional forests could play an important role for restoration and should receive more attention in national climate change policies. Finally, after IFC implementation deforestation rate decreased on parish level. Our study presents scientific evidence of IFC contribution to conserving ecosystem services and species richness. In addition IFC could help indirectly to reduce degradation effects attributed to logging, indicating potential compatibility of conservation aims with forest activities at a landscape level.

Graphical Abstract

1. Introduction

Tropical forests provide a wide range of ecosystem services, including supporting, provisioning, regulating and cultural services [1]. Whereas at local level provisioning services such as food, timber and medicine are of high importance for single land users and communities, regulating services related to climate regulation and carbon sequestration play a central role at the global level [1]. Tropical ecosystems can store between 208 Gt C and 288 Gt C of carbon in above and below ground biomass [2,3,4]. Latin America’s forests hold 49% of the total carbon biomass in the tropics [4]. Additionally, tropical forest ecosystems are considered hotspots of biodiversity; it is estimated that between 50–80% of all terrestrial species are located in these ecosystems [5,6].
Anthropogenic activities have affected tropical forests in terms of degradation, forest cover loss and fragmentation [7,8]. Deforestation and forest degradation contributed between 10% and 20% of global anthropogenic greenhouse emissions between 1990–2005 [4,9]. Globally the annual rate of net forest loss has declined from 7.3 M ha year−1 in the 1990s to 3.3 M ha year−1 between 2010 and 2015. This decreasing tendency has been also observed in tropical forests, with a decline from 9.5 (1990s) M ha year−1 to 5.5 M ha year−1 (2010–2015) [10]. Despite a recent trend of reduced deforestation rates in the tropics, the annual loss is still remarkably high, and an unknown amount of carbon is possibly being emitted by degradation rather than by deforestation processes [11,12].
The Amazon Basin and Ecuadorian forest ecosystems have experienced similar dynamics since 1990. Deforestation in the Amazon Basin was specifically high with an annual rate of net deforestation of −0.45% for the 1990s, whereas annual deforestation for Ecuador was −0.65% during the same period [2,13]. Although for Ecuador the annual rate of net deforestation has decreased to −0.48% for the period 2014–2016, it remains high in contrast to other countries of the region [13,14]. The main drivers that lead to deforestation are road construction, oil extraction, land use change from forests to agricultural crops and grasslands, and finally a growing population density in formerly forested areas [15,16,17,18].
Besides the negative effect of deforestation, it is important to highlight the impact of forest degradation on ecosystem integrity by reducing the availability of goods and services; such as carbon or water regulation [19,20,21,22] and biodiversity [23,24,25,26,27,28], due to species extinction, loss of natural habitats and changes in species distribution [29]. In Latin America, around 70% of forest degradation is driven by logging activities, followed by firewood, charcoal extraction and forest fires [30,31]. The intensity of harvesting activities has a direct influence on forest structure, which is related to the reduction of carbon stocks, timber volume and species composition through vegetation loss and tree damage [32,33,34]. A logging intensity of 4.5 to 5.7 trees ha−1 could result in a reduction of aboveground stand biomass by 17% to 26%; meanwhile, a high logging intensity of 10 trees ha−1 reduced biomass by 48% [33,35]. According to Rutishauser et al. [36], when forests lose between 10% to 25% of above carbon stocks due to logging, forest recovery will take among 12 to 43 years, which shows the significant impact of logging activities.
Due to the anthropogenic impact on forest ecosystems in recent decades, there has been a continuous debate on what kind of conservation strategies would provide a better solution for ecosystem services’ conservation. It has been shown that governmental conservation strategies (e.g., protected areas) can contribute to the protection of tropical ecosystems by reducing deforestation [37,38,39]. These areas have expanded around the tropics and today represent almost 27% of the forest area [40,41]. In Ecuador, protected areas represent almost 20% of the territory [42]. However, due to use restrictions, protected areas do not always generate benefits for local communities [43,44,45]. Therefore, strategies based on incentives for forest conservation (IFC) can be more attractive to local people as they are assumed to contribute to alternative income and poverty alleviation. Such strategies could also be an adequate way of combining ecosystem conservation and the provision of natural resources [46,47,48]. This is key since local communities play an important role in the management and conservation of natural resources. For example, in Ecuador it is estimated that between 5 and 7.5 M ha of forest belongs to indigenous communities [49,50]. This emphasizes how important these actors are for land use decisions. On the other hand, community land forest traditionally aiming to preserve forest lands for future generations, has as well shown promising results for conservation. Some studies indicate that forest loss can be lower in these cases or even similar to protected areas [51,52,53]. In Ecuador, Jones et al. [54] and Mohebalian and Aguilar [55], found that areas with IFC (Socio Bosque program) in the Amazon region are less deforested than areas that are not part of the program. However, Sánchez-Azofeifa et al. [56] and Pfaff et al. [57] found that areas with IFC do not have lower deforestation rates than other areas.
Many studies analyzing conservation measures such as IFC or protected areas have been focused on assessing effects of deforestation [51,52,53,54,55,56,58,59]. However information on forest cover change does not take into account forest integrity parameters in order to measure potential degradation effects of ecosystem services. In our study we incorporated both into our assessment since we evaluated deforestation after the implementation of IFC and the potential degradation effects. Forest degradation is defined as the reduction of goods and ecosystems services (e.g., timber or carbon) due to anthropogenic disturbances [60,61,62]. As indicators of forest degradation we used carbon stocks, total tree volume and species richness. Species richness was selected as a basic indicator related to forest ecosystem composition and function [23,25,26,27,28]. Due to the fact that IFC poses restrictions of access and use of protected old-growth forests, it is possible that anthropogenic pressures could be deviated towards adjacent forests, leading to higher pressure on logged or successional forests. Under this scenario, IFC could create leakage effects at a landscape level, which to our knowledge is an important research gap, and of particular importance for the Ecuadorian Central Amazon region. Therefore, we assessed if IFC has an influence on ecosystem services degradation beyond the areas which are under conservation. This is an important scientific contribution to the land sparing/land sharing debate for tropical lowland ecosystems [63,64,65,66,67]. The results could improve the understanding of compatibility or incompatibility of conservation measures and timber production at a landscape level as basis for multifunctional landscapes.
In our study area logging activities are an important potential driver of degradation, especially when sustainability criteria are not applied in practice. Despite the considerable logging activities that are taking place in the lowland forests of Ecuador, scientific information related to the impacts of timber extraction on ecosystems services is still scarce. For this reason, we analyzed how logging activities affect ecosystem services in landscapes with and without the presence of IFC. While logging is an important driver of degradation in many areas of the world, agricultural use and pasture management are important drivers of deforestation. These activities can lead to the establishment of mosaics of successional forest stages, with rather unknown potential to contribute to forest ecosystem services. In the Central Amazon region, many successional forests result mainly from abandoned pastures; nevertheless, the potential contribution of this forest type has been overlooked. We took into consideration this knowledge gap and we evaluated the contribution of these forests types to the maintenance of ecosystem services in landscapes with and without IFC. The comprehensive consideration of all dominant forest types (old-growth, logged and successional forests) in combination with IFC, allows for a better decision-making process in the context of forest landscape conservation, sustainable use and restoration.
We focused on the Socio Bosque program in Ecuador which is an IFC program that began in 2008 with the aim of conserving forest, reducing deforestation and improving living conditions in local communities [68,69]. Communities that voluntarily join the program sign a 20-year contract with the Ecuadorian government in order to protect their forest (no extractive use being allowed in the forest). In turn, communities receive cash compensations ranging from USD 0.70 to USD 35.00 per ha year−1, depending on the total size of the conserved forest [68,69,70]. Since the program holds almost 1.6 M ha under long-term protection, Socio Bosque has become an important conservation strategy in Ecuador [69].
We tested five research questions and hypotheses related to forest degradation and deforestation. (1) The IFC-regime has a general positive effect on carbon stocks, timber volume and species richness in forest landscapes across all forest types (old-growth, logged and successional forest). The second and third hypotheses are related to assessing interactions between forest types and landscapes with and without IFC. (2) Old-growth forests under IFC have higher amounts of carbon stocks, timber volume and species richness than old-growth forest in non-IFC landscapes. (3) Logged and successional forests adjacent to old-growth forest under IFC have lower carbon stocks, timber volumes and species richness than logged and successional forest in non-IFC landscapes, hypothesizing potential leakage effects. We assumed that the presence of IFC regimes on old-growth forest might have a negative side-effect causing higher pressure on nearby forest types. (4) Further on, we aim to show how logged and successional forests differ in amounts of carbon, timber volume and species richness in comparison to old-growth forests in order to provide estimates of potential degradation effects. Finally, we hypothesize that: (5) the annual rate of net deforestation before and after the establishment of the Socio Bosque program was different in IFC and non-IFC landscapes at a parish level, assuming that the IFC program contributed to reducing deforestation rates on the landscape level. In IFC landscapes use restrictions only applied to old-growth forests under the Socio Bosque program; while logged and successional forests were not part of the program and had no land use restrictions.
The following sections of the manuscript are divided in four parts: in Section 2 we provide contextual information related to the study area, to the IFC program and to logging procedures in the Central Amazon region of Ecuador; in addition, we describe our data collection methods and statistical analyses. In Section 3 and Section 4 we present the results and we discuss the implications of the influence of IFC on the degradation of ecosystem services and species richness; as well as, deforestation. Finally, in Section 5 we present the relevant conclusions of our study.

2. Materials and Methods
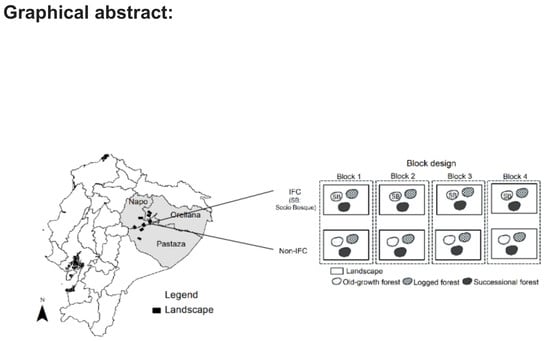
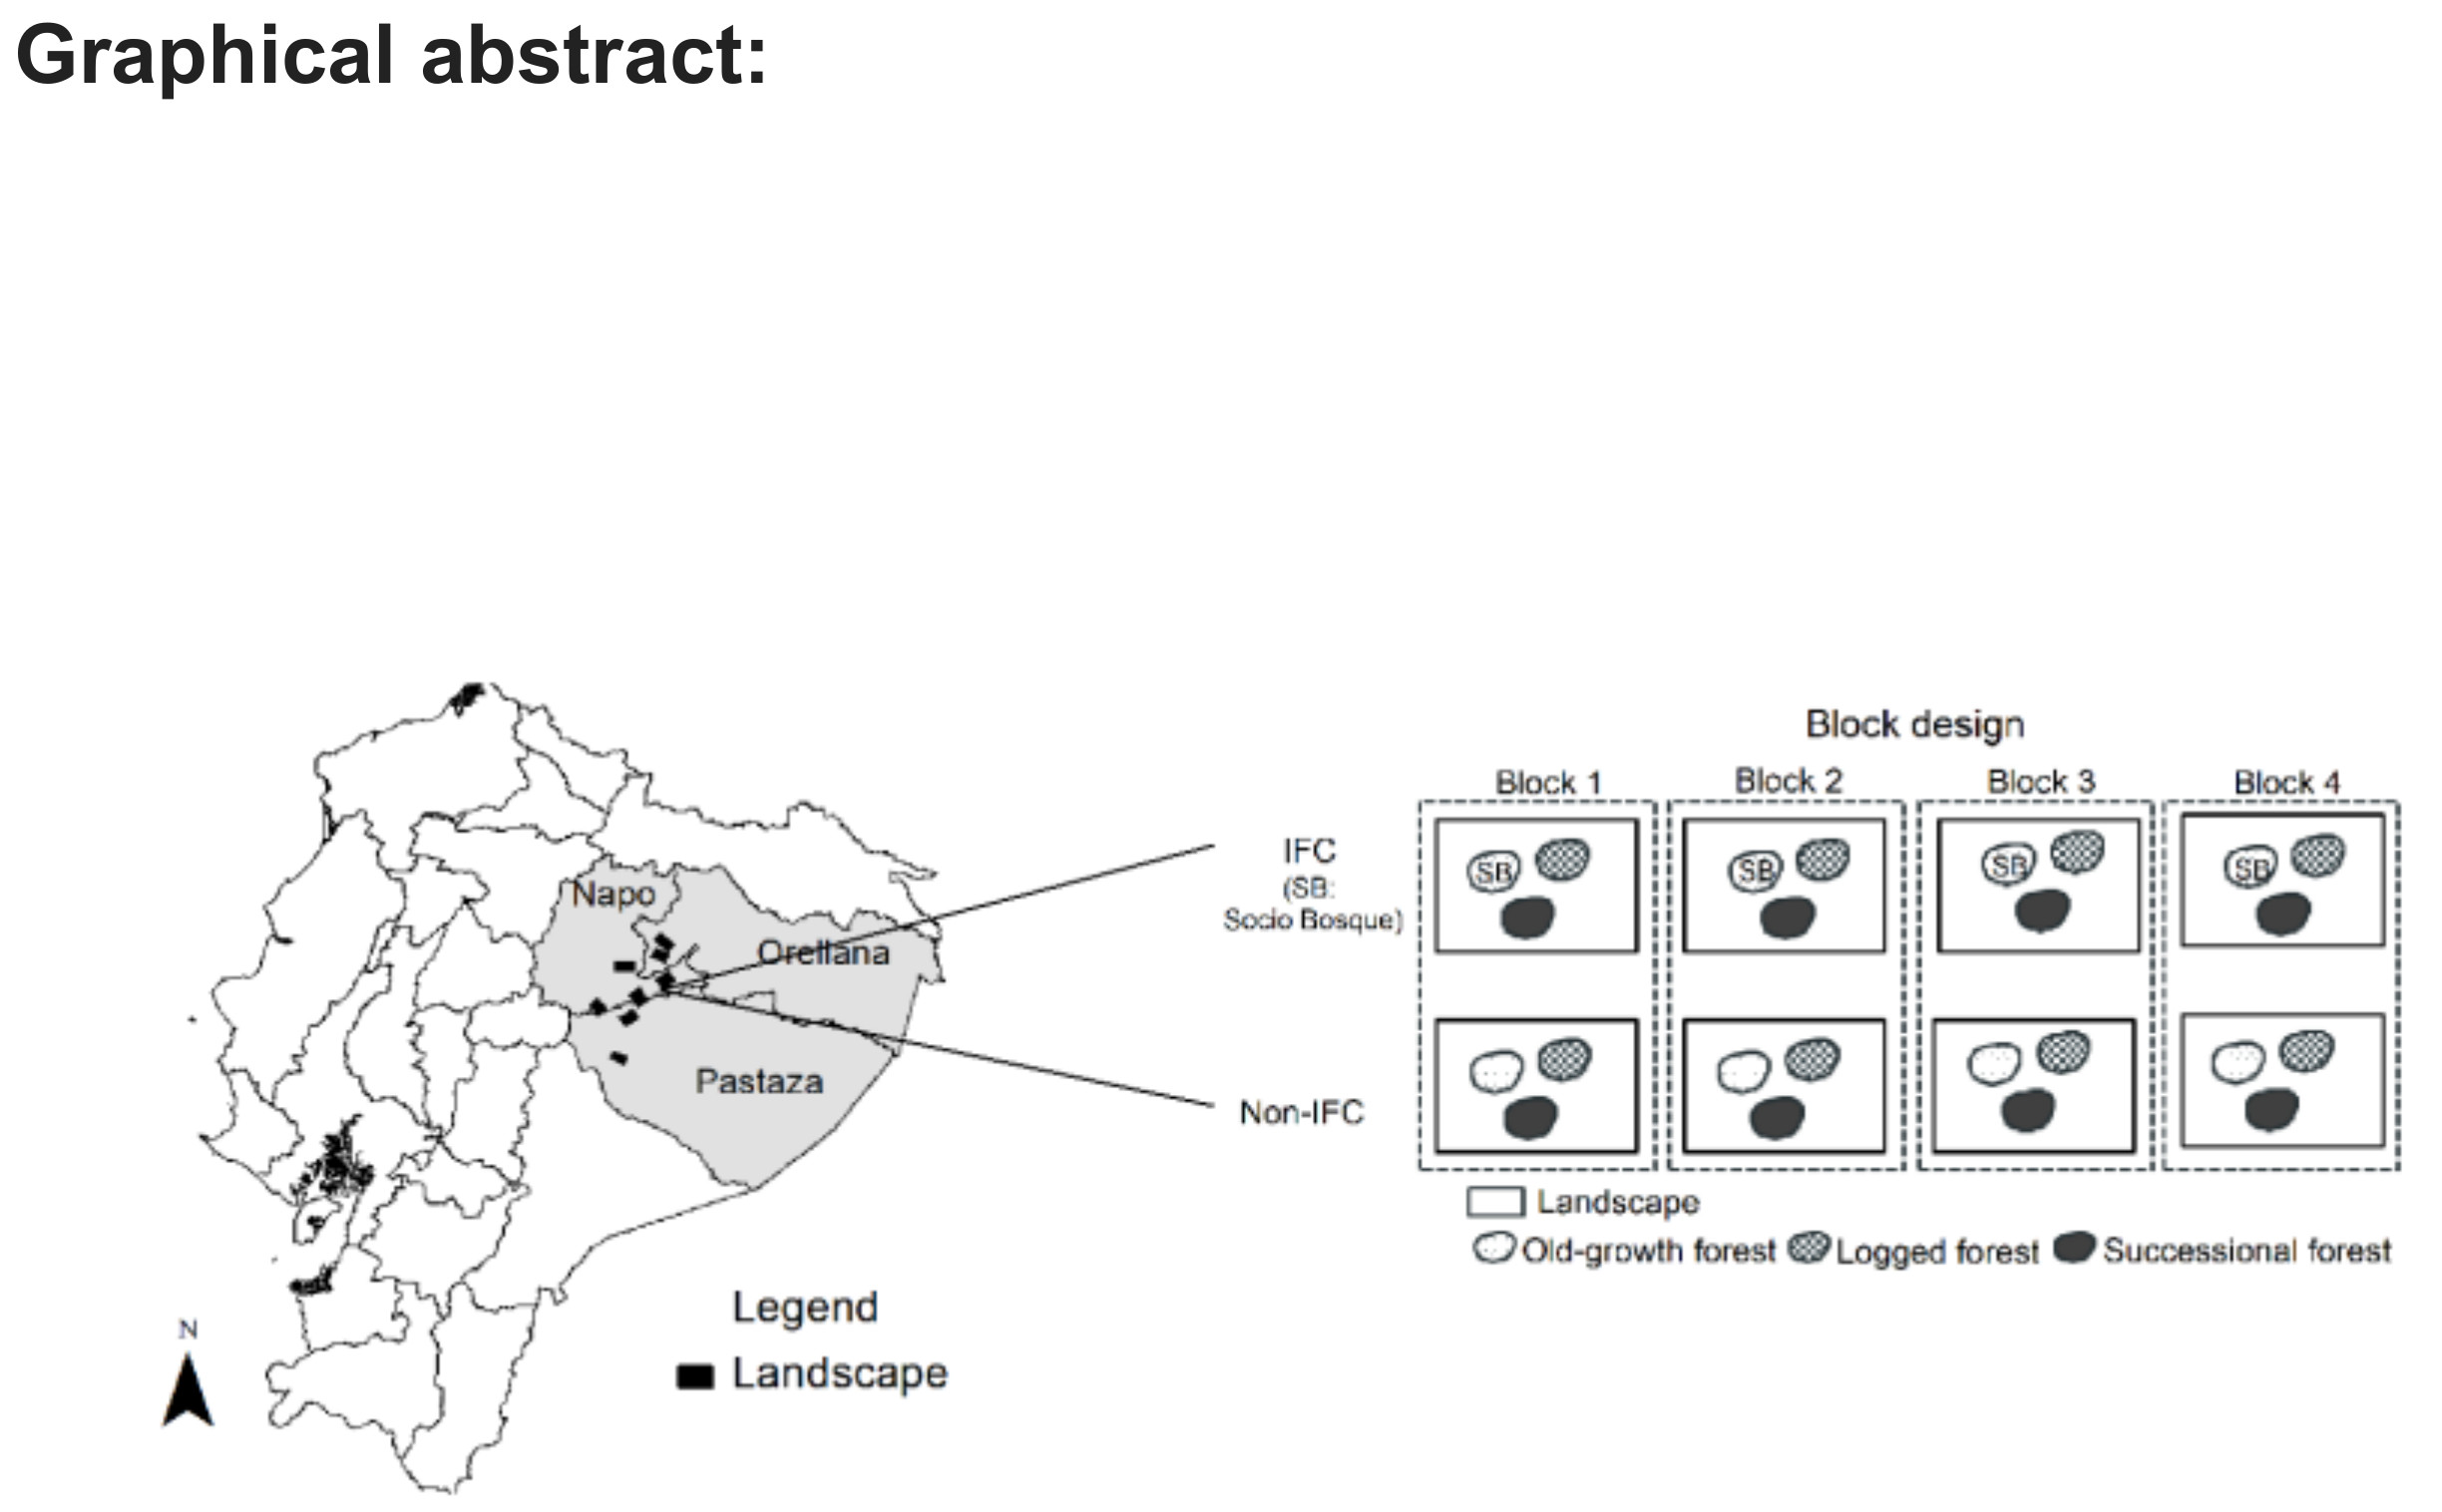
2.1. Study Area

The study was conducted in the Central Amazon region of Ecuador, in the provinces of Pastaza, Napo and Orellana (Figure 1). The region is still characterized by high forest cover, representing almost 43% (5.5 M ha) of the total forest area of the country [71]. In addition, it hosts a high level of biodiversity and a species richness of up to 200 tree species per hectare [72,73]. However, the selected provinces also have interesting land use change dynamics which influence forest cover loss, showing an annual net deforestation rate up to −0.87% at a parish level for the period 2014–2016 [13,17,18].

2.2. Data Collection
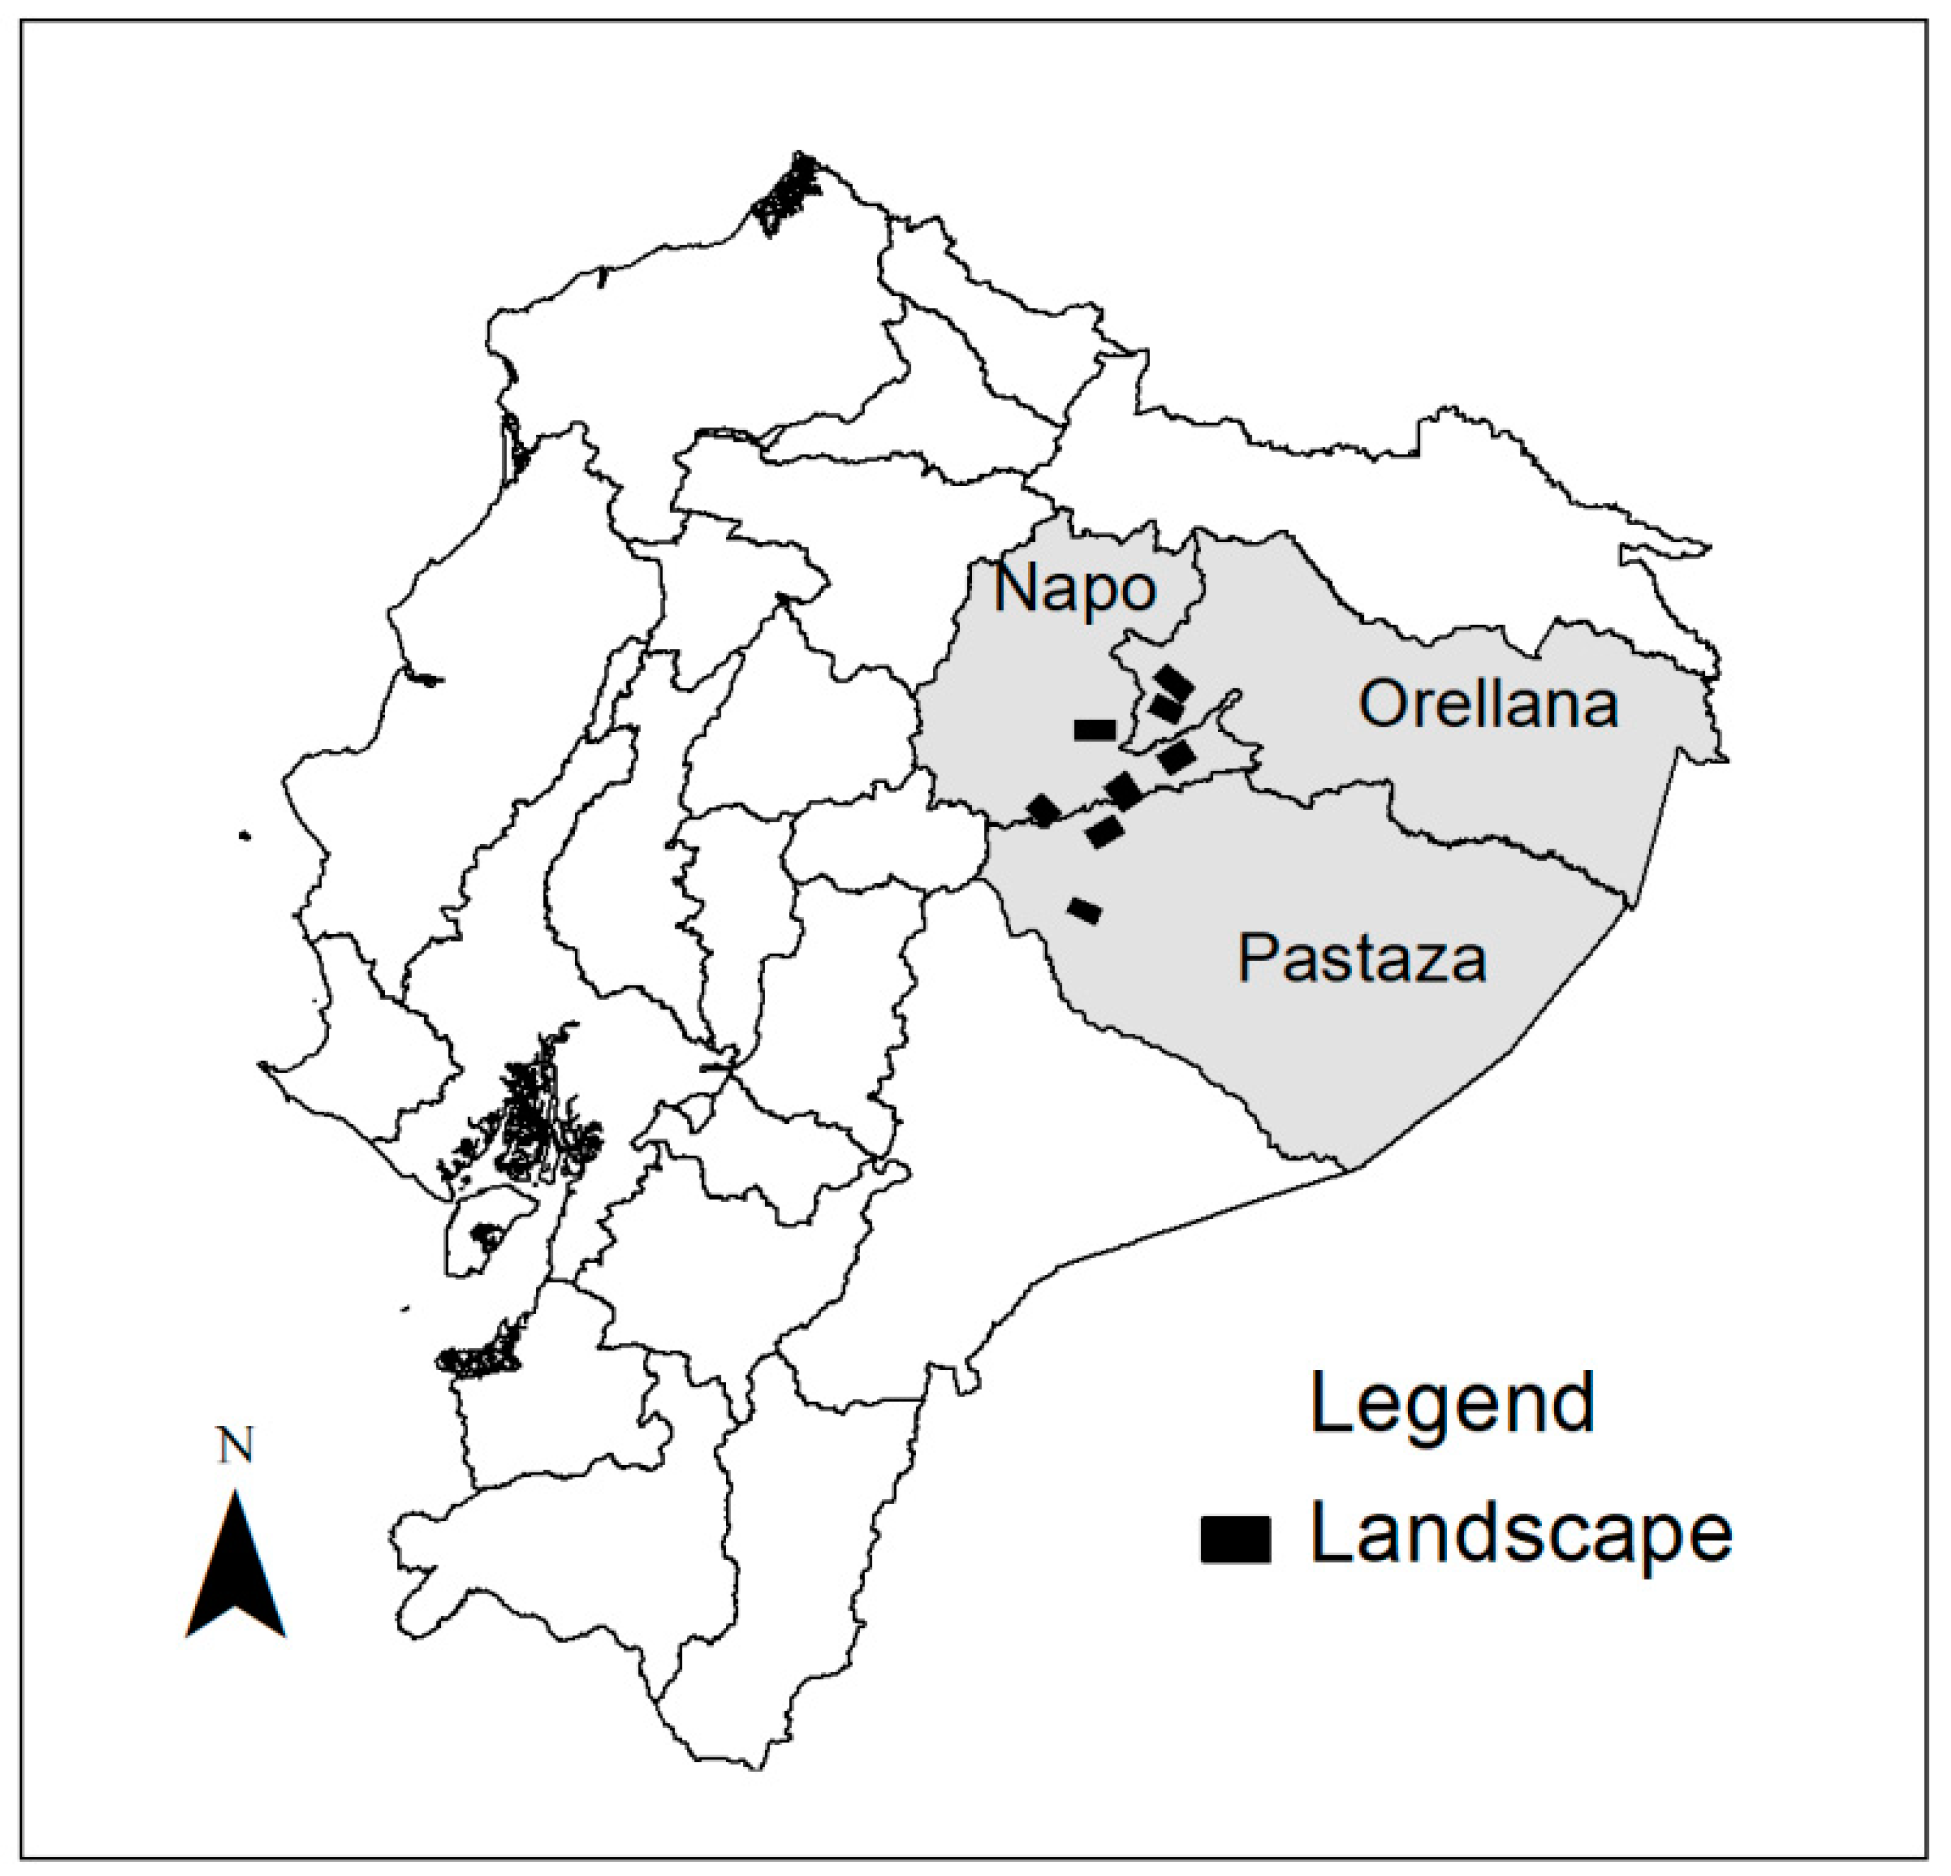
2.2.1. Plot Design

Throughout the three provinces, eight landscapes (sites) of approximately 10 × 10 km were selected (four IFC and four non-IFC landscapes); they were characterized by lowland forests between 335 and 1100 m above sea level and were allocated in different parishes which represent independent administrative units. Since our aim was to evaluate whether IFC have an influence on forest degradation and deforestation, we used a randomized block design. Each block was composed of one landscape where Socio Bosque was stablished (hereafter referred to as IFC landscape) and one landscape without this conservation program (hereafter called non-IFC landscape) (Figure 2a). The Socio Bosque program protects approximately 1.6 M ha through collective and individual contracts, 64% of the conservation area of the program is concentrated in the provinces of Pastaza, Napo and Orellana. Within the three provinces 98.4% of the area conserved by Socio Bosque program is covered by collective contracts (linked to communities) [68,69,70], which is related to the large extension of community forests in the country (5 to 7.5 M ha of total forest) [49,50]. It is important to highlight that in IFC landscapes, Socio Bosque has been implemented only in old-growth forests. Due to the fact that this is a voluntary program there may be confounding variables that could influence our results. To address this issue our blocked landscapes were randomly selected across the Central Amazon region in Ecuador. Moreover, we controlled potential confounding variables (Table A1 and Table A2) such as forest cover, percentage of agricultural land, ecosystem type, altitude, soil type and demographic characteristics (population density, distance from landscape to large cities and distance from households within landscapes to forest). Through analysis of variance we confirmed that all those variables were similar and comparable between landscapes within blocks (Table A3). As a result, the randomized block design used in this study ensured that confounding variables were balanced across the treatment (IFC landscapes/with Socio Bosque) and control (non-IFC landscapes/without Socio Bosque). Consequently, the main difference of degradation effects on ecosystem services and species richness can be attributed to the presence or absence of the IFC program and not to confounding variables.
Each landscape included three forest types. The first type was old-growth forest, which is a mature forest with low or not known human disturbance [74,75]. Secondly, logged forests were considered, which were defined as areas with forest interventions carried out in the last two to four years mainly under the Simplified Forest Harvesting Program (Spanish acronym PAFSI). The PAFSI program is characterized by non-mechanized activities where timber is harvested under a selective logging procedure; after the forest intervention, the area cannot be logged for the following five years. According to records from the Ministry of Environment of Ecuador (MAE), this program is performed in relatively small areas (11 to 24 ha on average) with average intensity of 11–24 m3 ha−1 (standing volume approved by MAE) [76,77,78,79]. Logged forests with interventions older than four years were not included in our study, this means that logged forests in our study are comparable in regard to time and that intervention and differences in our target variables can therefore be attributed to differences in logging intensity. The third type of forest was successional forest, resulting from abandoning previously cleared forest (second growth forest) [74,80]. We randomly selected successional areas; this resulted in areas of abandoned pastures between 12 and 28 years of recovery. In order to ensure that the comparison of the successional forests in landscapes with IFC and without IFC is adequate, an analysis of variance was carried out considering the age of the successional forests as a dependent variable, resulting in no statistical differences between the ages of the successional forests near IFC and successional forest in landscapes without the program (Table A4).
In our IFC landscapes, only old-growth forests were under the Socio Bosque program and extractive use is not allowed in these areas. In IFC landscapes, logged and successional forests are located outside the Socio Bosque program and have no land use restrictions; therefore, can be used by their owners. For simplicity and to facilitate the interpretation from now on, logged and successional forests will be called as logged forests near IFC and successional forests near IFC. Old-growth forests in non-IFC landscapes were communal areas with no current use that communities set aside for future needs (e.g., to satisfy land demands from upcoming generations). These were mature forests reported by local people during mapping exercises. However, the absence of previous human interventions in these sites cannot be assured. In order to map the aforementioned forest types, we used secondary information (e.g., land cover maps and PAFSIs records) available from the Ministry of Environment of Ecuador (MAE), and mapping exercises during participatory community workshops performed in each landscape.
Within landscapes, for each of the three forest strata, three plots were randomly selected using a grid of 200 m × 200 m in order to secure an adequate distribution [81,82]. This resulted in a total of 72 inventory plots: 24 for old-growth forest (12 in IFC and 12 in non-IFC landscapes), 24 in logged areas (12 near IFC old growth forest, 12 in non-IFC landscapes) and 24 in successional forest (12 near IFC old growth forest, 12 in non-IFC landscapes). Plots had a size of 40 m × 40 m (1600 m2) (Figure 2b). We kept a minimum distance of 100 m between plots and the forest border to avoid edge effects due to anthropogenic activities like agriculture and roads, as well as natural influences like rivers [83,84].
We assessed a variety of carbon pools for each plot, including above-ground carbon in trees (AGCtree), above-ground carbon in palms (AGCpalm), soil organic carbon (SOC) at a depth of 30 cm [85,86,87] and dead organic matter (DOM). DOM included downed dead wood (DDW), standing dead wood (SDW) and litter (L). A carbon conversion factor of 0.47 was used [88].
In order to estimate total carbon stocks, we first calculated biomass (Table 1). Above-ground carbon (AGC) was obtained as the sum of AGCtree and AGCpalm. AGCtree was calculated applying the equation from Chave et al. [89] (Table 1, Equation (1)). Diameter at breast height (or above the buttresses, if present) of individuals greater than 10 cm and species wood density were used as input parameter for this case. For the wood density of tree species, we used datasets from the Global Wood Density Database [90,91], MAE [92] and Aguirre et al. [93]. For tree species not included in either of these databases, we used the genus average. For a genus represented by a single individual, the average per family was used, and for those representing one family, mean wood density by plot was considered. AGCpalm was determined based on Goodman et al. [94] taking into consideration the diameter at breast height (Table 1).
DDW was estimated by volume and three wood density classes (sound: 0.45 gr/cm3, intermediate: 0.34 gr/cm3 and rotten: 0.25 gr/cm3) (Table 1, Equation (3)). Core samples for these classes were extracted in the forest and oven dried in the laboratory to a constant mass at 105 °C, following Chave [95] and Williamson and Wiemann [96]. In the case of SDW, volume and wood density was also considered (Table 1, Equation (4)). For volume, a taper function was used to estimate the minimum diameter at a known height (Table 1, Equation (9)). Mean wood density of all living trees within the plot was used as proxy. All DDW and SDW pieces on the plots (40 × 40 m) were recorded. Litter samples were collected from two subplots of 0.5 × 0.5 m each (Figure 2b). Dry mass was calculated in the laboratory [85,86,87].
SOC was estimated from bulk density, the concentration of organic carbon content (%), and the soil depth (0–30 cm). Bulk density was calculated from the oven-dried weight of soil from a known volume of sampled material at 105 °C until reaching a constant weight. In this case, two samples were taken from each of the plots (40 m × 40 m). For concentration of organic carbon content (0–30 cm horizon), samples were taken at the corners of two subplots (Figure 2b). The wet digestion method of Walkley and Black was used for this purpose [86,87,99].
Total tree volume was calculated considering the DBH (≥10 cm), the total tree height and the form factor (0.56) [97]. A total of 668 trees total heights were measured. Log–log linear regression considering total height as the dependent variable and DBH as the independent variable provided the best fit to estimate the height of the remaining trees (Equation (11)).
lnHt = 0.786 + 0.5956 ( lnDBH )   ( p   <   0.0001 ;   R 2 = 0.69 )
where:
  • Ht = Total tree height;
  • DBH = Diameter at breast height.
We also determined the species richness (number of species of trees and palms per plot) [100,101] and the importance value index (IVI) (Equation (12)) [100,102] since these variables can be interpreted as an indicator of conservation, ecosystem function and, therefore, diversity-related ecosystem services [23,25,26,27,28,103].
IVI = DoR + DR + FR
where:
  • IVI = Importance index value;
  • DoR = Relative dominance;
  • DR = Relative density;
  • FR = Relative frequency.
The annual rate of net deforestation was calculated following the procedure specified by MAE [13] comparing the forest area at parish level between 2000–2008 and 2008–2016 and using Equation (13). We used land use and land cover maps from 2000, 2008 and 2016, which can be downloaded from the platform of the interactive environmental map provided by the Ministry of Environment of Ecuador (http://mapainteractivo.ambiente.gob.ec/portal/).
Deforestation   rate = ( A 2 A 1 ) 1 / ( t 2     t 1 ) 1
where:
  • A1 = Forest area at the beginning of the period;
  • A2 = Forest area at the end of the period.

2.2.2. Statistical Analysis

General mixed models were used to test the degradation effects. Analyses of variance (ANOVA LSD Fisher p ≤ 0.05) were performed considering the fixed effects conservation regime (IFC and non-IFC), forest type (old-growth, logged and succession forest) and their interaction. As random effects, we considered block and landscape. Assumptions of normality and homoscedasticity were evaluated, and criteria penalized likelihood (AIC–BIC) was applied to select the best model for AGC stocks (Mg C·ha−1), DOM (Mg C·ha−1), SOC (Mg C·ha−1), total carbon stocks (Mg C·ha−1), timber volume (m3 ha−1) and species richness. For AGC, DOM and timber volume outliers were excluded. We considered those plots as outliers which had a value greater than twice the standard deviation from the mean of each one of the forest types.
With regard to the hypothesis of deforestation, ANOVA was performed to check for statistical differences in annual rates of net deforestation between the periods 2000–2008 and 2008–2016 for IFC and non-IFC, respectively. Normality and homoscedasticity assumptions were evaluated.
In addition, cluster analysis taking into account species importance index value (IVI, a measure of ecological importance) [100,102] was applied in order to evaluate the similarity of the forest types between IFC and non-IFC landscapes.

3. Results

3.1. Degradation

Regarding the hypothesis of ecosystem services’ degradation, we present analyses of variance for carbon stocks, total tree volume and species richness comparing IFC vs. non-IFC landscapes; as well as forest types and their interaction with and without IFC (Table 2, Figure 3 and Figure 4). In addition, we conducted a similarity analysis considering the IVI per species for the different forest types under IFC and non-IFC (Figure 5).
IFC vs. non-IFC landscapes did not show statistical effects on ecosystem services independently from the forest type in terms of carbon stocks, timber volume and species richness (Table 2). This implies that IFC-regime does not have a general effect on carbon stocks, timber volume and species richness in forest landscapes across all forest types (old-growth, logged and successional forest).

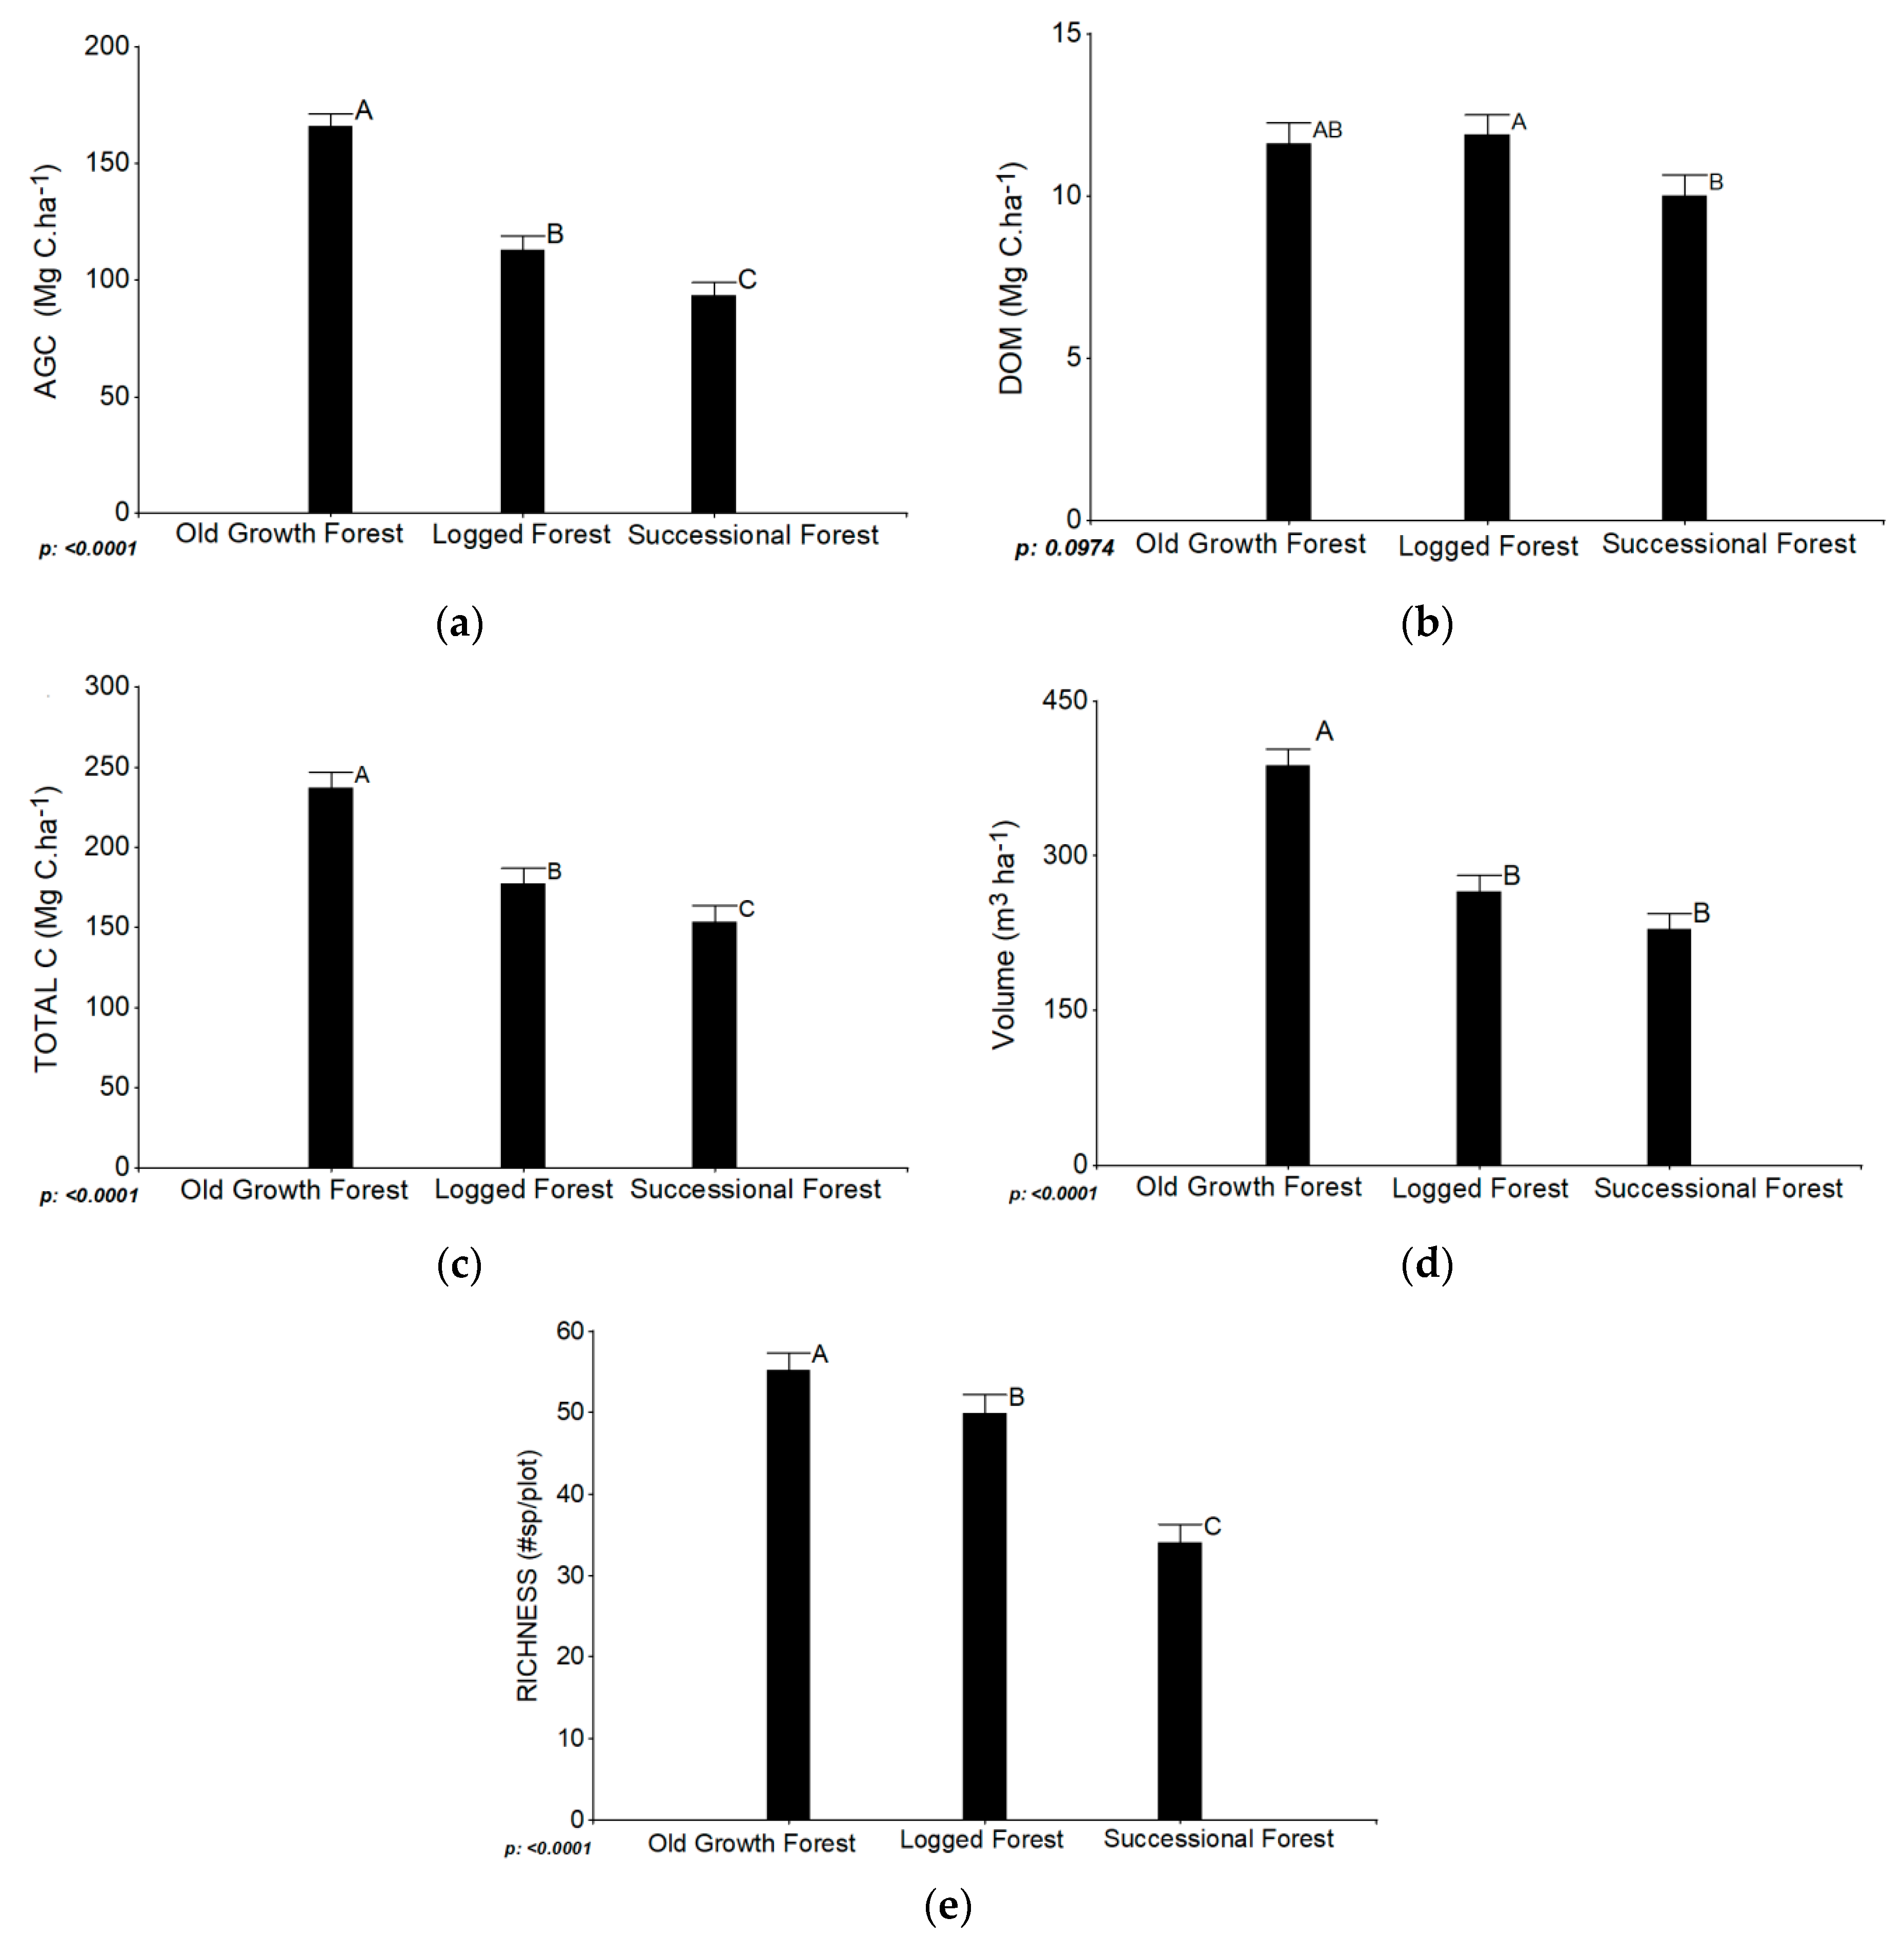
3.1.1. Influence of Forest Types on Ecosystem Services Degradation

In this section, we analyze potential degradation effects of logging activities and the restoration potential of successional forests in comparison to old-growth forests. The following results show means by forest types independent of whether plots were located in IFC or non-IFC landscapes.
There were statistical differences (p ≤ 0.05) between old-growth, logged and successional forest with respect to AGC, total carbon, timber volume and species richness (Table 2). These results show that there is a degradation of ecosystem services (carbon and volume) and species richness in the logged forest when compared to old-growth forest (Figure 3). In the case of DOM, there is a significant difference at p ≤ 0.10. SOC did not show significant differences (Table 2). Old-growth forest had the highest mean of AGC with 166 Mg C·ha−1, followed by logged forest with 113 Mg C·ha−1 and successional forest with 93 Mg C·ha−1.
Total carbon stocks were about 237 Mg C·ha−1 for old-growth forest, 177 Mg C·ha−1, for logged forest and 153 Mg C·ha−1 in the successional forest. As expected, timber volume was higher in the old-growth forest with 387 m3 ha−1 as well as statistically different from logged (265 m3 ha−1) and successional forest (228 m3 ha−1). DOM across the forest types was between 10–12 Mg C·ha−1, whereas SOC for all forest types ranged between 48–53 Mg C·ha−1 (Table A6).
Species richness differed between the evaluated forest types. We found an average of 55 species per plot in old-growth forests, 50 species in logged forests and 34 species in successional forests (Figure 3, Table A6).

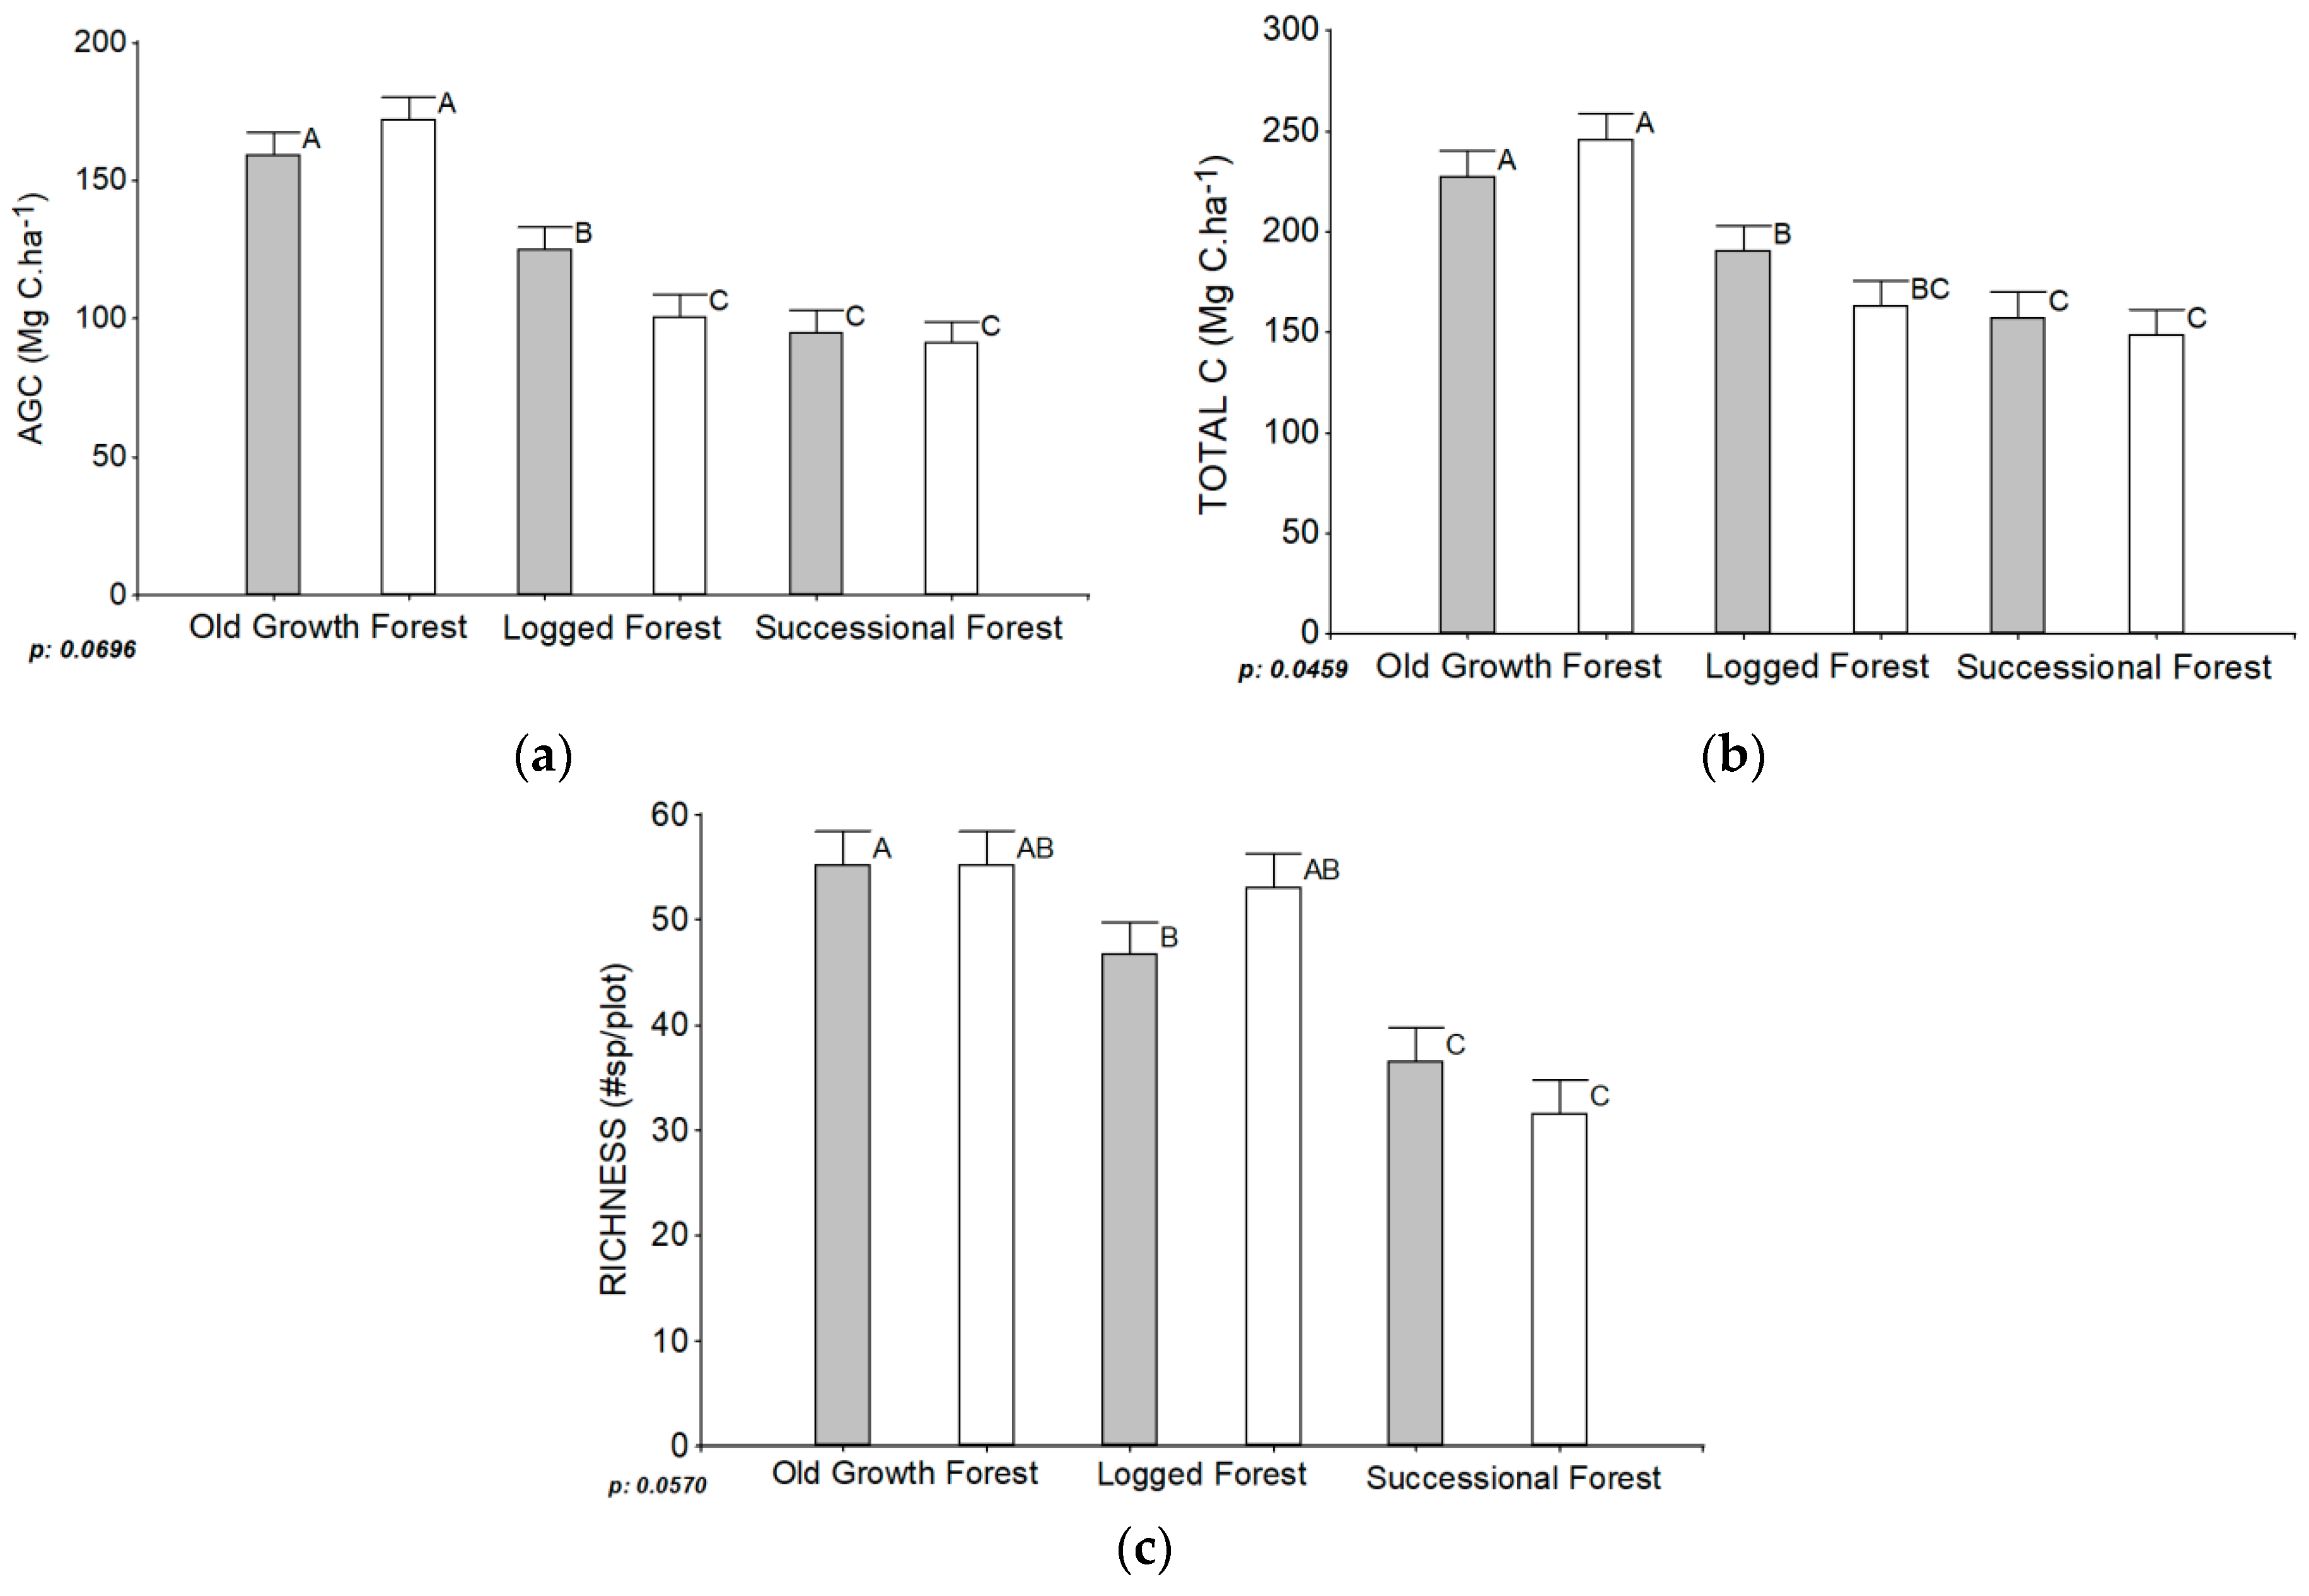
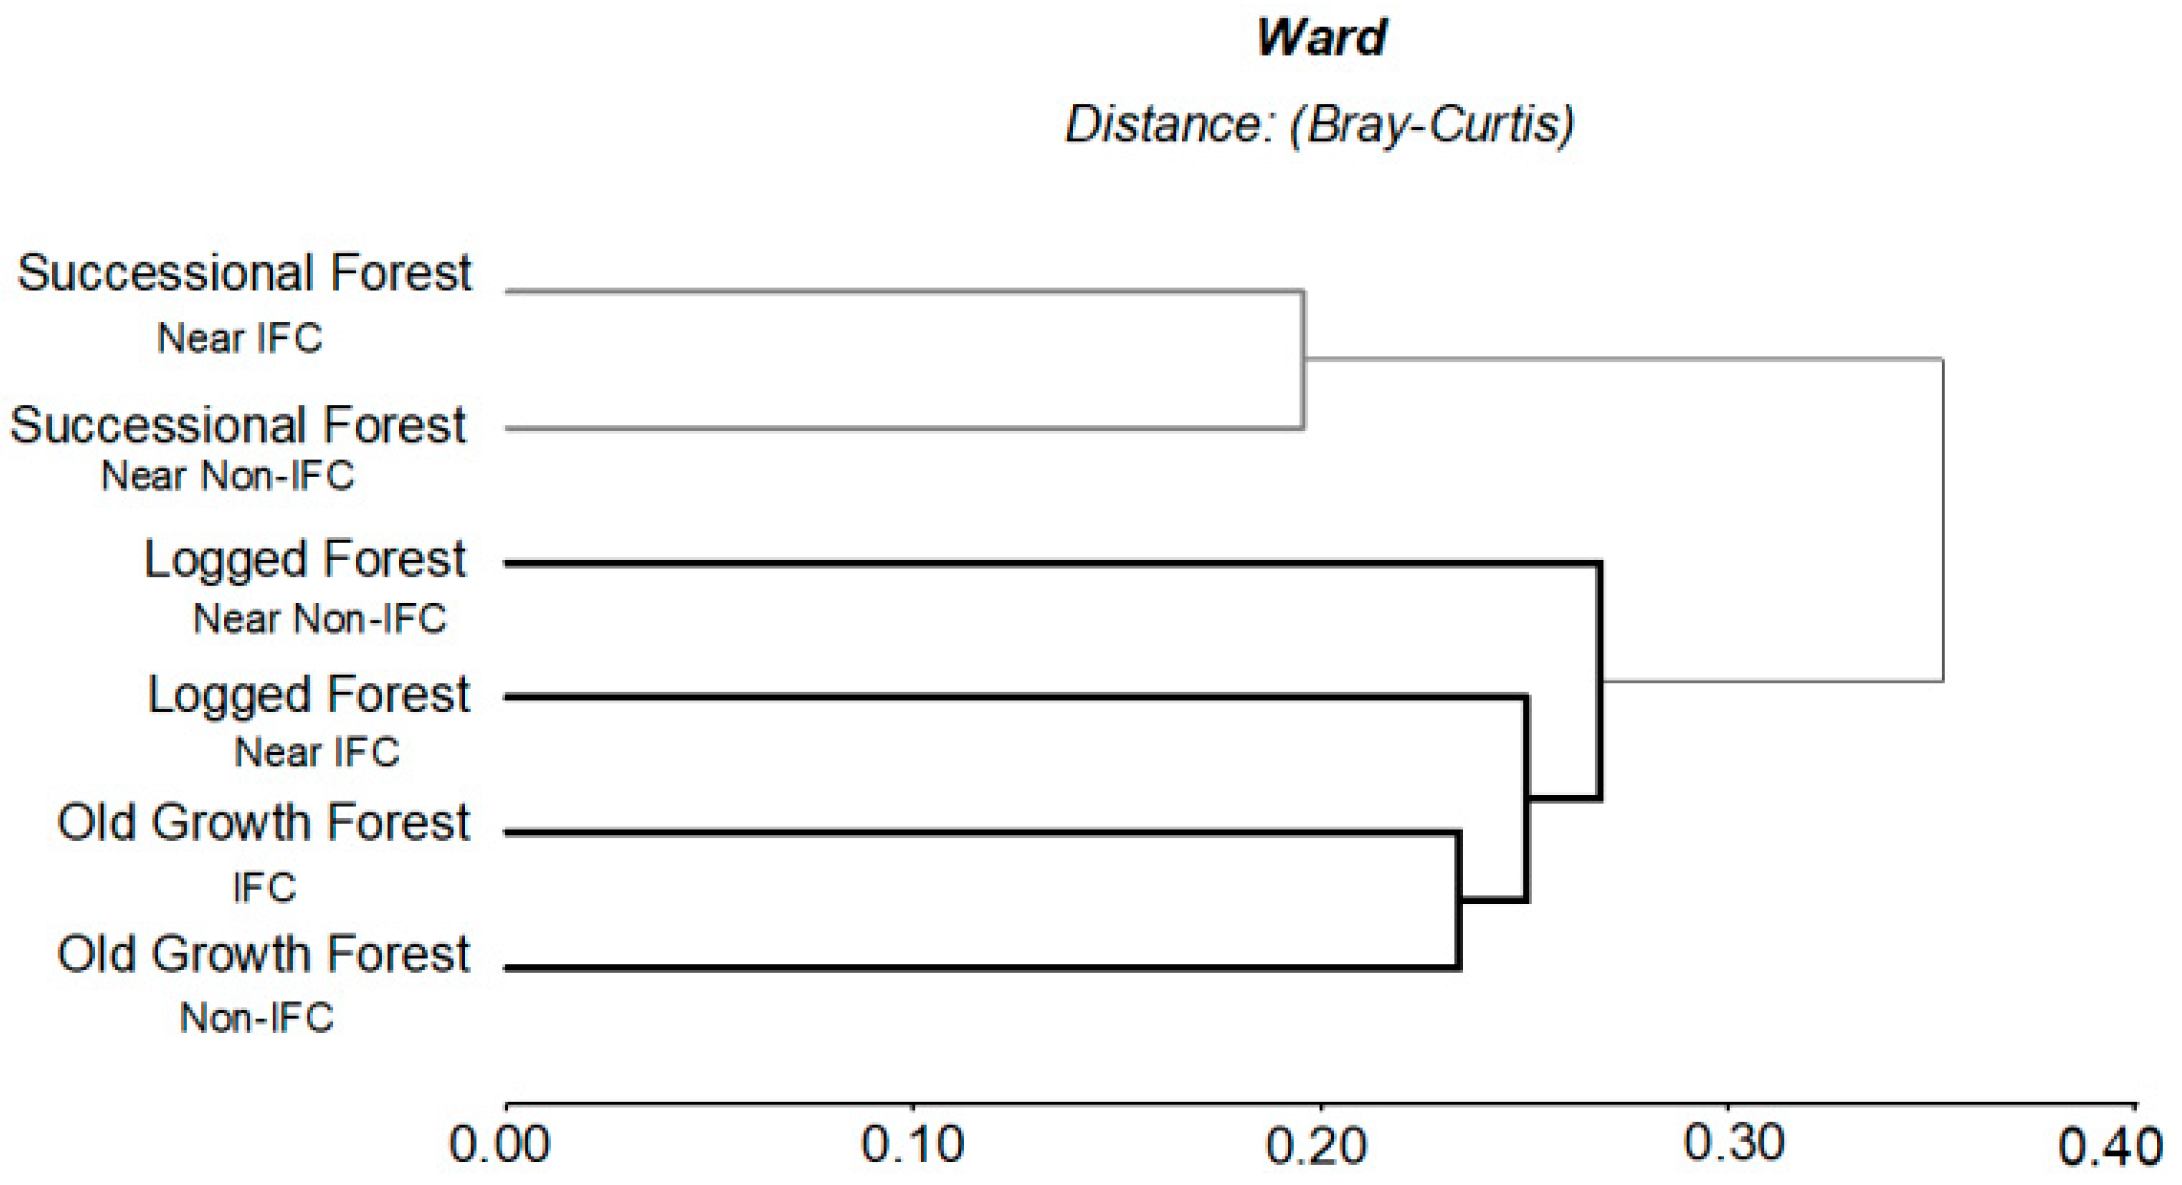
3.1.2. Influence of IFC, Non-IFC and Forest Types on Ecosystem Services Degradation
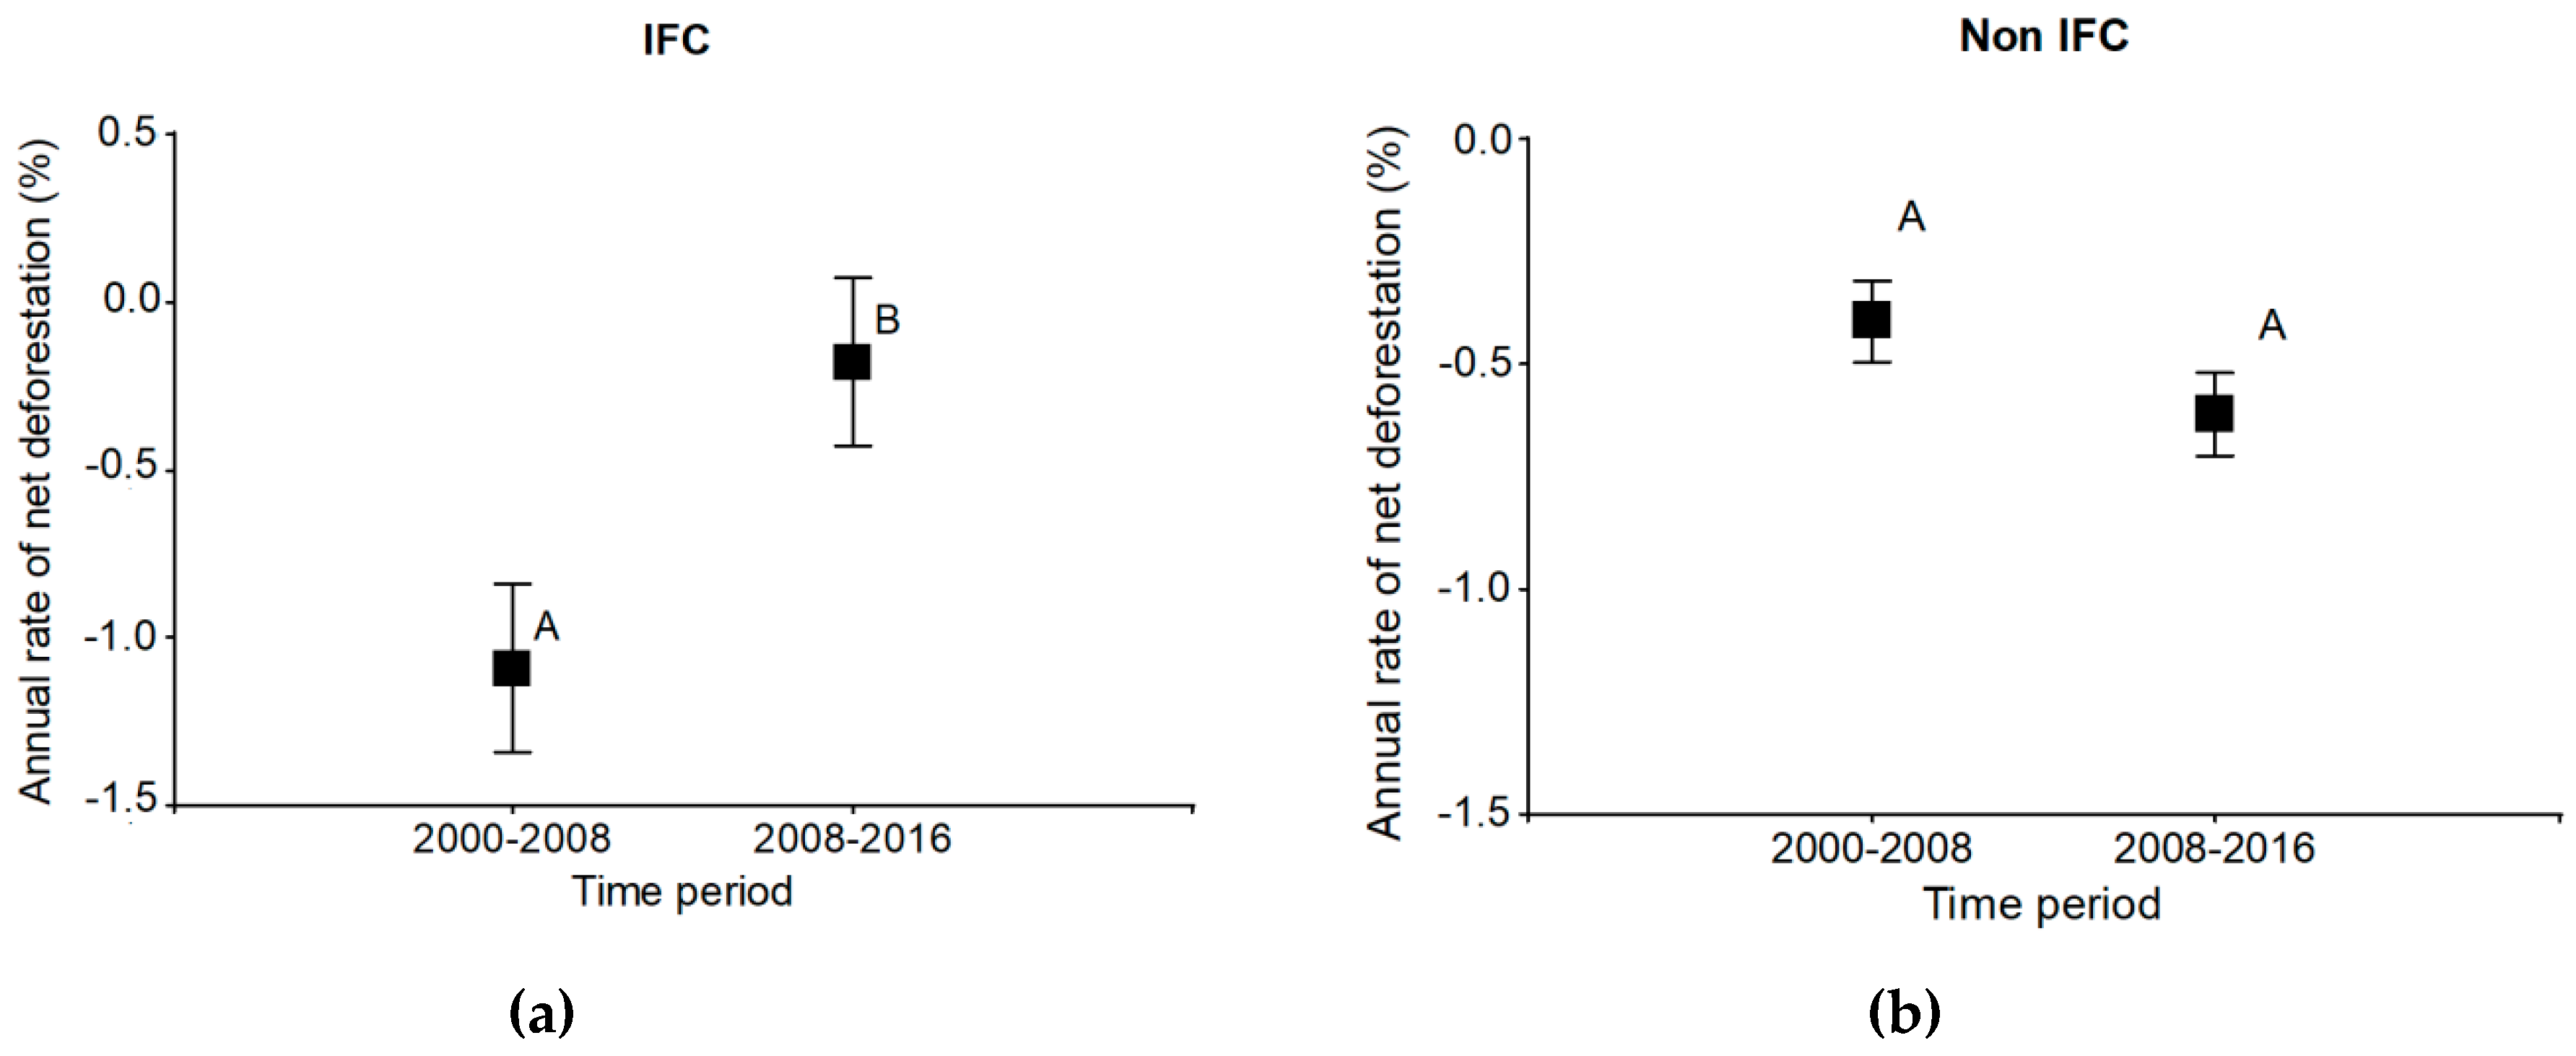
Here we present results of interactions between forest types and landscapes with and without IFC. We analyze whether old-growth forests under IFC have higher amounts of carbon stocks, timber volume and species richness than old-growth forest in non-IFC landscapes. Moreover, we present information on logged and successional forests adjacent to old-growth forest under IFC and logged and successional forest in non-IFC landscapes.
Statistical differences were found for interactions between IFC landscapes, non-IFC landscapes and forest types, namely for AGC (p ≤ 0.10), total carbon (p ≤ 0.05) and richness (p ≤ 0.10) (Table 2, Figure 4). The mean AGC for old-growth forest under IFC was 159 Mg C·ha−1, whereas for old-growth forest with non-IFC it was 172 Mg C·ha−1, showing no statistical difference between them. However, when comparing AGC from different forest types, we found significant differences. An interesting result was that logged forests near areas under IFC (Socio Bosque) had higher amounts of AGC (125 Mg C·ha−1) than logged forest in non-IFC landscapes (101 Mg C·ha−1). Successional forest near IFC and in non-IFC landscapes had the lowest AGC of between 95–91 Mg C·ha−1. Old-growth forest total carbon stocks were similar, having 228 Mg C·ha−1 for IFC and 246 Mg C·ha−1 for non-IFC landscapes; but, were much higher compared to other forest types. Logged forest near IFC stored 190 Mg C·ha−1 and 163 Mg C·ha−1 in non-IFC areas; the successional forest had 157 Mg C·ha−1 and 149 Mg C·ha−1 respectively (Figure 4; Table A7).
No significant differences were found for species richness of old-growth forest under IFC and non-IFC (55 species each per plot), and logged forests in non-IFC landscapes (53 species). In contrast, species richness of logged forests near IFC (46 species) were statistically different from old-growth forests nearby. Surprisingly, these significances did not occur between logged forests and old-growth forests in non-IFC landscapes. Successional forests had the lowest number of species per plot with 36 species in IFC and 31 species in non-IFC landscapes (Figure 4).
Cluster analysis for species composition separated successional forests (near IFC and non-IFC) from old-growth and logged forests. Old-growth forests under IFC and non-IFC landscapes were grouped together, suggesting that species compositions in these areas are comparable. Species composition in logged forests in areas near IFC forests was more similar to old-growth forests than to logged forests in non-IFC landscapes, implying that there may be less degradation if logging is carried out near areas under IFC (Figure 5).

3.2. Deforestation

The annual rate of net deforestation at the parish level was statistically reduced in parishes where IFC was implemented. Before the implementation of the program, parishes with IFC had an average annual rate of net deforestation of −1.09% (2000–2008). This rate decreased to −0.18% (2008–2016) after the implementation of the IFC program (Figure 6a). In contrast, in parishes without IFC (Figure 6b), annual deforestation was lower in the beginning and increased from −0.41% for the period 2000–2008, to −0.61% for 2008–2016. The increase was, however, not significant.

4. Discussion

4.1. Degradation

4.1.1. Influence of Forest Types on Ecosystem Services Degradation

The main difference found in our study can be attributed to forest types. Mean total carbon stocks (AGC + DOM + SOC) in old-growth forests were 237 Mg C·ha−1, and for AGC they were 166 Mg C·ha−1. These results are consistent with other studies of tropical lowland forests in the Pan-Amazon region which ranged between 175 Mg C·ha−1 and 238 Mg C·ha−1 for total carbon stocks [2,4,104] and among 120 Mg C·ha−1 and 165 Mg C·ha−1 for AGC [2,4,105,106]. With regard to provisioning services, we estimate an average timber volume in old-growth forests of 387 m3 ha−1, which is within the range of other studies from the Pan-Amazon region reporting between 240 m3 ha−1 and 425 m3 ha−1 [14,34]. Therefore, our results for carbon stocks and volume suggest that the sampled old-growth forests have an adequate conservation status, with carbon and volume levels similar to the ones reported for undisturbed old-growth forest or with minimal impact [104,105,106].
As reported by Hososuma et al. [30] and Kissinger et al. [31], 70% of the forest degradation effects in Latin America are related to timber extraction, which is consequently the main degradation driver. Our analyses also revealed that logged forests show signs of degradation due to timber extraction, which were reflected in 25% less total carbon stocks, 32% less AGC and timber volume compared with old-growth forests. Logged areas followed mainly the criteria of PAFSI program (selective logging); in this sense, harvest intensity and the extent of damage caused by intervention are important factors that influence the forest’s ability to recover and maintain ecological functions [34,107]. According to Sist and Nascimiento [34], only 50% of the commercial stand volume would recover after 30 years, under reduced impact logging (RIL) techniques with an average extraction intensity of 6 trees ha−1 and 20% of damage caused by harvest. West et al. [35] compare above-ground biomass (AGB) of conventional logging (CL) and RIL and show that plots under CL lose 26% of AGB while those with RIL lose 17%. They conclude that after 16 years RIL plots recovered by 100% (2.8 Mg ha−1 year); whereas CL plots only recovered 77% (0.5 Mg ha−1 year). While Rutishauser et al. [36], mention that a forest may require 12, 43 or 75 years of recovery if logging activities reduce 10%, 25% or 50% of the ACG.
Logging activities cause considerable degradation in forest stands and can produce significant changes in the structure. In addition, in the Amazon region logging activities could contribute to land use change [108]. Forest degradation and deforestation are important factors in our study area since in Ecuador 63% of the volume containing high-quality timber that can be logged legally is located in Amazon lowland forests [109]. Therefore, the Amazon lowland forest is attractive for timber harvesting. Considering the substantial degradation of these ecosystems due to logging, it is important to prevent further illegal timber extraction in logged areas. In addition, a cascading use (Cascading use: “is a strategy to use raw materials such as timber or other biomass, in chronologically sequential steps as long, often and efficiently as possible for materials and only to recover energy from them at the end of the product life cycle. It is the intention that the increased cascading use of wood will contribute to more resource efficiency and consequently reduce pressure on the environment” [110] ) of timber products can be an adequate strategy for reducing further carbon losses in order to increase forest resource efficiency and reduce pressure on forest ecosystems [110]. Since cascading use is a strategy that requires efficiency within industries for processing timber after harvesting, any planning of large-scale use of Amazon timber potential has to be accompanied by strict control of logging intensities and recovery periods as well as the setting up of an efficient timber processing infrastructure. As a complement thereto, the conservation of old-growth forest areas through IFC programs (Socio Bosque) is necessary. This is particularly relevant to the area that was studied, since Pastaza, Napo and Orellana contain about 5.5 M ha of forest, corresponding to 43% of the total forest area of the country [71,109].
Successional forests in our study areas were between 12 and 28 years. In comparison to the other forest types, they had the lowest values of AGC, total carbon, timber volume and species richness. They were statistically different from old-growth and logged forests (except for volume in logged forest) (Figure 3). According to our results, successional forest could hold between 56–64% of AGC (Mg C·ha−1), total carbon stocks (Mg C·ha−1) and timber volume (m3 ha−1) in contrast to old-growth forest, and among 82% to 87% in comparison to logged forest. Despite these low amounts (93 Mg C·ha−1 average) compared with the other forest types, it is important to highlight the potential of naturally regenerated forests for landscape restoration and carbon sequestration [111], especially in landscapes where logging is carried out in order to compensate carbon losses from forest interventions. For example, if we consider that in the provinces of Pastaza, Napo and Orellana a total of 3597 ha year−1 of forest have been regenerated between 2014 and 2016 [13], the potential sequestered carbon for the next three decades would be 334,521 Mg C considering the AGC average of our data (successional forest between 12 to 28 years). It is noteworthy to mention that our successional forests can sequester around 71 Mg C·ha−1 in AGC between 12 and 16 years; while after 25 and 28 years of regeneration this amount reaches 140 Mg C·ha−1. Therefore, the potential for carbon stock can be higher if those forests reach a middle age of regeneration, with most likely additional positive side-effects on biodiversity indicators.
Based on our results, successional forests contribute to compensate carbon losses from logging on a landscape scale. Moreover, they can serve as an effective tool for biological corridors to improve connectivity; and in addition, provide goods and services to local communities helping with livelihoods diversification [74,112].

4.1.2. Influence of IFC, Non-IFC and Forest Types on Ecosystem Services Degradation

We found that, in the Ecuadorian Amazon lowland forest, there was no difference in carbon stocks, timber volume and species richness between old-growth forest with IFC and old-growth forest in non-IFC landscapes. Old-growth forests in IFC and non-IFC showed no degradation of ecosystem services since they had carbon stocks and volume contents similar to mature forests with adequate conservation in other Amazonian forests [104,105,106]. As we note in the previous sections, there is a lack of studies analyzing the effects of conservation policies and degradation in Ecuador. In our extensive search, we found the work of Mohebalian and Aguilar [55] who detected degradation effects in areas not enrolled in the Socio Bosque program, but the differences were statistically not significant. They also found a higher presence of timber species in Socio Bosque areas than in other areas, which indicates harvesting activities in non-Socio Bosque lands. However is important to point out that this study was performed in private landholdings, whereas our study was performed in communal lands. In the Central Amazon region (Pastaza, Napo and Orellana) 98% of Socio Bosque program area is under communal tenure, which highlights the importance of our results.
Other studies in the tropics mention that areas without a conservation strategy could have positive outcomes for community forestry compared to state protection. When people have ownership or management rights over ecosystem resources, they will genuinely support conservation objectives in comparison to a situation of restricted access [52,113,114]. Yet, such community protection will only function if embedded in a context where utilization of resources is possible, e.g., in nearby designated areas [115,116]. Bray et al. [51], Naughton-Treves et al. [117] and Porter et al. [53] found that forest loss on communal lands was lower or equal to that in protected areas. Despite the fact that old-growth forests in non-IFC landscapes do not show evidence of degradation, it is important to consider that the Ecuadorian Central Amazon currently has a low population density [118], and households still manage a considerable amount of land, so they resort to their own forests in order to satisfy the demand for forest products. Nevertheless, as soon as the resources in private lands are depleted, it is likely that the remaining forests, especially those without any protection status, will be more vulnerable. In that context, IFC can become more important for maintaining forest integrity, especially when forest pressure increases in the future. Given the fact that currently there are still areas of old-growth forest which have not been protected, the importance of policies aiming to conserve or otherwise manage forests sustainably is significant. Such policies can take the form of programs like Socio Bosque, governmental or communal protected areas, or any other strategy.
Our study identified an unexpected positive effect for logged forests near IFC forests, as these forests had higher AGC stocks (125 Mg C·ha−1) than logged forests in non-IFC landscapes (101 Mg C·ha−1). When these forests were compared with old-growth forests, we estimated a reduction in AGC of 21% in logged forests near IFC and 41% in logged forests in non-IFC landscapes. Such findings are surprising and suggest that the presence of a conservation program in the area has effects on how logging is performed. The adequate conservation of old-growth forest, as well as less degradation of logged forests on IFC landscapes, can be related to a greater presence of governmental representatives who are negotiating, monitoring and controlling IFC areas. Consequently, people living close to those areas could feel more pressure to follow the forest regulations, since there is a higher probability of being caught breaking the law than in non-IFC landscapes, where government presence could be more scarce. Jones et al. [54] reported that people living around Socio Bosque areas perceive more restrictions and a fast response by environmental authorities when illegal activity occurs. Our results show that is possible to balance and integrate forest conservation and timber production [66]. Nevertheless, it is necessary to implement improved forest management procedures, like reduced impact logging (RIL), which may result in lower forest degradation. Runting et al. [66] show that extreme land use sharing or extreme land use sparing in forest landscapes is not necessarily the optimal solution. At landscape level, mixed land use with both approaches is probably the better option to guarantee conservation of ecosystem services [66,67].
Species richness is an important attribute that can influence ecosystems services and also reflects anthropogenic impact. Studies show a positive relationship between species richness and ecosystem services [23,25,26,27,28]. The number of species per plot that we found in old-growth forests under IFC versus non-IFC was the same. Cluster analyses showed that they were also similar in composition, suggesting that there is no species loss when we compare old-growth forests across landscapes. In contrast, Shahabuddin and Rao [114] mentioned that areas without conservation strategies “fall short of the needs of comprehensive biological conservation,” implying that state protection is more effective and that communal forest conserves an altered species composition and tends to lose species, often those with the highest conservation value.
Logged forests had a similar number of species per plot in comparison with old-growth forests, but, as expected, they showed a change in species composition due to human intervention. The surprisingly high values of species richness in logged forests located in non-IFC landscapes could thus be attributed to a post-logging stimulation of pioneer species which had been suppressed before and reached the DBH threshold of this study after logging interventions [119,120,121]. Our results on species composition confirm this finding and are in line with results of stronger logging disturbances in forests without the presence of IFC.
As expected, successional forests near IFC and in non-IFC landscapes showed the lowest carbon stocks, timber volume, and species richness; in addition, they presented a different species composition (Figure 5) in contrast to old-growth forest and logged forest. Nevertheless, due to increase in population growth, deforestation and land abandonment, successional forest can become more important in the tropics [122,123]. Therefore, this forest type will play a relevant role and should be included in conservation strategies or incentives programs since they can contribute to landscape restoration and provision of ecosystems services, and in addition help to support biodiversity of old-growth forest [124,125,126].

4.2. Deforestation

The parishes in this study showed two trends: (i) in parishes influenced by IFC, the deforestation decreased from −1.09% in 2000–2008 to −0.18% in 2008–2016, implying a significant (p = 0.04) and positive change of deforestation. (ii) The parishes without IFC, on the other hand, showed an increase of forest loss changing from −0.41% in 2000–2008 to −0.61% for 2008–2016, but the change was not statistically different between the periods (p = 0.15); nevertheless, it is worth emphasizing that deforestation has increased in the absence of a formal conservation strategy.
This is in line with studies carried out in other tropical regions; for example, Bruner et al. [38] assessed 93 protected areas across the tropics and found that only 17% of the areas had a net forest clearance since their establishment. Nagendra [39] evaluated 49 locations where protected areas had a lower rate of clearance than in surrounding areas. Similar results were found by Mohebalian and Aguilar [55] regarding areas with Socio Bosque program in Ecuador, according to which these areas are 9% less likely to be deforested. Jones et al. [54] mention that this program can reduce the average annual deforestation rate (forest cover change) in the Ecuadorian Amazon region by 0.4% - 0.5% in contrast to areas without it. At the national level, Cuenca et al. [127] suggest that between 1.5% to 3.4% of the forest might have been deforested in 2014 if Socio Bosque would not have been implemented. Understanding how IFC influences forest conservation with in situ data has important implications for future policies. The relation between IFC and deforestation is assumed to be due to financial compensation and higher governmental presence in controlling illegal activities, which are thus seen as important factors for avoiding deforestation in areas with IFC programs [54]. However, incentives do not always have a major effect on the reduction of forest cover loss; Sanchez-Azofeifa et al. [56] and Pfaff et al. [57] found that payments for ecosystem services in Costa Rica have little effect on declining deforestation rates between 1997–2000. Though, it is possible that there was an influence of conservation policies implemented previously, or that these areas were not under high deforestation pressure [1].

5. Conclusions

The main focus of recent research has been the evaluation of the effect of IFC on forest cover loss. Though this kind of analysis provides important information about the effectiveness of the programs in maintaining forest cover, it does not indicate the condition of ecosystems and their functionality as a result of anthropogenic activities. We reduce this knowledge gap through the incorporation of forest degradation aspects into the assessment of ecosystems services and species richness in landscapes with and without IFC. The adequate conservation of ecosystem services in IFC areas and the unexpected positive side-effect of IFC on adjacent forest types, suggests that conservation strategies and logging activities are getting more compatible at a landscape level, without deviating higher pressure (leakage effect) to adjacent forest types. Additionally, at the parish level, we found a decrease of deforestation rates after the implementation of the IFC program. People living around Socio Bosque areas were probably restrained from illegal logging, overexploitation or land use conversion in adjacent areas due to a greater presence of governmental representatives or higher environmental awareness of the society. Our results are supporting evidence for the importance of IFC as an alternative conservation strategy to maintain forest integrity. Since the IFC program is a main step to articulate forest conservation with REDD+ schemes (Reducing Emissions from Deforestation and Forest Degradation), our results are very pertinent for the actual conservation debates in Ecuador.
In this study, we also considered two important drivers of deforestation and degradation that affect ecosystem services and species richness: (i) timber extraction and (ii) conversion of old-growth forests into pastures or agricultural lands. There is evidence of a significant reduction of carbon stocks and timber volumes as a consequence of logging activities in comparison to old-growth forests. However the carbon storage is significantly higher than successional forests resulting from abandoned pastures or agricultural lands. Sustainable forest management can consequently be considered as important tool for climate change mitigation where the agricultural frontier puts old growth forests under risk of conversion. Long term studies are needed to evaluate the effect of logging intensities and frequency, in order to find an optimal balance between climate change mitigation potential and financial returns of forest interventions. The considerable carbon stocks of successional forests on abandoned lands could make them a promising but overlooked instrument for restoration programs. They could help to offset the negative impacts of degradation (logging) and forest cover loss (deforestation) on a landscape level and therefore should be incorporated into the REDD+ strategies as part of the climate change mitigation efforts.
Finally, considering the enormous potential of timber and other natural resources in the Amazon, there is an urgent need for land use planning. In this sense, the incorporation of landscape approaches can serve as an integral tool to prioritize areas for conservation, sustainable forest management and restoration.

Author Contributions

Conceptualization: P.E. and S.G.; Methodology: P.E. and S.G.; Formal analysis: P.E.; Investigation: P.E.; Data curation: P.E.; Writing—original draft preparation: P.E.; Writing—review and editing; P.E., R.F. and S.G; Visualization: P.E.; Supervision: S.G.; Project administration: S.G., P.E. and R.F.; Funding acquisition: S.G., R.F. and P.E.

Funding

The study and the authors are part of the project Landscape Forestry in the Tropics (LaForeT) conducted by the Thünen Institute of International Forestry and Forest Economics, Hamburg, Germany and funded by the German Federal Ministry of Food and Agriculture. In addition P.E. received a four-year scholarship from the Secretary of Higher Education, Science, Technology and Innovation of Ecuador (SENESCYT) (https://www.educacionsuperior.gob.ec/). The publication of this work was supported by the German Research Foundation (DFG) and the Technical University of Munich (TUM) in the framework of the Open Access Publishing Program.

Acknowledgments

We would like to thank the Thünen Institute of International Forestry and Forest Economics for the financial support and the Secretary of Higher Education, Science, Technology and Innovation of Ecuador (SENESCYT) for P.E. scholarship. Also we thank Tatiana Ojeda, Melvin Lippe, and Jobst-Michael Schröder for reviewing an earlier version of this manuscript. Thanks to the proofreading Service of TUM Graduate School and proofreading Service of Thünen Institute. We also want to thank Universidad Estatal Amazónica of Ecuador, especially Bolier Torres and Fabián Tamayo for their logistical support and scientific advice. Finally, we thank our field team in Ecuador: Daniel Paguay, Gabriel Grefa, Cristian Tipán, and Rodrigo Maza.

Conflicts of Interest

The authors declare no conflict of interest.

Appendix A

Table A1. Environmental variables considered for the block design.
Environmental Variables
LandscapeForest Cover 1 (%)Agricultural Land 1 (%)Ecosystem 2Soil Type 3Soil Texture 4Mean Distance from Plots to Roads (m)Altitude m a.s.l.
(mean)Min.Max
IFC-1 (block 1)71.5227.31tropical lowland forestInceptisol/Andisolmedium–moderately coarse3328.86887.9560.01180.0
Non-IFC-1 (block 1)57.639.32tropical lowland forestInceptisol/Andisolmedium–moderately coarse1087.61667.0479.01049.0
IFC-2 (block 2)72.6225.77tropical lowland forestInceptisol/Andisolfine1312.41525.6403.0758.0
Non-IFC-2 (block 2)81.8416.77tropical lowland forestInceptisol/Andisolfine–medium1302.99568.6403.01028.0
IFC-3 (block 3)65.0328.59tropical lowland forestInceptisolfine–medium1487.63429.4348.0688.0
Non-IFC-3 (block 3)50.1743.13tropical lowland forestInceptisolfine–medium826.91372.2299.0600.0
IFC-4 (block 4)61.8334.21tropical lowland forestInceptisol/Andisolfine–medium988.60552.7331.0819.0
Non-IFC-4 (block 4)49.3748.16tropical lowland forestInceptisol/Andisolfine–medium1181.18451.3315.0654.0
Source: 1 MAE [128]; 2 MAE and FAO [109]; 3 SIGTIERRAS [129]; 4 MAGAP [130].
Table A2. Demographic variables considered for the block design.
Demographic Variables (Socio-Economic)
LandscapePopulation Density (hab. per km2) 1Mean Distance from Households within Landscapes to Forest (km) 2Distance from Landscape to Large Cities (km) 2
IFC-1 (block 1)12.682.8224.00
Non-IFC-1 (block 1)9.442.6530.42
IFC-2 (block 2)9.002.3846.83
Non-IFC-2 (block 2)9.332.0360.50
IFC-3 (block 3)18.092.0535.84
Non-IFC-3 (block 3)21.241.4358.24
IFC-4 (block 4)24.220.8310.20
Non-IFC-4 (block 4)29.771.1216.80
1 INEC [118]; 2 Based on own information gathered through 673 surveys and eight community workshops (one per landscape) within the eight landscapes comprised by the LAFORET Project, Thünen Institute of International Forestry and Forest Economics, Germany.
Table A3. Analysis of variance between IFC and Non-IFC landscapes considering cofounding variables.
FactorIFC vs. non-IFC
IFC
Mean (std.err)
Non-IFC
Mean (std.err)
p-Value
Forest (%)67.75 (5.67)59.75 (5.67)0.3569
Agricultural land (%)28.97 (5.07)36.85 (5.07)0.3143
Mean Altitude m a.s.l.598.90 (84.21)514.78 (84.21)0.5064
Mean Distance from plots to roads (m)1779.38 (379.25)1099.67 (379.25)0.2520
Population Density (hab. per km2)16.00 (4.22)17.45 (4.22)0.8166
Distance from households within the landscapes to forest (km)2.02 (0.39)1.81 (0.39)0.7099
Distance from landscape to large cities (km)29.22 (9.39)41.49 (9.39)0.3911
Table A4. Analysis of variance of successional forest age between IFC and Non-IFC landscapes.
VariableIFC (mean/Std. err.)Non-IFC (mean/Std. err.)p-Value
Successional forest age20 (1.26)19 (1.26)0.6439
Table A5. Mean values and standard error of AGC, DOM, SOC, total carbon, timber volume and species richness for landscapes with IFC and Non-IFC.
VariableIFCS.E.Non-IFCS.E.
AGC (Mg C·ha−1)126.624.81121.234.93
DOM (Mg C·ha−1)11.370.5410.940.52
SOC (Mg C·ha−1)51.445.3148.705.31
Total carbon (Mg C·ha−1)191.7710.43185.9710.43
Volume (m3 ha−1)303.3915.65283.2315.94
Richness (#species/plot)46.112.5646.642.56
AGC: Above ground carbon. DOM: Dead organic matter. SOC: Soil organic carbon.
Table A6. Mean values and standard error of AGC, DOM, SOC, total carbon, timber volume and species richness for forest types.
VariableOld Growth ForestS.E.Logged ForestS.E.Successional ForestS.E.
AGC (Mg C·ha−1)165.635.87112.975.8793.175.75
DOM (Mg C·ha−1)11.600.6711.860,6410.010.64
SOC (Mg C·ha−1)52.575.3948.195.3949.455.39
Total carbon (Mg C·ha−1)236.8510.40176.7510.40153.0110.40
Volume (m3 ha−1)387.2916.09264.7816.09227.8516.42
Richness (#species/plot)55.172.2649.922.2634.042.26
AGC: Above ground carbon. DOM: Dead organic matter. SOC: Soil organic carbon.
Table A7. Mean values and standard error for AGC, DOM, SOC, total carbon, timber volume and species richness for IFC, non-IFC and forest types.
VariableOld-Growth Forest with IFCS.E.Old-Growth Forest in Non-IFC LandscapesS.E.Logged Forest Near IFCS.E.Logged Forest in Non-IFC LandscapesS.E.Successional Forest Near IFCS.E.Successional Forest in Non-IFC landscapesS.E.
AGC (Mg C·ha−1)159.367.94171.908.28125.377.94100.578.2895.137.9491.207.94
DOM (Mg C·ha−1)12.020.9711.180.9312.850.9310.880.899.260.9310.760.89
SOC (Mg C·ha−1)50.915.7854.245.7851.265.7845.125.7852.165.7846.755.78
Total carbon (Mg C·ha−1)227.6012.78246.1012.78190.3912.78163.1012.78157.3212.78148.7112.78
Volume (m3 ha−1)380.2822.35394.3023.16283.6223.16245.9522.3246.2822.35209.4224.07
Richness (#species/plot)55.173.1955.173.1946.673.1953.173.1936.503.1931.583.19
AGC: Above ground carbon. DOM: Dead organic matter. SOC: Soil organic carbon.
Table A8. Annual rate of deforestation at a parish level for areas influence by IFC and Non-IFC between 2000–2008 and 2008–2016.
IFC–Non-IFCAnnual net Deforestation Rate (%) 2000–2008 Annual net Deforestation Rate (%) 2008–2016Tendency
↓↑
IFC 1−0.770.78
Non-IFC 1−0.36−0.49
IFC 2−1.23−0.33
Non-IFC 2−0.55−0.68
IFC 3−1.31−0.41
Non-IFC 3−0.53−0.43
IFC 4−1.06−0.76
Non-IFC 4−0.18−0.85
Decrease of the annual net deforestation rate between periods 2000–2008 to 2008–2016 at a parish level. Increase of the annual net deforestation rate between periods 2000–2008 to 2008–2016 at a parish level. Source: SUIA, (2018).

References

  1. MEA. Millennium Ecosystem Assessment. Ecosystems and Human Well-Being: Synthesis. Millennium Ecosystem Assessment; Island Press: Washington, DC, USA, 2005; pp. 1–155. [Google Scholar]
  2. The State of Forests in the Amazon Basin, Congo Basin, and Southeast Asia. A Report Prepared for the Summit of the Three Rainforest Basins; FAO: Rome, Italy, 2011; pp. 1–80. [Google Scholar]
  3. IPCC. Ecosystems and Their Goods and Services; IPCC: Cambridge, UK, 2001; pp. 237–315. [Google Scholar]
  4. Saatchi, S.; Harris, N.; Brown, S.; Lefsky, M.; Mitchard, E.; Salas, W.; Zutta, B.; Buermann, W.; Lewis, S.; Hagen, S.; et al. Benchmark map of forest carbon stocks in tropical regions across three continents. Proc. Natl. Acad. Sci. USA 2011, 108, 9899–9904. [Google Scholar] [CrossRef] [PubMed] [Green Version]
  5. Meister, K.; Ashton, M.; Craven, D.; Griscom, H. Carbon Dynamics of Tropical Forests; Ashton, M., Tyrrell, M., Spalding, D., Gentry, B., Eds.; Springer: New York, NY, USA, 2012; pp. 51–75. [Google Scholar]
  6. Tovo, A.; Suweis, S.; Formentin, M.; Favretti, M.; Volkov, I.; Banavar, J.R.; Azaele, S.; Maritan, A. Upscaling species richness and abundances in tropical forests. Sci. Adv. 2017, 3, e1701438. [Google Scholar] [CrossRef]
  7. Haddad, N.M.; Brudvig, L.A.; Clobert, J.; Davies, K.F.; Gonzalez, A.; Holt, R.D.; Lovejoy, T.E.; Sexton, J.O.; Austin, M.P.; Collins, C.D.; et al. Habitat fragmentation and its lasting impact on Earth’s ecosystems. Sci. Adv. 2015, 1, e1500052. [Google Scholar] [CrossRef]
  8. Riitters, K.H.; Wickham, J.D.; Jones, K.B.; Smith, E.R.; Coulston, J.W.; Wade, T.G.; Smith, J.H.; O’Neill, R.V. Fragmentation of Continental United States Forests. Ecosystems 2002, 5, 815–822. [Google Scholar] [CrossRef]
  9. Asner, G.P.; Powell, G.V.N.; Mascaro, J.; Knapp, D.E.; Clark, J.K.; Jacobson, J.; Kennedy-Bowdoin, T.; Balaji, A.; Paez-Acosta, G.; Victoria, E.; et al. High-resolution forest carbon stocks and emissions in the Amazon. Proc. Acad. Sci. 2010, 107, 16738–16742. [Google Scholar] [CrossRef] [Green Version]
  10. Keenan, R.J.; Reams, G.A.; Achard, F.; De Freitas, J.V.; Grainger, A.; Lindquist, E. Dynamics of global forest area: Results from the FAO Global Forest Resources Assessment 2015. Ecol. Manag. 2015, 352, 9–20. [Google Scholar] [CrossRef]
  11. FAO. Global Forest Resources Assessment 2015. How the World´s Forest Change? 2nd ed.; Food and Agriculture Organization of the United Nations: Rome, Italy, 2016; pp. 1–45. [Google Scholar]
  12. FAO. Assessment of Forest and Carbon Stocks, 1990–2015. Reduce Overall Emissions, but Increase Degration; Food and Agriculture Organization of the United Nations: Roma, Italy, 2015; pp. 1–4. [Google Scholar]
  13. MAE. Deforestación del Ecuador Continental Periodo 2014–2016; Ministry of Environment: Quito, Ecuador, 2017; pp. 1–37.
  14. FAO. Global Forest Resources Assessment 2015; Food and Agriculture Organization of the United Nations: Rome, Italy, 2015; pp. 1–244. [Google Scholar]
  15. Lewis, S.L.; Malhi, Y.; Phillips, O. Fingerprinting the impacts of global change on tropical forests. Philos. Trans. R. Soc. Lond. 2004, 359, 437–462. [Google Scholar] [CrossRef]
  16. Mena, C.; Bilsborrow, R.; McClain, M. Socioeconomic Drivers of Deforestation in the Northern Ecuadorian Amazon. Environ. Manag. 2006, 37, 802–815. [Google Scholar] [CrossRef]
  17. Sierra, R. Patrones y Factores de Deforestación en el Ecuador Continental, 1990–2010. Y un Acercamiento a los Próximos 10 Años; Conservación Internacional Ecuador y Forest Trends: Quito, Ecuador, 2013; pp. 1–57. [Google Scholar]
  18. Wasserstrom, R.; Southgate, D. Deforestation, Agrarian Reform and Oil Development in Ecuador, 1964–1994. Nat. Resour. 2013, 4, 31–44. [Google Scholar] [CrossRef]
  19. Asner, G.; Knapp, D.; Broadbent, E.; Oliveira, P.; Keller, M.; Silva, J. Selective Logging in the Brazilian Amazon. Science 2005, 310, 480–482. [Google Scholar] [CrossRef]
  20. Blanc, L.; Echard, M.; Herault, B.; Bonal, D.; Marcon, E.; Chave, J.; Baraloto, C. Dynamics of aboveground carbon stocks in a selectively logged tropical forest. Ecol. Appl. 2009, 19, 1397–1404. [Google Scholar] [CrossRef] [PubMed] [Green Version]
  21. Edwards, D.; Tobias, J.; Sheil, D.; Meijaard, E.; Laurance, W. Maintaining ecosystem function and services in logged tropical forests. Trends Ecol. Evol. 2014, 29, 511–520. [Google Scholar] [CrossRef] [PubMed] [Green Version]
  22. Foley, J.; Asner, G.; Heil, M.; Coe, M.; DeFries, R.; Gibbs, H.; Howard, E.; Olson, S.; Patz, J.; Ramankutty, N.; et al. Amazonia revealed: Forest degradation and loss of ecosystem good and services in the Amazon basin. Ecol. Soc. Am. 2007, 5, 25–32. [Google Scholar] [CrossRef]
  23. Cardinale, B.; Duffy, E.; Gonzalez, A.; Hooper, D.; Perrings, C.; Venail, P.; Mace, G.; Tilman, D.; Wardle, D.; Kinzig, A.; et al. Biodiversityloss anditsimpactonhumanity. Nature 2012, 486, 59. [Google Scholar] [CrossRef] [PubMed]
  24. Foley, J.; DeFries, R.; Asner, G.; Barford, C.; Bonan, G.; Carpenter, S.; Chapin, S.; Coe, M.; Daily, G.; Gibbs, H.; et al. Global consequences of land use. Science 2005, 309, 570–574. [Google Scholar] [CrossRef] [PubMed]
  25. Harrison, P.; Berry, P.; Simpson, G.; Haslett, J.; Blicharska, M.; Bucur, M.; Dunford, R.; Egoh, B.; Garcia-Llorente, M.; Geamănă, N.; et al. Linkages between biodiversity attributes and ecosystem services: A systematic review. Ecosyst. Serv. 2014, 9, 191–203. [Google Scholar] [CrossRef] [Green Version]
  26. Loreau, M.; Naeem, S.; Inchausti, P.; Bengtsson, J.; Grime, J.; Hector, A.; Hooper, D.; Huston, M.; Raffaelli, D.; Schmid, B.; et al. Biodiversity and Ecosystem Functioning: Current Knowledge and Future Challenges. Science 2001, 294, 804–808. [Google Scholar] [CrossRef] [Green Version]
  27. Naeem, S.; Thompson, L.; Lawler, S.; Lawton, J.; Woodfin, R. Declining biodiversity can alter the performance of ecosystems. Nature 1997, 368, 734–737. [Google Scholar] [CrossRef]
  28. Ricketts, T.; Watson, K.; Koh, I.; Ellis, A.; Nicholson, C.; Posner, S.; Sonter, L. Disaggregating the evidence linking biodiversity and ecosystem services. Nat. Commun. 2016, 7, 13106. [Google Scholar] [CrossRef] [Green Version]
  29. Leadley, P.; Pereira, H.; Alkemade, R.; Fernandez-Manjarrés, J.; Proença, V.; Scharlemann, J.; Walpole, M. Biodiversity Scenarios: Projections of 21st Century Change in Biodiversity and Associated Ecosystem Services; Secretariat of the Convention on Biological Diversity: Montreal, QC, Canada, 2010; p. 132. [Google Scholar]
  30. Hososuma, N.; Herold, M.; De-Sy, V.; De-Fries, R.; Brockhaus, M.; Verchot, L.; Angelsen, A.; Romijn, E. An assessment of deforestation and forest degradation drivers in developing countries. Environ. Res. Lett. 2012, 7, 044009. [Google Scholar] [CrossRef]
  31. Kissinger, G.; Herold, M.; De-Sy, V. Drivers of Deforestation and Forest Degradation: A Synthesis Report for REDD+ Policymakers; Lexeme Consulting: Vancouver, BC, Canada, 2012; pp. 1–47. [Google Scholar]
  32. Bunker, D.; DeClerck, F.; Bradford, J.; Colwell, R.; Perfecto, I.; Phillips, O.; Sankaran, M.; Naeem, S. Species Loss and Aboveground Carbon Storage in a Tropical Forest. Science 2005, 310, 1029–1031. [Google Scholar] [CrossRef] [PubMed] [Green Version]
  33. Gerwing, J. Degradation of forest through logging and fire in the eastern Brazilian Amazon. For. Ecol. Manag. 2002, 157, 131–141. [Google Scholar] [CrossRef]
  34. Sist, P.; Nascimiento, F. Sustainability of reduced-impact logging in the Eastern Amazon. For. Ecol. Manag. 2007, 243, 199–209. [Google Scholar] [CrossRef]
  35. West, T.; Vidal, E.; Putz, F. Forest biomass recovery after conventional and reduced-impact logging in Amazonian Brazil. For. Ecol. Manag. 2014, 314, 59–63. [Google Scholar] [CrossRef]
  36. Rutishauser, E.; Hérault, B.; Baraloto, C.; Blanc, L.; Descroix, L.; Sotta, E.D.; Ferreira, J.; Kanashiro, M.; Mazzei, L.; d’Oliveira, M. Rapid tree carbon stock recovery in managed Amazonian forests. Curr. Biol. 2015, 25, R787–R788. [Google Scholar] [CrossRef] [Green Version]
  37. Andam, K.; Ferrano, P.; Pfaff, A.; Sánchez-Azofeifa, A.; Robalino, J. Measuring the effectiveness of protected area networks in reducing deforestation. Proc. Natl. Acad. Sci. USA 2008, 105, 16089–16094. [Google Scholar] [CrossRef] [Green Version]
  38. Bruner, A.; Gullison, R.; Rice, R.; Da-Fonseca, G. Effectiveness of Parks in Protecting Tropical Biodiversity. Science 2000, 291, 125–127. [Google Scholar] [CrossRef]
  39. Nagendra, H. Do Parks Work? Impact of Protected Areas on Land Cover Clearing. AMBIO 2008, 37, 330–337. [Google Scholar] [CrossRef]
  40. Morales-Hidalgo, D.; Oswalt, S.; Somanathan, E. Status and trends in global primary forest, protected areas, and areas designated for conservation of biodiversity from the Global Forest Resources Assessment 2015. For. Ecol. Manag. 2015, 352, 68–77. [Google Scholar] [CrossRef] [Green Version]
  41. Nelson, A.; Chomitz, K. Protected Area Effectiveness in Reducing Tropical Deforestation A Global Analysis of the Impact of Protection Status; The World Bank: Washington, DC, USA, 2009; p. 40. [Google Scholar]
  42. Cuesta, F.; Peralvo, M.; Baquero, F.; Bustamante, M.; Merino, A.; Muriel, P.; Freile, J.; Torres, O. Áreas Prioritarias para la Conservación del Ecuador Continental; Ministerio del Ambiente, CONDESAN, Pontificia Universidad Católica del Ecuador, GIZ: Quito, Ecuador, 2015; p. 109. [Google Scholar]
  43. Andrade, G.; Rhodes, J. Protected Areas and Local Communities: An Inevitable Partnership toward Successful Conservation Strategies? Ecol. Soc. 2012, 17, 1–14. [Google Scholar] [CrossRef]
  44. Corbera, E.; Kosoy, N.; Martinez, M. Equity implications of marketing ecosystem services in protected areas and rural communities: Case studies from Meso-America. Glob. Environ. Chang. 2007, 17, 365–380. [Google Scholar] [CrossRef]
  45. Duchelle, A.; Almeyda, A.; Wunder, S.; Börner, J.; Kainer, K. Smallholder Specialization Strategies along the Forest Transition Curve in Southwestern Amazonia. World Dev. 2014, 64, S149–S158. [Google Scholar] [CrossRef] [Green Version]
  46. DeKonig, F.; Aguinaga, M.; Bravo, M.; Chiu, M.; Lascano, M.; Tozada, T.; Suarez, L. Bridging the gap between forest conservation and poverty alleviation: The Ecuadorian Socio Bosque program. Environ. Sci. Policy 2011, 14, 531–542. [Google Scholar] [CrossRef]
  47. Grima, N.; Singh, S.; Smetschka, B.; Ringhofer, L. Payment for Ecosystem Services (PES) in Latin America: Analysing the performance of 40 case studies. Ecosyst. Serv. 2016, 17, 24–32. [Google Scholar] [CrossRef]
  48. Wunder, S. Payments for environmental services and the poor: Concepts and preliminary evidence. Environ. Dev. Econ. 2008, 13, 279–297. [Google Scholar] [CrossRef]
  49. Palacios, W.; Freire, J. Recursos forestales y territorios indigenas en Ecuador. In Proceedings of the Memorias del Primer Encuentro Andino de Derecho Forestal Ambiental con Enfoque Comunitario, Quito, Ecuador, 13–15 October 2004; pp. 116–119. [Google Scholar]
  50. Añazco, M.; Morales, M.; Palacios, W.; Vega, E.; Cuesta, A. Sector Forestal Ecuatoriano: Propuestas para una Gestión Forestal Sostenible. Serie de Investigación y Sistematización; Programa Regional ECOBONA—INTERCOOPERATION: Quito, Ecuador, 2010; Volume 8, pp. 1–169. [Google Scholar]
  51. Bray, D.; Duran, E.; Ramos, V.; Mas, J.; Velazquez, A.; McNab, R.; Barry, D.; Radachowsky, J. Tropical Deforestation, Community Forests, and Protected Areas in the Maya Forest. Ecol. Soc. 2008, 13, 1–20. [Google Scholar] [CrossRef]
  52. Nepstad, D.; Schwartzman, S.; Bamberger, B.; Santilli, M.; Ray, D.; Schlesinger, P.; Lefebvre, P.; Alencar, A.; Prinz, E.; Fiske, G.; et al. Inhibition of Amazon Deforestation and Fire by Parks and Indigenous Lands. Conserv. Biol. 2006, 20, 65–73. [Google Scholar] [CrossRef]
  53. Porter-Bolland, L.; Ellis, E.; Guariguata, M.; Ruiz-Mallén, I.; Negrete-Yankelevich, S.; Reyes-García, V. Community managed forests and forest protected areas: An assessment of their conservation effectiveness across the tropics. For. Ecol. Manag. 2011, 268, 6–17. [Google Scholar] [CrossRef]
  54. Jones, K.; Holland, M.; Naughton-Treves, L.; Morales, M.; Suarez, L.; Keenan, K. Forest conservation incentives and deforestation in the Ecuadorian Amazon. Environ. Conserv. 2016, 44, 56–65. [Google Scholar] [CrossRef] [Green Version]
  55. Mohebalian, P.; Aguilar, F. Beneath the Canopy: Tropical Forests Enrolled in Conservation Payments Reveal Evidence of Less Degradation. Ecol. Econ. 2018, 143, 64–73. [Google Scholar] [CrossRef]
  56. Sánchez-Azofeifa, A.; Pfaff, A.; Robalinno, J.; Boomhower, J. Costa Rica’s Payment for Environmental Services Program: Intention, Implementation, and Impact. Conserv. Biol. 2007, 21, 1165–1173. [Google Scholar] [CrossRef]
  57. Pfaff, A.; Robalino, J.; Sanchez-Azofeifa, A. Payments for Environmental Services: Empirical analysis for Costa Rica; Terry Sanford Institute of Public Policy, Duke University: Durham, NC, USA, 2008; pp. 404–424. [Google Scholar]
  58. Armenteras, D.; Rodríguez, N.; Retana, J. Are conservation strategies effective in avoiding the deforestation of the Colombian Guyana Shield? Biol. Conserv. 2009, 142, 1411–1419. [Google Scholar] [CrossRef]
  59. Defries, R.; Hansen, A.; Newton, A.; Hansen, M. Increasing isolation of protected areas in tropical forests over the past twenty years. Ecol. Appl. 2005, 15, 19–26. [Google Scholar] [CrossRef]
  60. FAO. FRA 2015. Term and Definitions; Forest Resources Assessment Working Paper 180; Food and Agriculture Organization of the United Nations: Rome, Italy, 2015; pp. 1–31. [Google Scholar]
  61. IPBES. Summary for Policymakers of the Assessment Report on Land Degradation and Restoration of the Intergovernmental Science-Policy Platform on Biodiversity and Ecosystem Services; IPBES: Bonn, Germany, 2018; pp. 1–44. [Google Scholar]
  62. Mitchard, E. The Hectares Indicators: A Review of Earth Observation Methods for Detecting and Measuring Forest Change in the Tropics; School of GeoSciences, University of Edinburgh: Edinburgh, UK, 2016; pp. 1–57. [Google Scholar]
  63. Edwards, D.; Gilroy, J.; Woodcock, P.; Edwards, F.; Larsen, T.; Andrews, D.; Derhé, M.; Docherty, T.; Hsu, W.; Mitchell, S. Land-sharing versus land-sparing logging: Reconciling timber extraction with biodiversity conservation. Glob. Chang. Biol. 2014, 20, 183–191. [Google Scholar] [CrossRef] [PubMed]
  64. Fischer, J.; Abson, D.; Butsic, V.; Chappell, M.; Ekroos, J.; Hanspach, J.; Kuemmerle, T.; Smith, H.; von-Wehrden, H. Land sparing versus land sharing: Moving forward. Conserv. Lett. 2014, 7, 149–157. [Google Scholar] [CrossRef]
  65. Green, R.; Cornell, S.; Scharlemann, J.; Balmford, A. Farming and the fate of wild nature. Science 2005, 307, 550–555. [Google Scholar] [CrossRef]
  66. Runting, R.; Griscom, B.; Struebig, M.; Satar, M.; Meijaard, E.; Burivalova, Z.; Cheyne, S.; Deere, N.; Game, E.; Putz, F. Larger gains from improved management over sparing–sharing for tropical forests. Nat. Sustain. 2019, 2, 53. [Google Scholar] [CrossRef]
  67. Griscom, B.; Goodman, R. Reframing the sharing vs. sparing debate for tropical forestry landscapes. J. Trop. For. Sci. 2015, 27, 145. [Google Scholar]
  68. MAE. Resultados Socio Bosque 2018; Ministry of Environment: Quito, Ecuador, 2018.
  69. MAE. Programa Socio Bosque; Ministry of Environment: Quito, Ecuador, 2016; p. 2.
  70. MAE. Sistematizacion Socio Bosque 2012; Ministry of Environment: Quito, Ecuador, 2012; pp. 1–43.
  71. MAE. Estadísticas de Patromonio Natural. Datos de Bsoques, Ecosistemas, Especies, Carbono y Deforestación del Ecuador Continental; Ministry of Environment: Quito, Ecuador, 2015; pp. 1–19.
  72. MAE; EcoCiencia; IUCN. La Biodiversidad del Ecuador. Informe 2000; Ministerio del Ambiente del Ecuador: Quito, Ecuador; EcoCiencia: Quito, Ecuador; Unión Mundial para la Naturaleza: Gland, Switzerland, 2001; p. 368.
  73. Pitman, N.; Terborgh, J.; Silman, M.; Núñez, P.L.; Neill, D.; Cerón, C.; Palacios, W.; Aulestia, M. Dominance and distribution of tree species in upper Amazonian terra firme forests. Ecology 2001, 82, 2101–2117. [Google Scholar] [CrossRef]
  74. Chazdon, R. Second Growth: The Promise of Tropical Forest Regeneration in an Age of Deforestation; University of Chicago Press: Chicago, IL, USA, 2014; pp. 1–429. [Google Scholar]
  75. Killmann, W. Proceedings: Expert Meeting on Harmonizing Forest-Related Definitions for Use by Various Stakeholders, Rome, Italy, 23–25 January 2002; Food and Agriculture Organization of the United Nations: Rome, Italy, 2002. [Google Scholar]
  76. Bonilla-Bedoya, S.; Estrella-Bastidas, A.; Ordoñez, M.; Sanchez, A.; Herrera, M. Patterns of timber harvesting and its relationship with sustainable forest management in the western Amazon, Ecuador case. J. Sustain. For. 2017, 36, 433–453. [Google Scholar] [CrossRef]
  77. MAE. Aprovechamiento de Recursos Forestales en el Ecuador y Procesos de Infracciones y Decomisos; Ministerio del Ambiente del Ecuador: Quito, Ecuador, 2011; pp. 1–28.
  78. Congo, G. Evolución del Aprovechamiento Forestal de Origen Legal en la Provincia de Napo; Universidad Tecnica del Norte: Ibarra, Ecuador, 2016; p. 115. [Google Scholar]
  79. MAE. Información de Planes de Aprovechamiento Forestal 2015–2016. Provincias de Napo, Orellana y Pastaza. Data Base: Ministerio del Ambiente del Ecuador; Ministerio del Ambiente del Ecuador: Quito, Ecuador, 2017.
  80. Brown, S.; Lugo, A. Tropical secondary forest. J. Trop. Ecol. 1990, 6, 1–32. [Google Scholar] [CrossRef]
  81. Condit, R.; Pitman, N.; Leigh, E.; Chave, J.; Terborgh, J.; Foster, R.; Nunez, P.; Aguilar, S.; Valencia, R.; Villa, G.; et al. Beta-Diversity in Tropical Forest Trees. Science 2002, 295, 666–669. [Google Scholar] [CrossRef] [Green Version]
  82. Morlon, H.; Chuyong, G.; Condit, R.; Hubbell, S.; Kenfack, D.; Thomas, D.; Valencia, R.; Green, J. A general framework for the distance-decay of similarity in ecological communities. Ecol. Lett. 2008, 11, 904–917. [Google Scholar] [CrossRef] [Green Version]
  83. Harper, K.; Macdonald, E.; Burton, P.; Chen, J.; Brosofske, K.; Saunders, S.; Euskirchen, E.; Roberts, D.; Jaiteh, M.; Esseen, P.A. Edge influence on forest structure and composition in fragmented landscapes. Conserv. Biol. 2005, 19, 768–782. [Google Scholar] [CrossRef]
  84. Sesnie, S.; Bryan, F.; Paul, G.; Zayra, R. Landscape-Scale Environmental and Floristic Variation in Costa Rican Old-Growth Rain Forest Remnants. Biotropica 2009, 41, 16–26. [Google Scholar] [CrossRef]
  85. MacDicken, K.G. A Guide to Monitoring Carbon Storage in Forestry and Agroforestry Proyects; Winrock International: Arlington, MA, USA, 1997; pp. 1–87. [Google Scholar]
  86. Pearson, T.; Walker, S.; Brown, S. Sourcebook for Land Use, Land-Use Change and Forest Projects; Winrock International and the BioCarbon Fund of the World Bank: Arlington, MA, USA, 2005; p. 57. [Google Scholar]
  87. Ravindranath, N.; Ostwald, M. Carbon Inventory Methods Handbook for Greenhouse Gas Inventory, Carbon Mitigation and Roundwood Production Projects; Springer Science & Business Media: Berlin, Germany, 2008; p. 299. [Google Scholar]
  88. IPCC. IPCC 5th Assessment Report “Climate Change 2013: The Physical Science Basis”; IPCC: Stockholm, Sweden, 2013. [Google Scholar]
  89. Chave, J.; Rejou-Mechain, M.; Burquez, A.; Chidumayo, E.; Colgan, M.; Delitti, W.; Duque, A.; Eid, T.; Fearnside, P.; Goodman, R.; et al. Improved allometric models to estimate the aboveground biomass of tropical trees. Glob. Chang. Biol. 2014, 20, 3177–3190. [Google Scholar] [CrossRef]
  90. Chave, J.; Coomes, D.A.; Jansen, S.; Lewis, S.L.; Swenson, N.G.; Zanne, A.E. Data from: Towards a Worldwide Wood Economics Spectrum; Dryad Digital Repositor: Durham, NC, USA, 2009. [Google Scholar]
  91. Chave, J.; Coomes, D.A.; Jansen, S.; Lewis, S.L.; Swenson, N.G.; Zanne, A.E. Towards a worldwide wood economics spectrum. Ecol. Lett. 2009, 12, 351–366. [Google Scholar] [CrossRef]
  92. MAE. Propiedades Anatómicas, Físicas y Mecanicas de 93 Especies Forestales; Ministerios del Ambiente del Ecuador: Quito, Ecuador, 2014; p. 169.
  93. Aguirre, Z.; Loja, A.; Solano, C.; Aguirre, N. Especies Forestales más Aprovechadas en la Región Sur del Ecuador; Universidad Nacional de Loja: Loja, Ecuador, 2015; pp. 1–80. [Google Scholar]
  94. Goodman, R.; Phillips, O.; Castillo, D.; Freitas, L.; Tapia, S.; Monteagudo, A.; Baker, T. Amazon palm biomass and allometry. For. Ecol. Manag. 2013, 310, 994–1004. [Google Scholar] [CrossRef]
  95. Chave, J. Medición de Densidad de Madera en Árboles Tropicales; Université Paul Sabatier: Touluse, France, 2006; pp. 1–7. [Google Scholar]
  96. Williamson, B.; Wiemann, M. Measuring wood specific gravity correctly. Am. J. Bot. 2010, 97, 519–524. [Google Scholar] [CrossRef]
  97. FAO. Estimación del Volumen Forestal y Predicción del Redimiento, con Referencia Especial en los Tropicos; FAO: Rome, Italy, 1981; pp. 1–93. [Google Scholar]
  98. Chamber, J.; Higuchi, N.; Schimel, J.; Ferreira, L.; Melack, J. Decomposition and carbon cycling of dead trees in tropical forests of the central Amazon. Oecologia 2000, 122, 380–388. [Google Scholar] [CrossRef]
  99. Soil Survey, S. Kellogg Soil Survey Laboratory Methods Manual; Report No. ed.; Natural Resources Conservation Service, U.S. Department of Agriculture: Washington, DC, USA, 2014; pp. 1–1030.
  100. Mostacedo, B.; Fredericksen, T. Manual de Métodos Básicos de Muestreo y Análisis en Ecología Vegetal; Proyecto de Manejo Forestal Sostenible (BOLFOR): Santa Cruz, Bolivia, 2000; pp. 1–81. [Google Scholar]
  101. Magurran, A.; McGill, B. Biological Diversity: Frontiers in Measurement and Assessment; OUP Oxford: Oxford, UK, 2011; pp. 1–151. [Google Scholar]
  102. Curtis, J.; McIntosh, R. The Interrelations of Certain Analytic and Synthetic Phytosociological Characters. Ecol. Soc. Am. 1950, 31, 434–455. [Google Scholar] [CrossRef]
  103. Chisholm, R.; Muller-Landau, H.; Abdul, R.; Bebber, D.; Bin, Y.; Bohlman, S.; Bourg, N.; Brinks, J.; Bunyavejchewin, S.; Butt, N.; et al. Scale-dependent relationships between tree species richness and ecosystem function in forests. J. Ecol. 2013, 101, 1214–1224. [Google Scholar] [CrossRef]
  104. Keith, H.; Mackey, B.; Lindenmayer, D. Re-evaluation of forest biomass carbon stocks and lessons from the world’s most carbon-dense forests. Proc. Natl. Acad. Sci. USA 2009, 106, 11635–11640. [Google Scholar] [CrossRef] [PubMed]
  105. Baker, T.; Phillips, O.; Malhi, Y.; Almeida, S.; Arrollo, L.; Di Fiore, A.; Erwin, T.; Higuchi, N.; Killeen, T.; Laurance, S.; et al. Increasing biomass in Amazonian forest plots. Philos. Trans. R. Soc. 2004, 359, 353–365. [Google Scholar] [CrossRef]
  106. Valencia, R.; Codit, R.; Muller-Landau, H.; Hernandez, C.; Navarrete, H. Dissecting biomass dynamics in a large Amazonian forest plot. J. Trop. Ecol. 2009, 25, 473–482. [Google Scholar] [CrossRef] [Green Version]
  107. Eguiguren, P. Los Efectos de Intervenciones Forestales y la Variabilidad Climática Sobre a Dinámica a Largo plaz de Bosques Tropicales en el Noreste de Costa Rica. Master’s Thesis, Centro Agronómico Tropical de Investigación y Enseñanza CATIE, Turrialba, Costa Rica, 2013; pp. 1–75. [Google Scholar]
  108. Mejia, E.; Pacheco, P.; Morocho, J.; Alarcón, S. Actors, Intermediation and Forest Control in the Amazon; Mejia, E., Pacheco, P., Eds.; CIFOR: Bogor, Indonesia, 2014. [Google Scholar]
  109. MAE; FAO. Resultados de la Evaluación Nacional Forestal; Ministerio del Ambiente del Ecuador: Quito, Ecuador, 2014; pp. 1–316.
  110. Dammer, L.; Bowyer, C.; Breitmayer, E.; Eder, A.; Nanni, S.; Allen, B.; Carus, M.; Essel, R. Mapping Study on Cascading Use of Wood Products; World Wide Fund for Nature (WWF): Grand, Switzerland, 2016; pp. 1–55. [Google Scholar]
  111. Chazdon, R.L.; Broadbent, E.N.; Rozendaal, D.M.A.; Bongers, F.; Zambrano, A.M.A.; Aide, T.M.; Balvanera, P.; Becknell, J.M.; Boukili, V.; Brancalion, P.H.S.; et al. Carbon sequestration potential of second-growth forest regeneration in the Latin American tropics. Sci. Adv. 2016, 2, e1501639. [Google Scholar] [CrossRef] [PubMed]
  112. Stanturf, J.; Kant, P.; Lillesø, J.; Mansourian, S.; Kleine, M.; Graudal, L.; Madsen, P. Forest Landscape Restoration as a Key Component of Climate Change Mitigation and Adaptation; IUFRO, Ed.; International Union of Forest Research Organizations (IUFRO): Vienna, Austria, 2015; Volume 34, p. 76. [Google Scholar]
  113. Rai, N.; Uhl, C. Forest product use, conservation and livelihoods: The case of Uppage fruit harvest in the Western Ghats, India. Conservation and Society. Conserv. Soc. 2004, 2, 289–313. [Google Scholar]
  114. Shahabuddin, G.; Rao, M. Do community-conserved areas effectively conserve biological diversity? Global insights and the Indian context. Biol. Conserv. 2010, 143, 2926–2936. [Google Scholar] [CrossRef]
  115. Gautam, A.; Shivakoti, G.; Webb, E. Forest Cover Change, Physiography, Local Economy, and Institutions in a Mountain Watershed in Nepal. Environ. Manag. 2004, 33, 48–61. [Google Scholar] [CrossRef]
  116. Vuohelainen, A.; Coad, L.; Marthews, T.; Malhi, Y.; Killeen, T. The effectiveness of contrasting protected areas in preventing deforestation in Madre de Dios, Peru. Environ. Manag. 2012, 50, 645–663. [Google Scholar] [CrossRef] [PubMed]
  117. Naughton-Treves, L.; Holland, M.; Brandon, K. The role of protected areas in conserving Biodiversity and sustaining local livelihoods. Annu. Rev. Environ. Resour. 2005, 30, 219–252. [Google Scholar] [CrossRef]
  118. INEC. Censo de Población y Vivienda; Instituto Nacional de Estadísticas y Censos: Madrid, Spain, 2010. [Google Scholar]
  119. Finegan, B.; Delgado, D.; Camacho, M.; Zamora, N. Timber Production and Plant Biodiversity Conservation in a Costa Rican Rain Forest: An Experimental Study and its Lessons for Adaptive Sustainability Assessment; European Forest Institute: Nancy, France, 2001; pp. 123–134. [Google Scholar]
  120. Magnusson, W.; Lima, O.; Quintiliano, F.; Higuchi, N.; Ferreira, J. Logging activity and tree regeneration in an Amazonian forest. For. Ecol. Manag. 1999, 113, 67–74. [Google Scholar] [CrossRef]
  121. Verburg, R.; Van-Eijk-Bos, C. Effects of selective logging on tree diversity, composition and plant functional type patterns in a Bornean rain forest. J. Veg. Sci. 2003, 14, 99–110. [Google Scholar] [CrossRef]
  122. Wright, J. Tropical forests in a changing environment. Trends Ecol. Evol. 2005, 20, 553–560. [Google Scholar] [CrossRef]
  123. Barlow, J.; Gardner, T.; Araujo, I.; Ávila-Pires, T.; Bonaldo, A.; Costa, J.; Esposito, M.; Ferreira, L.; Hawes, J.; Hernandez, M.I.M.; et al. Quantifying the biodiversity value of tropical primary, secondary, and plantation forests. Proc. Natl. Acad. Sci. USA 2007, 104, 18555–18560. [Google Scholar] [CrossRef] [PubMed] [Green Version]
  124. Gibson, L.; Lee, T.; Koh, L.; Brook, B.; Gardner, T.; Barlow, J.; Peres, C.; Bradshaw, C.; Laurance, W.; Lovejoy, T.; et al. Primary forests are irreplaceable for sustaining tropical biodiversity. Nature 2011, 478, 378–381. [Google Scholar] [CrossRef] [PubMed]
  125. Thanichanon, P.; Schmidt-Vogt, D.; Messerli, P.; Heinimann, A.; Epprecht, M. Secondary Forests and Local Livelihoods along a Gradient of Accessibility: A Case Study in Northern Laos. Soc. Nat. Resour. 2013, 26, 1283–1299. [Google Scholar] [CrossRef]
  126. Morse, W.C.; Schedlbauer, J.L.; Sesnie, S.E.; Finegan, B.; Harvey, C.A.; Hollenhorst, S.J.; Kavanagh, K.L.; Stoian, D.; Wulfhorst, J.D. Consequences of Environmental Service Payments for Forest Retention and Recruitment in a Costa Rican Biological Corridor. Ecol. Soc. 2009, 14, 1–20. [Google Scholar] [CrossRef]
  127. Cuenca, P.; Robalino, J.; Arriagada, R.; Echeverria, C. Are government incentives effective for avoided deforestation in the tropical Andean forest? PLoS ONE 2018, 13, 1–14. [Google Scholar] [CrossRef] [PubMed]
  128. MAE. Mapa de Cobertura y Uso de la Tierra del Ecuador Continental; Ministerio del Ambiente del Ecuador: Quito, Ecuador, 2016.
  129. SIGTIERRAS. Mapa Digital, Órdenes de Suelos del Ecuador. Sistema Nacional de Información y Gestión de Tierras Rurales e Infraestructura Tecnológica; MAGAP: Quito, Ecuador, 2017. [Google Scholar]
  130. MAGAP. Mapa de suelos del Ecuador Ministerio de Agricultura, Ganeria y Pesca del Ecuador; MAGAP: Quito, Ecuador, 2002. [Google Scholar]
Figure 1. Selected landscapes in Ecuadorian Amazon region.
Forests 10 00442 g001
Figure 2. (a) Randomized block design for the selection of the study areas. (b) Plot design implemented to assess information on carbon stocks, total timber volume and species richness.
Forests 10 00442 g002
Figure 3. Analysis of variance for carbon stocks, timber volume and species richness between forest types. (a) AGC: Above-ground carbon stocks. (b) DOM: Dead organic matter. (c) Total C: Total carbon stocks. (d) Total tree volume. (e) Species richness. Different letters (A, B and C) indicate a significant difference from each other (p ≤ 0.05 or p ≤ 0.10).
Forests 10 00442 g003
Figure 4. Analysis of variance of carbon stocks and richness considering the interaction between IFC, non-IFC landscapes and forest types. (a) AGC: Above-ground carbon stocks. (b) Total C: Total carbon stocks. (c) Species richness. Different letters indicate significant differences from each other (p ≤ 0.05 or p ≤ 0.10). Grey bars represent landscapes with IFC and white bars non-IFC landscapes. Within IFC landscapes only old growth forest is under Socio Bosque program and extractive use is not allowed, in the case of logged and successional forests there are no restrictions and can be used by their owners.
Forests 10 00442 g004
Figure 5. Similarity analysis based on species important index value (IVI) for different forest types in IFC landscapes and non-IFC landscapes.
Forests 10 00442 g005
Figure 6. Analysis of variance of annual net deforestation rate (%) at the parish level. (a) IFC landscapes (p = 0.04). (b) Non-IFC landscapes (p = 0.15). Different letters indicate significant differences from each other (p ≤ 0.05).
Forests 10 00442 g006
Table 1. Equations for biomass and carbon stock calculation.
EquationReference
AGB tree = exp [ 1.803 0.976 E + 0.9676 ln ( ρ ) + 2.673 ln ( DBH ) 0.0299 [ ln ( DBH ) 2 ] ] (1)Chave et al. [89]
AGB palm = exp ( 3.3488 + ( 2.7483 × ln ( DBH ) ) (2)Goodman et al. [94]
DDW biomass = V × ρ class (3)Pearson et al. [86]
Ravindranath and Ostwald [87]
SDW biomass = V × ρ (4)Pearson et al. [86]
Ravindranath and Ostwald [87]
L = dry   matter (5)Pearson et al. [86]
DOM = DDW biomass + SDW biomass + L (6)Pearson et al. [86]
Ravindranath and Ostwald [87]
SOC = BD × % CO × Deep (7)Pearson et al. [86]
Ravindranath and Ostwald [87]
V = π 4 × ( D 1 2 + D 2 2 ) 2 × l (8)FAO [97]
d h = 1.59 × D × h 0.091 (9)Chamber et al. [98]
Total   Biomass = TAGB + DOM + SOC (10)Pearson et al. [86]
Ravindranath and Ostwald [87]
AGBtree: Above-ground carbon in trees. AGBpalm: Above-ground carbon in palms. DDWbiomass: Downed dead wood. SDWbiomass: Standing dead wood. L: Litter. DOM: Dead organic matter. SOC: Soil organic carbon. TAGB: Total above ground biomass. V: Volume. WD: Wood density. D1: Diameter minimum. D2: Diameter maximum. l: Length. BD: Bulk density. %CO: Carbon organic content. DBH: Diameter at breast height. ρ: Wood density. E: environmental stress. h: height. Carbon conversion factor: 0.47 [88].
Table 2. Analysis of variance for carbon stocks, timber volume and species richness.
Dependent VariableIFC vs. non-IFCForest TypeInteraction: Forest Types Influenced by IFC and Non-IFCR2n
p-Valuep-Valuep-Value
AGC (Mg C·ha−1)0.4624<0.0001 ***0.0696 *0.6170
DOM (Mg C·ha−1)0.60440.0974 *0.16190.1267
SOC (Mg C·ha−1)0.37380.27550.17530.5372
Total carbon (Mg C·ha−1)0.6208<0.0001 ***0.0459 **0.6672
Timber volume (m3 ha−1)0.4330<0.0001 ***0.34980.5768
Richness (#sp./plot)0.8933<0.0001 ***0.0570 *0.6572
IFC: incentive-based conservation program AGC: Above ground carbon. DOM: Dead organic matter. SOC: Soil organic carbon. * p-value ≤ 0.10. ** p-value ≤ 0.05. *** p-value ≤ 0.0001.

