Article

A Decision Support Tool for Assessing the Impact of Climate Change on Multiple Ecosystem Services

by
Irina Cristal
1,*,
Aitor Ameztegui
2,3,
Jose Ramon González-Olabarria
1 and
Jordi Garcia-Gonzalo
1
1
Forest Sciences and Technology Centre of Catalonia (CTFC), Ctra. Sant Llorenç de Morunys, Km 2, 25280 Solsona, Spain
2
Department of Agriculture and Forest Engineering (EAGROF), University of Lleida, 25198 Lleida, Spain
3
Joint Research Unit CTFC—AGROTECNIO, 25280 Solsona, Spain
*
Author to whom correspondence should be addressed.
Forests 2019, 10(5), 440; https://doi.org/10.3390/f10050440
Submission received: 4 April 2019 / Revised: 7 May 2019 / Accepted: 17 May 2019 / Published: 21 May 2019

Abstract

:
In the climate change era, forest managers are challenged to use innovative tools to encourage a sustained provision of goods and services. Many decision support tools (DSTs), developed to address global changes in forest management practices, reflect the complexity of the scientific knowledge produced, a fact that could make it difficult for practitioners to understand and adopt them. Acknowledging the importance of knowledge transfer to forestry practitioners, this study describes a user-centric decision support software tool, aiming to assess forest management and climate change impacts on multiple ecosystem services (ESs) at a stand level. SORTIE-ND, a spatially explicit tree-level simulator for projecting stand dynamics that is sensitive to climate change, is encapsulated into the decision support tool and used as the simulation engine for stand development. Linking functions are implemented to evaluate ecosystem services and potential risks, and decision support is provided in form of interactive 2D and 3D visualizations. Five main components were identified to delineate the workflow and to shape the decision support tool: the information base, the alternative generator, the forest simulator, the ecosystem services calculator, and the visualization component. In order to improve the interaction design and general user satisfaction, the usability of the system was tested at an early stage of the development. While we have specifically focused on a management-oriented approach through user-centric interface design, the utilization of the product is likely to be of importance in facilitating education in the field of forest management.

1. Introduction

Climate change affects the structure and the multiple functions of forests, challenging forest managers to use innovative tools to evaluate and develop new viable alternatives for a sustained provision of goods and services. Particularly, the role of forest management today is to sustain the health and resilience of forest ecosystems in a way that the multitude of goods and services provided enhance the well-being of people [1,2,3,4,5]. This role has been supported by numerous studies, which have generated knowledge around multiple forest ecosystem services (ESs) and their interrelations [6], as well as how they evolve under climate change and interact with other natural and human-induced disturbances [7,8]. In the realm of knowledge transfer, an effective way to deliver scientific information to forest practitioners is by providing user specific computer-based tools [9]. Nevertheless, transfer to practice is one of the shortcomings identified in forest management tools developed by researchers [10].
Most common software applications for projecting the evolution of forests are forest simulators—an implementation of mathematical models in computer programs that are able to predict the consequences of different courses of action in forestry [11]. Thus, the triptych of assessing changing factors in forest stands is the combination of past knowledge, present observation and future projection. A number of different modeling approaches, along with computer tools, have been developed over the years, addressing at least one of these aspects. Early empirical models of growth and yield are still powerful instruments for forest managers [12]. This approach uses data obtained from forest inventories to model statistical relationships between stands and tree attributes [13]. Empirical models have low modelling complexity and high accuracy, which makes them adequate to address traditional forest management objectives [14]. However, they are poor in explaining the underlying mechanisms [13] and in predicting the harvesting effect on ecosystem structure and functions. Moreover, they lack the ability to make long term prediction under climate change scenarios, or extrapolate the growth of the trees for conditions different to those observed in the past, as their equations are fitted to historical data [14,15].
On the other hand, the process-based models focus on the eco-physiological processes and their responses to external dynamics. These models are more flexible, and can explain the cause–effect, but are less able to predict forest yield [16]. Process-based models are suitable for considering climate change and ecological objectives in forest planning [16], as they embed ecological processes influenced by climate.
Another type of models are succession, or gap models (e.g., [17,18]), which explicitly assess the impacts of temperature, water, and nutrients on the growth and development of trees, with the main goal to study and project the structural and compositional dynamics of forest ecosystems influenced by the environment. Therefore, these models (e.g., JABOWA, FORET [17,19]) are able to assess the impacts of global change on long-term dynamics of forest structure, biomass, and forest composition [17,18,19]. The hybrid models integrate elements of the previous modelling paradigms (i.e., environmental conditions and reliable growth estimations), and are used to predict forest dynamics (mortality, growth, regeneration, etc.) at different spatial scales [20]. Specifically, the underlying idea of hybrid models is to benefit from the predictive ability of the calibrated data of empirical approaches, as well as from the explicit environmental dependence of process-based formulations, in order to offer reliable support in forest management and planning [21]. The gap models and the hybrid models can be used in both short term timber-related management, and for long term plans, in the light of climate change [12,18,19,20,22,23]. Yet, although forest simulators are considered to be the fundamental tools to be applied in forest management planning, they are rarely used by forest practitioners.
Current approaches to forest management supporting tools integrate forest data, growth models and decision algorithms into a decision support system (DSS) [24,25]. Many authors have been contributing to different aspects of state of the art forest management DSSs by exploring new software architectures, objectives, or spatial scales [24]. From the architectural point of view, the modular design is the predominant approach. Scale-wise, DSSs are divided into stand level, forest or landscape level systems, and systems for regional or national assessment [26]. In regard to forest management objectives, traditional, timber-related management has been gradually replaced by more holistic approaches since the late 1980s due to the rise of new ideas such as forest ecosystem management, sustainable forest management, and adaptive forest management [27]. More recently, the Millennium Ecosystem Assessment (MA) [2] has brought to attention the concept of ecosystem services. First conceived in the 1990s [28], this notion aimed to highlight the interrelation of ecosystems and human well-being. Nowadays, it is the main framework for sustainable ecosystem management and policy-making [29,30].
Under this framework, forest communities are viewed as complex systems of interconnected ecosystem services (ESs) influenced by external factors such as natural disasters, human-induced disturbances, and climate change. Forest decision support tools (DSTs) need to embrace this approach by applying scientific knowledge in projecting changing factors and estimating their impacts on ESs. Respectively, we identified three major aspects to be considered in modern DS tools: climate change, ability to estimate multiple ESs, and risk integration.
In terms of climate change consideration, a plethora of process-based and hybrid models have been developed over the years. Several authors (e.g., [21,31,32]) have reviewed the current state of these models, reporting the main strengths and weaknesses of each one. In their overview of the models used in Europe, Fontes et al. (2011) [21] indicated that in most of the cases these models are even-aged and single-species, and able to evaluate biomass and carbon storage as well as drought as a natural disturbance. Sparingly, fire risk, storms, and soil erosion are taken into consideration. A recent review by Morán-Ordoñez et al. [33] showed that most studies only evaluate a single ecosystem service, and calls for more integrative approaches that allow a more complete view of the ecosystems. In this regard, process-based models are more versatile and can be easily adapted for multiple ES assessment [21,33].
A number of studies propose combining forest growth and ES models to assess the provision of multiple services. For example, Wikstrom et al. (2011) [26] presented a DSS able to estimate recreation values, carbon sequestration, and habitat suitability by coupling growth models and ES models; Garcia-Gonzalo et al. [34] extended the SADfLOR DSS [24] to include trade-off analysis between timber production, cork, and carbon. In the matter of risk integration in forest management, first attempts were made in the early 1980s in North America. As a case in point, Martell [35] and Reed [36] analyzed the effects of fire risk on the optimal forest stand rotation. More recent approaches at both stand and landscape levels have examined the reciprocal interaction of natural risk impact and management regimes (e.g., [37,38]). From the perspective of integrated systems, Hanewinkel et al. [39] discussed the possibility of incorporating mechanistic and empirical storm risk models, as well as an empirical fire risk model into growth simulators, for assessing the impact of disturbances on forests. Later, Reyers et al. [8] discussed six case studies in Europe where climate-sensitive growth and yield models were combined with risk assessment models in order to evaluate the joint impact of climate change and disturbances on forest production. Most of the integrated models presented in their study are able to assess ESs other than production, such as biodiversity and recreation.
The shortcoming of a great extent of the existing decision support tools is a lack of management-oriented approaches, or of development in close relation with managers [10]. There is also a deficiency of integrated software solutions to address multiple ESs, including different sources of risk and uncertainty (e.g., forest fires) in the light of climate change. The majority of tools address ecosystem services at a limited level, and are mainly focused on services related to biomass production (e.g., timber and carbon sequestration) [33]. Although research-oriented software, including forest simulators (see [26,40]), may provide a comprehensive impact on ESs in a climate change context, they are applicable for use within the scientific community. As a result, forest managers will, most likely, use only a few DS tools that they feel comfortable with [41]. Thus, new approaches, adapted for management purposes and developed in close cooperation with forest managers, are needed to fill the gap between research and forestry practice.
The challenge herein is to design a simple to use yet powerful forest DS tool that is able to assess the provision of ecosystem services in the context of global changes and incorporate risk assessment. In the present study we address this challenge by presenting a decision support tool (DST) for forest management planning that considers climate change and other sources of uncertainty, such as forest fires and storms, and delivers information on the provision of multiple goods and services. The development of the software followed a user-centered design, with forest managers being identified as the target audience. We outline the methodology in terms of the architecture of the embedded elements of the system, and we present the results through an example of stand simulation.

2. Decision Support Tool Description

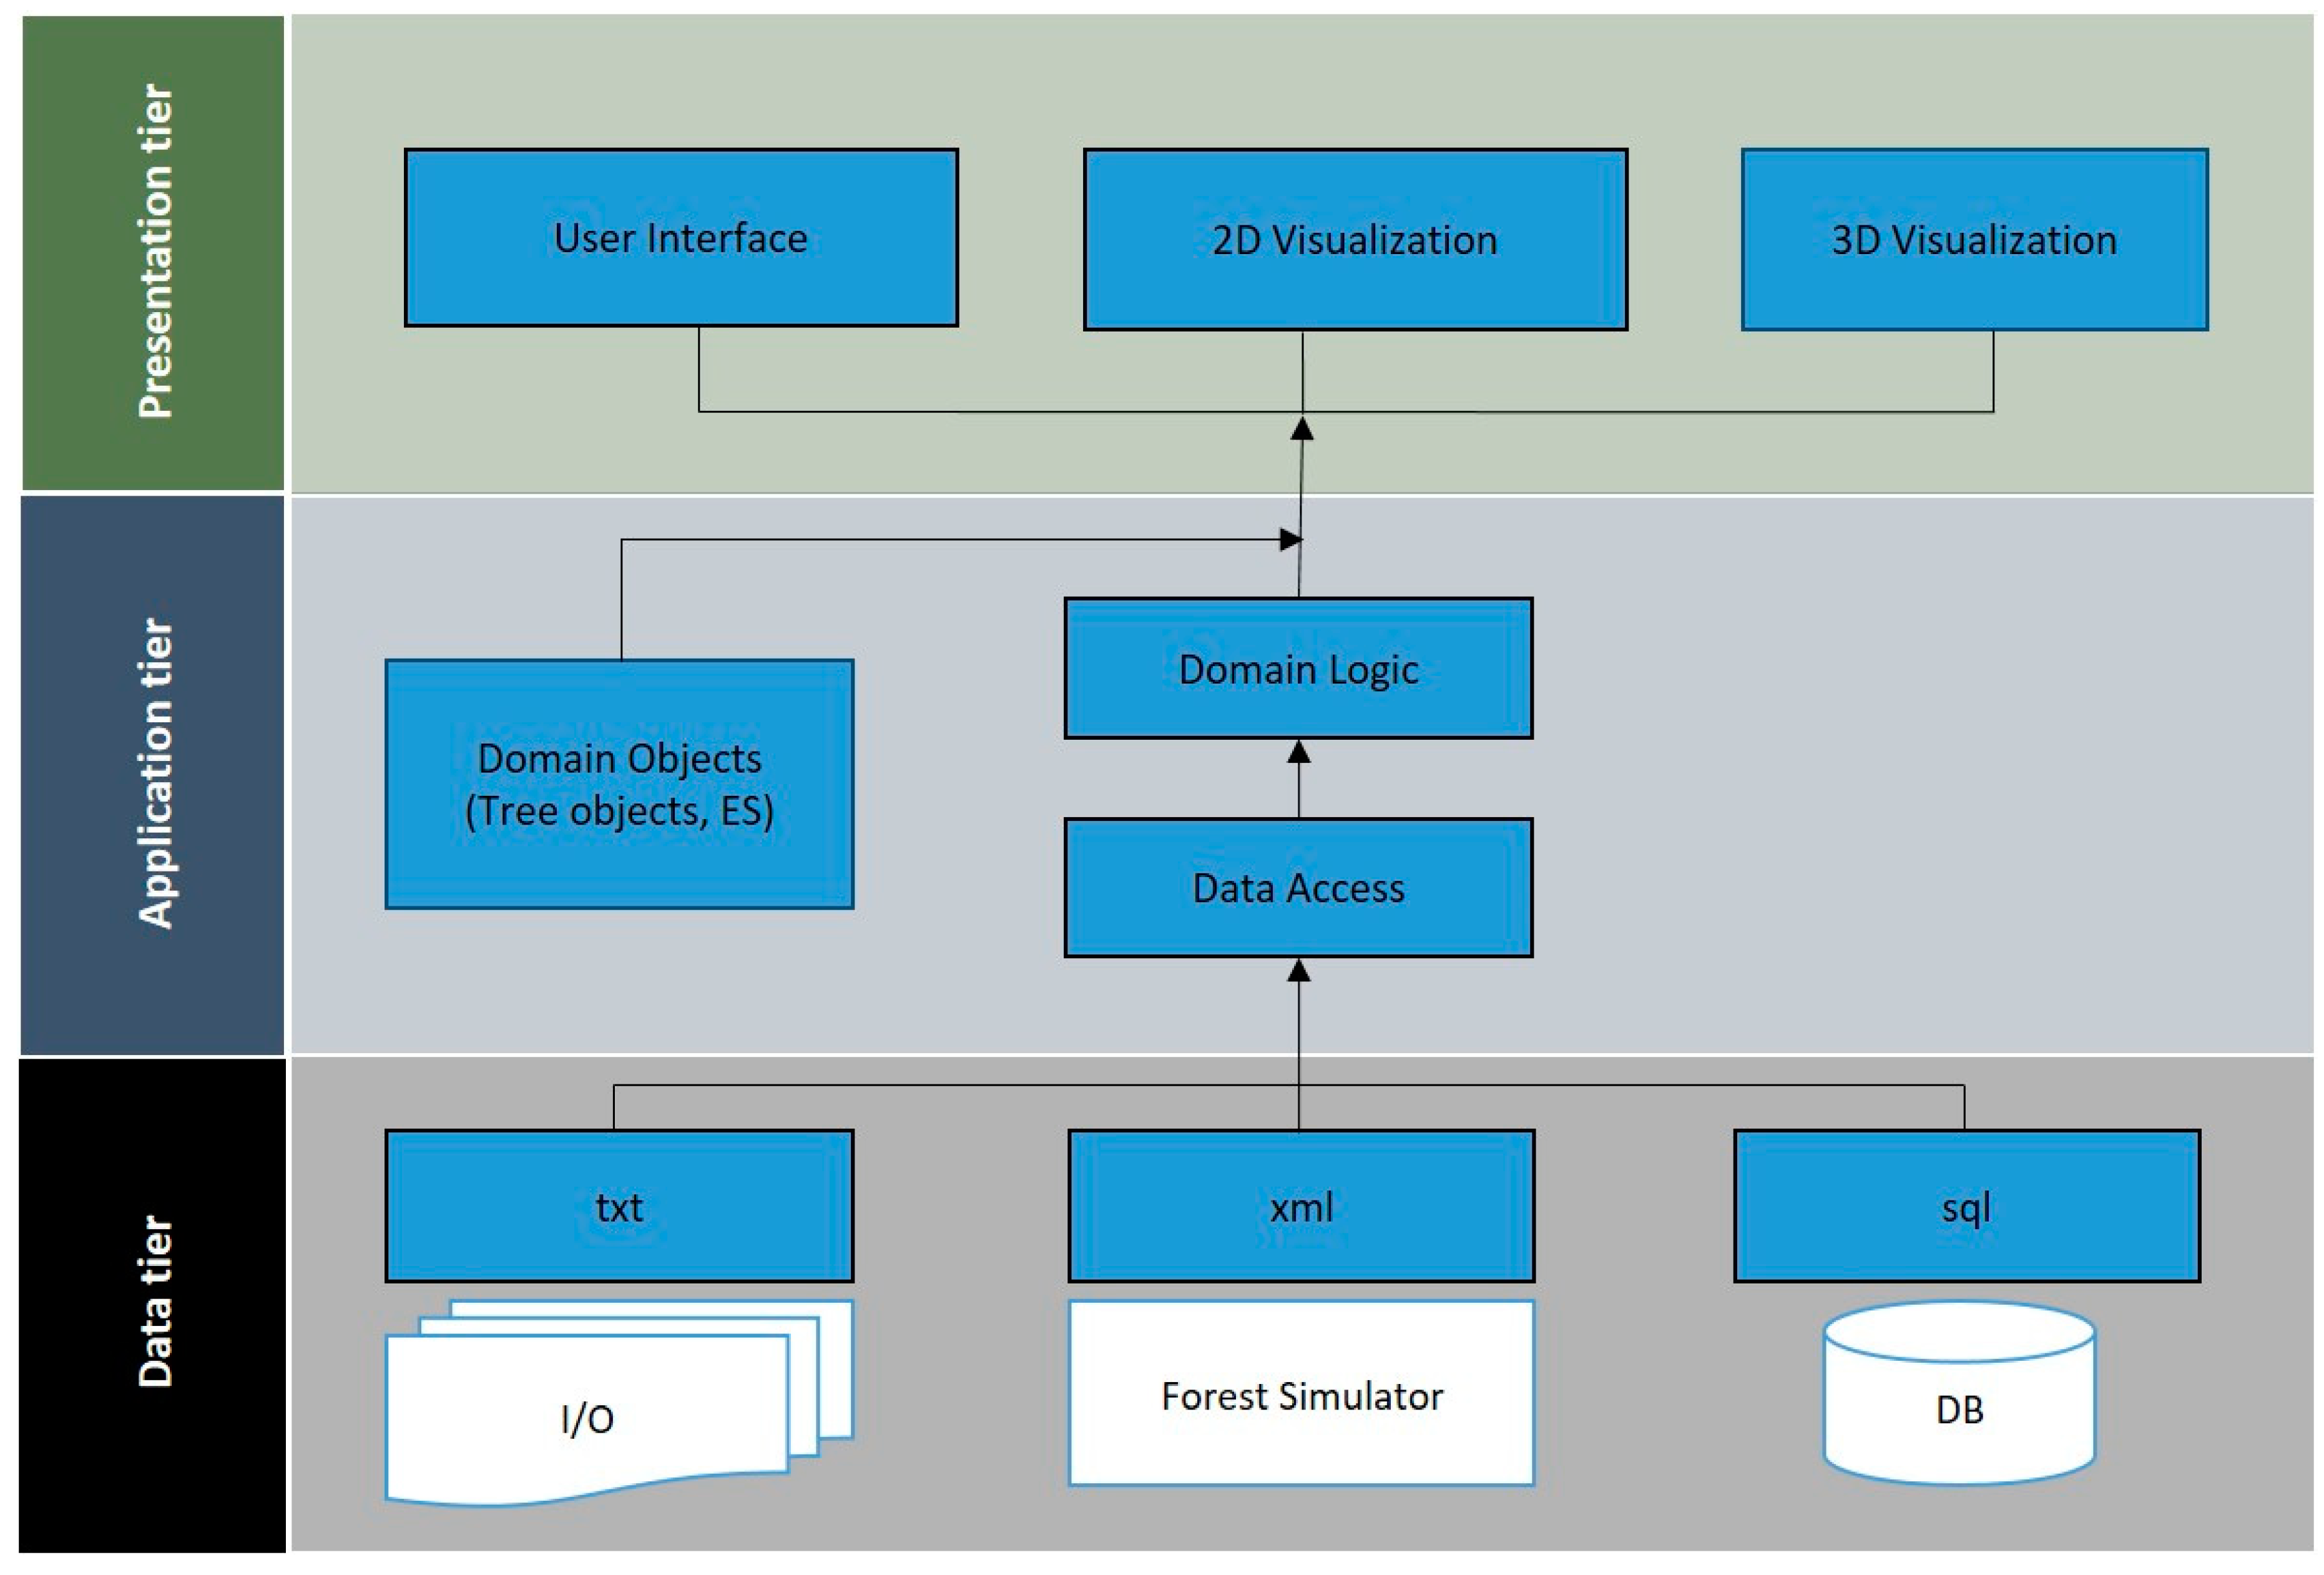
2.1. Conceptual Design and System Architecture

The overall scope of the decision support tool (DST) developed in this study is to deliver scientific knowledge to forest practitioners in a user-friendly way. In terms of functionality, or operational analysis, the system should be able to assess the provision of ecosystem services under various climatic scenarios and forest management options, and be capable of evaluating risks in the form of indicators of potential post-fire mortality and windthrow mortality. Five self-contained components and functionalities cooperate for this purpose (Figure 1):
  • Information management component, used mainly for handling input data for the simulations (i.e., forest inventory data, climatic data (historical and future), and management prescription data);
  • Prescription generator component, used to automatically create multiple alternatives based on user-defined management options;
  • External stand simulator, able to project the future states of forest stands for each management prescription and climatic scenario;
  • Ecosystem services component, used to assess future ecosystem services based on the evolution of the stands;
  • Visualization component, able to display input and output data in form of maps, tables, figures, and 3D scenes.
Following the conceptual design, we adopted a modular approach to ensure extensibility (e.g., the ability to include new growth and yield models), reusability (the ability to use the same components in different projects), maintainability (easiness of updating a specific component independently of the rest of the application), and adaptability of the software in the future. The conceptual components, translated into the system modules, were embedded into a three-tier architecture (Figure 2): a data tier, responsible for data sources and storage; a presentation tier, responsible for the graphical user interface (GUI) and data visualization; and an application tier, responsible for the domain logic and the communication between the two previous layers.
More explicitly, the data tier handles the inputs and outputs of the system, such as forest inventories, climate change data, management alternatives, and also the simulated results and their metadata. The application tier is responsible for the processes involved in the exchange of the data between inputs and outputs of the external simulator and information base, but also for quantifying the ecosystem services, based on the outputs of the simulation and the selected empirical models. The presentation tier includes the graphical user interface (GUI) of the system and the 2D and 3D data visualizations. The GUI delivers user inputs related to initial stand data, climate change scenarios, and management options to the data tier; in return, it receives simulated outputs used for visualizations.
The software application was written in Python version 3.6 [42], using the Tkinter python standard GUI library [43] for the user interface (UI), and the lxml library [44] to interact with the forest simulator [45]. The 3D scenes of the stands are created dynamically for each simulated year by modelling the characteristics of individual trees (coordinates, height, dimeter, etc.) into 3D objects using X3DOM technology [46].

2.2. Stand Dynamics Simulation Component

The DST encapsulates SORTIE-ND version 7.4 [45,47], a spatially explicit, individual-based model of forest dynamics that was initially created as a mechanistic model to simulate gap dynamics in transitional oak-northern hardwood forests in the northeastern US [48]. Further developed throughout the years, SORTIE-ND nowadays focuses on local neighborhood dynamics, and simulates forest dynamics through the modelling of competitive interactions for resources between individuals. SORTIE-ND simulates the recruitment, growth, and mortality of every individual tree within a plot/stand using a combination of species-specific empirical and mechanistic processes. Population-level forest dynamics occur as a combined result of life histories of every single individual in a plot/stand and its interaction with other individuals and the environment. This gives the possibility of simulating the dynamics of mixed stands with complex, uneven-aged diameter distributions [49,50], a fact that places SORTIE-ND between the few models capable of dealing with this type of forest stand. In addition, it allows the simulation of various types of disturbances, both anthropic (various types of harvesting operations) and natural (windthrows, insect outbreaks, pathogens, wildfires). All the above make it a particularly suitable option for evaluating the dynamics of mixed forests with complex structures under different climatic and management scenarios [51].
The DST communicates with SORTIE-ND through a parameter file, which describes the present conditions of the stand and the processes (behaviors) that act to change these conditions. Some of these behaviors (e.g., light transmission through the canopy) are mechanistic, whereas others (growth, mortality) have to be parameterized from relationships obtained empirically. Since its creation in the 1990s, SORTIE has been parameterized in 11 study sites that cover a range of biomes from boreal to tropical forests, for a total of 59 tree species [52]. Consequently, the software tool presented here may be used in any of these biomes. For illustrative purposes, we used the parameters obtained for the transition forests between montane and subalpine elevation belts in the Pyrenees [49], which include three species: Abies alba Mill., Pinus sylvestris L. and Pinus uncinata Ram. ex DC.

2.3. Ecosystem Services Component

The term ecosystem services has been used as an umbrella term for various goods, services, and functions [53]. We followed the classification of ecosystem services defined by the Common International Classification of Ecosystem Services CICES [3], which categorizes them into three main groups:
  • provisioning (e.g., food, water, fiber, and fuel);
  • regulating (e.g., climate, water, and disease regulation (pest outbreaks and pathogens));
  • cultural (e.g., aesthetics, recreation, spiritual, and educational).
Models from literature were selected in order to quantify the following ecosystem services and potential disturbances that can serve as indicators for regulation and maintenance services: (1) biomass production, (2) timber production, (3) carbon sequestration, (4) mushroom production, (5) scenic beauty, (6) potential fire damage (as indicator for forest fire prevention), (7) potential snow and wind damage (as indicator for risk reduction), (8) potential erosion (as indicator for erosion protection) (Table 1).
Ecosystem services functions are domain objects in the application tier. Most of the functions implemented until now in the system have been based on regional empirical models, except for potential fire damage, scenic beauty, and potential snow and wind damage. The ES calculator module is activated immediately after the simulation is done, with no intervention from the user. If the use of the system is to be done for a geographical region other than the one the regional empirical models are fitted for, the system will run the basic simulation, omitting the calculation of these particular ecosystem services.

2.4. Visualization and Graphical User Interfaces

Displaying information in a visualized format can facilitate human perception and enhance critical ability. When complementing with additional context and supplemental information, visualizations can be an invaluable tool in decision-making. The user interface, on the other hand, can influence how efficient users interact with the software, and can define its applicability. We aimed to design an intuitive, management-oriented graphical user interface (GUI) by combining the five consecutive modules derived from the conceptual design (Figure 1). The user interaction design was based on the usability principles of efficiency, effectiveness, and satisfaction of using a product by a group of users, as defined in ISO 9241-11:2018. Forest managers were identified as the main target audience, and the user needs assessment was conducted in collaboration with forestry experts as well as forest owners associations. Complying with the users requirements, we ensured a minimalistic visual design by reducing the information overload related to the simulation flow. The resulting UI comprises five modules: stand definition, climate scenario definition, alternative generation, simulation of the alternatives (including ES simulation), and visualization of the outputs (Figure 3).

2.4.1. Stand Definition UI

Stand definition UI facilitates users to input initial data for the simulation, such as site and tree descriptions. The minimum requirements for the site characteristics are covered by providing the latitude and elevation of the stand, along with its average annual temperature and total annual precipitation. Trees are defined by their species and their diameter at breast height (DBH) class distribution (Figure 4). The data can be entered manually if the analysis is to be done for one stand only, or it can be uploaded in a specified tab delimited format for when managing multiple stands.

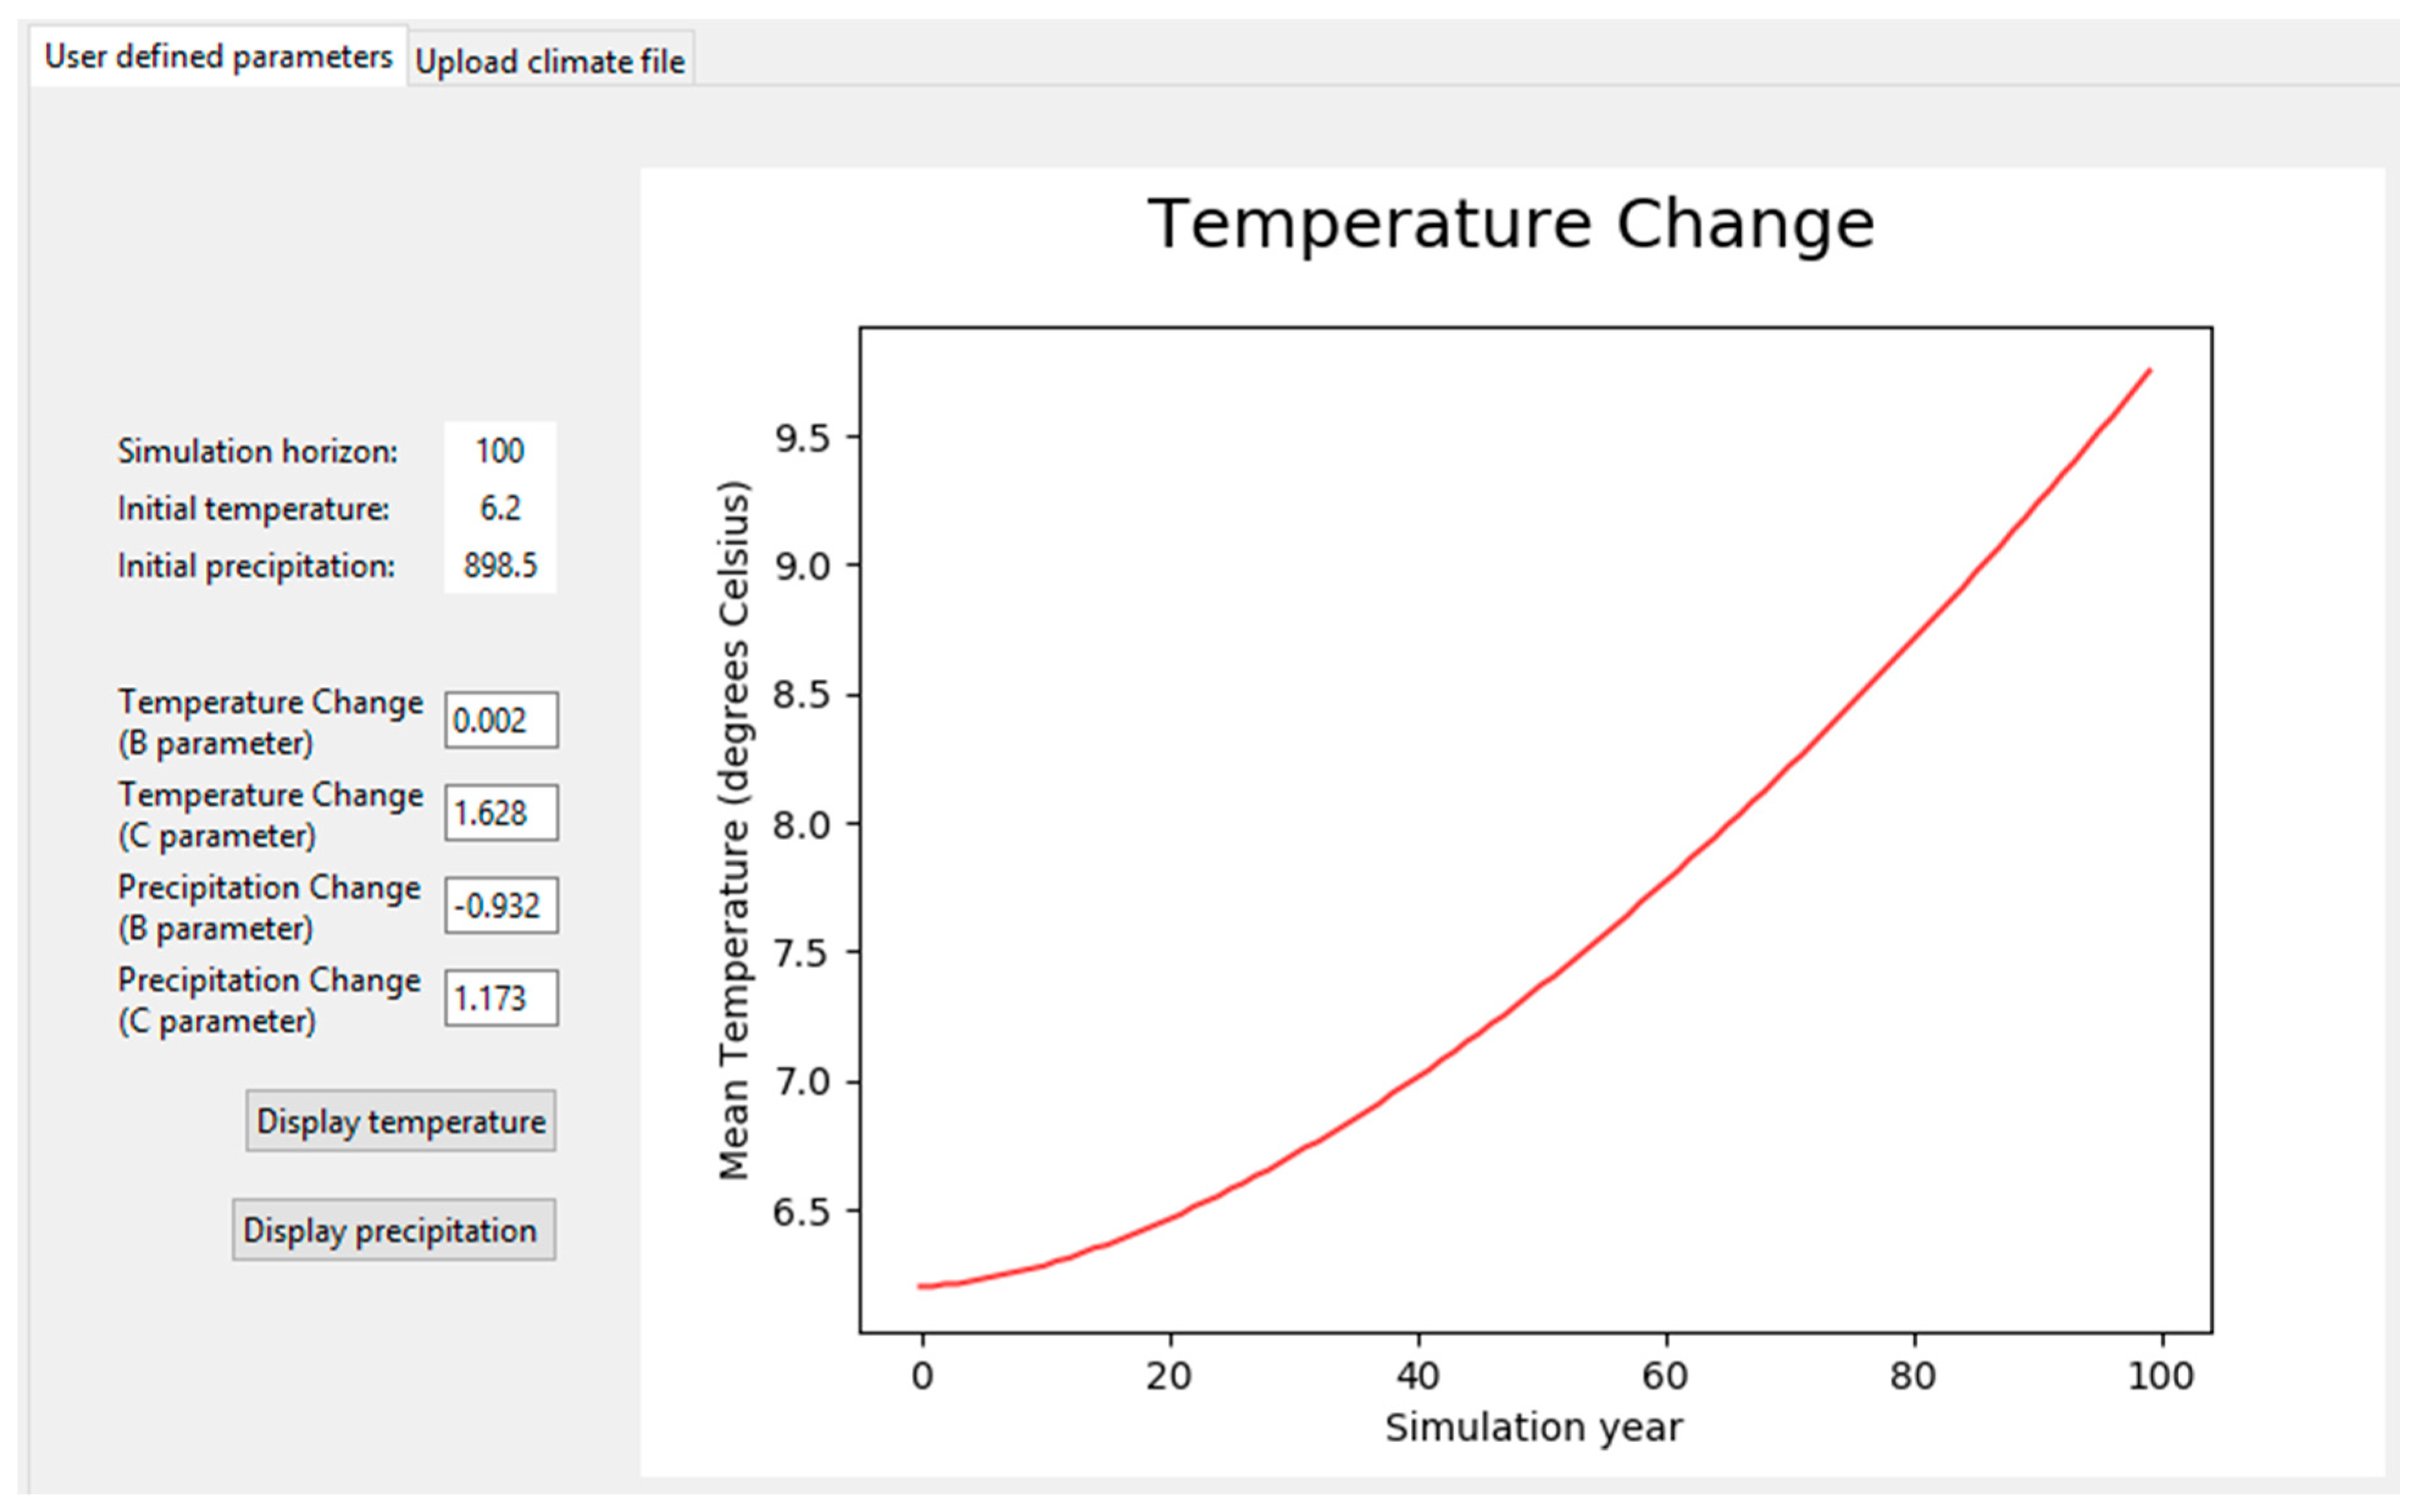
2.4.2. Climate Change UI

The UI allows defining climate change in two ways—by importing the time series of monthly climatic data for the simulation horizon, or by providing the exponential factor of the current mean annual temperature and the total annual precipitation. In the first case, monthly average temperature and total monthly precipitation for each year of the simulation have to be provided in two separate files, one for temperature and one for precipitation. Each row must be a year, and each column a month. This approach takes into account both inter- and intra-annual variability in climate, and is the recommended option for taking maximum advantage of the DST functionalities (e.g., mushroom production depends on September, October, and November precipitation) [55].
If, however, the time series of meteorological variables are not available, we ensured flexibility of the system and the ability to run simulations with less user inputs, depending on the availability of the information and the desired results. The user can thus choose the second climate change approach and provide the rate of change by manually entering the precipitation and temperature change parameters (B and C, in Equations (1) and (2) [45]) in the corresponding interface (Figure 5). This will change the values of the annual precipitation parameter and the mean annual precipitation of the plots, and will be used to simulate the effects of climate change. Parameters values can be set to zero if climate change impact is not desired in the simulation. This second option, however, can show only a trend of temperature and precipitation change, and does not account for either inter-annual, nor seasonal variability.
T = T 1 + B t c
where:
  • T is the annual temperature, in degrees C, at time t
  • T1 is the mean annual temperature value, as assigned in the initial parameters
  • B is the temperature change parameter
  • C is the temperature change parameter
  • t is the time elapsed, in years, since the start of the run
P = P 1 + B t c
where:
  • P is the annual precipitation, in mm, at time t
  • P1 is the annual precipitation value at the start of the run, as assigned in the plot parameters
  • B is the annual precipitation change parameter
  • C is and the mean annual precipitation change parameter
  • t is the time elapsed, in years, since the start of the run

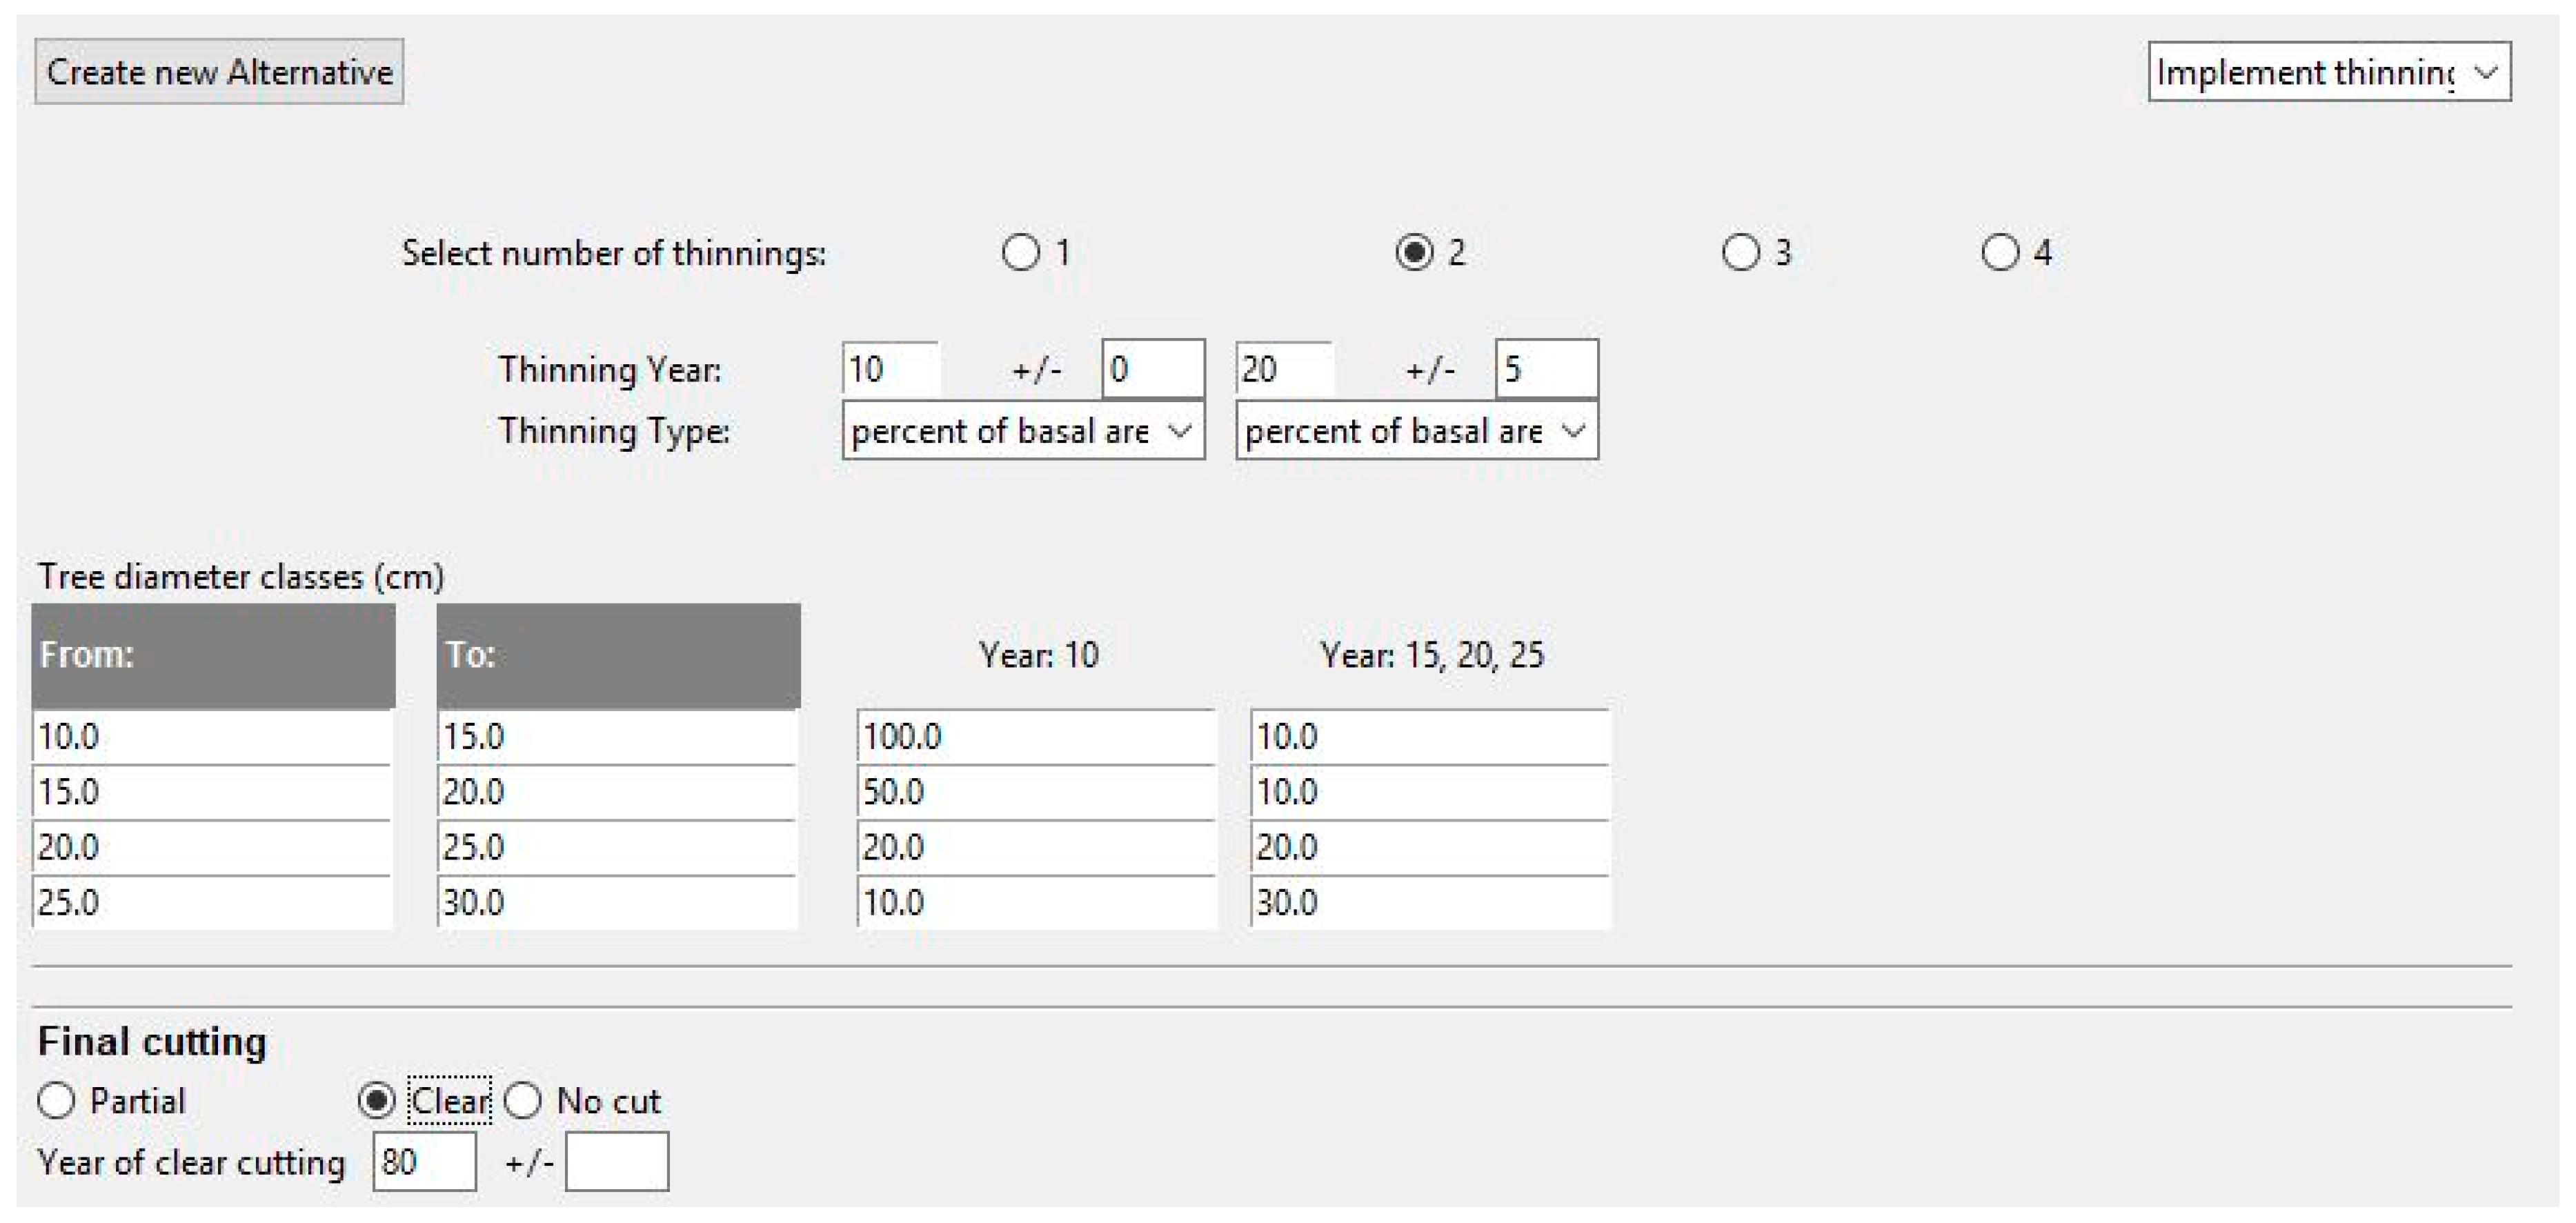
2.4.3. Management UI

Forest management alternatives are inherited from SORTIE-ND and are defined in terms of (i) periodicity and intensity of thinnings, and (ii) final cuttings. The maximum number of thinnings is set to four, and the optional final cutting can be implemented either by clearcutting or partial cutting. By default, artificial planting is set to five years after the preparatory cutting, when shelterwood methods are simulated, or otherwise immediately after clearcutting. In addition, thinning intensity is defined either as a percentage of the basal area, or as a percentage of density, for four user-defined diameter classes. Multiple alternatives can be generated by setting a variation of thinning and clearcutting periods. This will produce n[(N × T × 3)(F × 3)(P × 3)] alternatives, where, n is the number of stands/plots; N is the number of thinnings selected; 0 < N <= 4; F is the final cutting; and P is the preparatory cutting. An example of management UI can be seen in Figure 6.

2.4.4. Simulation

The initial stand conditions—the climate scenario and management alternative(s), defined through the interface—are translated into inputs for the SORTIE-ND simulator, the so-called “parameter files”. Each parameter file corresponds to one alternative. In one session, the user can create multiple alternatives for one particular stand or a set of stands. The simulation is then executed via the DST graphical interface by generating and sending a script file (batch file in the case of Windows Operating System) containing all the alternatives created in one session to the SORTIE-ND engine.

2.4.5. 2D Visualization UI

The visualization UI was designed to facilitate the interpretation of the simulated outputs. These outputs are represented in the forms of graphs, tables, and maps. The interface includes two tabs: the overview tab and the detailed view tab (see Figure 7 and Figure 8). The overview tab shows the general information of the simulation: graphs are used to visualize stand characteristics such as number of trees and basal area for the simulation period, and tables are used to visualize yield information. The detailed view interface shows the state of the stand at each simulation step, and comprises a 2D interactive map of the trees and a stand information viewer. In the interactive map, the trees are positioned according to their X, Y coordinates, and mapped using a bivariate mapping technique (i.e., the DBH class attribute is used for scaling the size of the symbol, and the species identity attribute for color differentiation). More detailed information on each individual tree can be retrieved by clicking on their symbols. Basic interactions, such as zoom and pan, are also allowed. The map legend allows trees to be shown/hidden according to the species identity and/or their type (seedling, sapling, or adult). Additional information can be seen in the information viewer, where DBH class distribution is represented in the form of graphs, and tables are used to show stand composition as well as ecosystem services values. Navigation through simulation years is allowed by typing the year of simulation in the corresponding field, or using the slider bar. In addition to the 2D representation, the users can create on-demand 3D scenes of the stands for every simulated year.

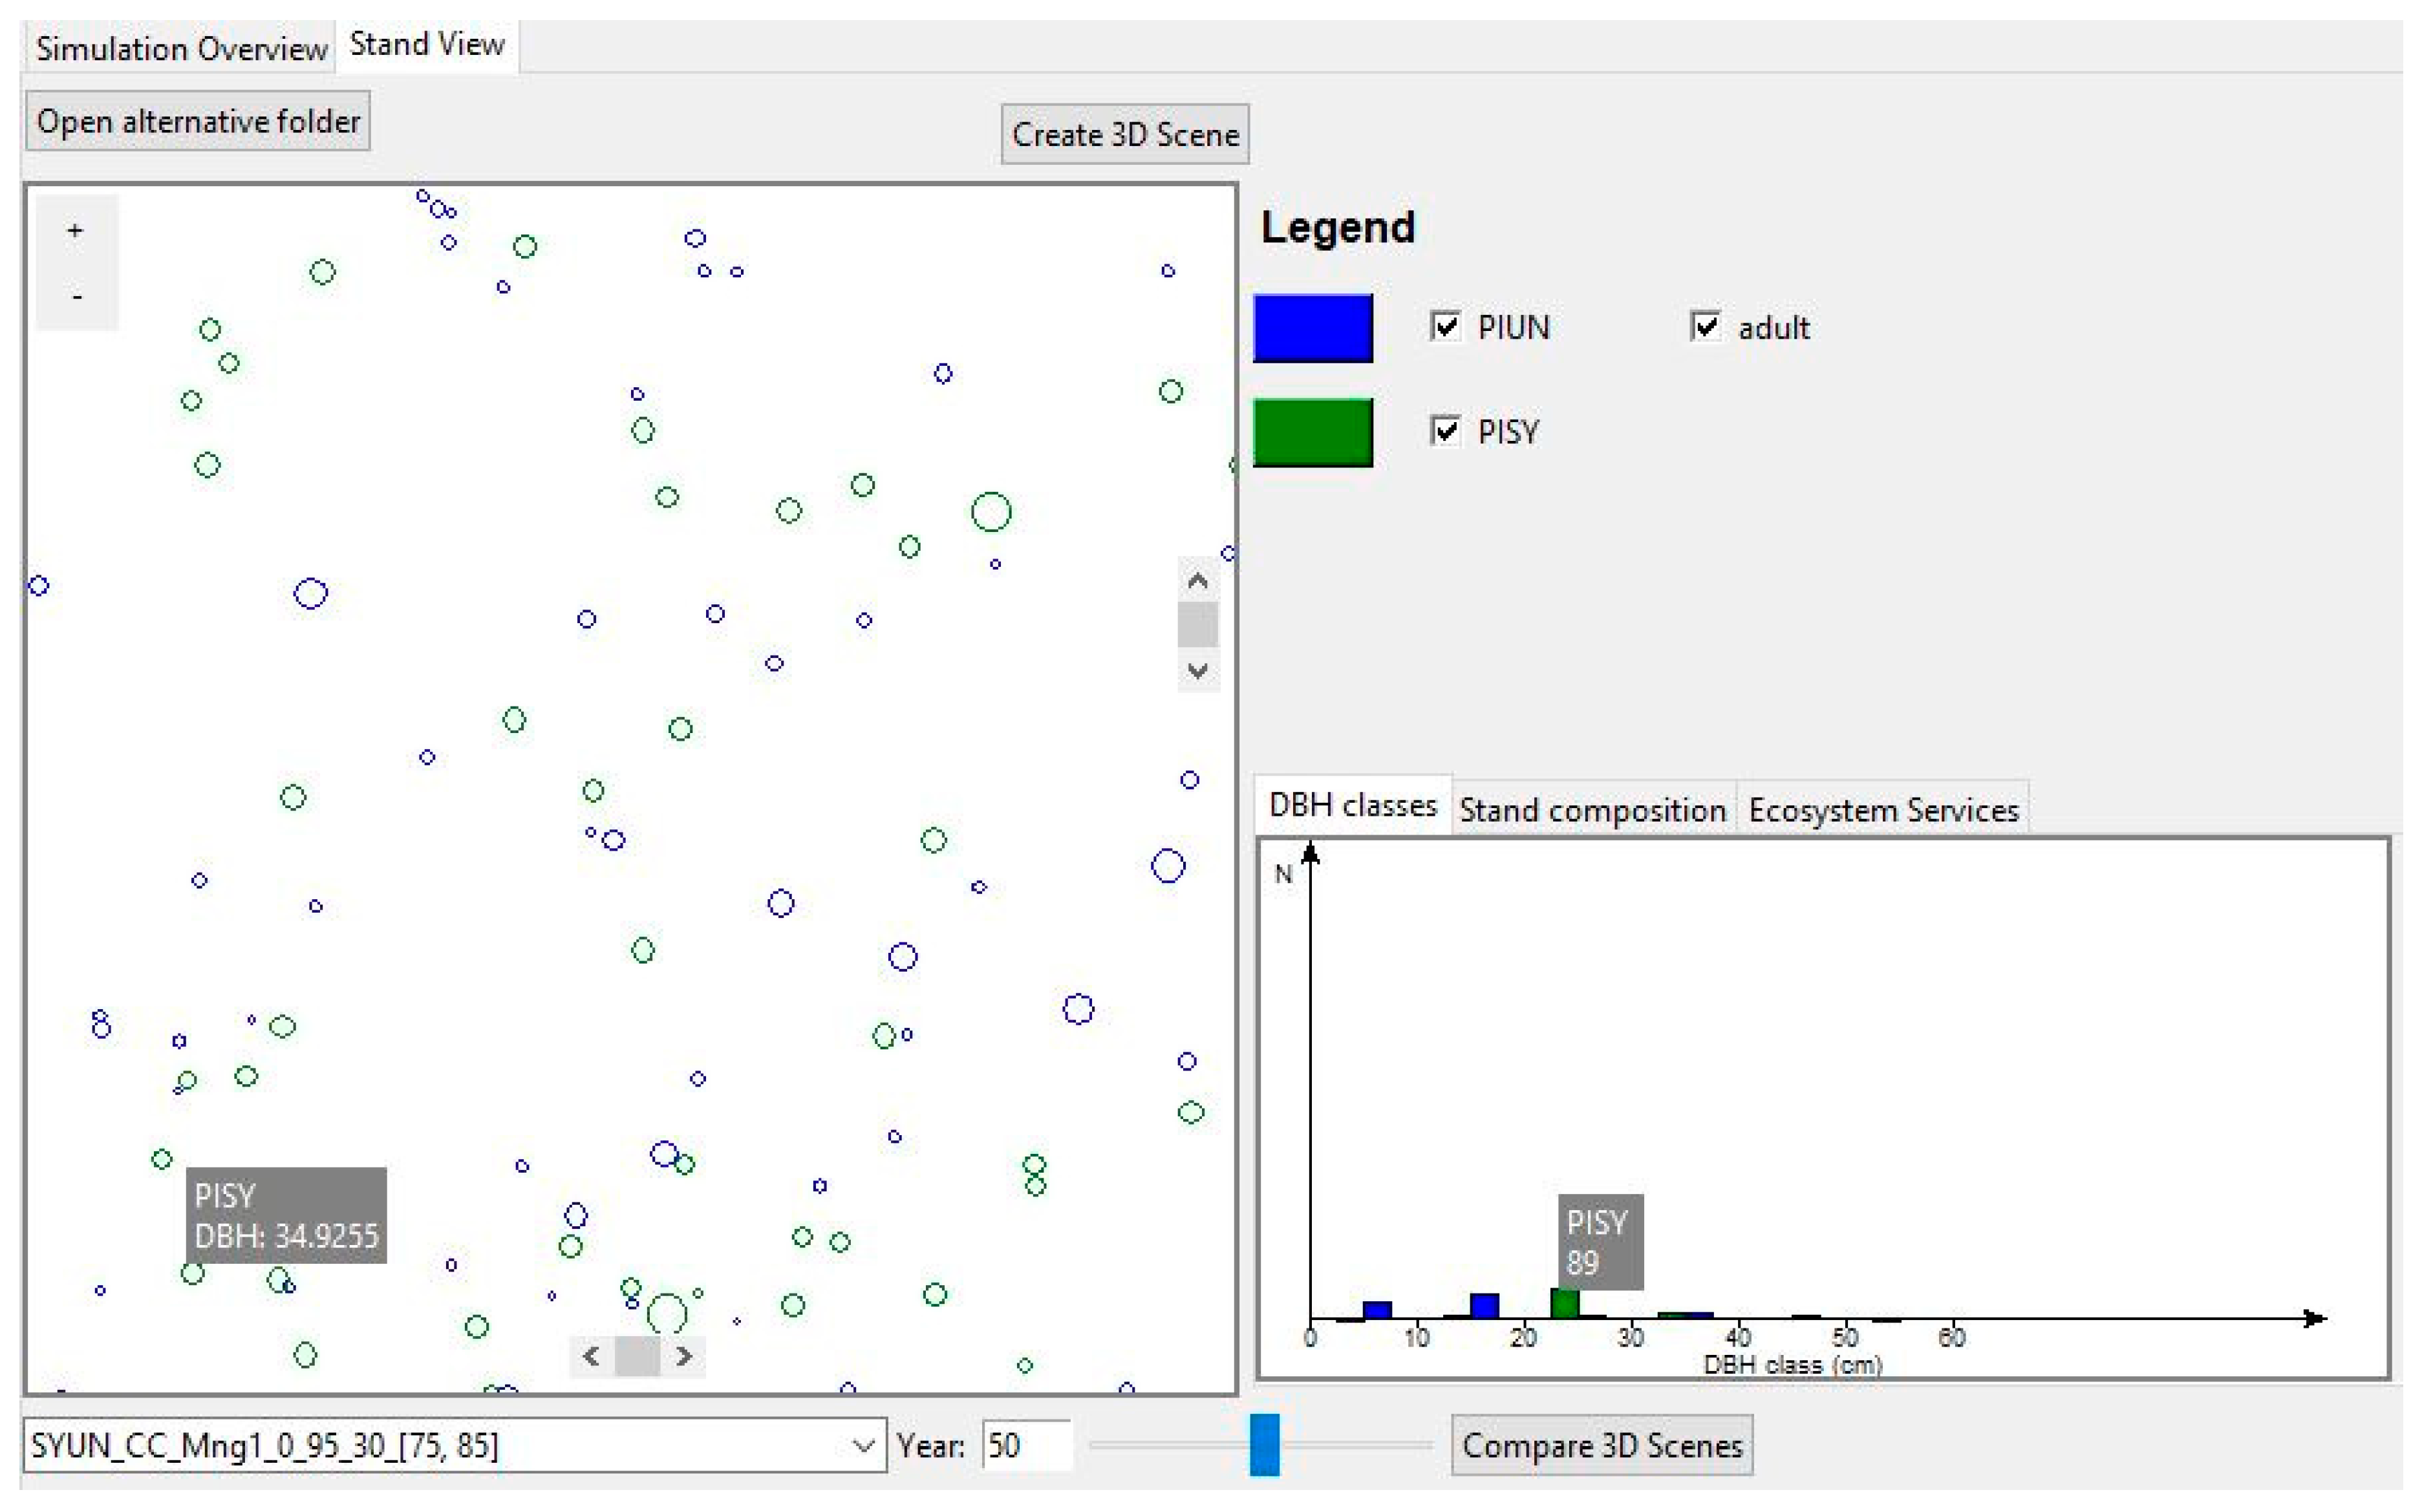
2.4.6. 3D Visualization Component

An image-based model reconstruction approach is used to build the three-dimensional stand scenes. A Q3D (quasi three-dimensional) method was chosen over the detailed 3D reconstruction of each tree model, mainly for reducing the rendering time. Using an extensible three-dimensional graphics framework (X3D) [61], Q3D was achieved via the X3D “billboard” node. Billboard is a grouping node that allows all the children elements to rotate in a specified axis towards the current viewpoint. In our case, the children nodes are the pictures of the trees. Multiple pictures can be added to create one Q3D model, where each picture will correspond to the relative position and orientation of the model and observer. Due to the fact that each scene is created in real time, we decided to reduce the computational time and add only one picture per node. The created collection of images contains representative pictures for each tree species and DBH class. The images were taken in the field and processed by removing the background and correcting the geometry and color. The characteristics of each tree simulated in SORTIE-ND were used to identify, position, and scale the corresponding images. The terrain, for demonstration purposes, is generated from random points. The 3D content, in the form of X3D files, can be imported into any 3D viewer. We used X3DOM [46], an open-source framework, in order to display the scenes in a standard web browser without the need of plugins (see Figure 9 in Section 3.3.2 for a detailed visualization of a stand simulation).

2.5. Usability Evaluation

As to ensure a user-centered design, the usability evaluation was conducted at an early stage of development using a system usability scale (SUS) [62] method. The SUS method is based on 10 pre-defined statements with inter-correlations between all 10 in the range r = ±0.7 to ±0.9. In order to avoid response biases, some positive and negative statements are alternated. The rating is based on a five-point Likert scale ranging from “strongly agree” to “strongly disagree”. Despite the initial skepticism, this method has proven over the years to give reliable results time-effectively, and is now widely used in both industry and research [63]. Tullis and Stetson [64] demonstrated that it is possible to get reliable results with a sample of 8–12 users. Thus, we conducted the usability test of the decision support tool on a sample of nine forest specialists, ranging from soil specialists to forest management planning experts. The volunteers were asked to perform a use case scenario that would involve interaction with all of the graphical interfaces of the software. Given that SUS is not diagnostic, supplementary questions were added in order to identify the usability problems and get users feedback. Lewis J.R.’s overall satisfaction questionnaire [65] was also provided after the scenario demonstration to complement the user satisfaction dimension of the SUS usability questionnaire.

3. Illustrative Example

We illustrate the functionality of the system with a use case scenario, which is a sequence of tasks that a potential user performs using the software interface in order to achieve a result. The scenario describes the following: The actor (forest manager) is interested in examining the future development of a forest stand located in Catalonia, Spain, under different management options and climatic scenarios. He/she knows the location of the stand, its initial structure and composition, and also the current climate, and/or has generated a climatic scenario. He/she wants to import these data to the system and simulate the future states of the stand, as well as the associated ecosystem services values, under two management alternatives: (a) a shelterwood thinning method, to encourage natural regeneration, and (b) a clear cut. Afterwards, he/she will compare the simulations. Thus, there are some pre-conditions to run the system: (i) The stand structure and composition should be known, (ii) the climate scenario should be known, and (iii) the growth model included in the system has to be calibrated for the tree species present in the stand.
Use cases were used both at the beginning of the project to define the functionality of the system, and at the end of the project to validate that the requirements had been met (test cases). We also used a use case scenario to perform the usability testing. By presenting it in this paper we aim to outline the basic system workflow (Table 2).

3.1. Data Input

The first step in performing the scenario is to initiate the system by providing all the necessary data. The input data in the current system refer to the initial state of the stand and the climatic scenario. The initial state of the stand is described as the number of trees for each user-defined DBH class per stand (Table 3), which is currently set to 1 ha, with topography and the climatic conditions according to the initial year of the simulation. The data regarding the trees distribution are retrieved from the Spanish National Inventory Database. The selected plot is located in Lleida province, northeastern Spain. Typical climate conditions for the region for the year 2001, when the plot was established, and supplementary topographical information of the stand are organized in Table 4.
The climate change scenario for the given stand was obtained from the EU-CORDEX project, available at the Earth System Grid Federation (ESGF; http://esgf.llnl.gov), using the CCLM4-8-17 regional dynamic model and the RCP4.5 emissions scenario. We obtained a monthly meteorological series for the study plot by downscaling regional predictions using the R package “meteoland” [66]. The resulting meteorological data were uploaded in two separate files, one containing the mean monthly temperature, and another with the total monthly rainfall from 2001 to 2120 (Figure 7).
Given that the use case scenario includes the simulation of one single plot, all the information was entered manually via the stand definition UI. In a real case scenario, however, where a multiple-stand simulation is required, importing stand information from different sources would be more pragmatic. This fact has also been confirmed during the usability evaluation session, and the functionality is now added to the UI. In the case of the climate change UI, the preview of the imported climate scenario (Figure 7) was considered to be of importance for the users feedback on the uploaded data, and was also included at a later stage.

3.2. Management

For the demonstration purposes, two management alternatives were considered. The first alternative follows a uniform shelterwood method, a widely used natural regeneration method applied to Spanish Scots pine stands, consisting of one thinning implemented at year 40, a preparatory cut at year 80, a seed cut at year 90, and a final cut at year 100, as shown in Table 5. The thinning removes 30% of the basal area equally from all diameter classes; the preparatory cut is used to improve crown development, and removes 50% of the basal area; the seed cut removes another 50% of the remaining basal area, in order to favor the natural regeneration; and the final cut removes the remaining trees, leaving 10% of large trees as a mean to increase the structural diversity. The second alternative involves a clear cut at year 120, with no intermediate thinnings.
By having only two alternatives, we were able to manually define them through the UI (an example of this is shown in Figure 6) without using the alternative generator method, which automatically creates multiple alternatives based on the combination of the user-defined thinning intervals and final cutting options.

3.3. Simulation Outputs

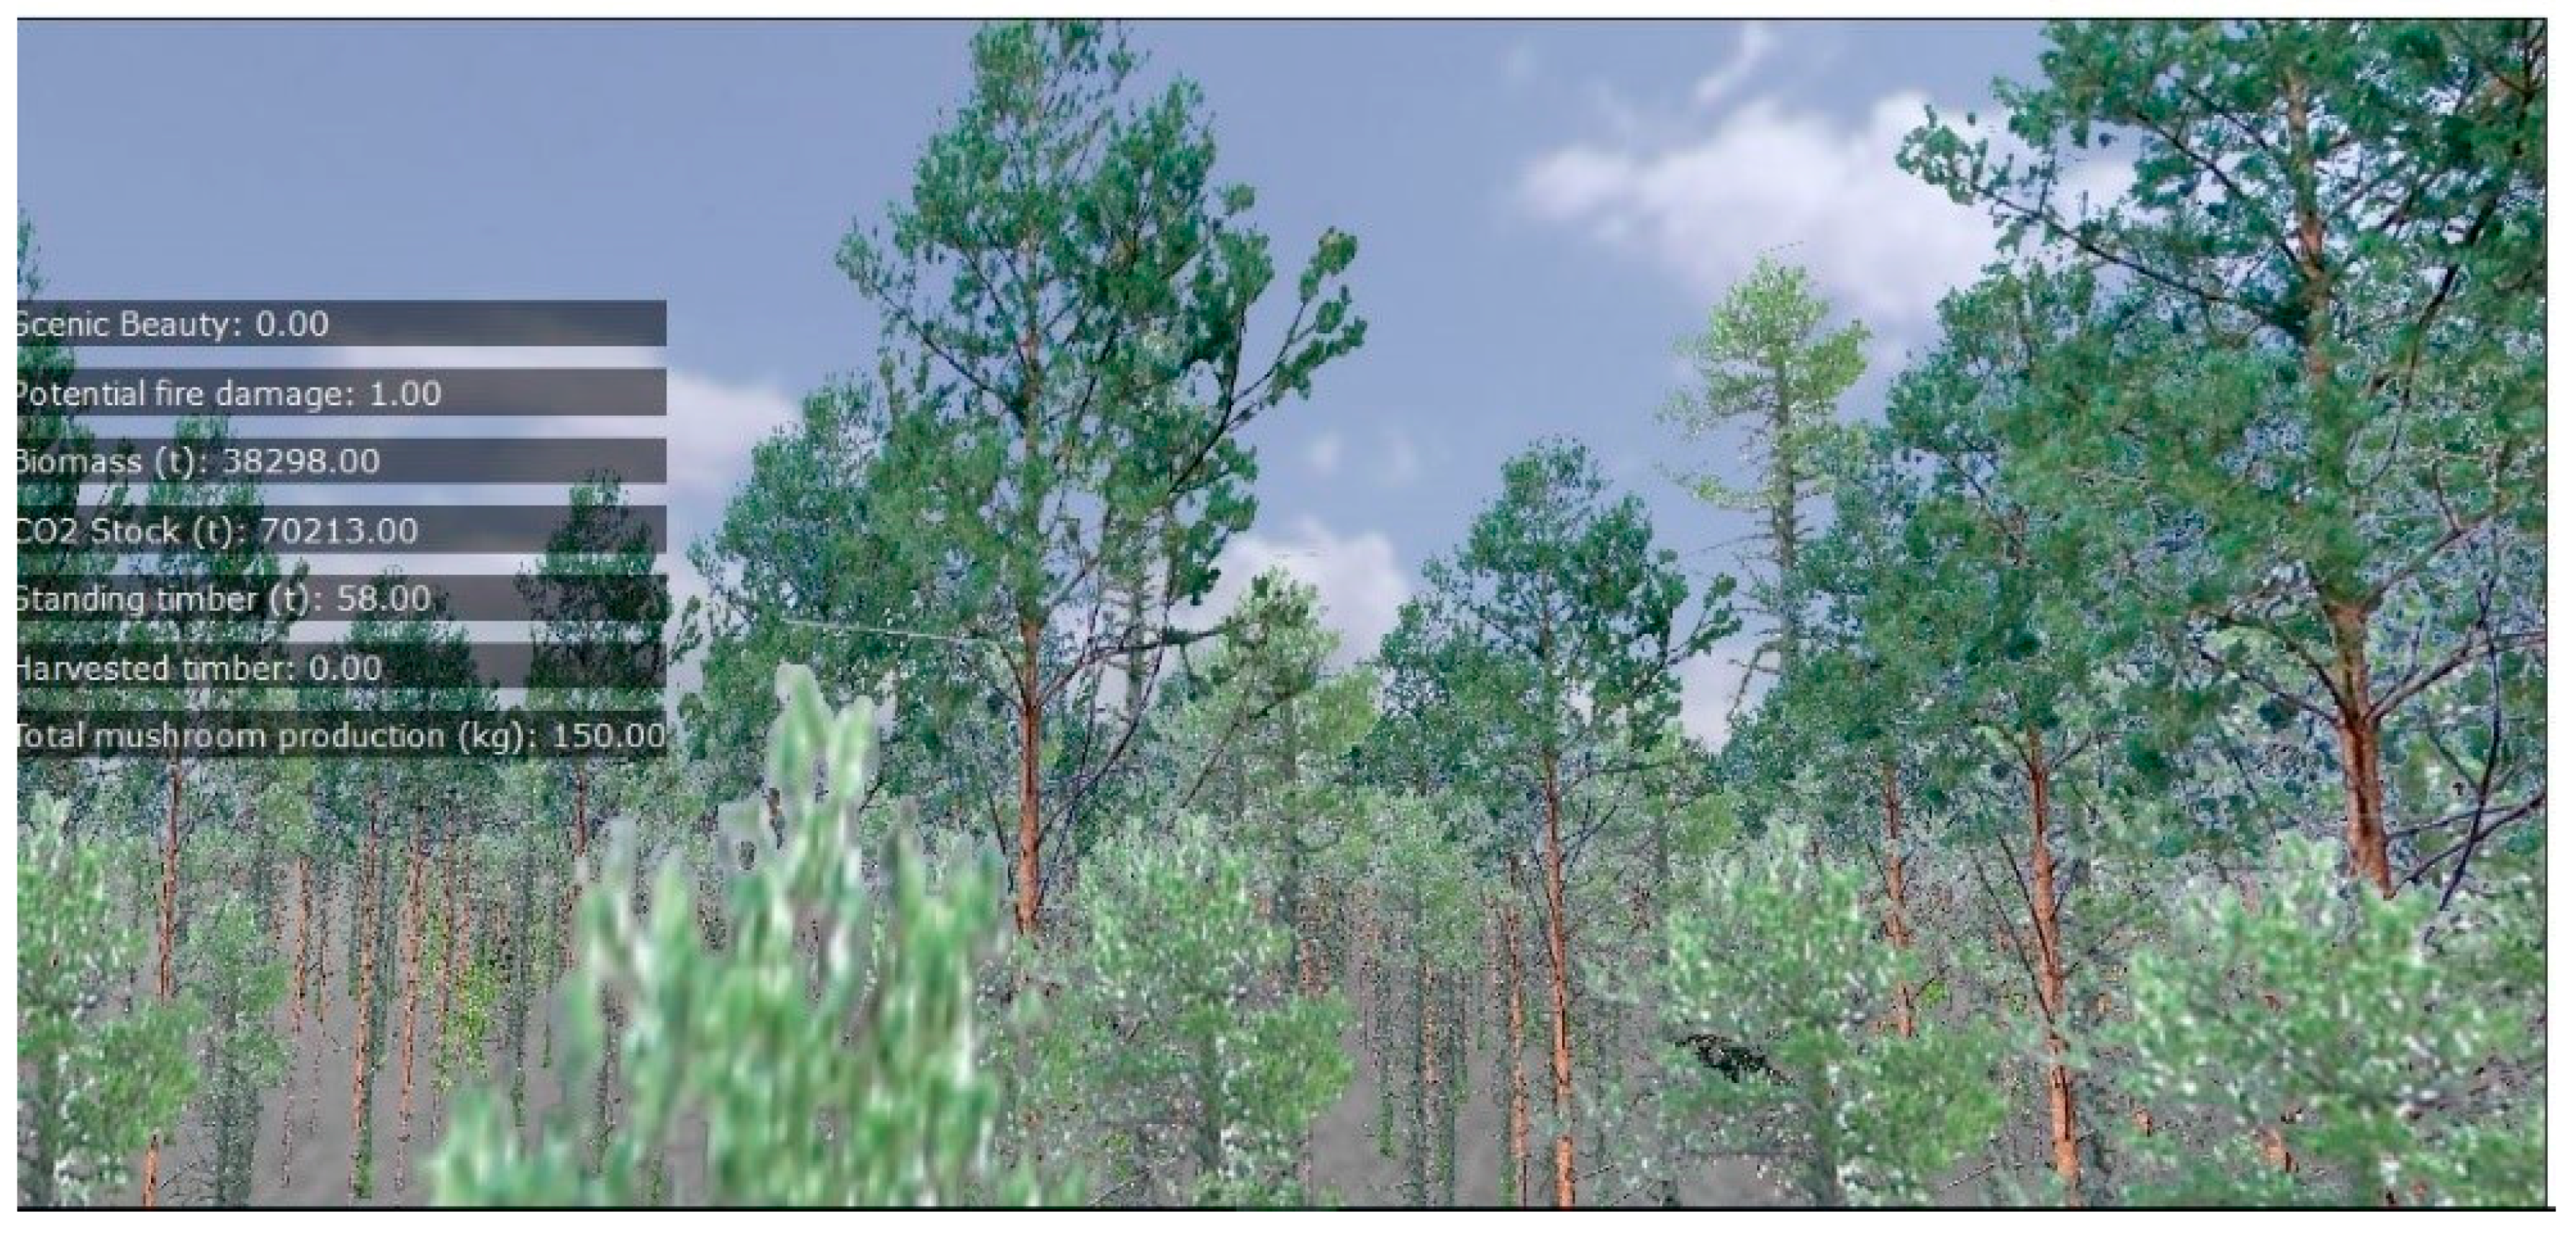
3.3.1. Overview of a Simulated Stand
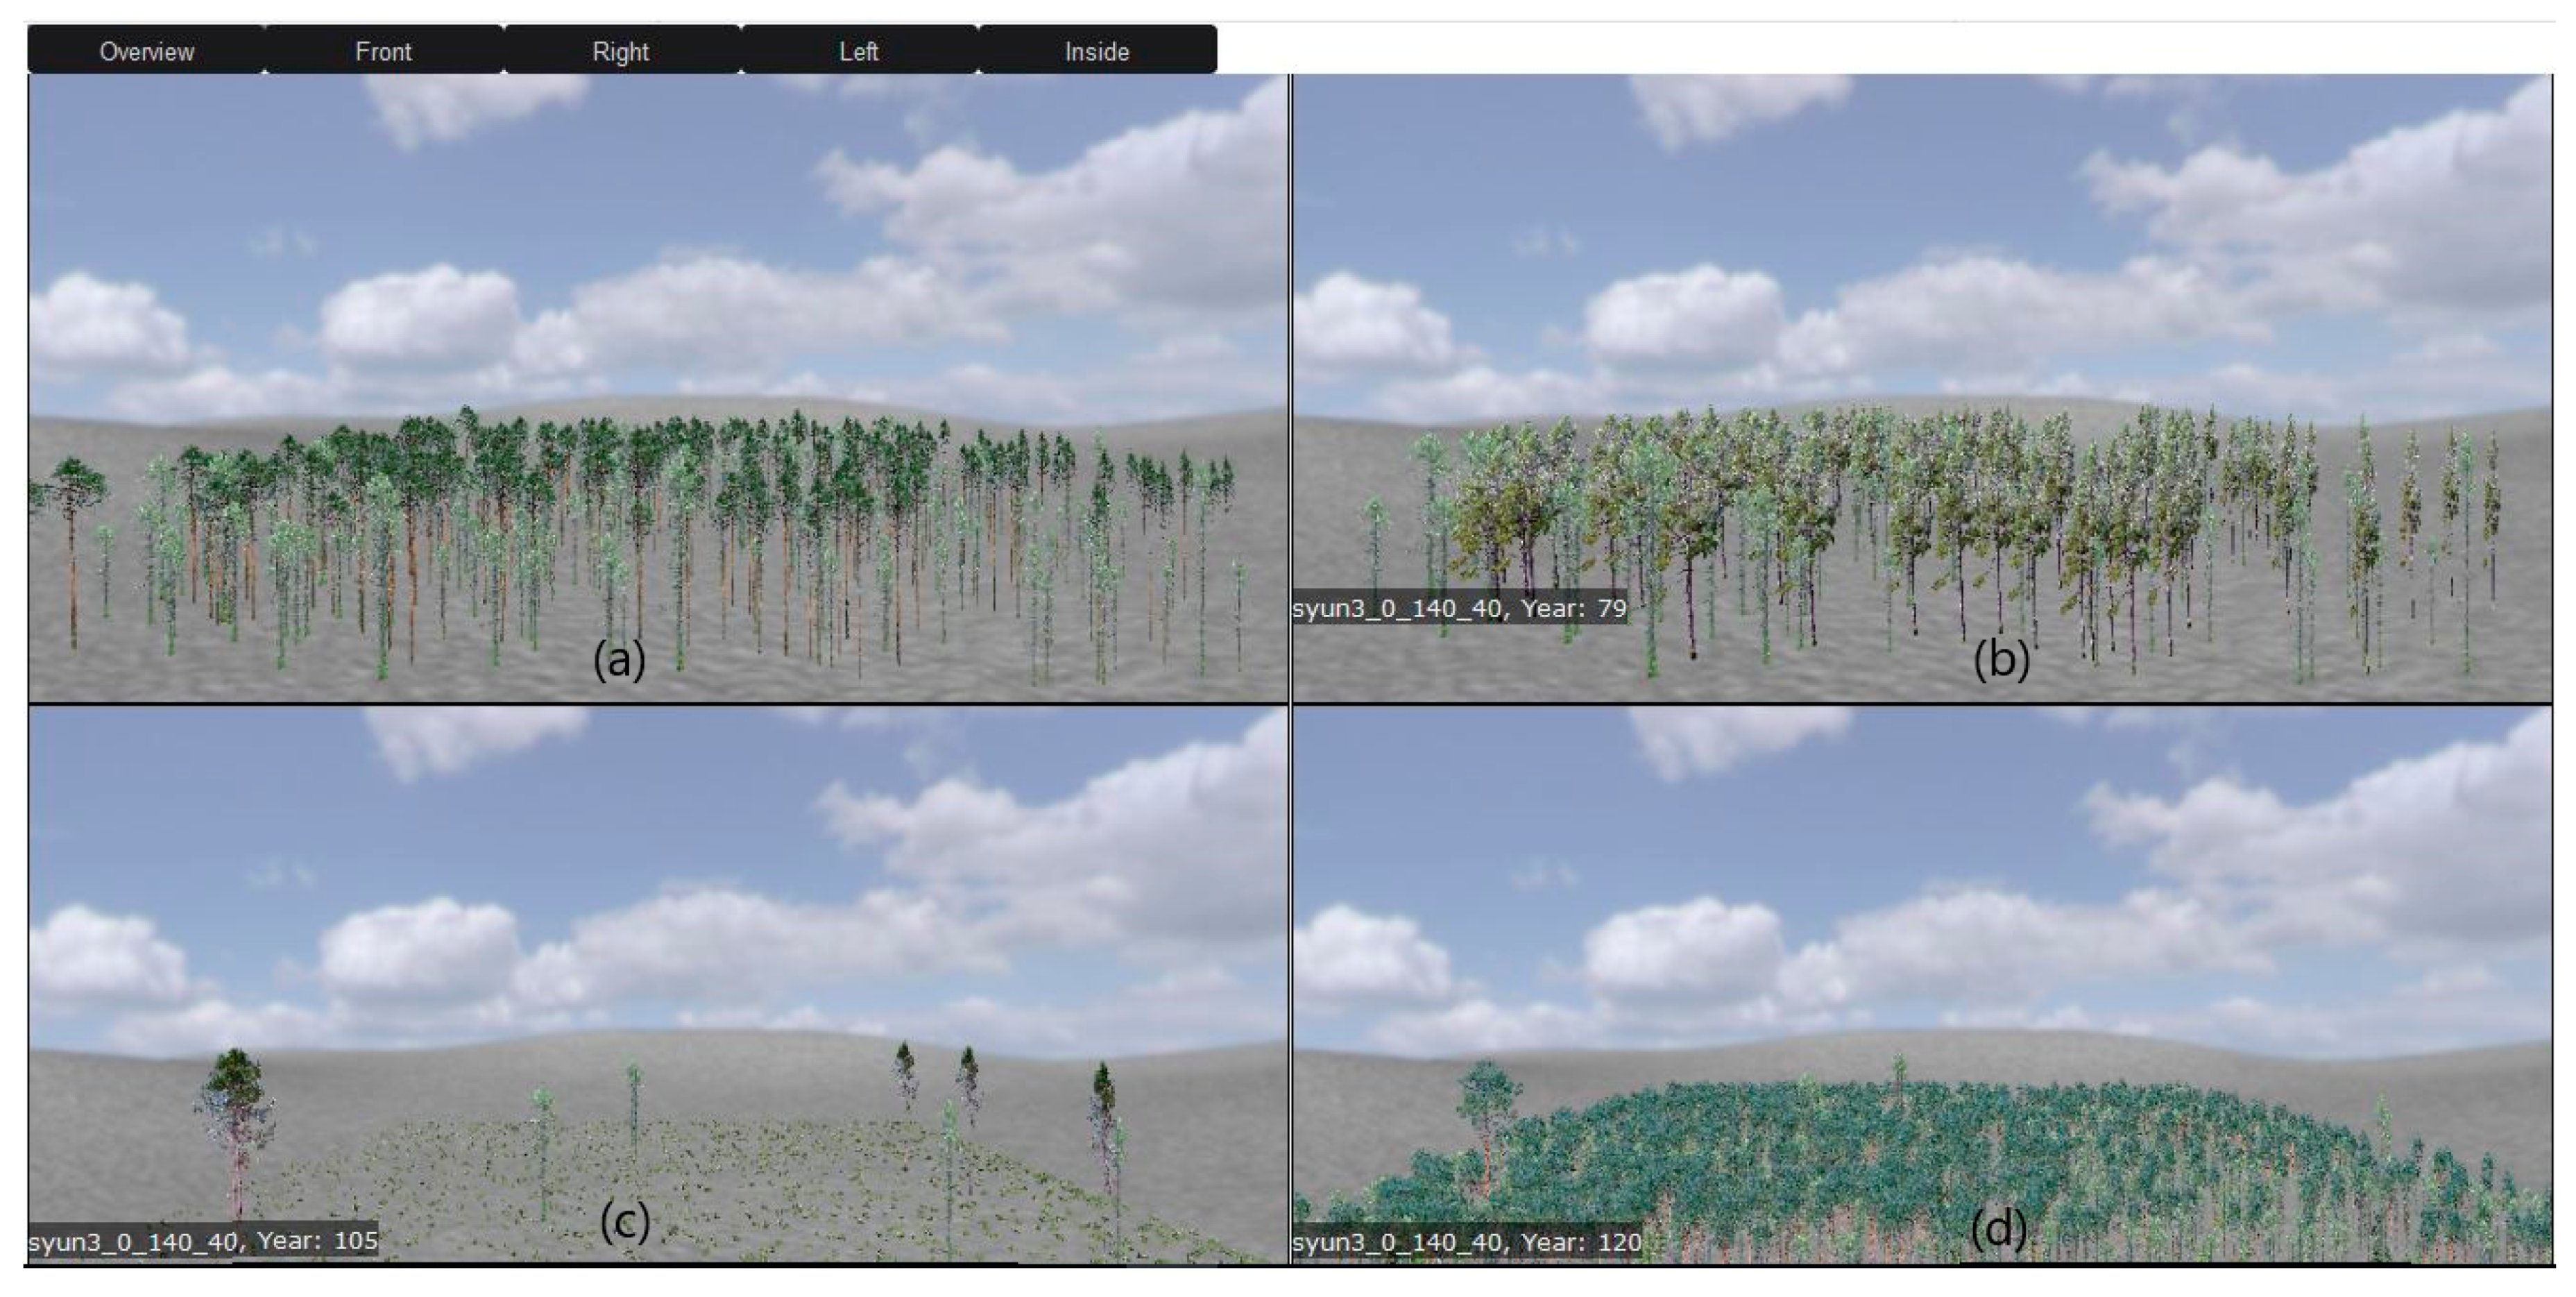
After simulating the two management alternatives (Table 5), the results are shown in the visualization interface (Figure 8 and Figure 9). The combination of visualization methods and contextual information allows end users to examine everything at once, and to detect the most important details. The overview tab (Figure 8) combines graphs and tables to illustrate the general information of the simulation. The interface allows a single visualization per alternative, or a comparison of the two alternatives. The graphs show the evolution of total basal area (BA), total number of trees, or quantified ES for the simulated period. Harvest information is organized in tables, displaying the harvesting year, BA, and the amount of harvested timber with the associated economical values. The evolution of the stand for the two alternatives displayed through graphs, complemented with the tabular harvest information, simplifies the focus of the user, since all the information is presented simultaneously.
The detailed view tab (Figure 9) shows the outputs per each simulation year in the forms of interactive maps, charts and tables. The coordinates of the trees are randomly located in the stand, but kept the same throughout the whole simulation. Thus, navigation through the simulated years can instantly show the changes. The interactive legend can be practical when examining particular species, or type of trees. Information retrieval via mouse click helps to identify the tree objects and adds value to the user experience. The interactive map allows switching between alternatives, maintaining the user-defined selections (e.g., year of simulation, zoom, and pan position), which gives an instant visual comparison option.

3.3.2. 3D Viewer

3D scenes are created on demand for each simulated year. They represent the state of the stand based on the information about species identity, height, and the coordinates of the trees. For example, the stand at the 120th year of the simulation is illustrated in Figure 9. Navigation within the stand is possible with the help of the shortcut navigation buttons. In addition to the 3D representation of the stand at a given year, the user can also visualize ecosystem services values on the left of the scene, and retrieve information of each tree, triggering a mouse click event. The user can also visualize 3D scenes corresponding to different years of simulation, and to different development stages of the stand (Figure 10).
Basic user interaction includes navigation through the scenes and information retrieval via mouse click. Each 3D object stores information related to tree species, type, DBH, and height of the tree. In the case of the 3D scene comparisons, the views are synchronized, in order to better visualize the changes (Figure 11).

4. Discussion and Conclusions

In this paper we presented a user-centered decision support tool able to efficiently simulate and visualize the future of forest stands and assess multiple ecosystem services under different management options and climatic scenarios. The main challenge was to couple a forest simulator that is sensitive to climate change with multiple ecosystem services models, while assuring the usability of the system. Forest managers were defined as potential end users and were engaged in the development stage. The tool may be efficiently used to project the growth of stands under different climate scenarios and/or management alternatives. Yet, the user must be aware that there is uncertainty in the outputs when performing long-term projections (e.g., uncertainty in climate scenarios, uncertainty related to pest attacks and fire events).
We chose the SORTIE-ND forest dynamics model for a number of reasons: the model is climate-change sensitive, it is able to simulate mixed and uneven-aged stands, and it has been parameterized for 59 tree species in 11 different study areas around the world, including the main species in the montane forests of the Pyrenees (northeastern Spain). The latter makes it accessible for a broader range of users. In addition, it is distance-dependent, and the individual tree location is kept constant during the whole simulation, which can be of interest for future applications (e.g., the use of this system for training future foresters to make thinnings and observe their effects). Although the chosen model is able to simulate other species than the ones selected in the present work, and can be used in different geographical areas by using proper parameters, however, some ecosystem services models embedded in the system (e.g., mushroom production) are restricted to a specific spatial extent, which makes them inappropriate to be extrapolated to other regions.
The architectural paradigm, chosen for the software development, is the most suitable for integrating third-party software into an existing application, as is the case with integrating the SORTIE-ND simulator into our system. We followed a modular implementation, imbedded in a three tier architectural pattern.
Through a use case scenario, we illustrated the workflow of the system, but also defined the requirements, and identified the drawbacks and the added values. The scenario was tested on a stand located in northeastern Spain, composed of tree species calibrated for the SORTIE-ND model. In order to run a simulation with different species and/or for other geographical regions, parameters for these species have to be provided. One of the advantages of the developed system is its ease of use and clarity in the performed tasks, which was achieved by considering usability rules at the very beginning of the project and by performing evaluations subsequently. As indicated by Gordon et al. [10], one of the oversights usually done by researchers that jeopardizes the use of decision support tools in practice is the lack of communication with potential end users at different stages of the development of the tools. We collaborated with the Montnegre Forest Owners Association for the user requirements stage, and also conducted a usability test on a sample of potential end users in the Forest Science and Technology Centre of Catalonia, using the SUS scale method. The results showed a score of 77.8 out of 100, which translates into “good”. The overall satisfaction questionnaire revealed a favorable result of 100%, where all the participants agreed (with responses “agree” and “strongly agree”) with the statements:
  • Overall, I am satisfied with the ease of completing the task(s).
  • Overall, I am satisfied with the amount of time it took to complete the task(s).
Most of the comments related to the complimentary questions were focused on the functionality of the system, which, at the time, was not yet applied. Suggestions, such as uploading files or generating tabular data, were implemented at a later stage of development. Since the session was focused mainly on the usability evaluation of the system, we concluded that efficiency, effectiveness, and satisfaction of interacting with the software was achieved to a sufficient level.
To sum up, the developed tool can be efficiently used by forest management practitioners for traditional objectives, as well as for more holistic purposes under climate change uncertainty and multiple ESs focus. While we specifically focused on practitioners target group, the tool has the potential to be used in facilitating education in the field of forest management. In terms of future work, we design to add more flexibility to the system, and expand the audience by integrating various forest dynamic models at different spatial scales, as well as by adopting more ecosystem services models for more geographical regions. We also aim to incorporate an optimization-based decision support module, thus providing an integrated approach to decision-making practices.

Author Contributions

All co-authors did participate in writing this article, specifically conceptualization, I.C., J.G.-G., and J.R.G.-O.; methodology, I.C., J.G.-G., J.R.G.-O., and A.A.; software, I.C.; validation, I.C. and A.A.; formal analysis, I.C. and A.A.; investigation, I.C., J.G.-G., J.R.G.-O., and A.A.; resources, J.G.-G. and J.R.G.-O.; data curation, I.C., A.A. and J.R.G.-O.; writing—original draft preparation, I.C., J.G.-G., J.R.G.-O., and A.A.; writing—review and editing, I.C., J.G.-G., J.R.G.-O., and A.A.; visualization, I.C.; supervision, J.G.-G. and J.R.G.-O.; project administration, J.G.-G. and J.R.G.-O.; funding acquisition, J.G.-G. and J.R.G.-O.

Funding

CTFC authors acknowledge funding from MINECO (Ref. RYC-2011-08983, RYC-2013-14262, AGL2015-67293-R MINECO/FEDER) and from CERCA Programme/Generalitat de Catalunya. This research has also received funding from the European Union’s H2020 research and innovation program under the Marie Sklodowska-Curie grant agreement No. 691149 (SuFoRun) and from the ERA-NET cofund ‘ForestValue – Innovating the forest-based bioeconomy’ project title “Novel business models and mechanisms for the sustainable supply of and payment for forest ecosystem services” funded in the framework of the (NOBEL). A.A. was funded by MINECO with a JdC-I grant (IJCI-2016-30049).

Acknowledgments

We want to particularly thank Charles Canham and Lora Murphy for fruitful discussions about the integration of SORTIE-ND within this decision support tool, and for their technical assistance in the use of SORTIE-ND. We also acknowledge the fruitful comments of three unknown reviewers, which have contributed to improve the quality of the article.

Conflicts of Interest

The authors declare no conflict of interest.

References

  1. Duraiappah, A.K.; Naeem, S.; Agardy, T.; Ash, N.J.; Cooper, H.D.; Díaz, S.; Faith, D.P.; Mace, G.; McNeely, J.A.; Mooney, H.A.; et al. Ecosystems and Human Well-Being; Island Press: Washington, DC, USA, 2005; Volume 5, ISBN 1597260401. [Google Scholar]
  2. Millennium Ecosystem Assestment. Ecosystems and Human Well-Being; Island Press: Washington, DC, USA, 2005; Volume 5, ISBN 1559634022. [Google Scholar]
  3. Haines-Young, R.; Potschin, M. Common International Classification of Ecosystem Services (CICES) V5.1 Guidance on the Application of the Revised Structure; Fabis Consulting Ltd.: Nottingham, UK, 2018. [Google Scholar]
  4. Terradas, J. Forest dynamics: A broad view of the evolution of the topic, including some recent regional contributions. For. Syst. 2005, 14, 525–537. [Google Scholar] [CrossRef]
  5. Haines-Young, R.; Potschin, M. Common International Classification of Ecosystem Services (CICES): 2011 Update. In Proceedings of the Expert Meeting on Ecosystem Accounts, London, UK, 5–7 December 2011; pp. 1–17. [Google Scholar]
  6. Lee, H.; Lautenbach, S. A quantitative review of relationships between ecosystem services. Ecol. Indic. 2016, 66, 340–351. [Google Scholar] [CrossRef]
  7. Ruiz-Peinado, R.; Del Rio, M.; Montero, G. New models for estimating the carbon sink capacity of Spanish softwood species. For. Syst. 2011, 20, 176. [Google Scholar] [CrossRef]
  8. Reyer, C.P.; Bathgate, S.; Blennow, K.; Borges, J.G.; Bugmann, H.; Delzon, S.; Faias, S.P.; Garcia-Gonzalo, J.; Gardiner, B.; Gonzalez-Olabarria, J.R.; et al. Are forest disturbances amplifying or canceling out climate change-induced productivity changes in European forests? Environ. Res. Lett. 2017, 12, 034027. [Google Scholar] [CrossRef]
  9. Gómez-garcía, E.; Azevedo, J.C.; Pérez-rodríguez, F. Original papers A compiled project and open-source code to generate web-based forest modelling simulators. Comput. Electron. Agric. 2018, 147, 1–5. [Google Scholar] [CrossRef]
  10. Gordon, S.N.; Floris, A.; Boerboom, L.; Lämås, T.; Ola, L.; Nieuwenhuis, M. Studying the use of forest management decision support systems: An initial synthesis of lessons learned from case studies compiled using a semantic wiki. Scand. J. For. Res. 2013, 29, 44–55. [Google Scholar] [CrossRef]
  11. Barreiro, S.; Rua, J.; Tomé, M. StandsSIM-MD: A management driven forest SIMulator. For. Syst. 2016, 25. [Google Scholar] [CrossRef]
  12. Shifley, S.R.; He, H.S.; Lischke, H.; Wang, W.J.; Jin, W.; Gustafson, E.J.; Thompson, J.R.; Thompson, F.R.; Dijak, W.D.; Yang, J. The past and future of modeling forest dynamics: From growth and yield curves to forest landscape models. Landsc. Ecol. 2017, 32, 1307–1325. [Google Scholar] [CrossRef]
  13. Larocque, G.R. Ecological Forest Management Handbook, 1st ed.; Larocque, G.R., Ed.; CRC Press: Boca Raton, FL, USA, 2015. [Google Scholar]
  14. Lei, X.; Yu, L.; Hong, L. Forest Ecology and Management Climate-sensitive integrated stand growth model (CS-ISGM) of Changbai larch (Larix olgensis) plantations. For. Ecol. Manag. 2016, 376, 265–275. [Google Scholar] [CrossRef]
  15. Nadal-Sala, D.; Keenan, T.F.; Sabate, S.; Gracia, C. Forest Eco-Physiological Models: Water Use and Carbon Sequestration. In Managing Forest Esosystems: The Challenge of Climate Change; Felipe, B., Robert, J., Valerie, L., Eds.; Springer: Cham, Switzerland, 2017; pp. 81–103. [Google Scholar]
  16. Mäkelä, A.; Landsberg, J.; Ek, A.R.; Burk, T.E.; Ter-Mikaelian, M.; Agren, G.I.; Oliver, C.D.; Puttonen, P. Process-based models for forest ecosystem management: Current state of the art and challenges for practical implementation. Tree Physiol. 2000, 20, 289–298. [Google Scholar] [CrossRef]
  17. Botkin, D.B. Forest Dynamics. An Ecological Model; Oxford University Press on Demand: New York, NY, USA, 1993; ISBN 0195065557. [Google Scholar]
  18. Bugmann, H. A REVIEW OF FOREST GAP MODELS The description, understanding and prediction of the long-term dynamics of forest ecosystems has fascinated ecologists for a long time (cf. Clements, 1916; Watt, 1925; Gleason, 1926; Tansley, 1936; Whittaker, 1953. Clim. Chang. 2001, 51, 259–305. [Google Scholar] [CrossRef]
  19. Liu, J.; Ashton, P.S. Individual-based simulation models for forest succession and management. For. Ecol. Manag. 1995, 73, 157–175. [Google Scholar] [CrossRef]
  20. Peng, C. Understanding the role of forest simulation models in sustainable forest management. Environ. Impact Assess. Rev. 2000, 20, 481–501. [Google Scholar] [CrossRef]
  21. Fontes, L.; Bontemps, J.-D.; Bugmann, H.; Van Oijen, M.; Gracia, C.; Kramer, K.; Lindner, M.; Rötzer, T.; Skovsgaard, J.P. Models for supporting forest management in a changing environment. For. Syst. 2011, 3, 8. [Google Scholar] [CrossRef] [Green Version]
  22. Coates, K.D.; Boldor, M.; Hall, E.; Astrup, R. Evaluation of the Complex Stand Simulation Model SORTIE-ND for Timber Supply Review in Sub-Boreal Forests of Northern BC; Technical Report For Forest Science Program Project Y093187; BC Forest Service: Smithers, BC, Canada, 2009; pp. 1–9. [Google Scholar]
  23. Canham, C.D.; Coates, K.D.; Bartemucci, P.; Quaglia, S. Measurement and modeling of spatially explicit variation in light transmission through interior cedar-hemlock forests of British Columbia. Can. J. For. Res. 1999, 29, 1775–1783. [Google Scholar] [CrossRef]
  24. Borges, J.G.; Nordstrom, E.M.; Garcia-Gonzalo, J.; Hujala, T.; Trasobares, A. Computer-Based Tools for Supporting Forest Management. The Experience and the Expertise World-Wide; Department of Forest Resource Management, Swedish University of Agricultural Sciences: Umeå, Sweden, 2014; ISBN 978-91-576-9237-5. [Google Scholar]
  25. Vacik, H.; Borges, J.G.; Garcia-Gonzalo, J.; Eriksson, L.O. Decision support for the provision of ecosystem services under climate change: An editorial. Forests 2015, 6, 3212–3217. [Google Scholar] [CrossRef]
  26. Wikström, P.; Edenius, L.; Elfving, B.; Eriksson, L.O.; LäMåS, T.; Sonesson, J.; ÖHMAN, K.; Wallerman, J.; Waller, C.; Klintebäck, F. The Heureka Forestry Decision Support System: An Overview. Math. Comput. For. Nat. Sci. 2011, 3, 87–94. [Google Scholar]
  27. Reynolds, K.M. Integrated decision support for sustainable forest management in the United States: Fact or fiction? Comput. Electron. Agric. 2005, 49, 6–23. [Google Scholar] [CrossRef]
  28. Costanza, R.; Arge, R.; De Groot, R.; Farberk, S.; Grasso, M.; Hannon, B.; Limburg, K.; Naeem, S.; O’Neill, R.V.; Paruelo, J.; et al. The value of the world’s ecosystem services and natural capital. Nature 1997, 387, 253–260. [Google Scholar] [CrossRef]
  29. Binder, S.; Haight, R.G.; Polasky, S.; Warziniack, T.; Mockrin, M.H.; Deal, R.L.; Arthaud, G. Forest Service General Technical Report NRS-170 Northern Research Station Assessment and Valuation of Forest Ecosystem Services: State of the Science Review; US Department of Agriculture, Forest Service, Northern Research Station: Newtown Square, PA, USA, 2017. [Google Scholar]
  30. Kangas, A.; Korhonen, K.T.; Packalen, T.; Vauhkonen, J. Sources and types of uncertainties in the information on forest-related ecosystem services. For. Ecol. Manag. 2018, 427, 7–16. [Google Scholar] [CrossRef]
  31. Baker, P.J.; Robinson, A. Review and Comparison of Tree- and Stand-based Forest Growth Models for Potential Integration into EnSym; University of Melbourne: Victoria, Australia, 2010. [Google Scholar]
  32. Pretzsch, H.; Grote, R.; Reineking, B.; Rötzer, T.; Seifert, S. Models for forest ecosystem management: A European perspective. Ann. Bot. 2008, 101, 1065–1087. [Google Scholar] [CrossRef] [PubMed]
  33. Morán-Ordoñez, A.; Roces-Díaz, J.; Otsu, K.; Ameztegui, A.; Coll, L.; Lefevre, F.; Retana, J.; Brotons, L. The use of scenarios and models to evaluate the future of nature values and ecosystem services in complex socio-ecological systems. Reg. Environ. Chang. 2019, 19, 415–428. [Google Scholar] [CrossRef]
  34. Garcia-Gonzalo, J.; Bushenkov, V.; McDill, M.E.; Borges, J.G. A decision support system for assessing trade-offs between ecosystem management goals: An application in Portugal. Forests 2015, 6, 65–87. [Google Scholar] [CrossRef]
  35. Martell, D.L. The Optimal Rotation of a Flammable Forest Stand. Can. J. For. Res. 1980, 10, 30–34. [Google Scholar] [CrossRef]
  36. Reed, W.J. The effects of the risk of fire on the optimal rotation of a forest. J. Environ. Econ. Manag. 1984, 11, 180–190. [Google Scholar] [CrossRef]
  37. González-Olabarria, J.R.; Pukkala, T. Integrating fire risk considerations in landscape-level forest planning. For. Ecol. Manag. 2011, 261, 278–287. [Google Scholar] [CrossRef]
  38. González, J.R.; Palahí, M.; Pukkala, T. Integrating fire risk considerations in forest management planning in Spain—A landscape level perspective. Landsc. Ecol. 2005, 20, 957–970. [Google Scholar] [CrossRef]
  39. Hanewinkel, M.; Peltola, H.; Soares, P.; González-Olabarria, J.R. Recent approaches to model the risk of storm and fire to European forests and their integration into simulation and decision support tools. For. Syst. 2010, 19, 30–47. [Google Scholar]
  40. Gracia, C.A.; Tello, E.; Sabaté, S.; Belot, J. GOTILWA: An Integrated Model of Water Dynamics and Forest Growth. Ecol. Mediterr. Evergr. Oak For. Ecol. Stud. (Analysis Synth.) 1999, 137. [Google Scholar]
  41. Nute, D.; Potter, W.D.; Maier, F.; Wang, J.; Twery, M.; Rauscher, H.M.; Knopp, P.; Thomasma, S.; Dass, M.; Uchiyama, H.; et al. NED-2: An agent-based decision support system for forest ecosystem management. Environ. Model. Softw. 2004, 19, 831–843. [Google Scholar] [CrossRef]
  42. Python Software Foundation. Available online: https://www.python.org/ (accessed on 26 March 2019).
  43. Graphical User Interfaces with Tk. Available online: https://docs.python.org/3/library/tk.html (accessed on 26 March 2019).
  44. Lxml—Processing XML and HTML with Python. Available online: https://lxml.de (accessed on 26 March 2019).
  45. SORTIE-ND. Available online: http://www.sortie-nd.org/ (accessed on 11 October 2018).
  46. W3DOM. Available online: https://www.x3dom.org/ (accessed on 12 December 2018).
  47. Canham, C.D.; Murphy, L.E.; Papaik, M. SORTIE-ND: Software for Spatialy-Explicit Simulation of Forest Dynamics; Cary Institute of Ecosystem Studies: Millbrook, NY, USA, 2005. [Google Scholar]
  48. Pacala, S.W.; Canham, C.D.; Silander, J.A., Jr. Forest models defined by field measurements: I. The design of a northeastern forest simulator. Can. J. For. Res. 1993, 23, 1980–1988. [Google Scholar] [CrossRef]
  49. Ameztegui, A.; Coll, L.; Messier, C. Modelling the effect of climate-induced changes in recruitment and juvenile growth on mixed-forest dynamics: The case of montane—Subalpine Pyrenean ecotones. Ecol. Model. 2015, 313, 84–93. [Google Scholar] [CrossRef]
  50. Bose, A.K.; Harvey, B.D.; Coates, K.D.; Brais, S.; Bergeron, Y. Modelling stand development after partial harvesting in boreal mixedwoods of eastern Canada. Ecol. Model. 2015, 300, 123–136. [Google Scholar] [CrossRef]
  51. Ameztegui, A.; Cabon, A.; De Cáceres, M.; Coll, L. Managing stand density to enhance the adaptability of Scots pine stands to climate change: A modelling approach. Ecol. Model. 2017, 356, 141–150. [Google Scholar] [CrossRef] [Green Version]
  52. Ameztegui, A.; Paquette, A.; Shipley, B.; Heym, M.; Messier, C.; Gravel, D. Shade tolerance and the functional trait—Demography relationship in temperate and boreal forests. Funct. Ecol. 2017, 31, 821–830. [Google Scholar] [CrossRef]
  53. Thorsen, B.J.; Mavsar, R.; Tyrväinen, L. The Provision of Forest Ecosystem Services Volume I: Quantifying and valuing What Science Can Tell Us; Prokofieva, I., Stenger, A., Eds.; European Forest Institute: Joensuu, Finland, 2014; Volume I, ISBN 9789525980127. [Google Scholar]
  54. Borràs, A.; Gené, J. Guia de la fusta de les espècies forestals de Catalunya; Catalan Institute of Wood: Solsona, Spain, 2012. [Google Scholar]
  55. De Miguel, S.; Bonet, J.; Pukkala, T.; De Aragón, J. Impact of forest management intensity on landscape-level mushroom productivity: A regional model-based scenario analysis. For. Ecol. Manag. 2014, 330, 218–227. [Google Scholar] [CrossRef]
  56. Martín-Alcón, S.; González-Olabarria, J.R.; Coll, L. Wind and snow damage in the Pyrenees pine forests: Effect of stand attributes and location. Silva Fenn. 2010, 44.3, 399–410. [Google Scholar] [CrossRef]
  57. Selkimäki, M.; González-Olabarria, J.R.; Pukkala, T. Site and stand characteristics related to surface erosion occurrence in forests of Catalonia (Spain). Eur. J. For. Res. 2012, 131, 727–738. [Google Scholar] [CrossRef]
  58. Blasco, E.; González-Olabarria, J.R.; Rodriguéz-Veiga, P.; Pukkala, T.; Kolehmainen, O.; Palahí, M. Predicting scenic beauty of forest stands in Catalonia (North-east Spain). J. For. Res. 2009, 20, 73–78. [Google Scholar] [CrossRef]
  59. Solano, J.-M.; Fernández, J.; Palahí, M.; Pukkala, T.; Prokofieva, I. Es rentable la gestion forestal en Cataluña? Economistas 2007, 25, 116–124. [Google Scholar]
  60. Coll, L.; González-Olabarria, J.R.; Mola-Yudego, B.; Pukkala, T.; Messier, C. Predicting understory maximum shrubs cover using altitude and overstory basal area in different Mediterranean forests. Eur. J. For. Res. 2011, 130, 55–65. [Google Scholar] [CrossRef]
  61. Web 3D Consortium. Available online: http://www.web3d.org/ (accessed on 14 December 2018).
  62. Brooke, J. SUS—A quick and dirty usability scale. Usability Eval. Ind. 1996, 189, 4–7. [Google Scholar]
  63. Lewis, J. The System Usability Scale: Past, Present, and Future. Int. J. Hum. Comput. Interact. 2018, 34, 577–590. [Google Scholar] [CrossRef]
  64. Tullis, T.; Stetson, J. A Comparison of Questionnaires for Assessing Website Usability. In Proceedings of the Usability Professional Association Conference, Minneapolis, MN, USA, 7–11 June 2004. [Google Scholar]
  65. Lewis, J.R. IBM Computer Usability Satisfaction Questionnaires: Psychometric Evaluation and Instructions for Use. Int. J. Hum. Comput. Interact. 1995, 7, 57–78. [Google Scholar] [CrossRef]
  66. De Caceres, M.; Martin-StPaul, N.; Turco, M.; Cabon, A.; Granda, V. Estimating daily meteorological data and downscaling climate models over landscapes. Environ. Model. Softw. 2018, 108, 186–196. [Google Scholar] [CrossRef]
Figure 1. Conceptual design. Five consecutive components are illustrated clockwise: the information management component, the prescription generator component, the stand simulator, the Ecosystem Services (ESs) calculator component, and the visualization component. The arrows show the workflow and the interaction between the components.
Forests 10 00440 g001
Figure 2. System architecture: three-tier design consisting of a data tier, presentation tier, and application tier. Data from different sources are processed in the application layer and sent to the presentation layer.
Forests 10 00440 g002
Figure 3. Graphical user interface (UI). The diagram shows the logical connection between interfaces, and the actions required to be performed on each interface/module.
Forests 10 00440 g003
Figure 4. Input data UI. Initial stand condition is defined in terms of plot parameters (latitude, annual precipitation, annual mean temperature, etc.) and tree composition.
Forests 10 00440 g004
Figure 5. Climate change UI (user-defined parameters tab). Parameters B and C can be defined by the user in the left panel, and the climate change trend can be visualized in form of a graph, by triggering the display button.
Forests 10 00440 g005
Figure 6. Management interface. The thinnings are defined in terms of the number of thinnings, the thinning year and thinning type, and also the diameter class range and the amount to cut. The final cutting section, at the bottom of the interface, offers three options: partial cut, clearcut, and no cut.
Forests 10 00440 g006
Figure 7. Climate change UI. Preview of the uploaded climate change scenario. The charts are generated by calculating the mean annual temperature (a) and total annual precipitation (b) throughout the simulated period from the uploaded files.
Forests 10 00440 g007
Figure 8. Visualization user interface. The overview tab facilitates the comparison of the stand under two simulated alternatives. The figure shows the evolution of the basal area for the two alternatives, displayed through graphs, complemented with the tabular harvest information.
Forests 10 00440 g008
Figure 9. Visualization interface. The detailed view tab incorporates an interactive 2D map of the stand, and additional information such as tree DBH distribution is organized in interactive bar charts as well as tables showing the stand composition and ecosystem services.
Forests 10 00440 g009
Figure 10. 3D viewer: single stand visualization. The viewpoint is set inside the stand, where a two-stage stand of P. sylvestris can be observed at the 120th year of the simulation using the shelterwood method. The left panel is used to show ecosystem service values for this year of the simulation. By clicking on each tree object, its information can be seen in the left corner of the window, above the scene.
Forests 10 00440 g010
Figure 11. 3D viewer: stand comparison. Different states of the stand can be compared in a single view. The figure shows clockwise the initial state of the stand (a), year 79 of the simulation (b), year 105 (c), five years after clear cut, and year 120 (d).
Forests 10 00440 g011
Table 1. Models used to quantify ecosystem services and risk reduction indicators.
Ecosystem ServiceDescriptionAuthor
Provisioning Services
Biomass productionAbove- and below-ground biomass, expressed by roots, stem, branches, and foliage of the trees.Ruiz-Peinado et al., (2011) [7]
Timber productionVolume of harvested timber, derived from the stem biomass and wood density at 12% humidityCatalan Guide for Forest Species [54]
Mushroom productionAmount of total, edible, and marketed mushrooms, in kg per hectareDe-Miguel et al. (2014) [55]
Regulating and Maintenance Services and Indicators
Carbon sequestrationAmount of sequestrated carbon by the tree biomassRuiz-Peinado et al. (2011) [7]
Forest fire prevention indicatorPotential fire damage, derived from Spanish forest inventories from plots affected by fire. González-Olabarria et al. (2005) [38]
Snow and wind damage prevention indicatorStand-level models for Pinus sylvestris and Pinus uncinata, describing the snow and wind damage severity based on data from the national forest inventory.Martín-Alcón et al. (2010) [56]
Erosion protection indicatorStand-level models for all the species in Catalonia, based on data from national forest inventory describing the probability of surface erosion occurrence. Used as an indicator of the erosion protection class defined by the Common International Classification of Ecosystem Services (CICES).Selkimäki et al. (2012) [57]
Cultural Services
Scenic beautyThe aesthetic value of the forest, based on 259 evaluations of perceptual preference of pictures and 3D scenes.Blasco et al. (2009) [58]
Auxiliary Models
Timber valueEconomical value of timber, expressed in relation to roadside timber price, felling cost, and transportation costSolano et al. (2007) [59]
Maximum shrub coverageMaximum response models relating maximum understory shrub cover with stand basal area and elevation for different dominant canopy species, using data from the Spanish National Forest InventoryColl et al. (2010) [60]
Table 2. Use case scenario workflow.
System ModulesBasic StepsAlternative Path
Data input
1.
Define the initial state of the stand by filling in the fields in the software interface, using data provided either from an existing stand inventory or from the National Forest Inventory and set a simulation time horizon
Upload tab delimited files containing stand initial conditions and stand composition
2.
Upload climatic data, containing average monthly precipitation and average monthly temperature for all the years of the simulation
Provide precipitation and temperature change parameters
Management
3.
Create prescriptions (management alternatives) by defining the number and periodicity of thinnings, thinning intensity, and the characteristics of final cutting
Proceed without management alternatives
Simulation
4.
Run the simulator
2D visualization
5.
Visualize the overall results of the simulation(s) and compare two different management alternatives
6.
Visualize each year separately and observe changes in forest development and ecosystem services
3D visualization
7.
Navigate the 3D scenes of the stand
Table 3. Species distribution.
DBH ClassP. sylvestrisP. uncinata
0–101270
11–15014
16–20560
21–25014
26–30140
Table 4. Initial plot conditions.
Latitude (degrees)AVG Precipitation (mm)AVG Temperature (°C)Slope (%)Distance from Road (m)Altitude (m)Aspect (degrees)
42.09001027.501200260
Table 5. Management alternatives definition.
Harvest TypeYearIntensity (%Basal Area)
Alternative 1
Thinning4030
Preparatory cut8050
Seed cut9050
Final cut10090
Alternative 2
Clearcut120100

