Article

Potential for Forest Restoration and Deficit Compensation in Itacaiúnas Watershed, Southeastern Brazilian Amazon

by
Sâmia Nunes
1,*,
Rosane B. L. Cavalcante
1,
Wilson R. Nascimento, Jr.
1,
Pedro Walfir M. Souza-Filho
1,2 and
Diogo Santos
1
1
Instituto Tecnológico Vale, Rua Boaventura da Silva, 955, Belém 66055-090, PA, Brazil
2
Geosciences Institute, Universidade Federal do Pará, Rua Augusto Correa 1, Belém 66075-110, PA, Brazil
*
Author to whom correspondence should be addressed.
Forests 2019, 10(5), 439; https://doi.org/10.3390/f10050439
Submission received: 29 April 2019 / Revised: 16 May 2019 / Accepted: 17 May 2019 / Published: 21 May 2019
(This article belongs to the Special Issue Watershed Scale Forest Restoration and Sustainable Development)

Abstract

:
The conservation and restoration of native vegetation is vital for providing key hydrological services (i.e., maintaining high water quality, atmospheric humidity, and precipitation patterns). However, this research area lacks fine-scale studies at the watershed level to evaluate opportunities for forest restoration and deficit (the shortfall of forest required to be restored or compensated), as well as the implications for watershed management. We provide the first fine-scale estimation of forest and deficit distribution, integrating permanent preservation areas (APPs, in Portuguese) and legal reserves (RL, in Portuguese), according to Brazilian environmental law, for the 41,300 km2 Itacaiúnas watershed in the Brazilian state of Pará, which has lost 50% of its vegetation cover. Using 30 m- and 10 m-resolution imagery, a multi-temporal land use classification was performed by geographic object-based image analysis (GEOBIA). The results were combined with a set of Brazilian regulations on the conservation and restoration of APPs and RL to assess patterns of forest cover and legal compliance. We found that the total RL deficit (4383 km2) was higher than the total forest surplus (above legal obligation) (3241 km2). However, most of this deficit (56%) could be compensated by protecting a forest area in another property within the Amazon biome, while 44% must be legally restored. Only 4% of the total forest surplus can be legally deforested, and the remaining 96% is already protected by law but can be used to compensate for areas under the deficit. We also found that, despite 57% (3017 km2) of the total APP being forested, only 26% (1356 km2) of the APP must be restored and 17% (881 km2) can remain deforested (consolidated areas). The 2012 law revision reduced the obligation to restore RL and APPs. This change could affect hydrological and ecological services. Compensation mechanisms could be used to protect forest within the Itacaiúnas watershed, rather than in the biome, to reduce further deforestation pressure.

1. Introduction

Forest restoration actions are necessary to improve water quality and regulate water quantity [1,2]. Deforestation reduces evapotranspiration and infiltration and, consequently, increases runoff [3,4,5] and reduces water flow into the atmosphere [6]. Forest maintenance reduces fire risk [7], in addition to fulfilling an important role in atmospheric humidity flow and precipitation patterns. For this reason, landscape characteristics, such as the distance to water bodies, elevation, and slope, which affect water and soil conservation, are usually used as indicators of the provision of hydrological services [8]. However, the results are not always consistent across regions and depend on the history of land use [9].
Native vegetation covers approximately 60% of Brazilian territory, 40% within some form of public protected area (e.g., conservation units and indigenous lands) and 60% in private or public areas [10,11]. Thus, conservation and restoration strategies need to include both public and private areas to ensure the maintenance of ecosystem services in forests, water cycles, water quality, climate regulation, carbon sequestration, and biodiversity conservation [12,13,14].
In Brazil, the conservation of public protected areas is governed by specific laws that depend on the type of land (e.g., conservation units and indigenous lands) [15]. The conservation of native vegetation in private areas is regulated by the Native Vegetation Protection Law (Law no. 12651, 25 May 2012), commonly known as the Brazilian Forest Code (CFB, in Portuguese). The rural property area dedicated to the conservation and sustainable use of natural resources is divided into two main categories: (i) legal reserves (RL), created to ensure the sustainable use of natural resources and biodiversity conservation, where economic activities such as selective logging are allowed but clear cutting is not; and (ii) permanent preservation areas (APPs, in Portuguese), created to protect particularly sensitive areas such as riparian vegetation, springs, slopes (>45°) and mangroves, where only low impact activities, such as ecotourism, are permitted.
The RL is exclusive to private rural properties, and its definition depends on the property location and the native vegetation type, ranging from 20 to 80% of the property area. There are specific rules for RL reduction for restoration purposes, depending on the property size, existence of ecological-economic zoning, protected areas of the municipality and when the deforestation occurred. The RL deficit (the shortfall of forest cover that is required to comply with the law) can be resolved through restoration (within the same property) or compensation (rent or purchase of a surplus forest area on another property within the same biome). Deforestation that occurred after 22 July 2008 must be compulsorily recovered within the same property. The native vegetation surplus (forested areas additional to the legal obligation) is divided into two types: a surplus that can be converted into alternative land use (only the vegetated area above 80% of a property of any size and location) and a surplus that can be used only for compensation of deforestation but that cannot be cleared (Law no. 12651, 25 May 2012).
The delimitation of APPs is independent of rural property boundaries, which may be located in both private and public areas. It includes APPs around perennial and intermittent rivers, lakes, dams, springs, trails, areas with slopes greater than 45°, with altitudes above 1800 m, hilltops, restinga vegetation, mangroves, and the edges of tablelands or plateaus. The cleared areas in APPs are divided into two categories: (i) areas that need to be recovered (hereinafter APPs to be restored), which are those deforested after 22 July 2008 and those requiring mandatory restoration around water bodies; and (ii) the consolidated APPs, which correspond to APPs deforested before 22 July 2008 and do not require restoration (Law no. 12651, 25 May 2012).
APP and RL restoration are aligned with international climate change policies, such as the Bonn Challenge (a goal of 150 million ha restored by 2020), Initiative 20×20 (20 million ha by 2020) and the Paris Agreement, in which Brazil pledged to restore 12 million ha by 2030 [16]. Additionally, national policies, such as the National Policy for the Recovery of Native Vegetation (Proveg—Law no. 8972, 23 January 2017) and the National Plan for the Recovery of Native Vegetation (Planaveg), regulate and strengthen the basis for achieving national goals [17].
Here, we present the first estimate of forest and deficit distribution considering both APPs (riparian and sloped areas) and RL, at fine scale, in a case study of the Itacaiúnas watershed (BHRI, in Portuguese), in the eastern Amazon. Given that the environmental functions of APPs include the preservation of water resources and soil protection and that deforestation of an entire upstream area impacts the water resources downstream [9], adopting the watershed as the territorial unit of study becomes essential.
The BHRI is an ideal area for this analysis because it is representative of the diverse land use and land cover in the Amazon, presenting one third of protected areas, activities such as mining, the presence of agrarian reform settlements, and half of its area deforested mainly due to cattle ranching [18]. We addressed four main questions in this study: (i) what is the forested area of APPs in the watershed? (ii) of the deforested APP, what portion needs to be restored and how much may remain deforested (consolidated area)? (iii) what proportion of RL deficit can be compensated or restored? (iv) what proportion of the RL surplus can be deforested or used for compensation? The results are discussed in terms of the implications for watershed management, CFB implementation and public policy.

2. Materials and Methods
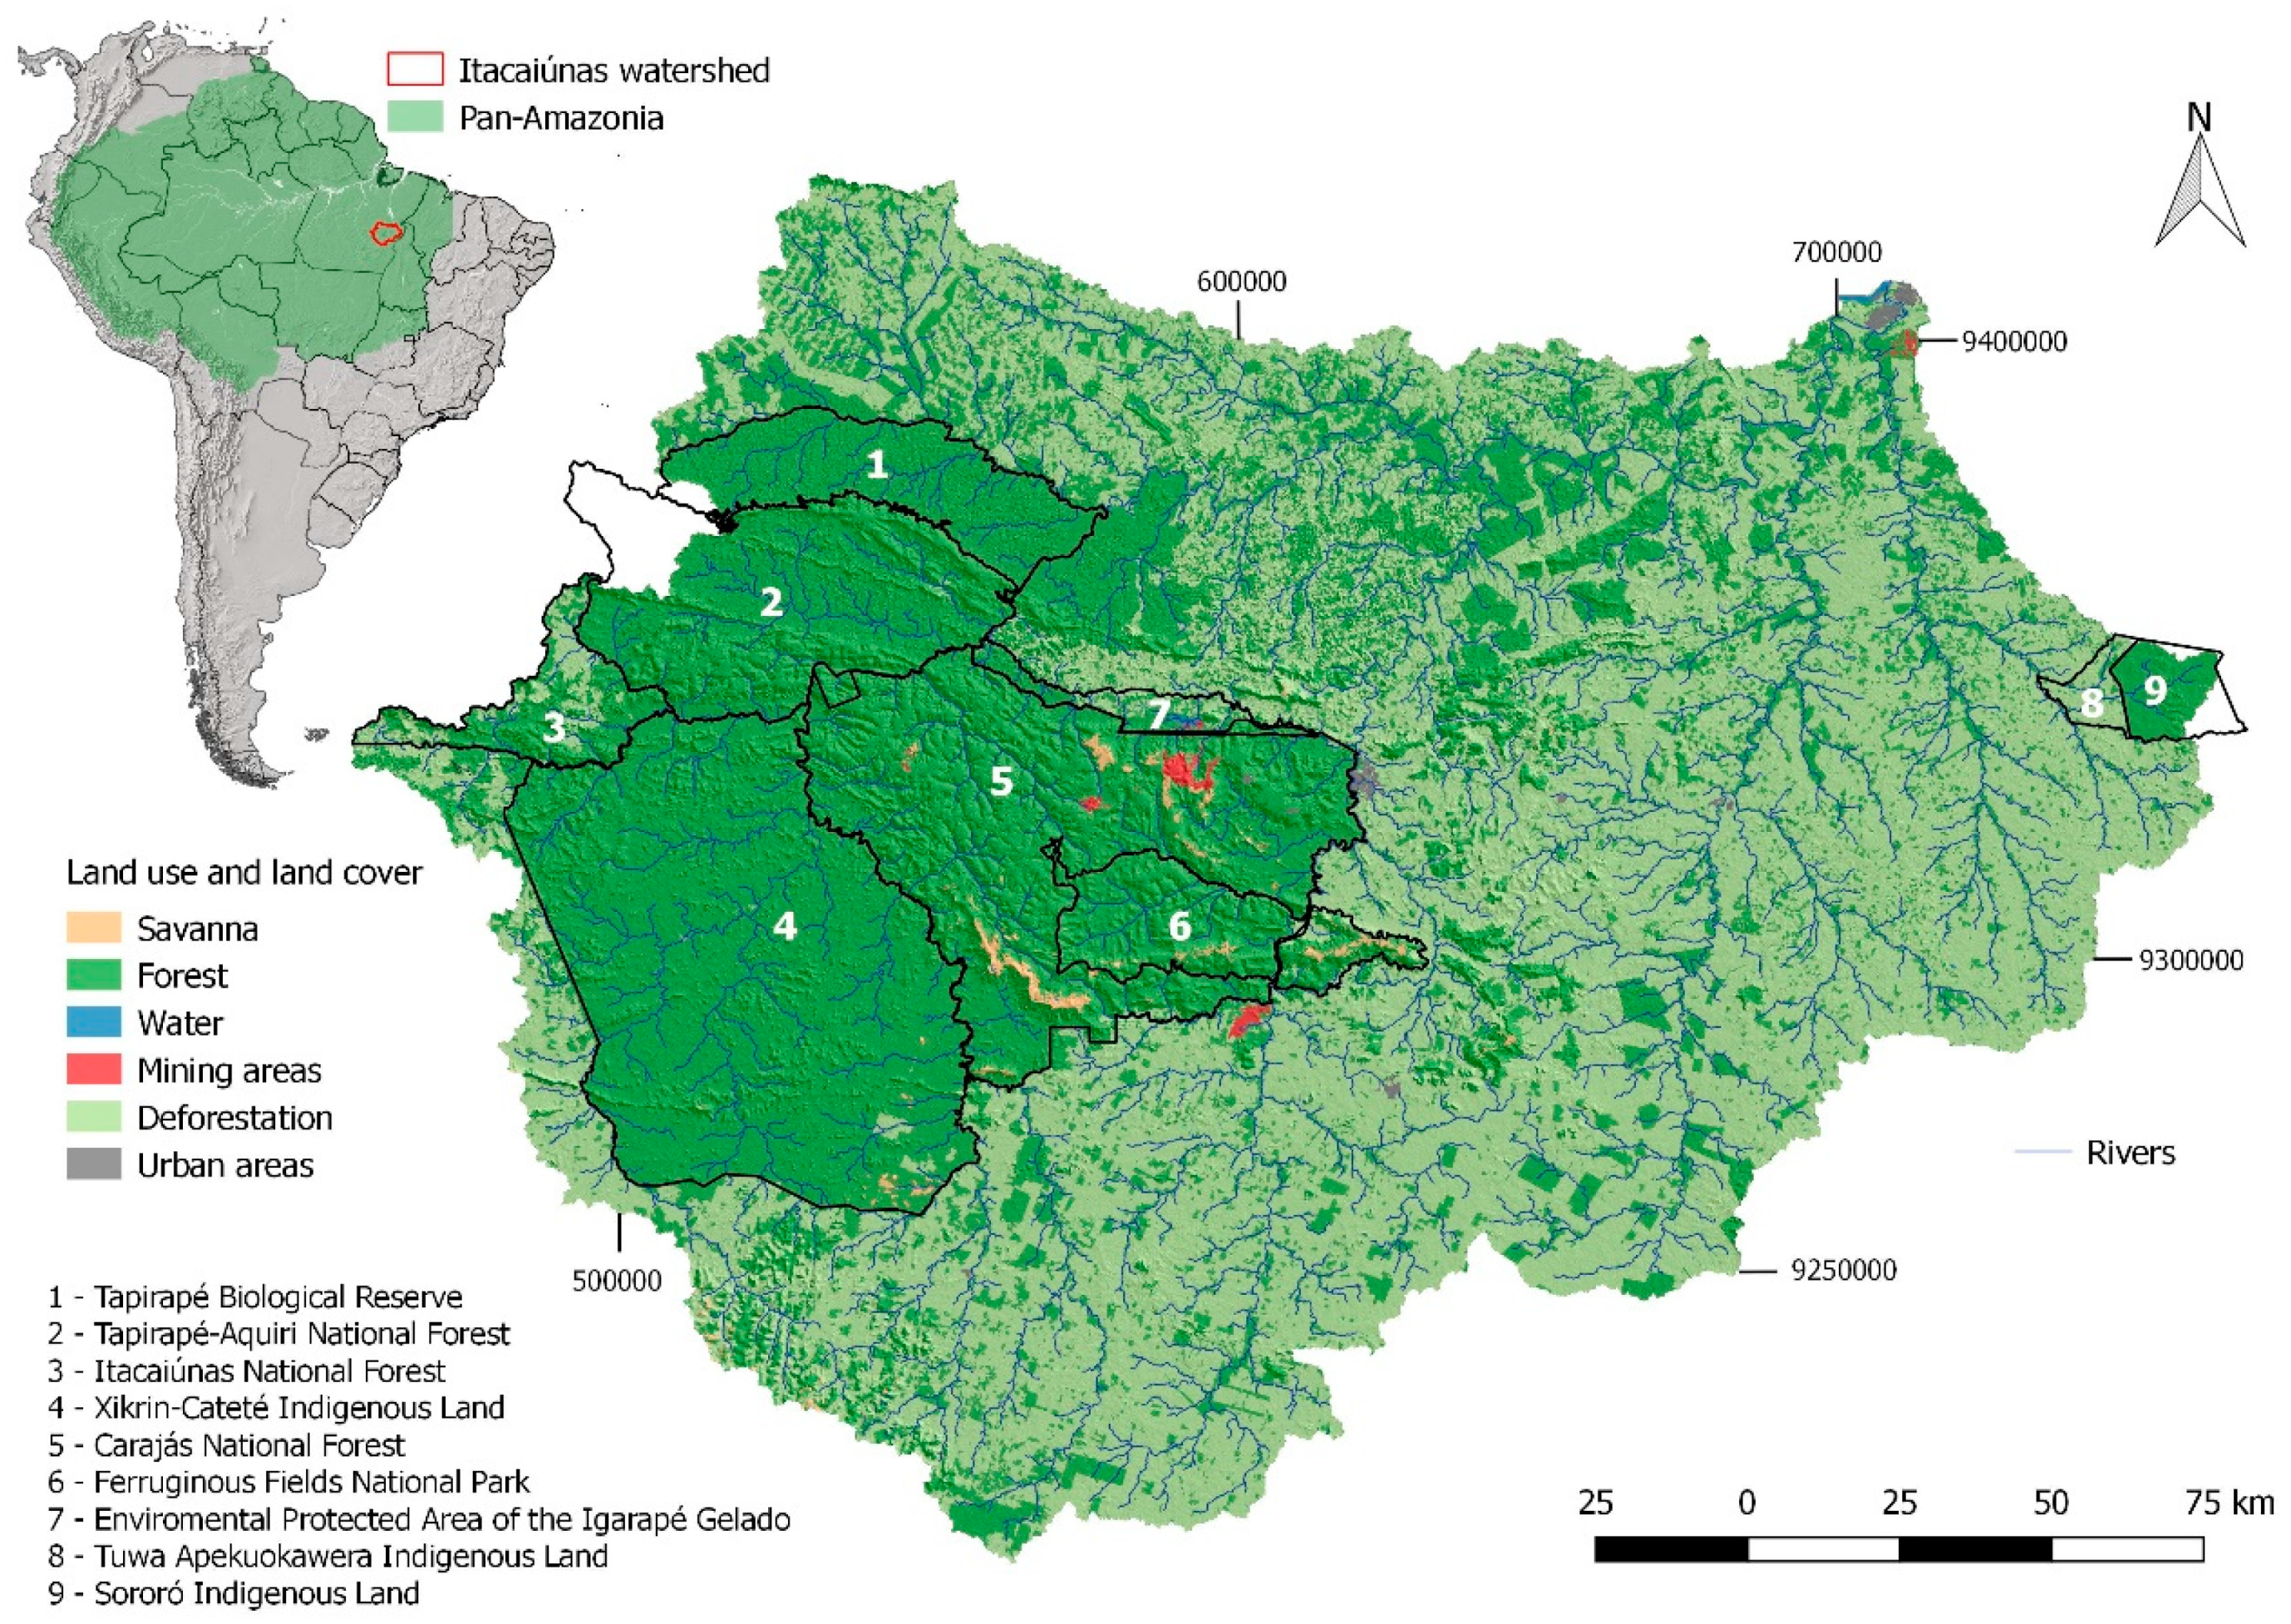
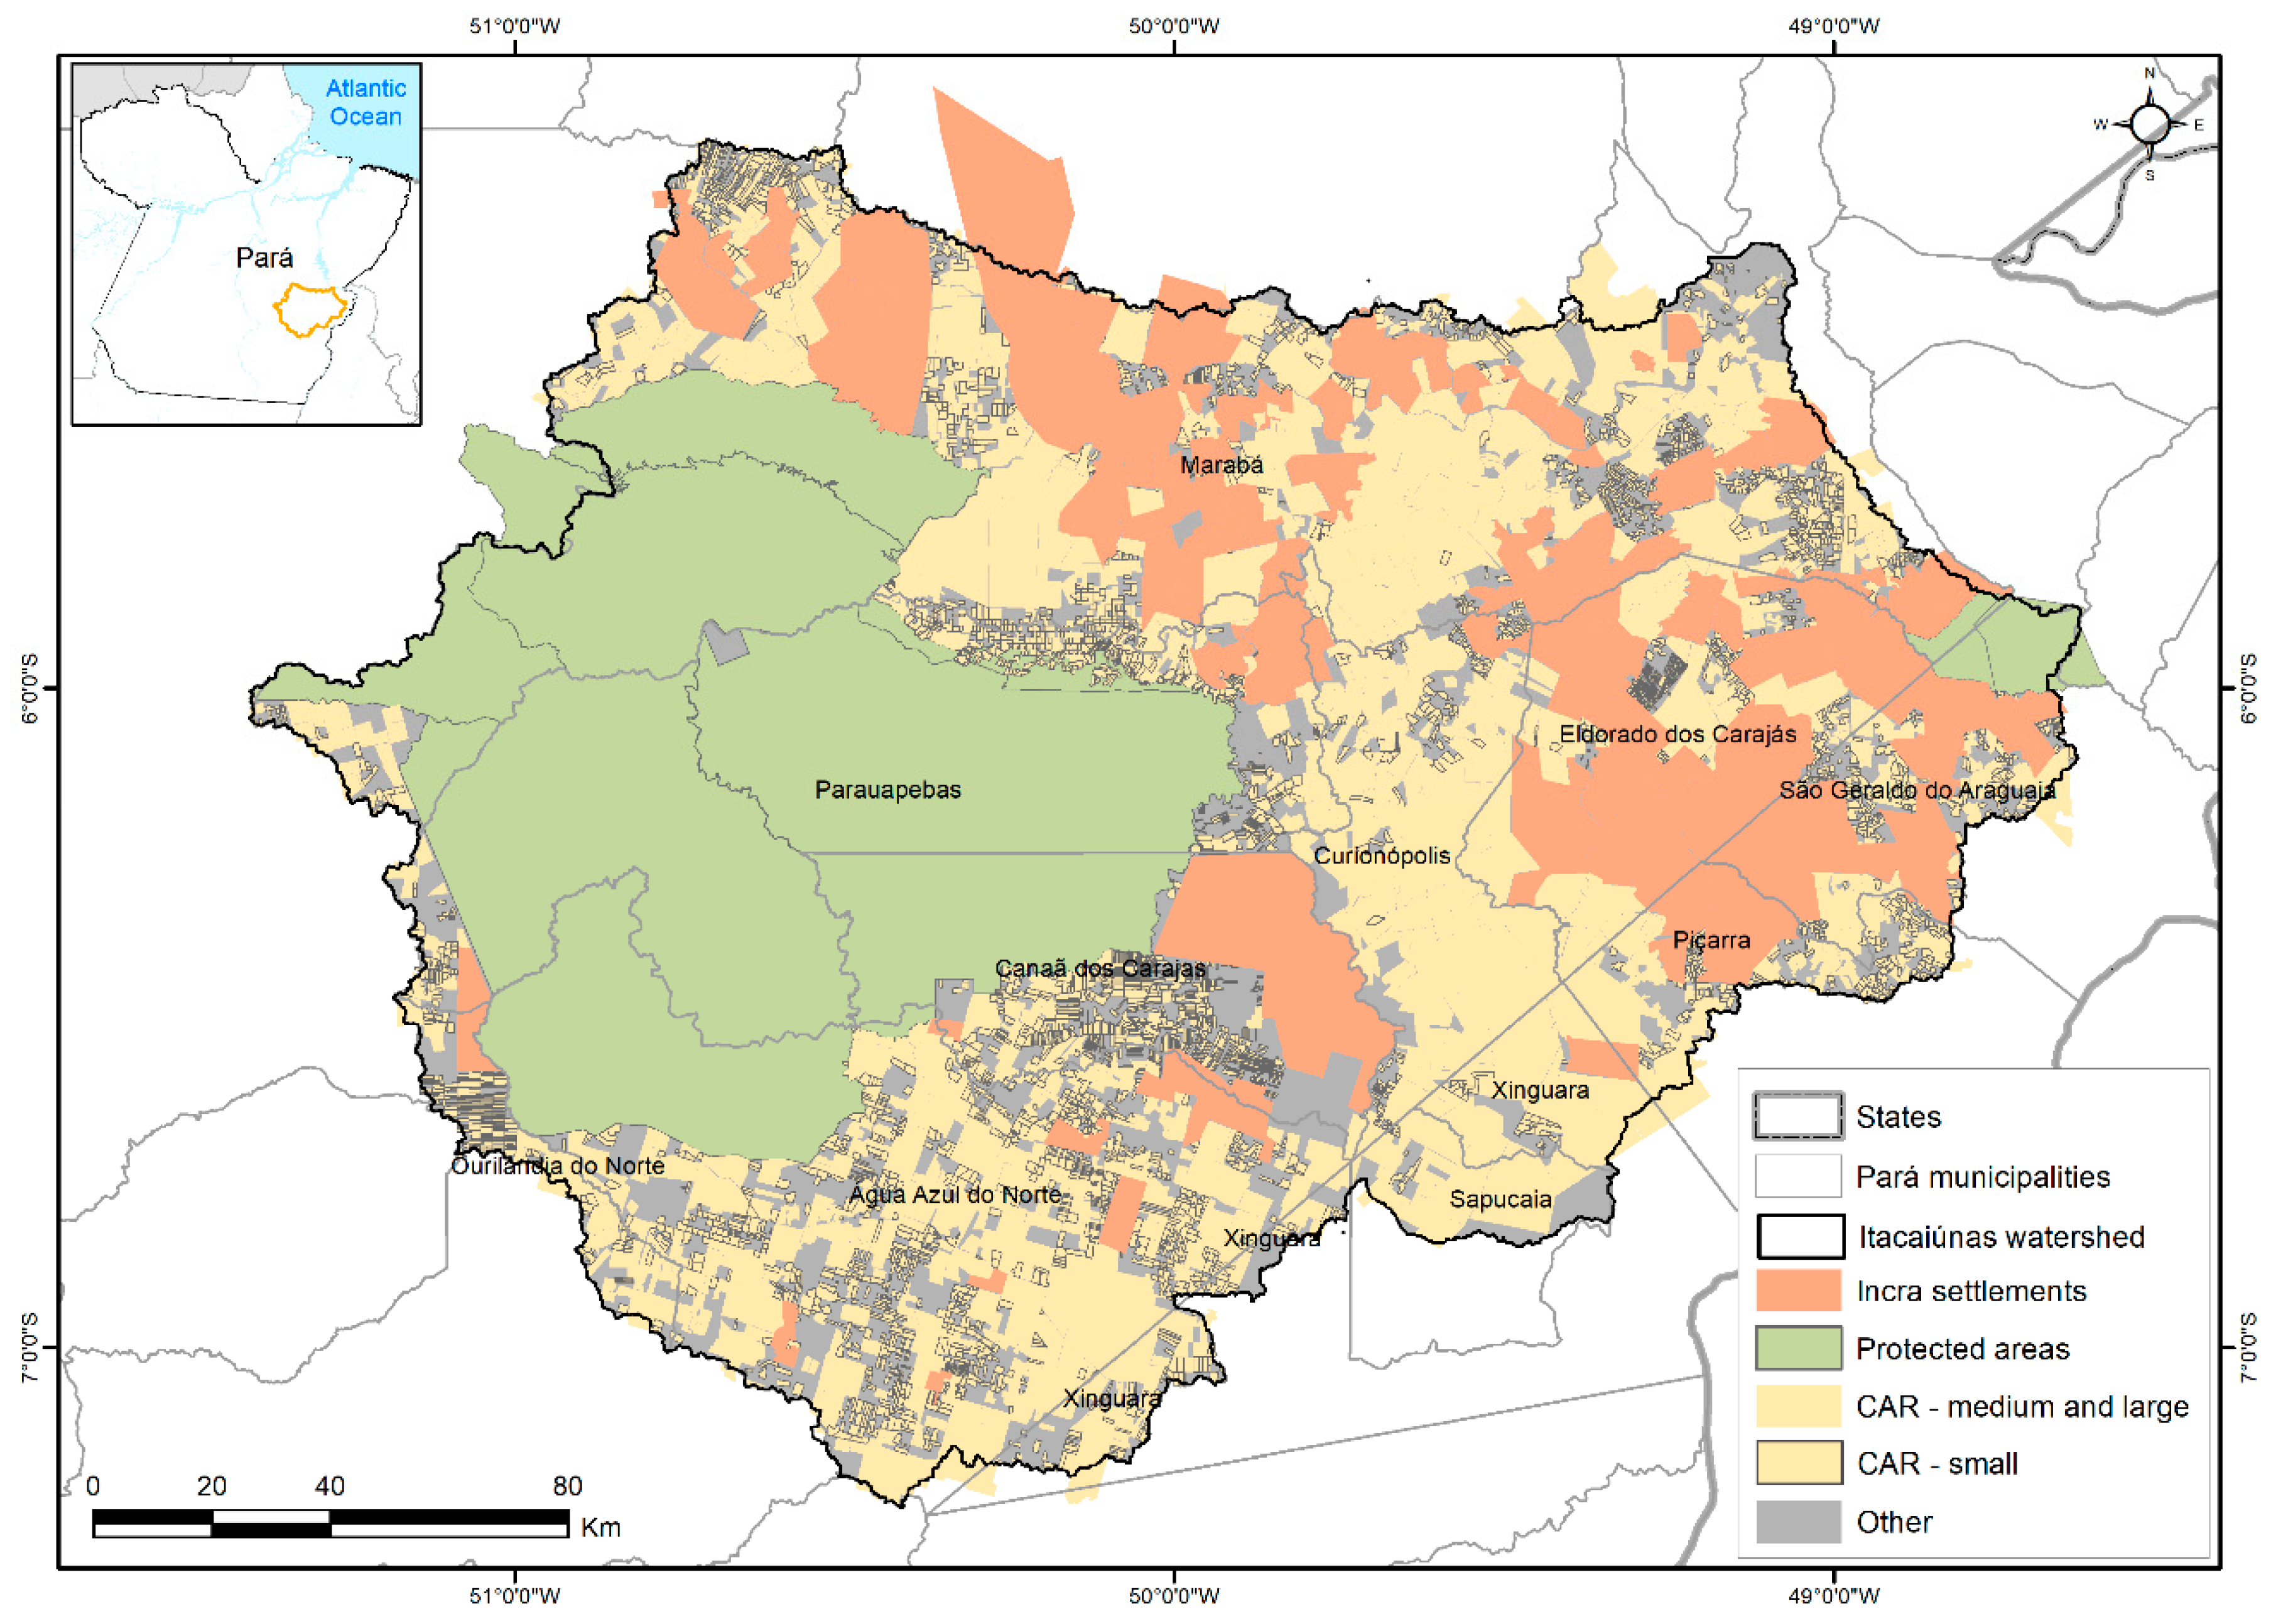
2.1. Study Area

The BHRI is located in the southeastern state of Pará, in the Brazilian Amazon, with an area of approximately 41,300 km2, equivalent to the size of Switzerland (Figure 1). The predominant vegetation in this region is tropical forest, with patches of ferruginous fields (savanna) in the highest areas. Much of the remnant vegetation in the watershed (~60%) is located within a mosaic of protected areas with an area of 12,000 km2, formed by indigenous land and conservation units (Figure 1). The mosaic of protected areas located to the west of the BHRI is monitored by the Brazilian Institute for Biodiversity Conservation (ICMBio).
The watershed is located in the Amazonian Deforestation Arc, and 50% of its area was deforested between 1970 and 2017, mainly due to cattle ranching activities in the region [18]. The main cause of forest conversion in this region is associated with constructing unofficial roads to establish agrarian reform settlements and pastures, which also facilitate selective logging in southeastern Amazonia [19,20]. In addition to cattle farming, the BHRI has mining activities of large economic importance, initiated in the mid-1970s as part of a Brazilian government strategy that planned and implemented large development projects such as mining, hydroelectric power plants and ports for mineral export [21]. Mining expanded mainly in the Carajás National Forest and surrounding areas in the early 1980s [18].
The BHRI has an average annual precipitation of 1792 mm/year, with strong seasonality, and an average annual flow of 476 mm/year [22]. The removal of water to meet the population demand corresponds to only 0.4% of the average watershed discharge [23]. Since the 1970s, the region has had a largely reduced forest cover and a tendency towards increased temperature and reduced relative air humidity [24]. Due to land use changes, a significant increase in mean, maximum and minimum flows was observed in the same period [22]. This impact would be greater if forests were not maintained in protected areas [25].
The BHRI is comprised of 39% (16,090 km2) rural properties registered in the Environmental Rural Property Registry (Cadastro Ambiental Rural—CAR) as of 2017, with 21% considered small properties (≤4 fiscal modules—FM, according to Federal Law no. 8629, 25 February 1993), 24% medium properties (>4 to15 FM) and 55% large rural properties (>15 FM) (Figure 2). The protected areas (conservation units and indigenous lands) occupy 29% (12,012 km2) of the watershed, and the agrarian reform settlements (sets of small rural properties created by the National Institute for Colonization and Agrarian Reform—Incra for low-income families) occupy 19% (7985 km2). The remaining 13% (5255 km2) corresponds to other types of occupation (urban areas, private properties not registered in the CAR or public lands with no clear designation). Importantly, the form of land occupation (e.g., different rural property sizes) directly influences the determination of RL and APP protection and restoration rules.

2.2. Datasets

To estimate the required forest restoration areas in the BHRI, we used a secondary geographic database (agrarian reform settlements from Incra), protected areas from ICMBio, CAR from the Pará State Secretariat of Environment and Sustainability—SEMAS, and primary sediment yields produced by the Instituto Tecnológico Vale (ITV) (classification of land cover, water bodies, and rivers based on satellite images and a digital elevation model—DEM) (Table 1).
An analytical framework was applied to characterize the distribution of APPs and RL across the BHRI, as summarized in Figure 3 and described in detail in the following sections.

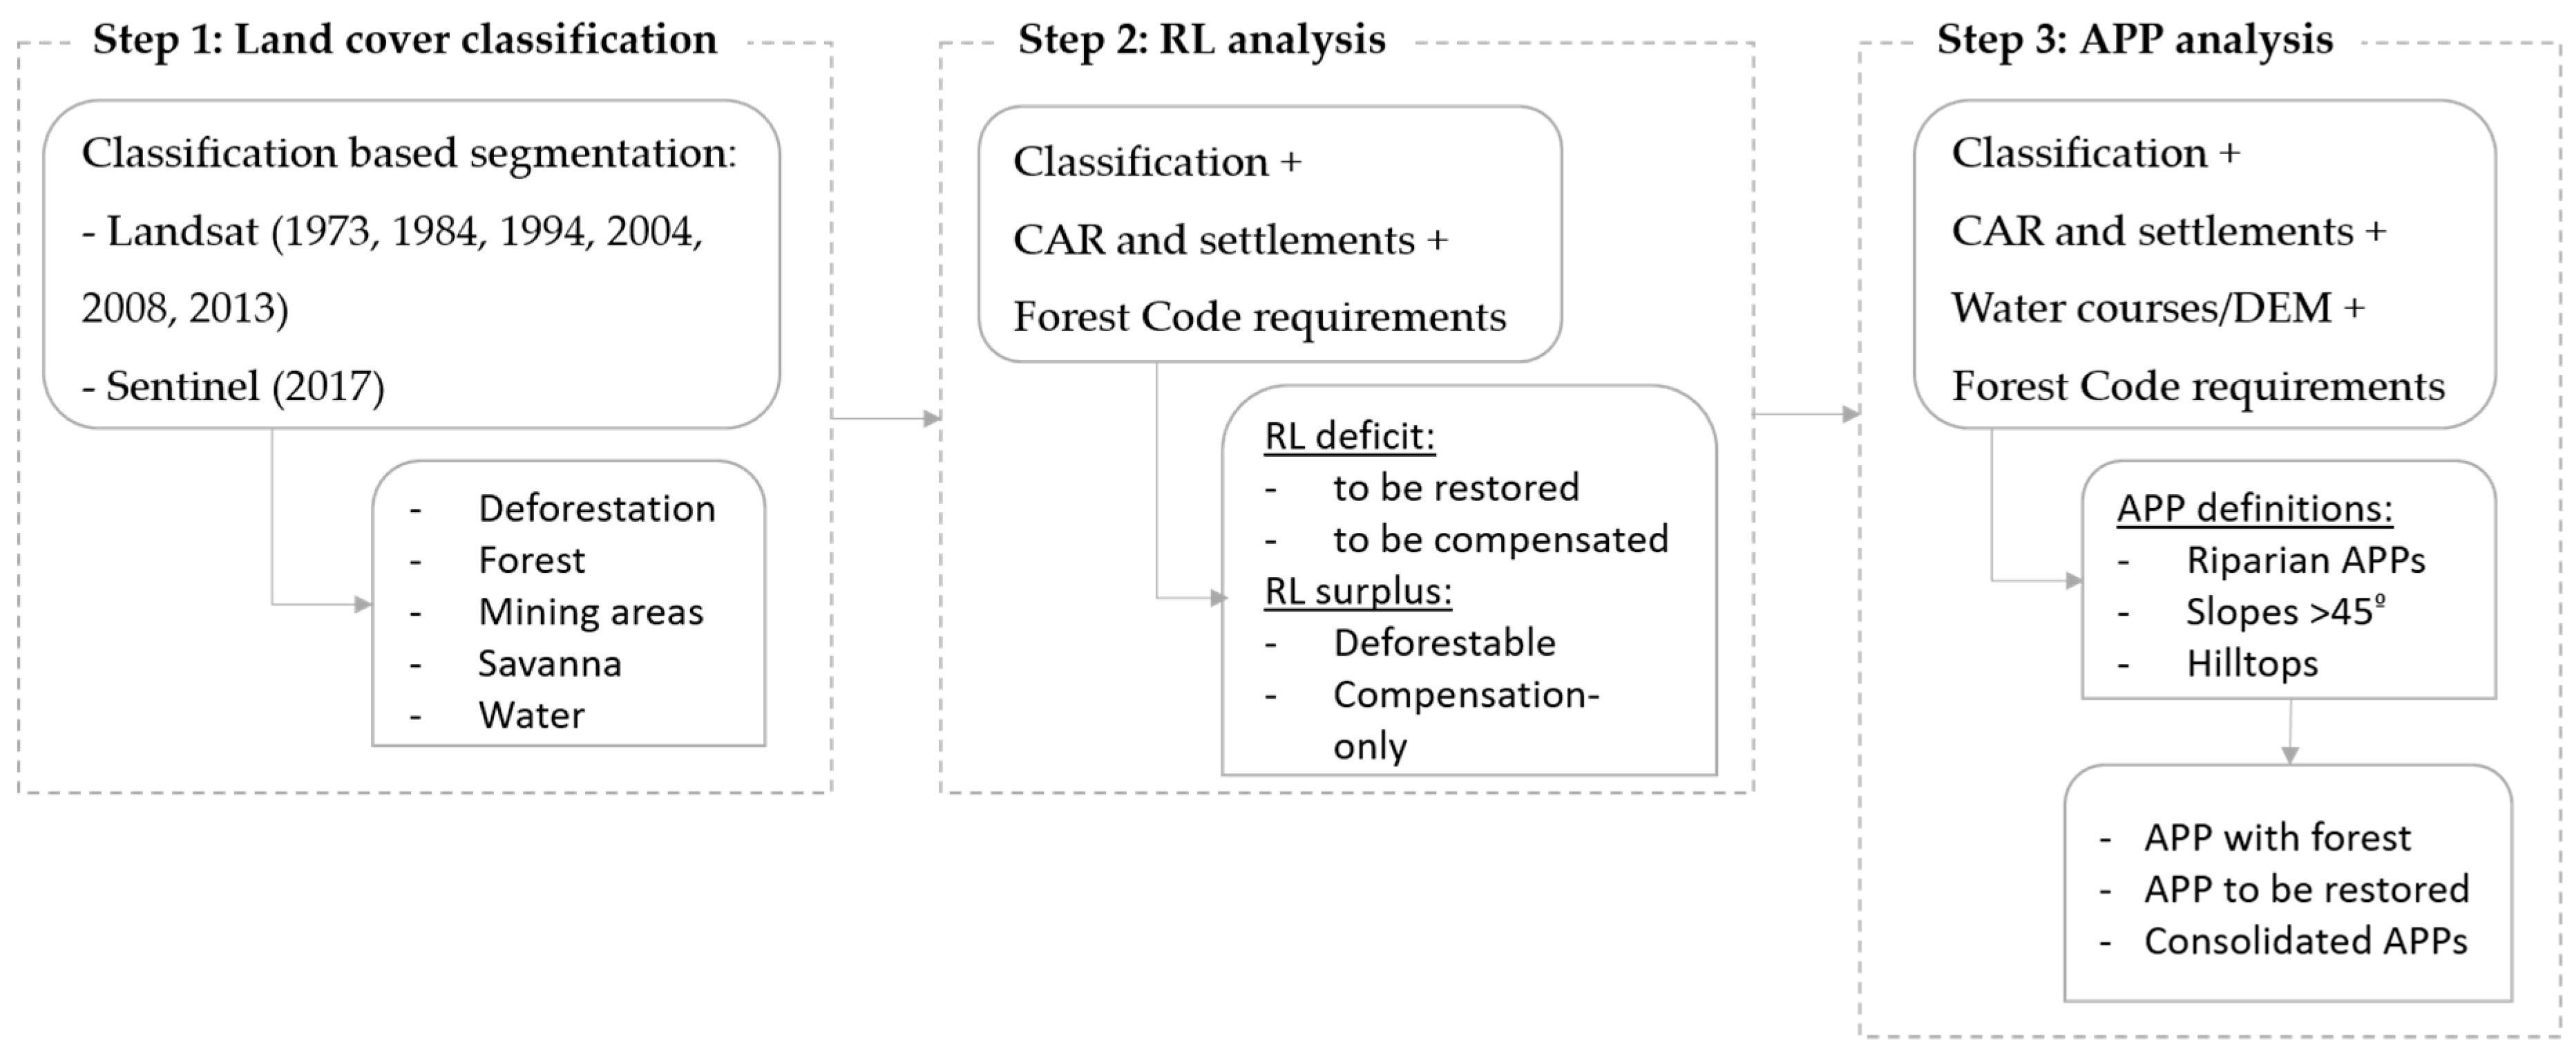
2.3. Land Cover Classification

The mapping of the watershed land cover was performed based on the geographic object-based analysis approach (GEOBIA) for the classification of multi-temporal data [24,26]. The classification approach based on GEOBIA allows an increased perception of the elements of an image through an analysis that exceeds the digital pixel value. Thus, the pixels are grouped (segments) forming geographic objects, i.e., segments can be analyzed together through the relations of brightness, shape, neighborhood, and distance, allowing more accurate representation of real-world elements. Both the classification methodology and digital image processing are described in detail in the works of Souza-Filho et al., 2016, 2018 [18,24]. The land cover classes used in this study were deforestation, forest, mining, ferruginous fields (savanna) and water.
We estimated the amount of deforestation after 2008 (legal CFB framework) based on the years 2008, 2013, and 2017; primary forest cover and vegetation regeneration using the years 1973, 1984, 1994, 2004, 2008, 2013, and 2017; and the current land cover based on the 2017 image. Primary forest was determined by the absence of deforestation throughout the entire historical series. Regeneration was determined by vegetation cleared in the time series but was detected as forest in the current land cover (2017).

2.4. Legal Reserve Analysis

The main goal of this analysis was to estimate the RL deficit of rural properties, the surplus that can be used to compensate for illegal deforestation, and the surplus that can still be deforested in the BHRI according to the national legislation. We analyzed 5036 properties registered in the CAR and 119 Incra agrarian reform settlements, totaling 5155 properties registered in the BHRI. The regulations applied to the settlements were the same as those for small rural properties. As the RL is estimated based on rural property boundaries, the protected areas were excluded from this analysis, with the exception of environmental protection areas (APA), which allow rural properties. The following steps were performed:
(i)
reduction of the overlap between rural properties to avoid double counting;
(ii)
definition of the RL percentage for each property, according to the CFB (Law no. 12651, 25 May 2012). In the BHRI, the RL corresponds to 80% of the property area, as this land is located in a forest area of the Brazilian Amazon. However, for restoration purposes, the RL can be reduced down to 50% in the watershed municipalities due to the percentage of conservation units and the existence of ecological-economic zoning. In small holdings, the RL corresponds to the native vegetation area on 22 July 2008;
(iii)
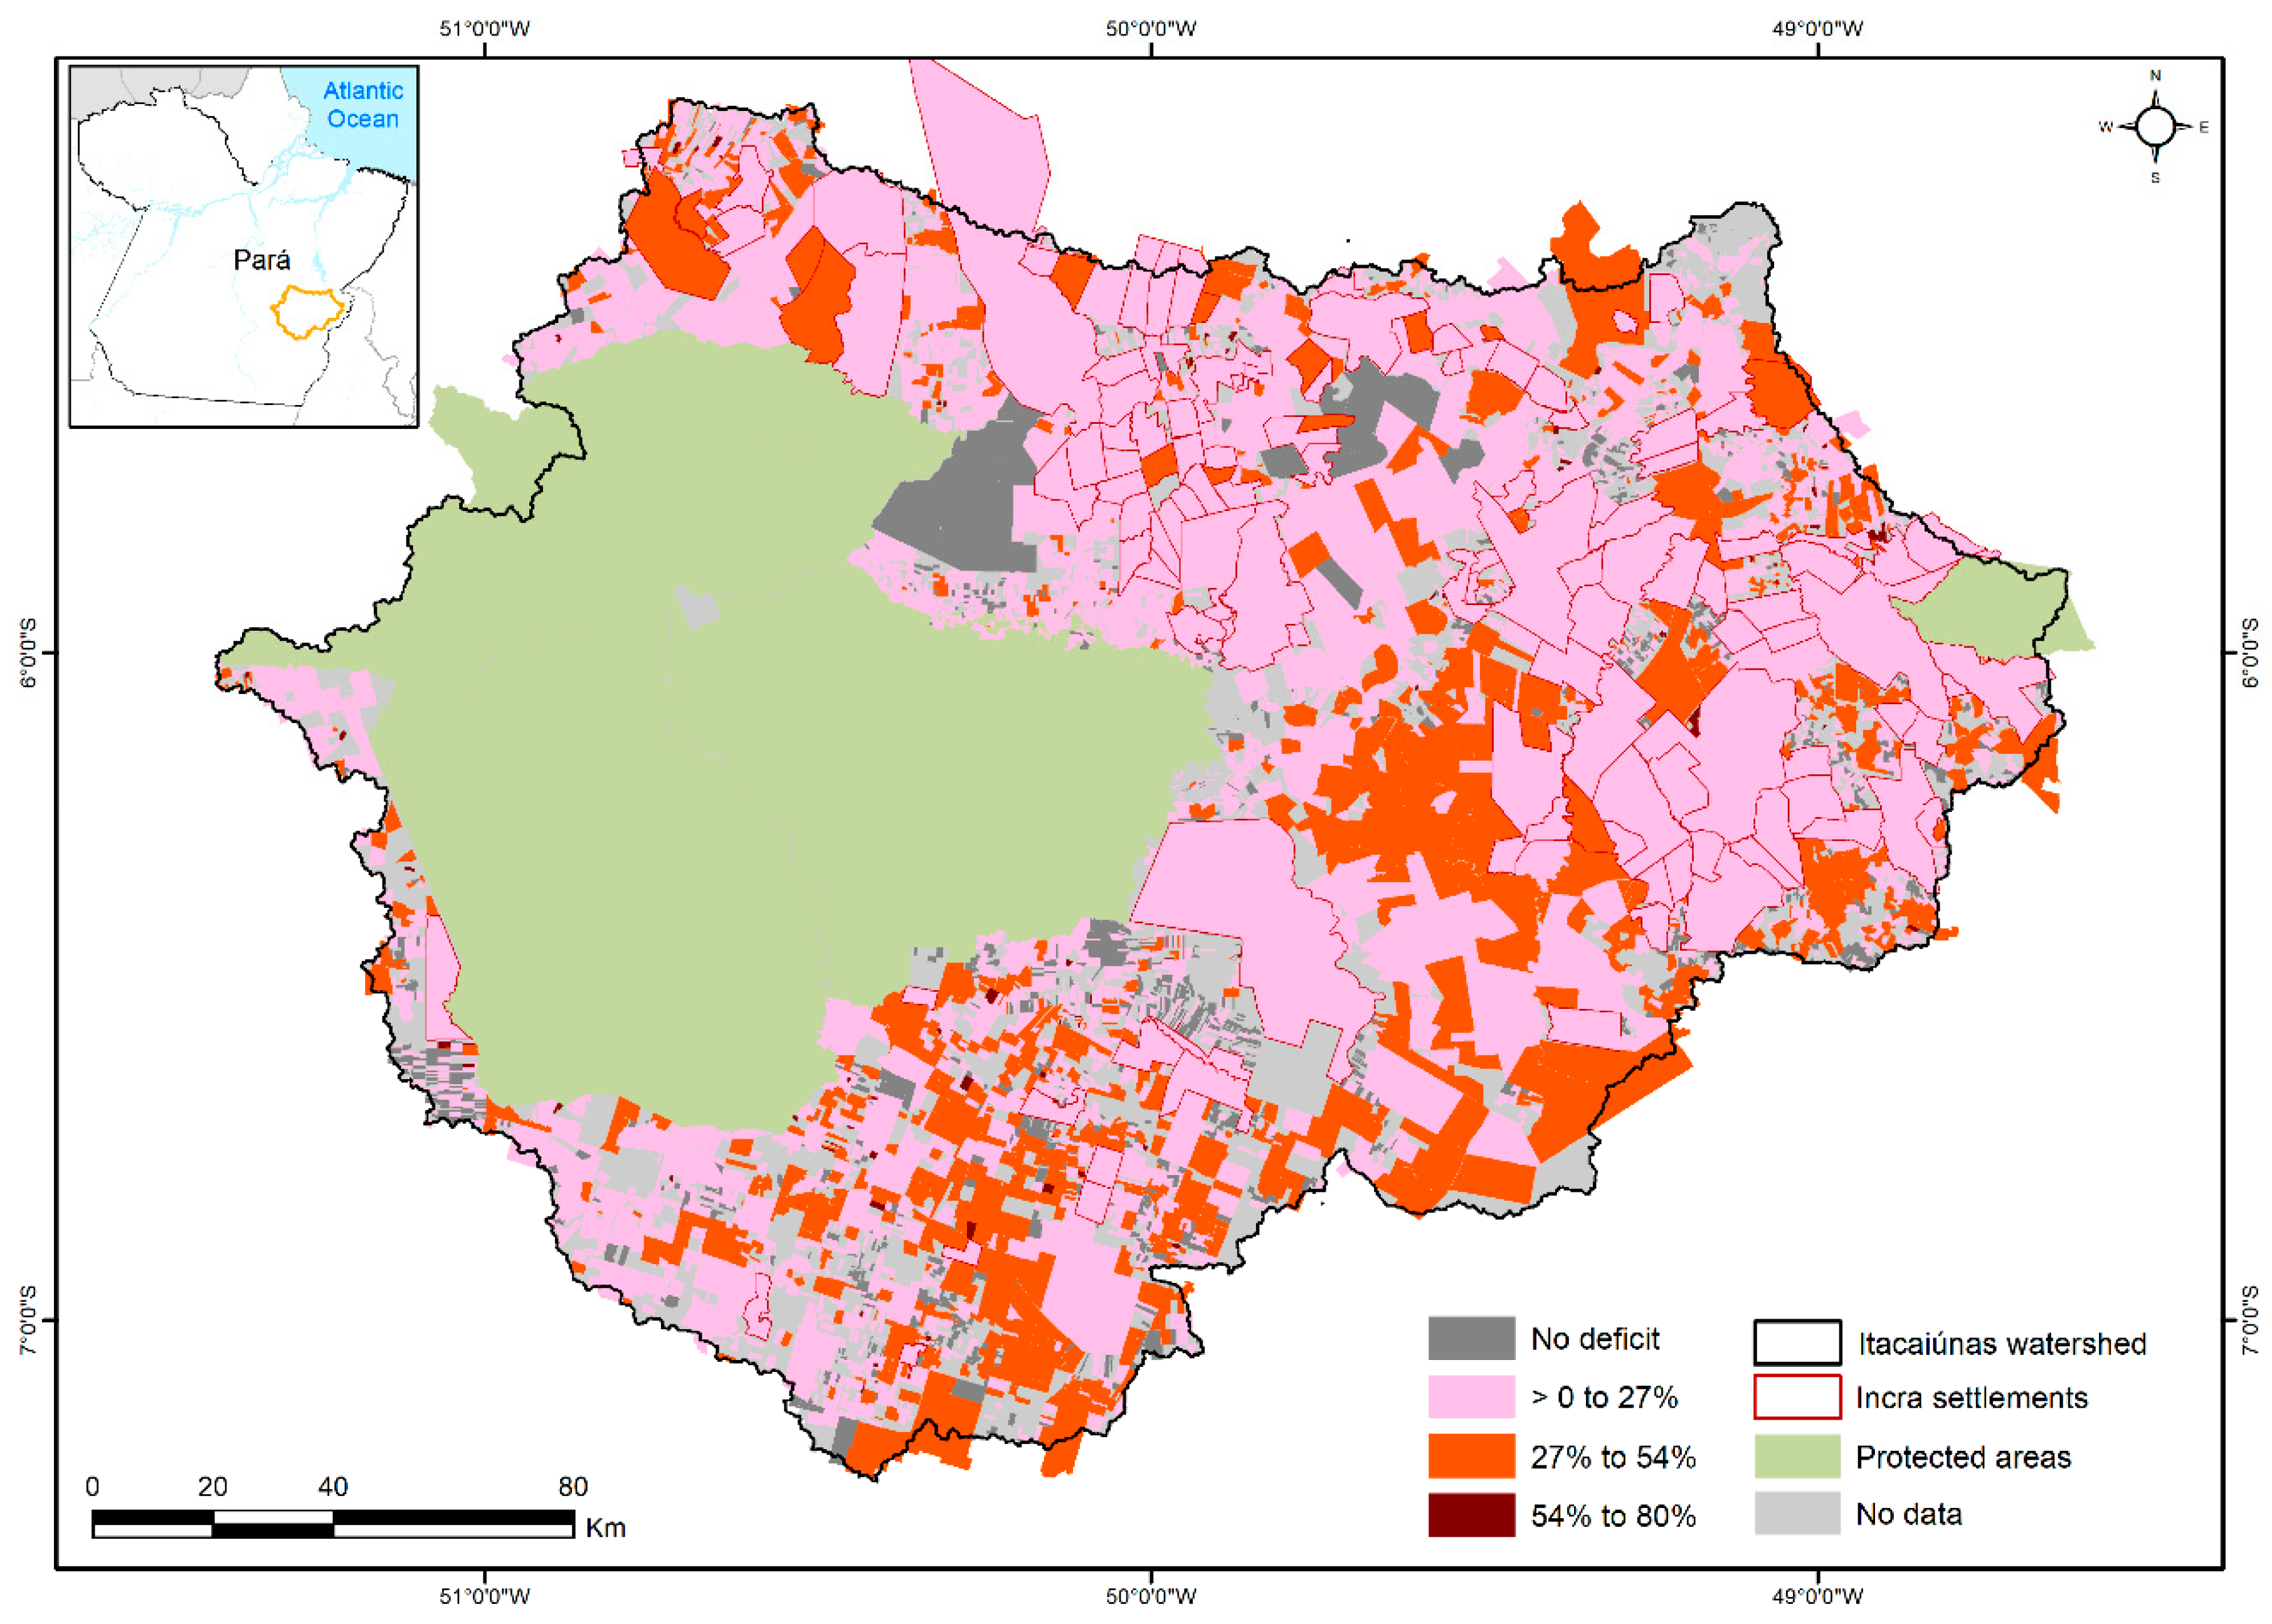
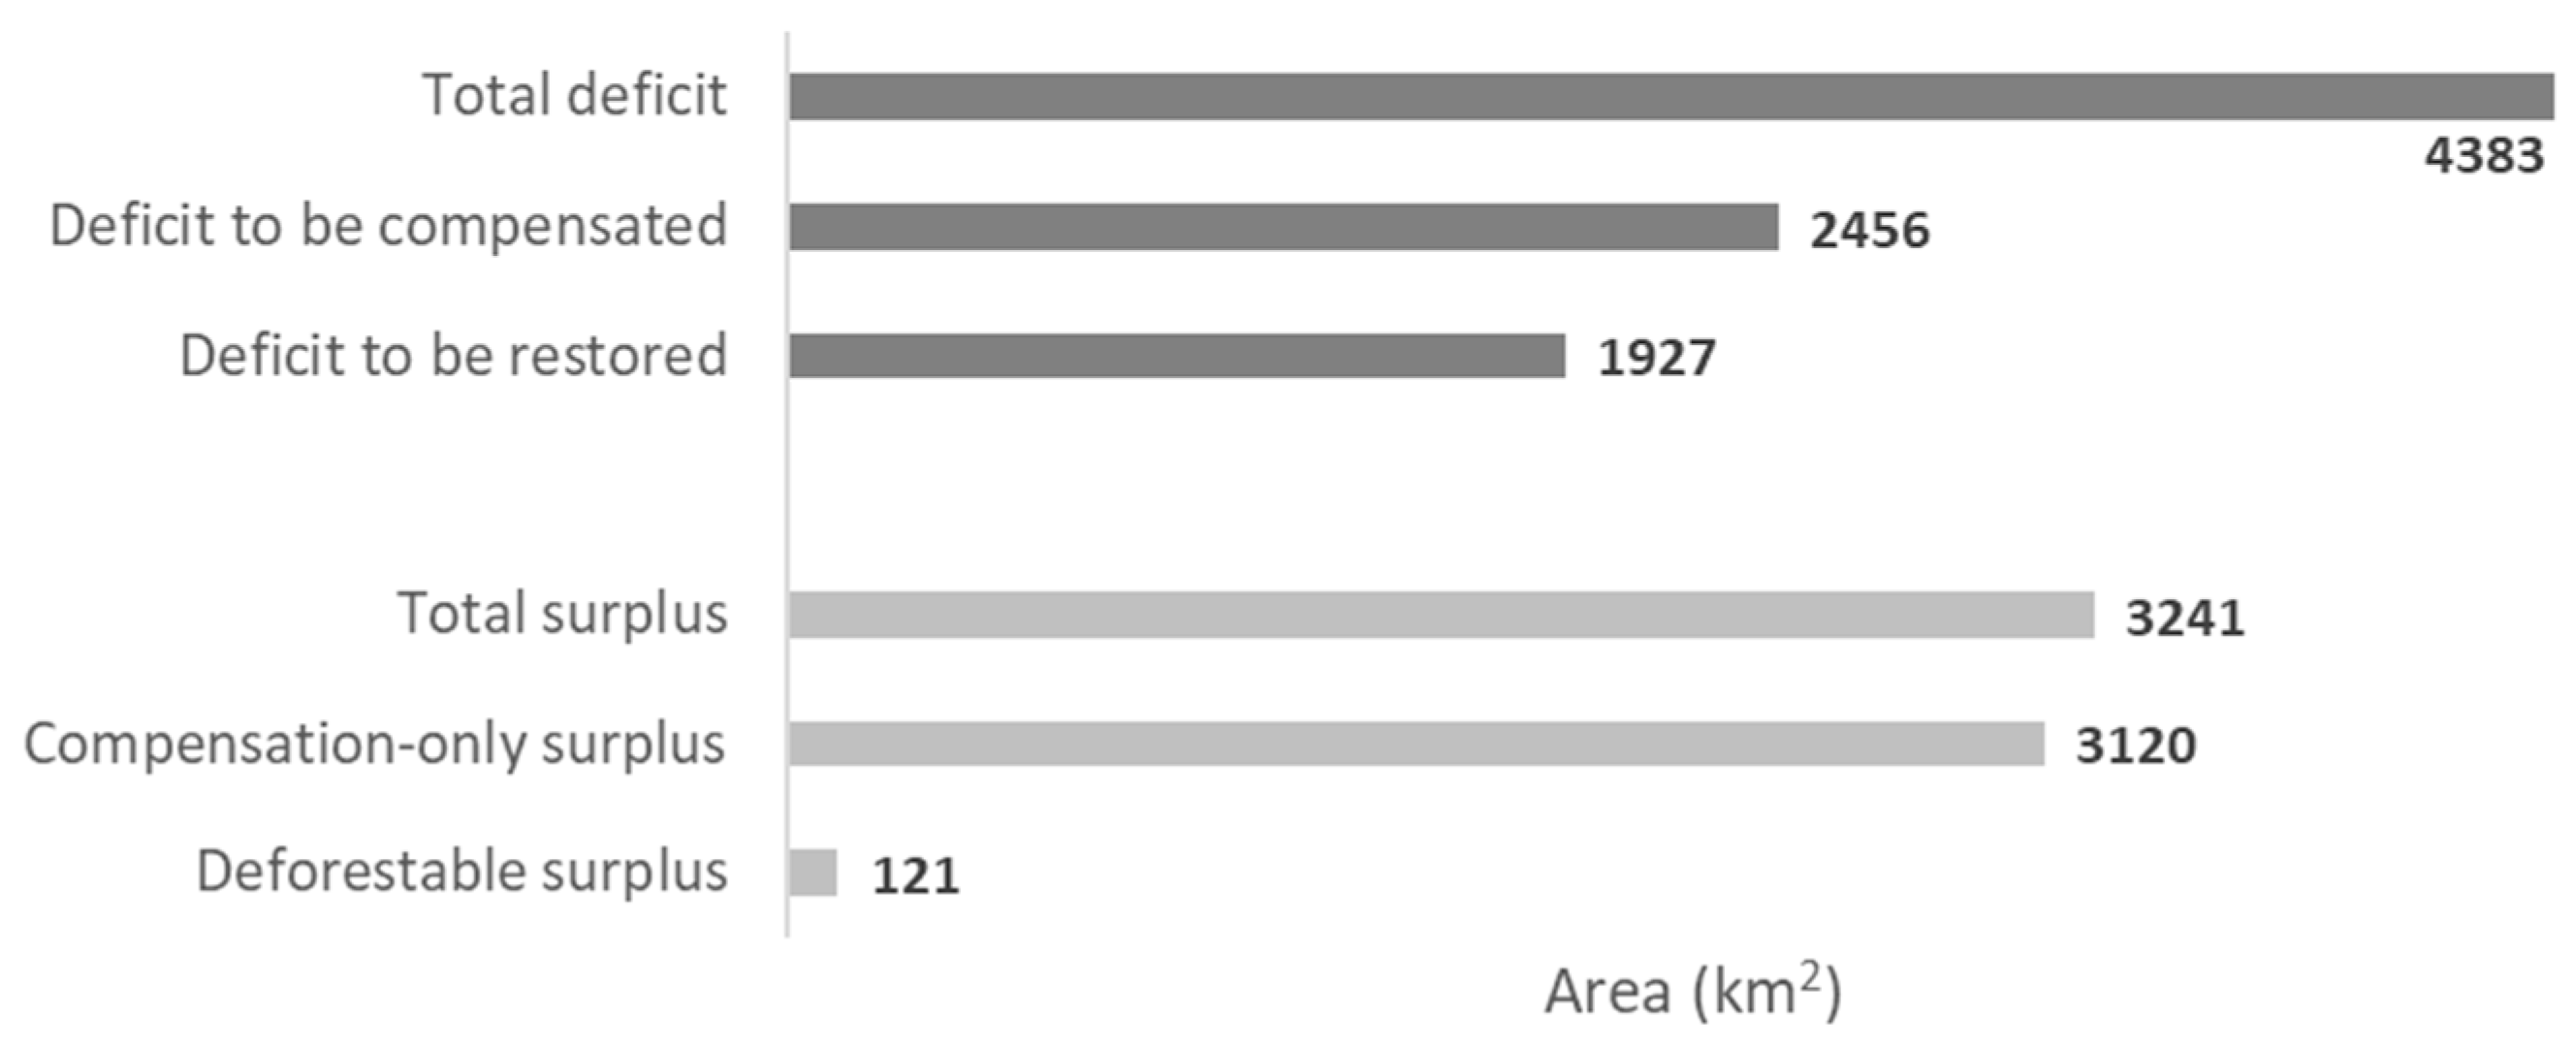
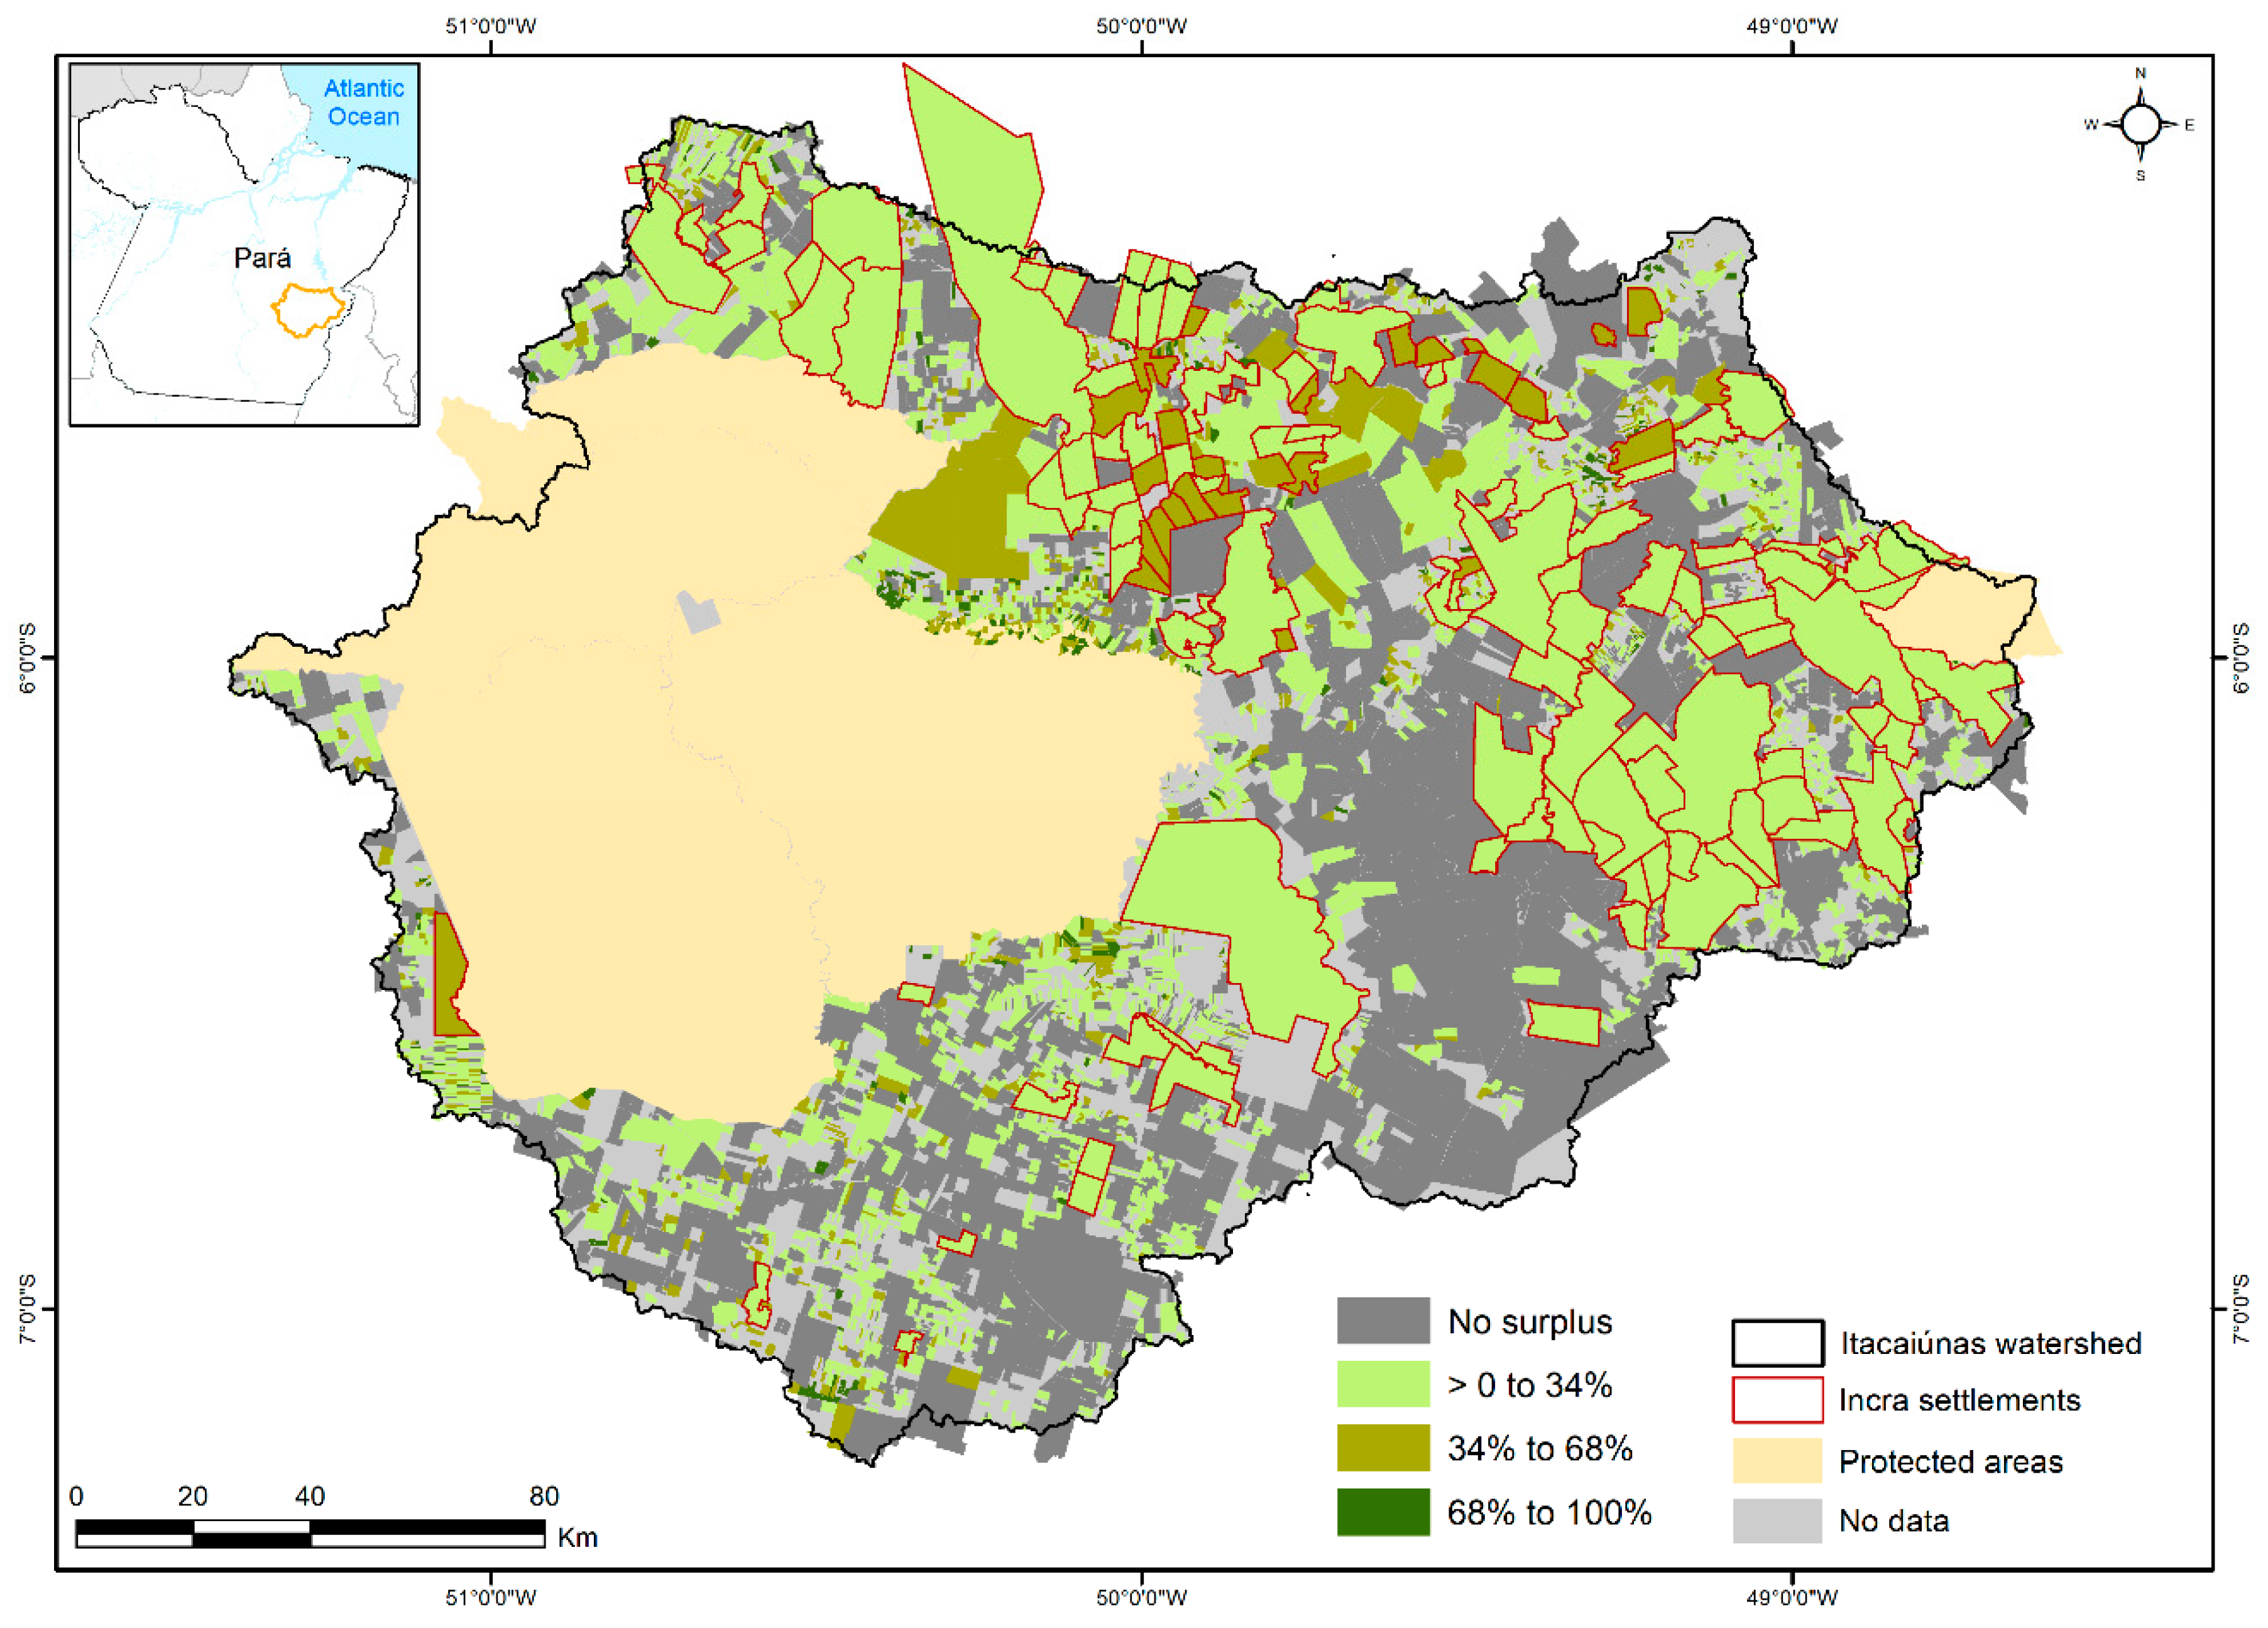
deficit estimation (areas that need to be restored or compensated), the surplus for compensation (areas that can be used to compensate for illegal deforestation but cannot be deforested), and the deforestable surplus (forest areas covering over 80% of the property, which can be deforested) of the properties based on the land cover history and property size, according to the legislation.
As allowed by the CFB, APPs that have native vegetation cover or are in the process of regeneration were accounted for in RL determination. This allowance is possible as long as it does not involve deforesting new areas for properties with less than 80% native vegetation (conserved or recovering) and does not change the use of the APP. Part of the methodology for RL analysis was based on studies of compensating for past deforestation [27].

2.5. Permanent Preservation Areas Analysis

2.5.1. APP Definitions

APPs were mapped throughout the watershed (protected and private areas). Riparian APPs were mapped (springs surrounding, rivers, lakes, and dams), along with APPs with slopes greater than 45° and hilltops. The other APP types required in the CFB are not present in the study area.
Riparian APPs:
The linear drainage network (rivers up to 10 m in width) was automatically extracted from the hydrologically corrected Digital Elevation Model (DEM) ALOS PALSAR. The depression removal method was a modified heuristic search [28] using IPH-Hydro Tools software (https://www.ufrgs.br/hge/modelos-e-others-produtos/iph-hydro-tools/) with a minimum drainage area of approximately 1.5 hectares for the beginning of the drainage network. The drainage network obtained with this method was better suited to the Sentinel-2A images than the other methods tested (heuristic search and priority-first search). Correction of the line vector file was performed manually with visual analysis using the Sentinel-2A image mosaic from 2017, especially within forest fragments and for adjusting the beginning of the drainage network to the visualization of the drainage channel. Larger water bodies (rivers, lakes, and dams over 10 m wide) were extracted from the classification of Sentinel-2A images from 2017 and all mapped as polygons.
Subsequently, the APPs were mapped around the rivers, lakes, dams and springs, according to the environmental legislation (Table 2). Due to limitations in the mapping scale, we assumed the following:
(i)
all rivers mapped as “lines” were less than 10 m wide, as it was not possible to measure the width of these rivers due to mapping resolution;
(ii)
the rivers mapped as polygons were divided into orders according to river width classes to define the width of the APPs from the river edges;
(iii)
as it was not possible to automatically distinguish natural lakes from dams, all water bodies were treated as dams because the latter represented the vast majority of identified features (> 95%). In these cases, the APP defined for water bodies above 1 ha was 15 m, according to previous legislation by the National Environment Council (CONAMA Resolution 302, 2002), since the CFB does not establish an APP width for dams. In areas with water bodies smaller than 1 ha, there is no APP, according to the CFB;
(iv)
in protected areas and other large fragments of dense forest, where it was not possible to visualize the drainage network in the Sentinel-2A image, the drainage network was maintained, including the springs, generated automatically as previously described.
Slopes > 45° and Hilltops:
Slope areas greater than 45° were calculated from the hydraulically corrected DEM. To determine the hilltop APPs, we initially determined the maximum altitude, base altitude (closest saddle point elevation), height (maximum altitude minus base altitude), and slope of all elevations. As defined in the CFB, these APPs were defined as areas delimited by the level curve corresponding to 2/3 of the minimum height only for hilltops with a minimum height of 100 m and mean inclination greater than 25°.

2.5.2. Defining APP Deficits

According to Brazilian environmental legislation, the riparian APP width that needs to be restored depends on the property size, when the deforestation occurred and the type and size of the watercourse. Thus, we defined four main types of APPs: (i) total APP (sum of the entire APP area); (ii) APPs with native vegetation (do not need to be recovered and only low impact activities (e.g., ecotourism) are allowed); (iii) consolidated APPs (APPs deforested before 22 July 2008, which do not need to be recovered), where the continuity of agroforestry activities is permitted; and (iv) APPs to be restored, which includes all APPs deforested after 22 July 2008 and marginal strips surrounding water bodies with the width dependent on the water body type and property size (Table 3).
For APPs with slopes greater than 45° and for hilltops, the legislation does not establish an obligation to restore areas deforested before 22 July 2008, only those deforested after this date.
As the definition of riparian APPs to be restored depends on the property size, in areas without rural properties, we assumed the APP requires restoration of properties from 4 to 10 FM. This determination occurred because the basin is dominated by medium and large properties (79%).

3. Results

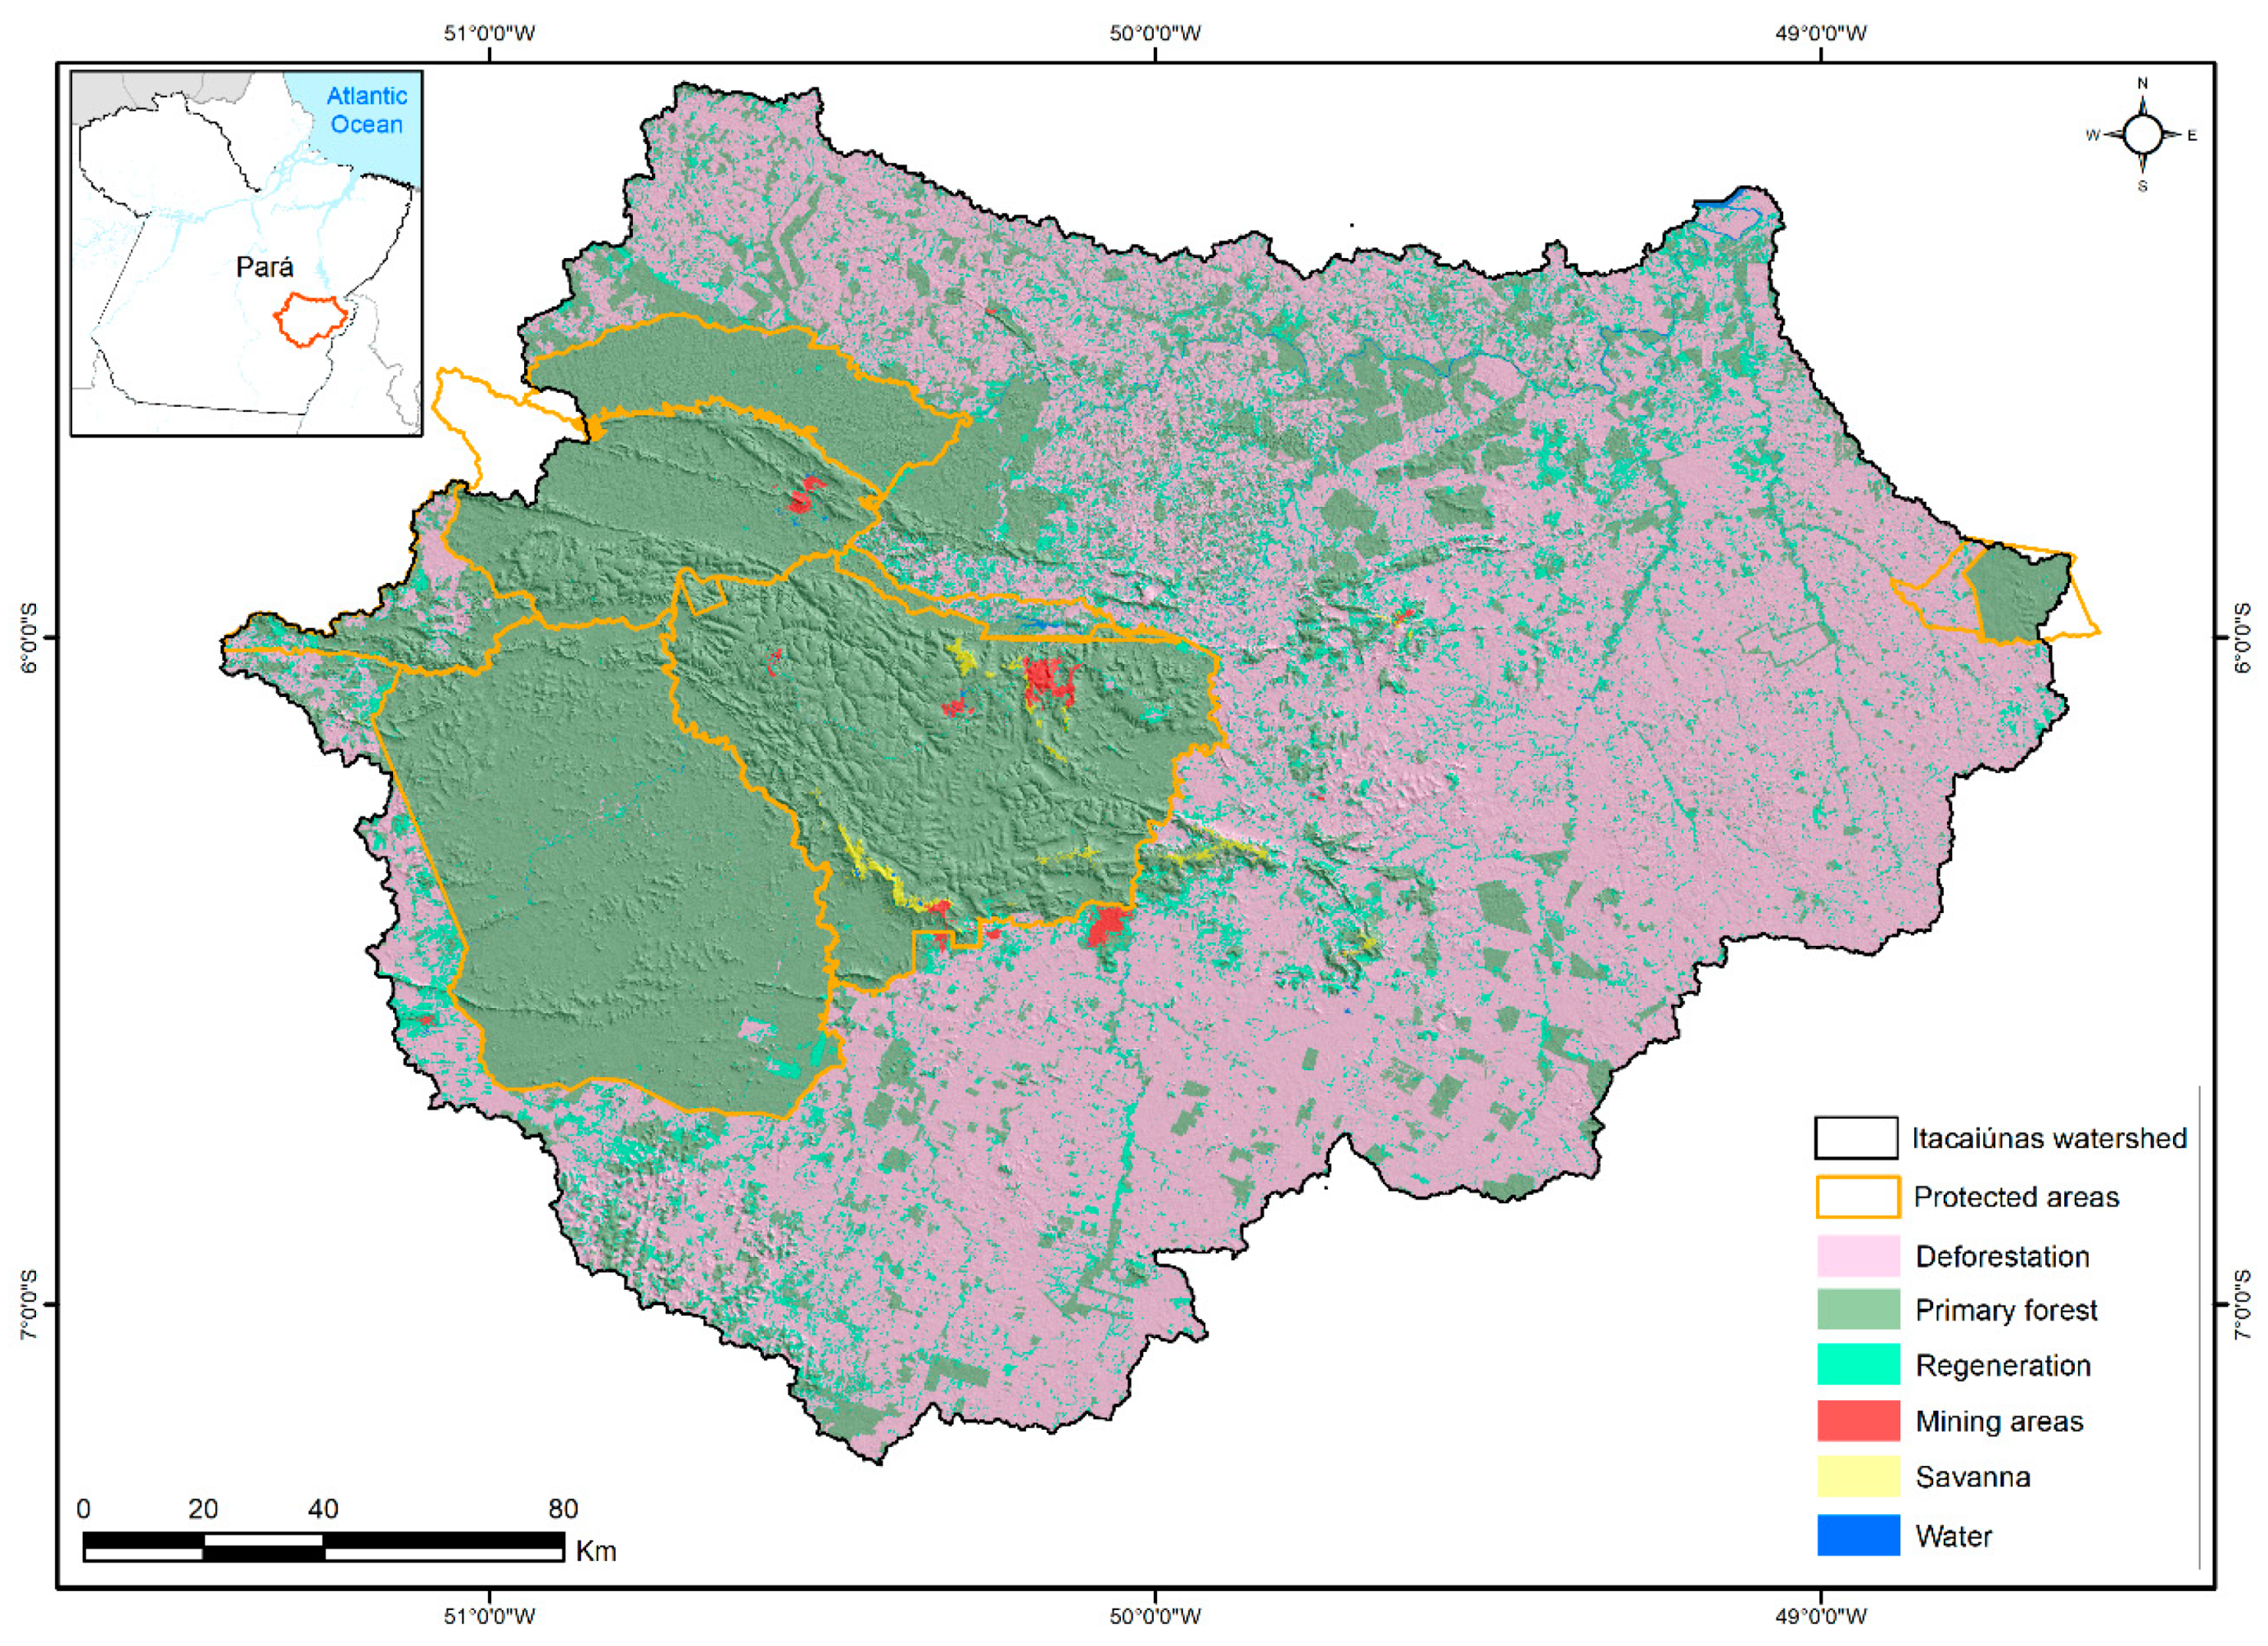
3.1. Land Cover Classification

The total classification mapped in 2017 corresponds to 51.1% (21,113 km2) of the watershed. The forest covers 48.1% (19,899 km2) of the area; mining, 0.3% (120 km2); water, 0.3% (107 km2), and savanna, 0.2% (102 km2) (Figure 4). Considering a scenario without protected areas, the remaining area would have only 27% (7887 km2) forest (forest fragments) and 68% (20,000 km2) deforested area, showing the advancing deforestation outside the protected areas. The total deforestation identified after 2008 reached 2381 km2, which represents 11% of the deforested area throughout the BHRI.
From the total forests area in 2017 (19,899 km2), 83% (16,516 km2) are composed of primary forest and 17% (3383 km2) of regeneration (Figure 4). Considering the watershed without the protected areas, the primary forest would cover an area of 4500 km2 (15%), and regeneration an area of approximately 3000 km2 (10%). This is because much of the primary vegetation is located within protected areas, while almost all of the regeneration is located outside of these protected areas.

3.2. Legal Reserve Analysis

The total RL deficit estimated for the BHRI was 4383 km2 (corresponding to 21% of the watershed deforestation), with 56% (2456 km2) composed of deficit that can be compensated anywhere in the Amazon biome and 44% (1926 km2) via forest restoration (corresponding to 9% of the watershed deforestation) where the deforestation occurred. This area that needs to be restored is related to deforestation in RL after 22 July 2008 or the deforestation over 50% of medium and large properties, which must be restored to 50% of the property, as defined in the CFB. Most of the total deficit (60%) are in the property class that has between 27 and 54% deficit; 39% of the deficit are in the property class with 0 to 27% deficit, and only 1% of the deficit are in properties with 54 to 80% deficit (Figure 5 and Figure 6).
The total forest surplus in the watershed was 3241 km2, with 96% (3120 km2) consisting of surplus that can be used to compensate for illegal deforestation (and cannot be deforested) and 4% (121 km2) of forest surplus that can be deforested (in properties with a percentage of forest greater than 80%). Of the total forest that can be deforested, 39% (47 km2) became susceptible to deforestation due to the calculation of APPs in RL (Figure 6 and Figure 7).
This scenario was expected because the CFB allows all the forest cover on small properties and the forest above 50% of medium and large properties to be used for compensation. This allowance explains the large difference between the surplus for compensation and the deforestable surplus. A large part of the total surplus (64%) is located on properties with 0 to 34% surplus; 30% of the surplus is on properties with 34 to 68% surplus, and only 6% of the surplus is on properties with 68 to 100% surplus (Figure 6 and Figure 7).
When analyzing the RL balance in the watershed, the total deficit is greater than the total surplus, with a difference of 1142 km2. However, a large part of the deficit (56%, or 2456 km2) can be resolved through compensation, of which there is 3120 km2 available within the watershed (surplus for compensation). The remaining deficit (1927 km2) must be restored because this area was deforested after 22 July 2018. The deforestable surplus can also be used for compensation, but this is optional (Figure 6).

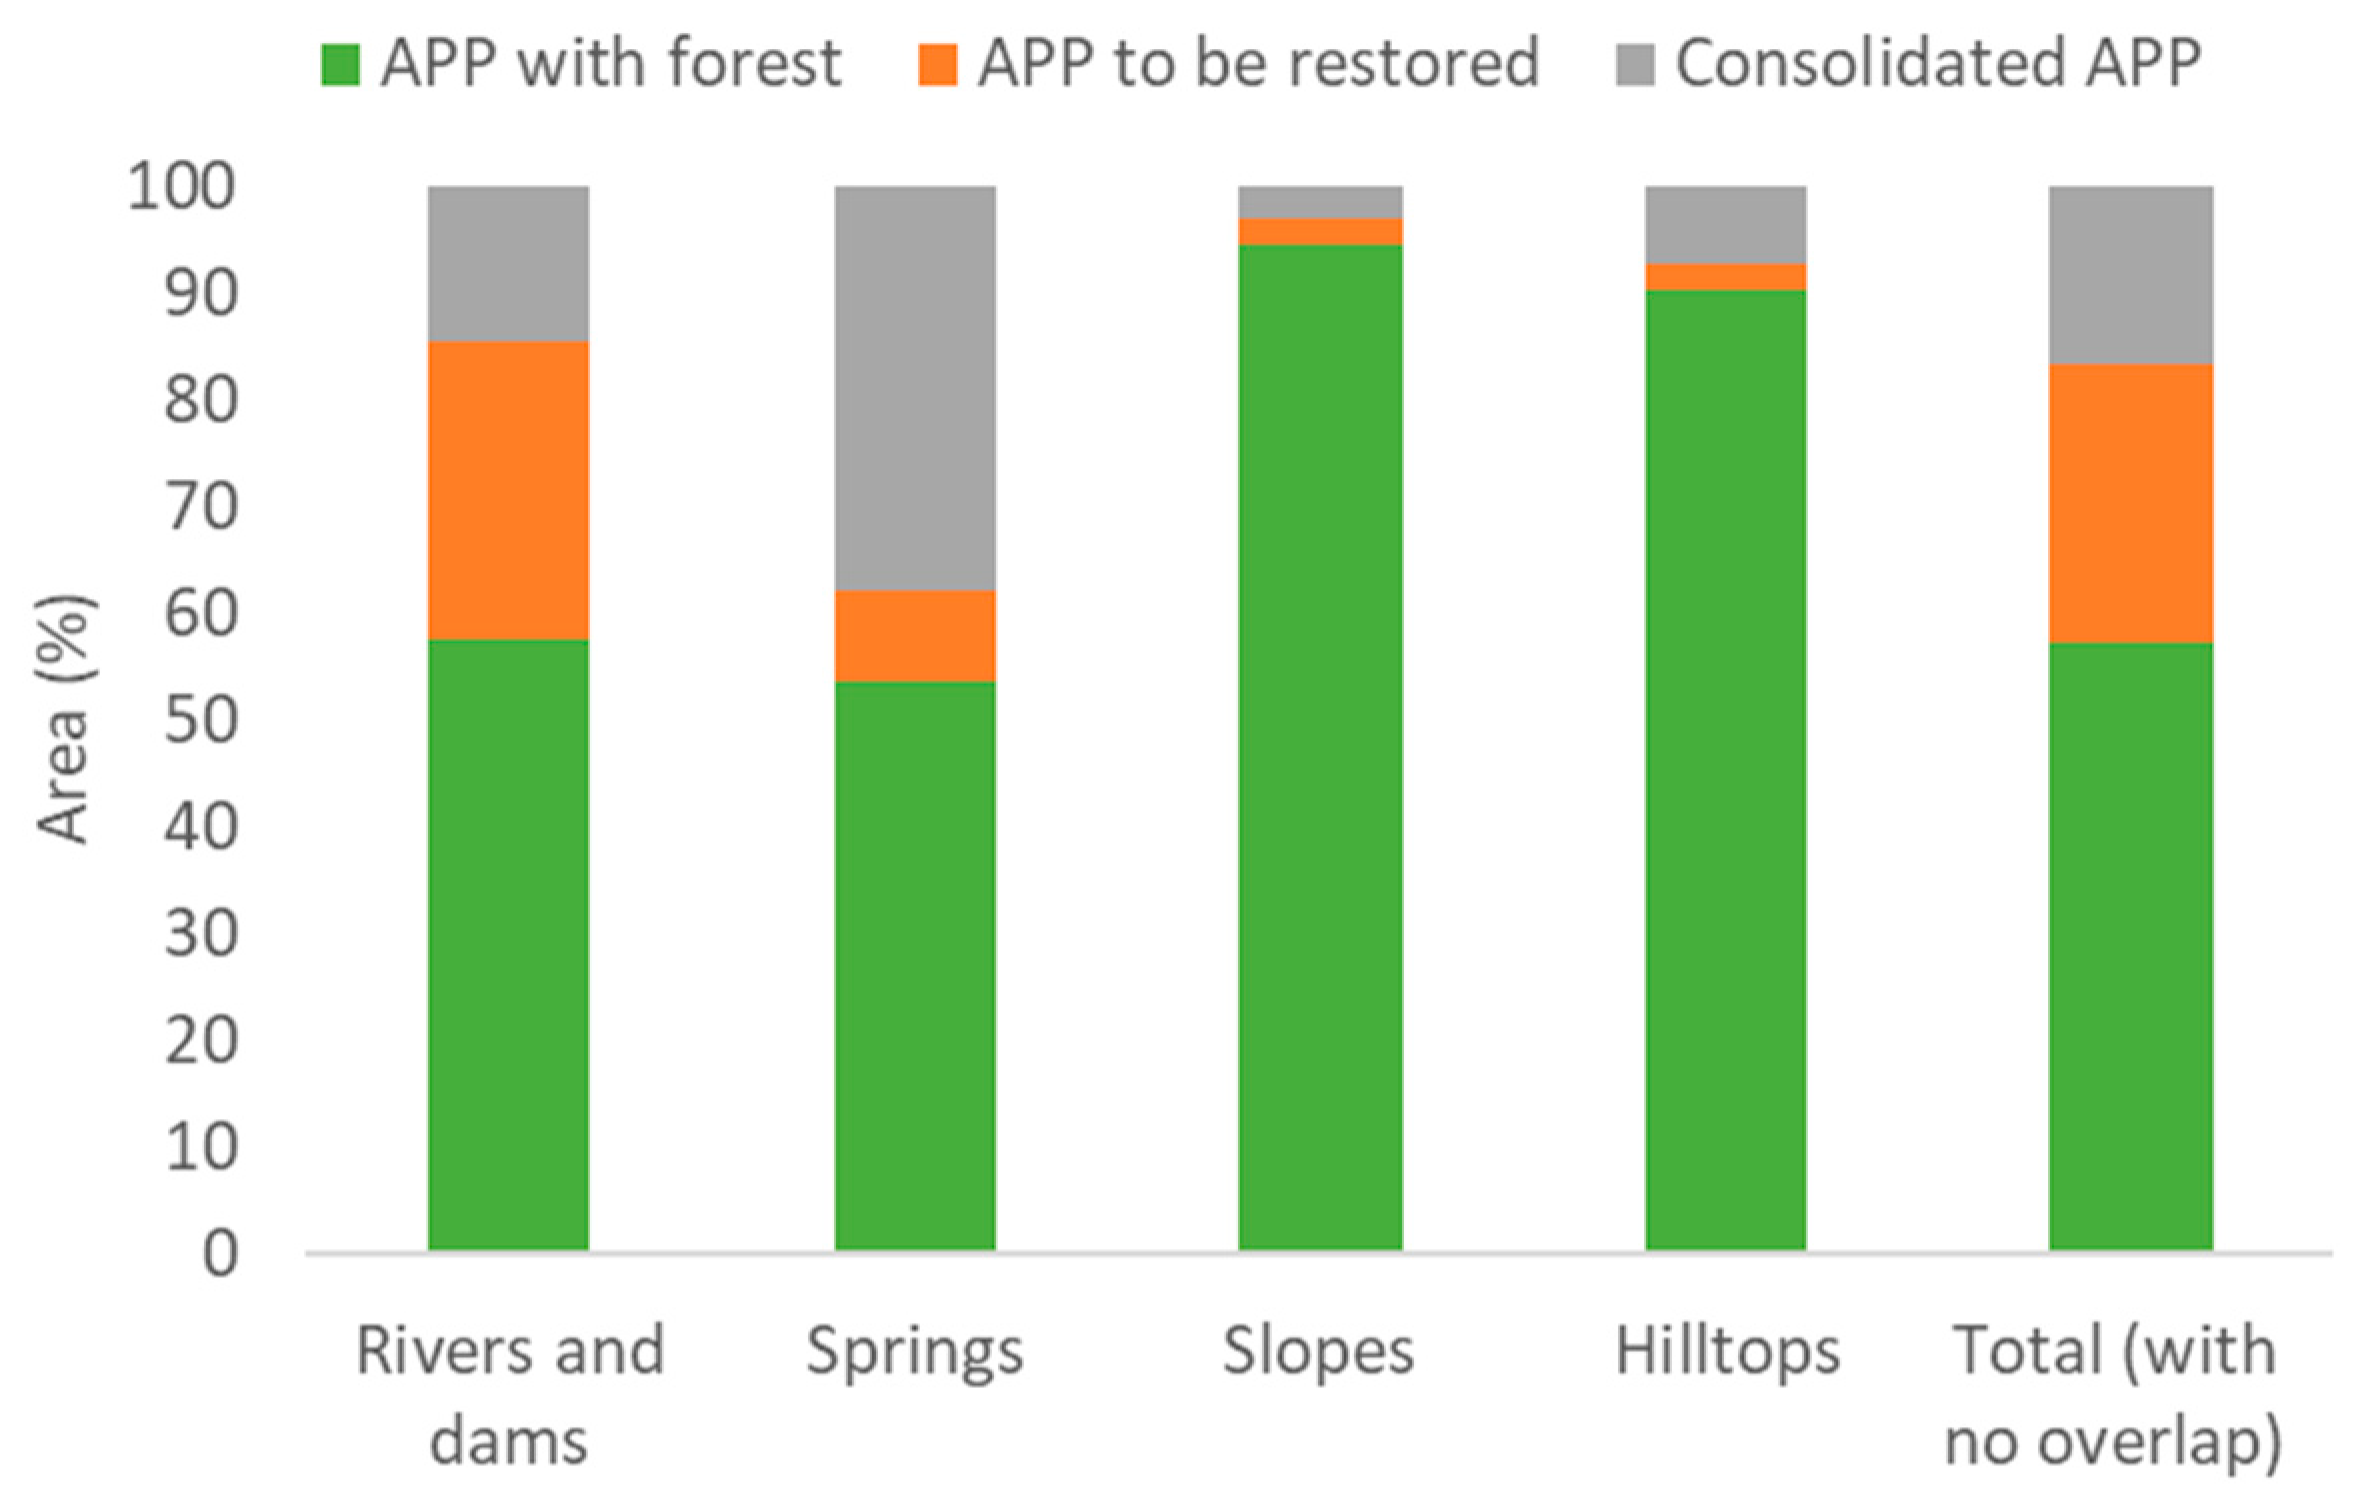
3.3. Permanent Preservation Area Analysis

The BHRI has a total estimated APP of 5254 km2 (13% of the watershed area), with more than half (57% or 3017 km2) composed of forests; 26% (1356 km2) of areas that need to be restored, and 17% (881 km2) of consolidated areas (which were deforested and do not need to be recovered) (Figure 8 and Figure 9, Table 4). The forest and deficit distribution is related to the land use history. The consolidated APPs are located throughout the deforested region, which is part of an old deforestation frontier in the Amazon (deforestation arc); and the APPs to be restored are located in isolated areas, where the more recent deforestation (after 22 July 2008) advanced and where the forested area was below the legal limit (Figure 9).
The APP type with the largest area in the watershed (93% of the total APP) was the APPs along rivers and dams (Table 4) due to the 81,389 km of rivers mapped in the BHRI, corresponding to a drainage density of 1.97 km / km2. This APP type corresponds to 99% of the BHRI APPs that need to be restored and 81% of consolidated APP. APPs around the springs alone have an area equivalent to 15% of the total APP in the BHRI and 34% of the consolidated APP. APPs on hilltops and slopes greater than 45° are approximately 1.5 km2 each, with less importance in the BHRI context (0.3%).
Thus, the total watershed area that needs to be legally restored is 3283 km2 (11% of the total watershed without protected areas), with 59% in RL and 41% in APPs. The total area that is deforested and does not need to be restored is 3337 km2, with 74% in RL (RL to be compensated) and 26% in consolidated APPs.

4. Discussion

4.1. Implications for Itacaiúnas Watershed Management

In the BHRI, 57% of the APPs were preserved. This was mainly due to the mosaic of protected areas, concentrated in the western watershed. In terms of landscape planning, restoration actions were necessary mainly in the eastern region, which has been highly fragmented since the 1980s, when deforestation began to expand in the region. Intensive soil disturbance can reduce water infiltration and aquifer recharge [29], with consequences for water availability to plants and flows during the dry season. In this region, there are also rivers with floodplains, excluded from the APPs by the 2012 CFB revision [30]. The occupation of these areas can aggravate the impact of local floods. Legal reserve areas and priority areas for reforestation can be defined to improve the protection of hydrological services [31], using information such as soil moisture indices and erosion risk. In the western region, deforestation in the areas upstream of conservation units significantly altered the river flow within the conservation units, with possible impacts on water quality and aquatic ecosystems [25]. Restoring APP and RL areas and adopting good agricultural practices can reduce this impact.
The CFB changes reduced the total area of APPs and RL that need to be restored. The APPs on hilltops in the BHRI determined by a previous legislation (CONAMA Resolution 303, 2002 [32,33]) total 3512 km2, but the current legislation requires only 15 km2 of protection. However, the possible impact of this change on the control of aquifer erosion and recharge was not significant within the BHRI because most of these areas are located in conservation units. Nevertheless, the need to restore only 15 m of the 50 m around springs alone generates a 91% reduction in areas to be restored in this type of APP deforested before 2008. This change was reflected in the higher percentage of consolidated APPs found for this APP type (34% of the total consolidated APPs), as shown in Table 4. The reduced width of up to 5 m that need to be restored around rivers (in the case of properties up to 1 FM) was considered insufficient for maintaining ecosystem services [34,35,36].
Despite the changes mentioned in the CFB, 8% of the BHRI needs to be restored. The restoration of riparian areas should have positive impacts on water quality and channel stability [28]. The impact on river flow, however, is more controversial due to the time needed to reach a new balance and since rivers depend on land use throughout the watershed, among other variables [37,38].

4.2. Implications for Implementing the Forest Code and Public Policies

This analysis has four important implications for implementing the CFB and public policies for RL restoration and compensation [27]: (i) the surplus available in the watershed is sufficient to resolve the deficit that can be compensated for within the watershed itself, without using other more distant areas within the biome, as the CFB suggests; (ii) considering that the compensation-only surplus is already protected by law and cannot be deforested, the true environmental additionality would be using the compensation mechanisms to protect the surplus that can still be deforested; (iii) we showed that more than half of the BHRI is deforested, which implies that there is no need for new forest conversion to increase production, as demonstrated by Strassburg et al., 2014 [32]. The same findings were found for the Brazilian Amazon as a whole [32], where there are more than 10 million ha of degraded and underused lands [33]; (iv) even if the demand for compensation is greater than the demand for RL restoration, more incentives are required to restore priority areas, such as those that are highly fragmented or important for endemic biodiversity. However, the revised legislation further increased the possibility of deforesting new areas: the calculation of APPs in RL resulted in a 38% increase in the area likely to be deforested.
For the APPs around rivers, lakes, and dams, we found that the area to be restored was almost twice the size of the areas that were deforested and did not need to be recovered (consolidated), unlike the results found for Pará state [39], in which the consolidated area was six times greater than the area to be recovered. This is because this state presents an old occupation frontier and more than half of its territory is protected. However, some regions are more critical (e.g., the southeast) and have a different pattern than the rest of the state.
APPs around rivers corresponded to 93% of the total APP in the BHRI, which demonstrates the importance of correctly mapping this APP type. The scale of analysis in this study allowed the identification of first order rivers, which is essential for restoration studies due to their high density. These rivers are the most susceptible to human activity and may disappear in sites with a high erosion rate [9,40]. The regional-scale studies, as well as some official database of water resources available in Brazil, underestimate first-order rivers and may underestimate the area to be restored for environmental suitability [39,41]. Drainage networks obtained by remote sensing, however, do not replace field observations, especially for determining the location of springs and defining the width of first order rivers. On the other hand, a recent study observed that, in São Paulo state, the total length of self-reported rivers in CAR was less than half of that estimated by geoprocessing on a regional scale [41]. This finding indicates an inefficiency of CAR in producing an accurate environmental diagnosis and highlights the importance of using high-resolution images by monitoring agencies and for studying watershed management.
Considering the high potential for deficit offsetting in the entire Amazon biome and the low incentive for forest recovery [42], landowners are increasingly discouraged from investing in restoration. The first measure to ensure the maintenance of natural resources is protecting preserved areas. Next is vegetation restoration, especially in critical, fragmented areas, which are necessary for the formation of ecological corridors [43,44]. Thus, it is necessary to implement more mechanisms and incentives to avoid the conversion of new areas and promote the restoration of priority areas. Examples of incentives are payments for environmental services, reduced bank rates, more access for obtaining credit, technical support for implementing productive plantations that generate income for producers, and availability of native species seeds and seedlings.

4.3. Further Analysis

Future analysis should be performed to understand the role of different actors in the distribution of forests and deficit in RL and APPs, through characterizing these areas by rural property size. Understanding these roles is key to help with designing large-scale restoration strategies for each group, since the application of legislation and public policy is different for small and large properties. In addition, for more efficient landscape restoration planning, it is necessary to identify priority areas in the watershed, based on pre-determined indicators, such as the fragmentation level, important areas for biodiversity conservation, and connectivity between fragments, and to include indicators of soil conservation and water resources.

5. Conclusions

Brazil has one of the most complex and advanced sets of laws and environmental policies. Our results are relevant to assist in implementing the Native Vegetation Protection Law and to guide policies to expanding the scale of forest restoration and deforestation compensation in the Amazon. In this study, we have shown that there is large potential for RL compensation that can supply part of the forest deficit in the BHRI. This compensation can occur within the watershed boundaries, avoiding greater impacts of deforestation on the water regime of regional rivers and avoiding compensation between very different ecological areas, thus reducing biodiversity loss. Compensation mechanisms can be used to avoid further deforestation if there are more incentives to protect forests that can still be deforested.
Likewise, with the CFB revision, there was a reduction in the total APP and the area of APPs that should be restored. This change may impact the river dynamics, flow regimes, water quality, maintenance of ecological flows, and soil protection against erosion, since sensitive areas around water bodies and hilltops are considered consolidated or became deforestable. As APPs around rivers correspond to most APPs, the inclusion of first order rivers is key in CAR self-declarations. More incentives and measures are needed to encourage land owners to replant forests, such as mechanisms of payment for environmental services, reduced bank rates, more access to credit, and technical support.

Author Contributions

Conceptualization, S.N. and R.B.L.C.; Formal analysis, S.N., R.B.L.C. and W.R.N.J.; Investigation, S.N. and R.B.L.C.; Methodology, S.N., R.B.L.C., W.R.N.J. and D.S.; Project administration, S.N. and P.W.M.S.-F.; Software, W.R.N.J., P.W.M.S.-F. and D.S.; Supervision, S.N. and P.W.M.S.-F.; Validation, S.N., R.B.L.C. and W.R.N.J.; Writing—original draft, S.N. and R.B.L.C.; Writing—review & editing, W.R.N.J. and P.W.M.S.-F.

Funding

This research received no external funding.

Conflicts of Interest

The authors declare no conflict of interest.

References

  1. Sweeney, B.W.; Czapka, S.J. Riparian forest restoration: Why each site needs an ecological prescription. For. Ecol. Manag. 2004, 192, 361–373. [Google Scholar] [CrossRef]
  2. Food and Agriculture Organization (FAO). Forests and Water; 155; FAO: Rome, Italy, 2008; ISBN 978-92-5-106090-2. [Google Scholar]
  3. Zhang, M.; Liu, N.; Harper, R.; Li, Q.; Liu, K.; Wei, X.; Ning, D.; Hou, Y.; Liu, S. A global review on hydrological responses to forest change across multiple spatial scales: Importance of scale, climate, forest type and hydrological regime. J. Hydrol. 2017, 546, 44–59. [Google Scholar] [CrossRef]
  4. Jipp, P.H.; Nepstad, D.C.; Cassel, D.K.; de Carvalho, C.R. Deep Soil Moisture Storage and Transpiration in Forests and Pastures of Seasonally-Dry Amazonia. In Potential Impacts of Climate Change on Tropical Forest Ecosystems; Markham, A., Ed.; Springer: Dordrecht, The Netherlands, 1998; pp. 255–272. ISBN 978-94-017-2730-3. [Google Scholar]
  5. Bosch, J.M.; Hewlett, J.D. A review of catchment experiments to determine the effect of vegetation changes on water yield and evapotranspiration. J. Hydrol. 1982, 55, 3–23. [Google Scholar] [CrossRef]
  6. Ellison, D.; Morris, C.E.; Locatelli, B.; Sheil, D.; Cohen, J.; Murdiyarso, D.; Gutierrez, V.; van Noordwijk, M.; Creed, I.F.; Pokorny, J.; et al. Trees, forests and water: Cool insights for a hot world. Glob. Environ. Chang. 2017, 43, 51–61. [Google Scholar] [CrossRef] [Green Version]
  7. Aragao, L.E.; Malhi, Y.; Barbier, N.; Lima, A.; Shimabukuro, Y.; Anderson, L.; Saatchi, S. Interactions between rainfall, deforestation and fires during recent years in the Brazilian Amazonia. Philos. Trans. R. Soc. B Biol. Sci. 2008, 363, 1779–1785. [Google Scholar] [CrossRef] [Green Version]
  8. Orsi, F.; Geneletti, D.; Newton, A.C. Towards a common set of criteria and indicators to identify forest restoration priorities: An expert panel-based approach. Ecol. Indic. 2011, 11, 337–347. [Google Scholar] [CrossRef]
  9. Leal, C.G.; Pompeu, P.S.; Gardner, T.A.; Leitão, R.P.; Hughes, R.M.; Kaufmann, P.R.; Zuanon, J.; de Paula, F.R.; Ferraz, S.F.B.; Thomson, J.R.; et al. Multi-scale assessment of human-induced changes to Amazonian instream habitats. Landsc. Ecol. 2016, 31, 1725–1745. [Google Scholar] [CrossRef] [Green Version]
  10. Ferreira, J.; Pardini, R.; Metzger, J.P.; Fonseca, C.R.; Pompeu, P.S.; Sparovek, G.; Louzada, J. Towards environmentally sustainable agriculture in Brazil: Challenges and opportunities for applied ecological research. J. Appl. Ecol. 2012, 49, 535–541. [Google Scholar] [CrossRef]
  11. Soares-Filho, B. Impacto da Revisão do Código Florestal: Como Viabilizar o Grande Desafio Adiante? Secretaria de Assuntos Estratégicos: Brasília, Brazil, 2013. [Google Scholar]
  12. Castello, L.; McGrath, D.G.; Hess, L.L.; Coe, M.T.; Lefebvre, P.A.; Petry, P.; Macedo, M.N.; Renó, V.F.; Arantes, C.C. The vulnerability of Amazon freshwater ecosystems. Conserv. Lett. 2013, 6, 217–229. [Google Scholar] [CrossRef] [Green Version]
  13. Grimaldi, M.; Oszwald, J.; Dolédec, S.; del Pilar Hurtado, M.; de Souza Miranda, I.; de Sartre, X.A.; de Assis, W.S.; Castañeda, E.; Desjardins, T.; Dubs, F.; et al. Ecosystem services of regulation and support in Amazonian pioneer fronts: Searching for landscape drivers. Landsc. Ecol. 2014, 29, 311–328. [Google Scholar] [CrossRef]
  14. Nasi, R.; Wunder, S.; Campos, J.J. Forest Ecosystem Services: Can They Pay Our Way out of Deforestation? CIFOR for the Global Environmental Facility (GEF): Bogor, Indonesia, 2002. [Google Scholar]
  15. World Wide Fund for Nature (WWF). Brasil Áreas Protegidas. Available online: https://www.wwf.org.br/natureza_brasileira/areas_prioritarias/amazonia1/nossas_solucoes_na_amazonia/areas_protegidas_na_amazonia/ (accessed on 10 December 2018).
  16. Mixed martial arts (MMA). Acordo de Paris. Available online: http://www.mma.gov.br/clima/convencao-das-nacoes-unidas/acordo-de-paris (accessed on 8 June 2018).
  17. Mixed martial arts (MMA). Política Nacional de Recuperação da Vegetação Nativa. Available online: http://www.mma.gov.br/florestas/política-nacional-de-recuperação-da-vegetação-nativa (accessed on 8 June 2018).
  18. Souza-Filho, P.; Nascimento, W.; Santos, D.; Weber, E.; Silva, R.; Siqueira, J. A GEOBIA Approach for Multitemporal Land-Cover and Land-Use Change Analysis in a Tropical Watershed in the Southeastern Amazon. Remote Sens. 2018, 10, 1683. [Google Scholar] [CrossRef]
  19. Laurance, W.F.; Goosem, M.; Laurance, S.G.W. Impacts of roads and linear clearings on tropical forests. Trends Ecol. Evol. 2009, 24, 659–669. [Google Scholar] [CrossRef] [Green Version]
  20. Uhl, C.; Buschbacher, R. A Disturbing Synergism Between Cattle Ranch Burning Practices and Selective Tree Harvesting in the Eastern Amazon. Biotropica 1985, 17, 265–268. [Google Scholar] [CrossRef]
  21. Diegues, A.C.; Millikan, E.C.B.; Ferraz, I.T.; Hebette, J. Deforestation and Livelihoods in the Brazilian Amazon; NUPAUB: São Paulo, Brazil, 1997. [Google Scholar]
  22. Cavalcante, R.B.L.; Pontes, P.R.M.; Souza-Filho, P.W.M.; de Souza, E.B. Opposite Effects of Climate and Land Use Changes on the Annual Water Balance in the Amazon Arc of Deforestation. Water Resour. Res. 2019. [Google Scholar] [CrossRef]
  23. Agência Nacional de Águas (ANA). Plano Estratégico de Recursos Hídricos da Bacia Hidrográfica dos Rios Tocantins e Araguaia: Relatório Síntese; Agência Nacional de Águas: Brasília, Brazil, 2009; p. 256. [Google Scholar]
  24. Souza-Filho, P.W.M.; de Souza, E.B.; Silva Júnior, R.O.; Nascimento, W.R.; Versiani de Mendonça, B.R.; Guimarães, J.T.F.; Dall’Agnol, R.; Siqueira, J.O. Four decades of land-cover, land-use and hydroclimatology changes in the Itacaiúnas River watershed, southeastern Amazon. J. Environ. Manag. 2016, 167, 175–184. [Google Scholar] [CrossRef]
  25. Pontes, P.R.M.; Cavalcante, R.B.L.; Sahoo, P.K.; da Silva Júnior, R.O.; da Silva, M.S.; Dall’Agnol, R.; Siqueira, J.O. The role of protected and deforested areas in the hydrological processes of Itacaiúnas River Basin, eastern Amazonia. J. Environ. Manag. 2019, 235, 489–499. [Google Scholar] [CrossRef]
  26. Blaschke, T. Object based image analysis for remote sensing. ISPRS J. Photogramm. Remote Sens. 2010, 65, 2–16. [Google Scholar] [CrossRef] [Green Version]
  27. Nunes, S.; Gardner, T.; Barlow, J.; Martins, H.; Salomão, R.; Monteiro, D.; Souza, C. Compensating for past deforestation: Assessing the legal forest surplus and deficit of the state of Pará, eastern Amazonia. Land Use Policy 2016, 57, 749–758. [Google Scholar] [CrossRef] [Green Version]
  28. Hou, K.; Sun, J.; Yang, W.; Sun, T.; Wang, Y.; Ma, S. Automatic Extraction of Drainage Networks from DEMs Base on Heuristic Search. J. Softw. 2011, 6, 1611–1618. [Google Scholar] [CrossRef]
  29. van der Weert, R. Hydrological Conditions in Indonesia; Delft Hydraulics: Jakarta, Indonesia, 1994. [Google Scholar]
  30. Vettorazzi, C.A.; Valente, R.A. Priority areas for forest restoration aiming at the conservation of water resources. Ecol. Eng. 2016, 94, 255–267. [Google Scholar] [CrossRef]
  31. Oliveira, T.; Francisco, C. Mapeamento das Áreas de Preservação Permanente e as Mudanças no Código Florestal. Caderno de Geografia 2018, 28, 574–587. [Google Scholar] [CrossRef]
  32. Strassburg, B.B.N.; Latawiec, A.E.; Barioni, L.G.; Nobre, C.A.; da Silva, V.P.; Valentim, J.F.; Vianna, M.; Assad, E.D. When enough should be enough: Improving the use of current agricultural lands could meet production demands and spare natural habitats in Brazil. Glob. Environ. Chang. 2014, 28, 84–97. [Google Scholar] [CrossRef] [Green Version]
  33. TerraClass Projeto TerraClass. 2014. Available online: http://www.inpe.br/cra/projetos_pesquisas/terraclass2014.php (accessed on 23 January 2019).
  34. Metzger, J.P. O Código Florestal Tem Base Científica? Nat. Conserv. 2010, 08, 92–99. [Google Scholar] [CrossRef]
  35. Ramos, C.C.; dos Anjos, L. The width and biotic integrity of riparian forests affect richness, abundance, and composition of bird communities. Nat. Conserv. 2014, 12, 59–64. [Google Scholar] [CrossRef] [Green Version]
  36. Salemi, L.F.; Lins, S.R.M.; de Campos Ravagnani, E.; Magioli, M.; Martinez, M.G.; Guerra, F.; Vidas, N.B.; Fransozi, A.; de Barros Ferraz, S.F.; Martinelli, L.A.; et al. Past and present land use influences on tropical riparian zones: An isotopic assessment with implications for riparian forest width determination. Biota Neotrop. 2016, 16. [Google Scholar] [CrossRef]
  37. Bruijnzeel, L.A. Hydrological functions of tropical forest: Not seeing the soil for the trees? Agric. Ecosyst. Environ. 2004, 185–227. [Google Scholar] [CrossRef]
  38. Brown, A.E.; Zhang, L.; McMahon, T.A.; Western, A.W.; Vertessy, R.A. A review of paired catchment studies for determining changes in water yield resulting from alterations in vegetation. J. Hydrol. 2005, 310, 28–61. [Google Scholar] [CrossRef]
  39. Nunes, S.; Barlow, J.; Gardner, T.; Sales, M.; Monteiro, D.; Souza, C. Uncertainties in assessing the extent and legal compliance status of riparian forests in the eastern Brazilian Amazon. Land Use Policy 2019, 82, 37–47. [Google Scholar] [CrossRef]
  40. Faria, A.P. Transporte de sedimentos em canais fluviais de primeira ordem: Respostas geomorfológicas. Rev. Bras. Geomorfol. 2014, 15, 191–202. [Google Scholar] [CrossRef]
  41. Taniwaki, R.H.; Forte, Y.A.; Silva, G.O.; Brancalion, P.H.S.; Cogueto, C.V.; Filoso, S.; Ferraz, S.F.B. The Native Vegetation Protection Law of Brazil and the challenge for first-order stream conservation. Perspect. Ecol. Conserv. 2018, 16, 49–53. [Google Scholar] [CrossRef]
  42. Diederichsen, A.; Gatti, G.; Nunes, S.; Pinto, A. Diagnóstico dos Fatores Chave de Sucesso Para a Restauração da Paisagem Florestal: Município de Paragominas e Estado do Pará; Imazon: Belém, Brazil, 2017; ISBN 978-85-86212-91-8. [Google Scholar]
  43. Bull, J.W.; Suttle, K.B.; Gordon, A.; Singh, N.J.; Milner-Gulland, E.J. Biodiversity offsets in theory and practice. Oryx 2013, 47, 369–380. [Google Scholar] [CrossRef] [Green Version]
  44. McKenney, B.A.; Kiesecker, J.M. Policy development for biodiversity offsets: A review of offset frameworks. Environ. Manag. 2010, 45, 165–176. [Google Scholar] [CrossRef] [PubMed]
Figure 1. Study area, the Itacaiúnas watershed, located in the state of Pará, southeastern Brazilian Amazon.
Forests 10 00439 g001
Figure 2. Land tenure status in the Itacaiúnas watershed.
Forests 10 00439 g002
Figure 3. Summary of the methodology applied to evaluate APPs and RL across Itacaiúnas watershed. CAR is the Environmental Rural Property Registry; RL is Legal Reserve; DEM is the Digital Elevation Model from ALOS PALSAR; and APP is Permanent Preservation Area.
Forests 10 00439 g003
Figure 4. Land cover map of the Itacaiúnas watershed in 2017.
Forests 10 00439 g004
Figure 5. Distribution of the total legal reserve deficit (forest cover under the required RL: deficit to be compensated + deficit to be restored) in rural properties registered under CAR and in Incra settlements, as defined by Brazilian environmental law (Law no. 12651, 25 March 2012), across the Itacaiúnas watershed. Percentages are related to the deficit area in relation to the property size.
Forests 10 00439 g005
Figure 6. Legal reserve deficit and surplus estimates in rural properties registered under CAR and in Incra settlements, as defined by Brazilian environmental law (Law no. 12651, 25 March 2012), across the Itacaiúnas watershed.
Forests 10 00439 g006
Figure 7. Distribution of the total legal reserve surplus (compensation-only surplus + deforestable surplus) in rural properties registered under CAR and in Incra settlements, as defined by Brazilian environmental law (Law no. 12651, 25 March 2012), across the Itacaiúnas watershed. Percentages are related to the surplus area in relation to the property size.
Forests 10 00439 g007
Figure 8. Estimated percentage of permanent preservation areas (APPs) with forest, consolidated, and to be restored, per APP type, across the Itacaiúnas watershed.
Forests 10 00439 g008
Figure 9. Distribution of permanent preservation areas, as defined by Brazilian environmental law (Law no. 12651, 25 March 2012), across the Itacaiúnas watershed.
Forests 10 00439 g009
Table 1. Datasets used in this study. CAR—Environmental Rural Property Registry; digital elevation model—DEM; Incra—National Institute for Colonization and Agrarian Reform; ICMBio—Brazilian Institute for Biodiversity Conservation; SEMAS—State Secretariat of Environment and Sustainability; ITV—Instituto Tecnológico Vale.
DatasetSourceYearScale/ResolutionReference Image
SettlementsIncra2013--
Protected areasICMBio2015--
CARSEMAS-Pará2017--
Land cover classificationITV1973, 1984, 1994, 2004, 2008, 20131:150.000 (30 m)Landsat-5/8
Land cover classificationITV20171:50.000 (10 m)Sentinel-2A
RiversITV20111:50.000 (12.5 m)ALOS PALSAR
DEMITV20111:50.000 (12.5 m)ALOS PALSAR
Table 2. Permanent preservation area (APP) widths based on the water course widths, under Brazilian environmental law (Law no. 12651, 25 March 2012).
Water CourseWidth/Area of Water BodyAPP Width
Rivers<10 m30 m
10–50 m50 m
50–200 m100 m
200–600 m200 m
>600 m500 m
Lakes and dams<1 ha-
>1 ha15 m
Springs-30 m
Table 3. Legal requirements for restoring permanent preservation areas (APPs) under the Brazilian environmental law (Law no. 12651, 25 March 2012) for rural properties. These requirements are applied to APPs deforested before 22 July 2008. FM is the number of fiscal modules.
Water CourseWidth/Area of Water BodyProperty SizeAPP to Be Restored
Riversallsmall (≤1 FM)5 m
allsmall (>1 FM and ≤2 FM)8 m
allsmall (>2 FM and ≤4 FM)15 m
≤10 mmedium (>4 FM and ≤10 FM)20 m
>10 mmedium (>4 FM and ≤10 FM)*30–100 m
allmedium/large (>10 FM)*30–100 m
Lakes and dams>1 haall15 m
Springs-all15 m
* As a function of half the river width.
Table 4. Permanent preservation area estimates, per permanent preservation area (APP) type, as defined by Brazilian environmental law (Law no. 12651, 25 March 2012), across the Itacaiúnas watershed.
APP TypeTotal APPAPPs with ForestAPPs to Be RestoredConsolidated APPs
(km2)(km2)(km2)(km2)
Rivers and reservoirs4867.62808.01348.3711.3
Springs793.2426.866.5300.0
Slopes > 45°14.814.00.40.4
Hilltops15.013.60.41.1
Total (with no overlap)5254.83017.31356.3881.2

