Article

Reconstruction of June–July Temperatures Based on a 233 Year Tree-Ring of Picea jezoensis var. microsperma

1
Experimental Teaching Center, Shenyang Normal University, Shenyang 110034, China
2
School of Life Sciences, Henan University, Kaifeng 475004, China
3
Institute of Applied Ecology, Chinese Academy of Sciences, Shenyang 110016, China
4
College of Forestry, Shenyang Agricultural University, Shenyang 110866, China
5
College of Life Sciences, Shenyang Normal University, Shenyang 110034, China
6
College of Environmental and Resource Sciences, Dalian Minzu University, Dalian 116600, China
*
Author to whom correspondence should be addressed.
Forests 2019, 10(5), 416; https://doi.org/10.3390/f10050416
Submission received: 10 April 2019 / Revised: 10 May 2019 / Accepted: 13 May 2019 / Published: 14 May 2019
(This article belongs to the Section Forest Ecophysiology and Biology)

Abstract

:
In this study, ring-width chronology of Picea jezoensis var. microsperma from the Changbai Mountain (CBM) area, Northeast China, was constructed. Growth/climate responses suggested that mean maximum temperature (Tmax) was the limiting factor affecting radial growth of PJ trees in the study region. According to the correlation analysis between the ring-width index and meteorological data, a June–July mean maximum temperature (Tmax6–7) series between 1772 and 2004 was reconstructed by using the standard chronology. For the calibration period (1959–2004), the explained variance of the reconstruction was 41.6%. During the last 233 years, there were 36 warm years and 34 cold years, accounting for 15.5% and 14.7% of the total reconstruction years, respectively. Cold periods occurred in 1899–1913, 1955–1970, and 1975–1989, while warm periods occurred in 1881–1888. The reconstructed temperature series corresponded to the historical disaster records of extreme climatic events (e.g., drought and flood disasters) in this area. Comparisons with other temperature reconstructions from surrounding areas and spatial correlation analysis between the gridded temperature data and reconstruction series indicated that the regional climatic variations were well captured by the reconstruction. In addition, multi-taper method spectral analysis indicated the existence of significant periodicities in the reconstructed series. The significant spatial correlations between the reconstructed temperature series and the El Niño–Southern Oscillation (ENSO), solar activity, and Pacific Decadal Oscillation (PDO) suggested that the temperature in the CBM area indicated both local-regional climate signals and global-scale climate changes.

1. Introduction

The increase in global temperature since the 20th century has had a major impact on natural systems [1]. Global warming will result in significant changes in species abundance and the distribution of mountain ecosystems at the mid–high latitudes of the Northern Hemisphere, where plant growth is mainly limited by temperature [2,3,4,5,6,7,8,9,10]. Northeast China, an ecotone between temperate and cold temperate climatic zones and transitioning between monsoon and non-monsoon conditions, is extremely sensitive to climatic changes [11]. The drought and flood disasters caused by the interannual instability of the East Asia summer monsoon (EASM) have seriously affected the healthy development of agriculture and forest ecosystems [12,13]. Additionally, previous studies have shown that climate change in this region was also associated with global land–sea atmospheric circulation and solar activities [14,15]. It is widely believed that the climate will get colder in periods of less solar activity (e.g., the “Little Ice Age” during AD 1450 and 1850) [16,17], while in a period of intense solar activity, the climate will become warmer (e.g., the warm period of the Middle Ages during AD 1000 and 1400) [18,19]. In the last few years, the temperature in Northeast China has been rising [11,20]. To understand the potential impact of climate change on this area requires a detailed understanding of climate changes and trends in this region over the past few hundred years, or even longer [21,22]. However, most of the measured and archived meteorological records are from after 1949 (in this year, The People’s Republic of China was established), which limits our understanding of the processes and mechanisms of past climatic changes in this region.
The tree-rings of trees growing in climate-limited environments can record climatic conditions well [23]. Tree rings in areas where temperature is the dominant limiting factor have already been widely applied to reconstruct past temperatures [24,25,26,27,28]. These reconstructed temperature series from tree rings have played a crucial role in the study of regional and global temperature changes. The Changbai Mountain (CBM) is situated in the core area of Northeast Forest, a large area of undisturbed temperate old-growth forest that offers an excellent opportunity for studies on climatology. Trees growing in this forest were shown to be sensitive to temperature change in the growing season [29,30,31]. In the last years, some studies on temperature reconstructions have been conducted in the CBM, including January–April and February–April temperature reconstructions based on Korean pine chronologies by Shao et al., 1997 [32], and Zhu et al., 2009 [33], respectively; and September–October temperature reconstruction based on Fraxinus mandshurica chronology by Wang et al., 2012 [34]. As mentioned above, temperature reconstructions, especially during the growing season (June–August), are still lacking in this area. Thus, it is very important to fill this gap. In the process of exploring the response of high-altitude Picea jezoensis var. trees to climate change in Changbai Mountain, we found that the radial growth of PJ has a high correlation with the mean maximum temperature in the previous year June–July (T67), and the radial growth has a high sensitivity to its annual variation. Therefore, we reconstructed the historical changes of T67 in the Changbai Mountain area, based on the chronology of PJ (see Section 4.1 for the physiological basis). The long-term reconstruction of past temperatures in the growing season will enable us to better understand the change in climate and update the current climate model of Changbai Mountain. [35].
In this study, a tree-ring width series, constructed from the living trees of Picea jezoensis (PJ) was used to reconstruct the June–July maximum temperature histories for the last 233 years. The aims of this study are (1) to reconstruct and investigate temperature variability since 1772 AD in Changbai Mountain, and (2) to explore the potential connections between the reconstructed June–July temperature data and large scale climatic change.

2. Materials and Methods

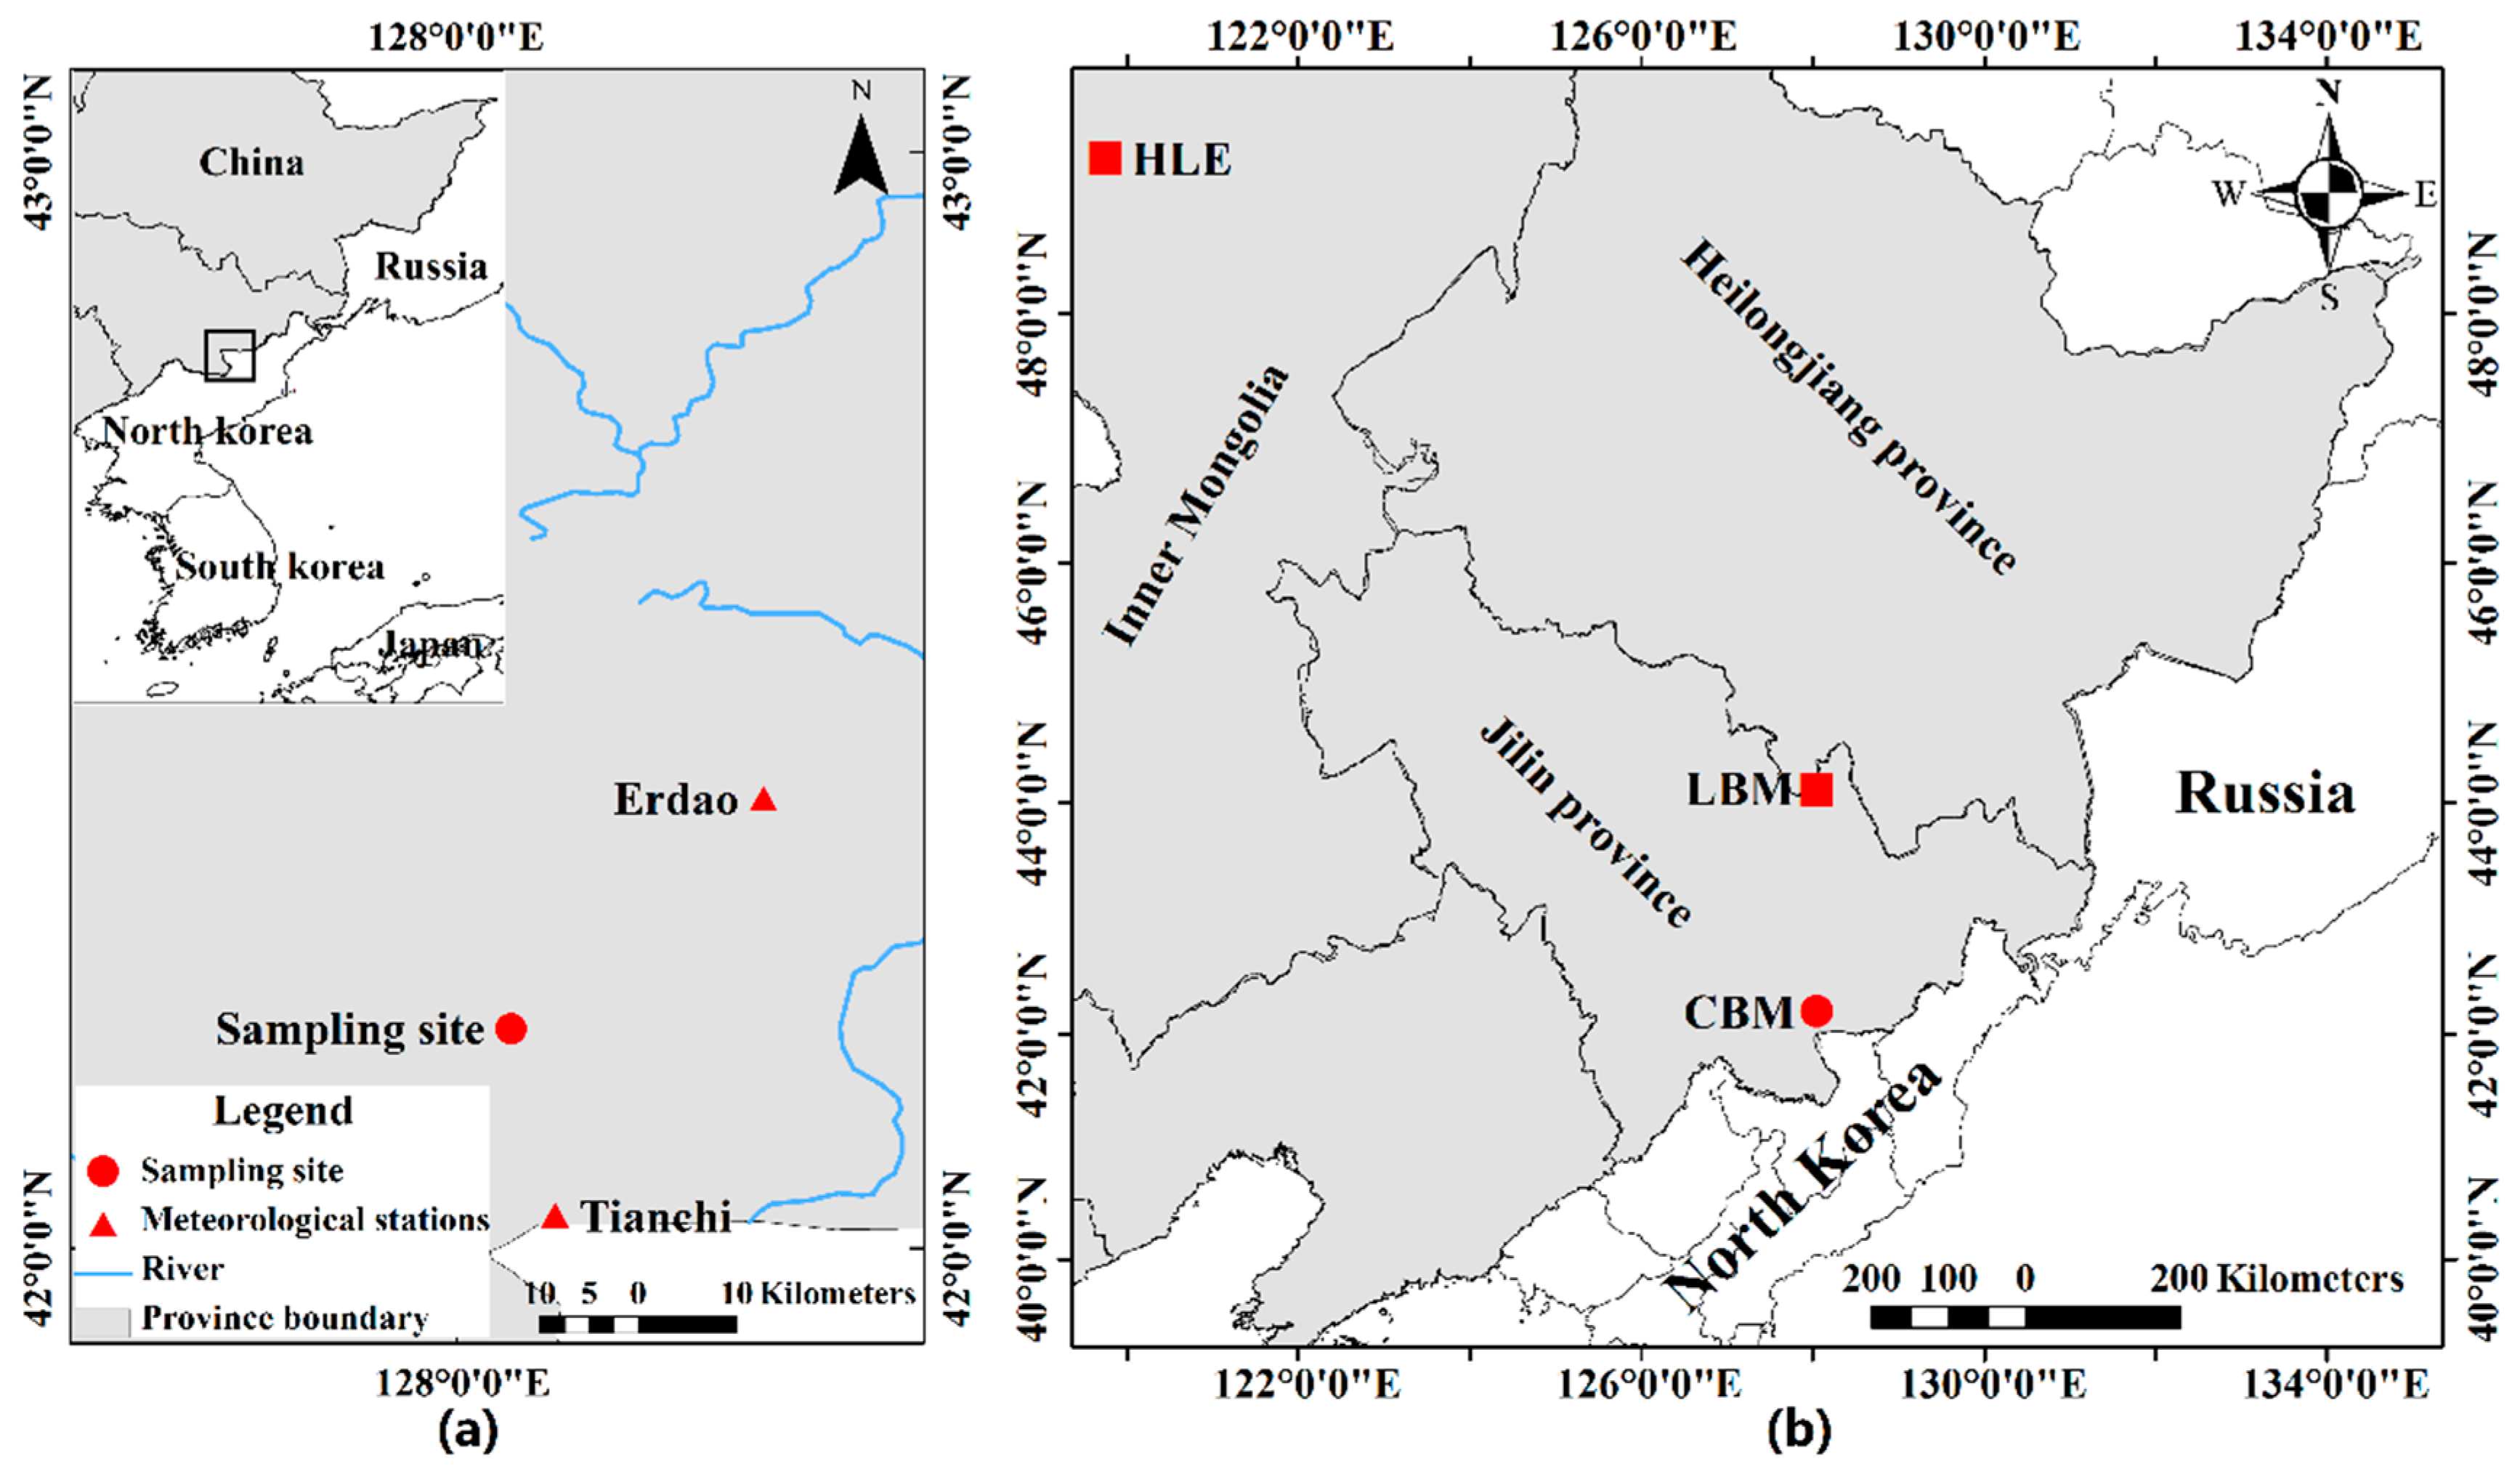
2.1. Study Area and Sample Collection

The study area was located at the Changbai Mountain (CBM) Natural Reserve in Northeast China (Figure 1), where the climate is affected by the temperate continental monsoon, which is characterized by cold, windy winters and moist summers [33]. The annual average temperature is between −7 °C and 3 °C, and the annual precipitation is 700–1400 mm (Figure 2). About 88.4% of the annual precipitation occurs from April to September. The sample site (1600–1700 m a. s. l, 42°12′ N and 128°03′ E) (Figure 1) was located on the north slope of CBM. Picea jezoensis (PJ) was the dominant tree species in the site, accompanied by some Abies nephrolepis [34]. To minimize the influence of non-climatic factors on the growth of trees, the selected PJ forest was an open forest, with no signs of recent fires or human disturbances. Three stands of 30 m × 30 m were established, and PJ trees accounted for 83.8% of the basal area at breast height (1.3 m) of the sampling stands. All of the largest, presumably oldest, and healthiest PJ were chosen, and then one or two oppositely oriented increment cores were sampled at the trunk, 1.3 m above the ground. 59 cores from 33 PJ trees were collected in November 2005. The slope of the sampling points was from 0 to 20.

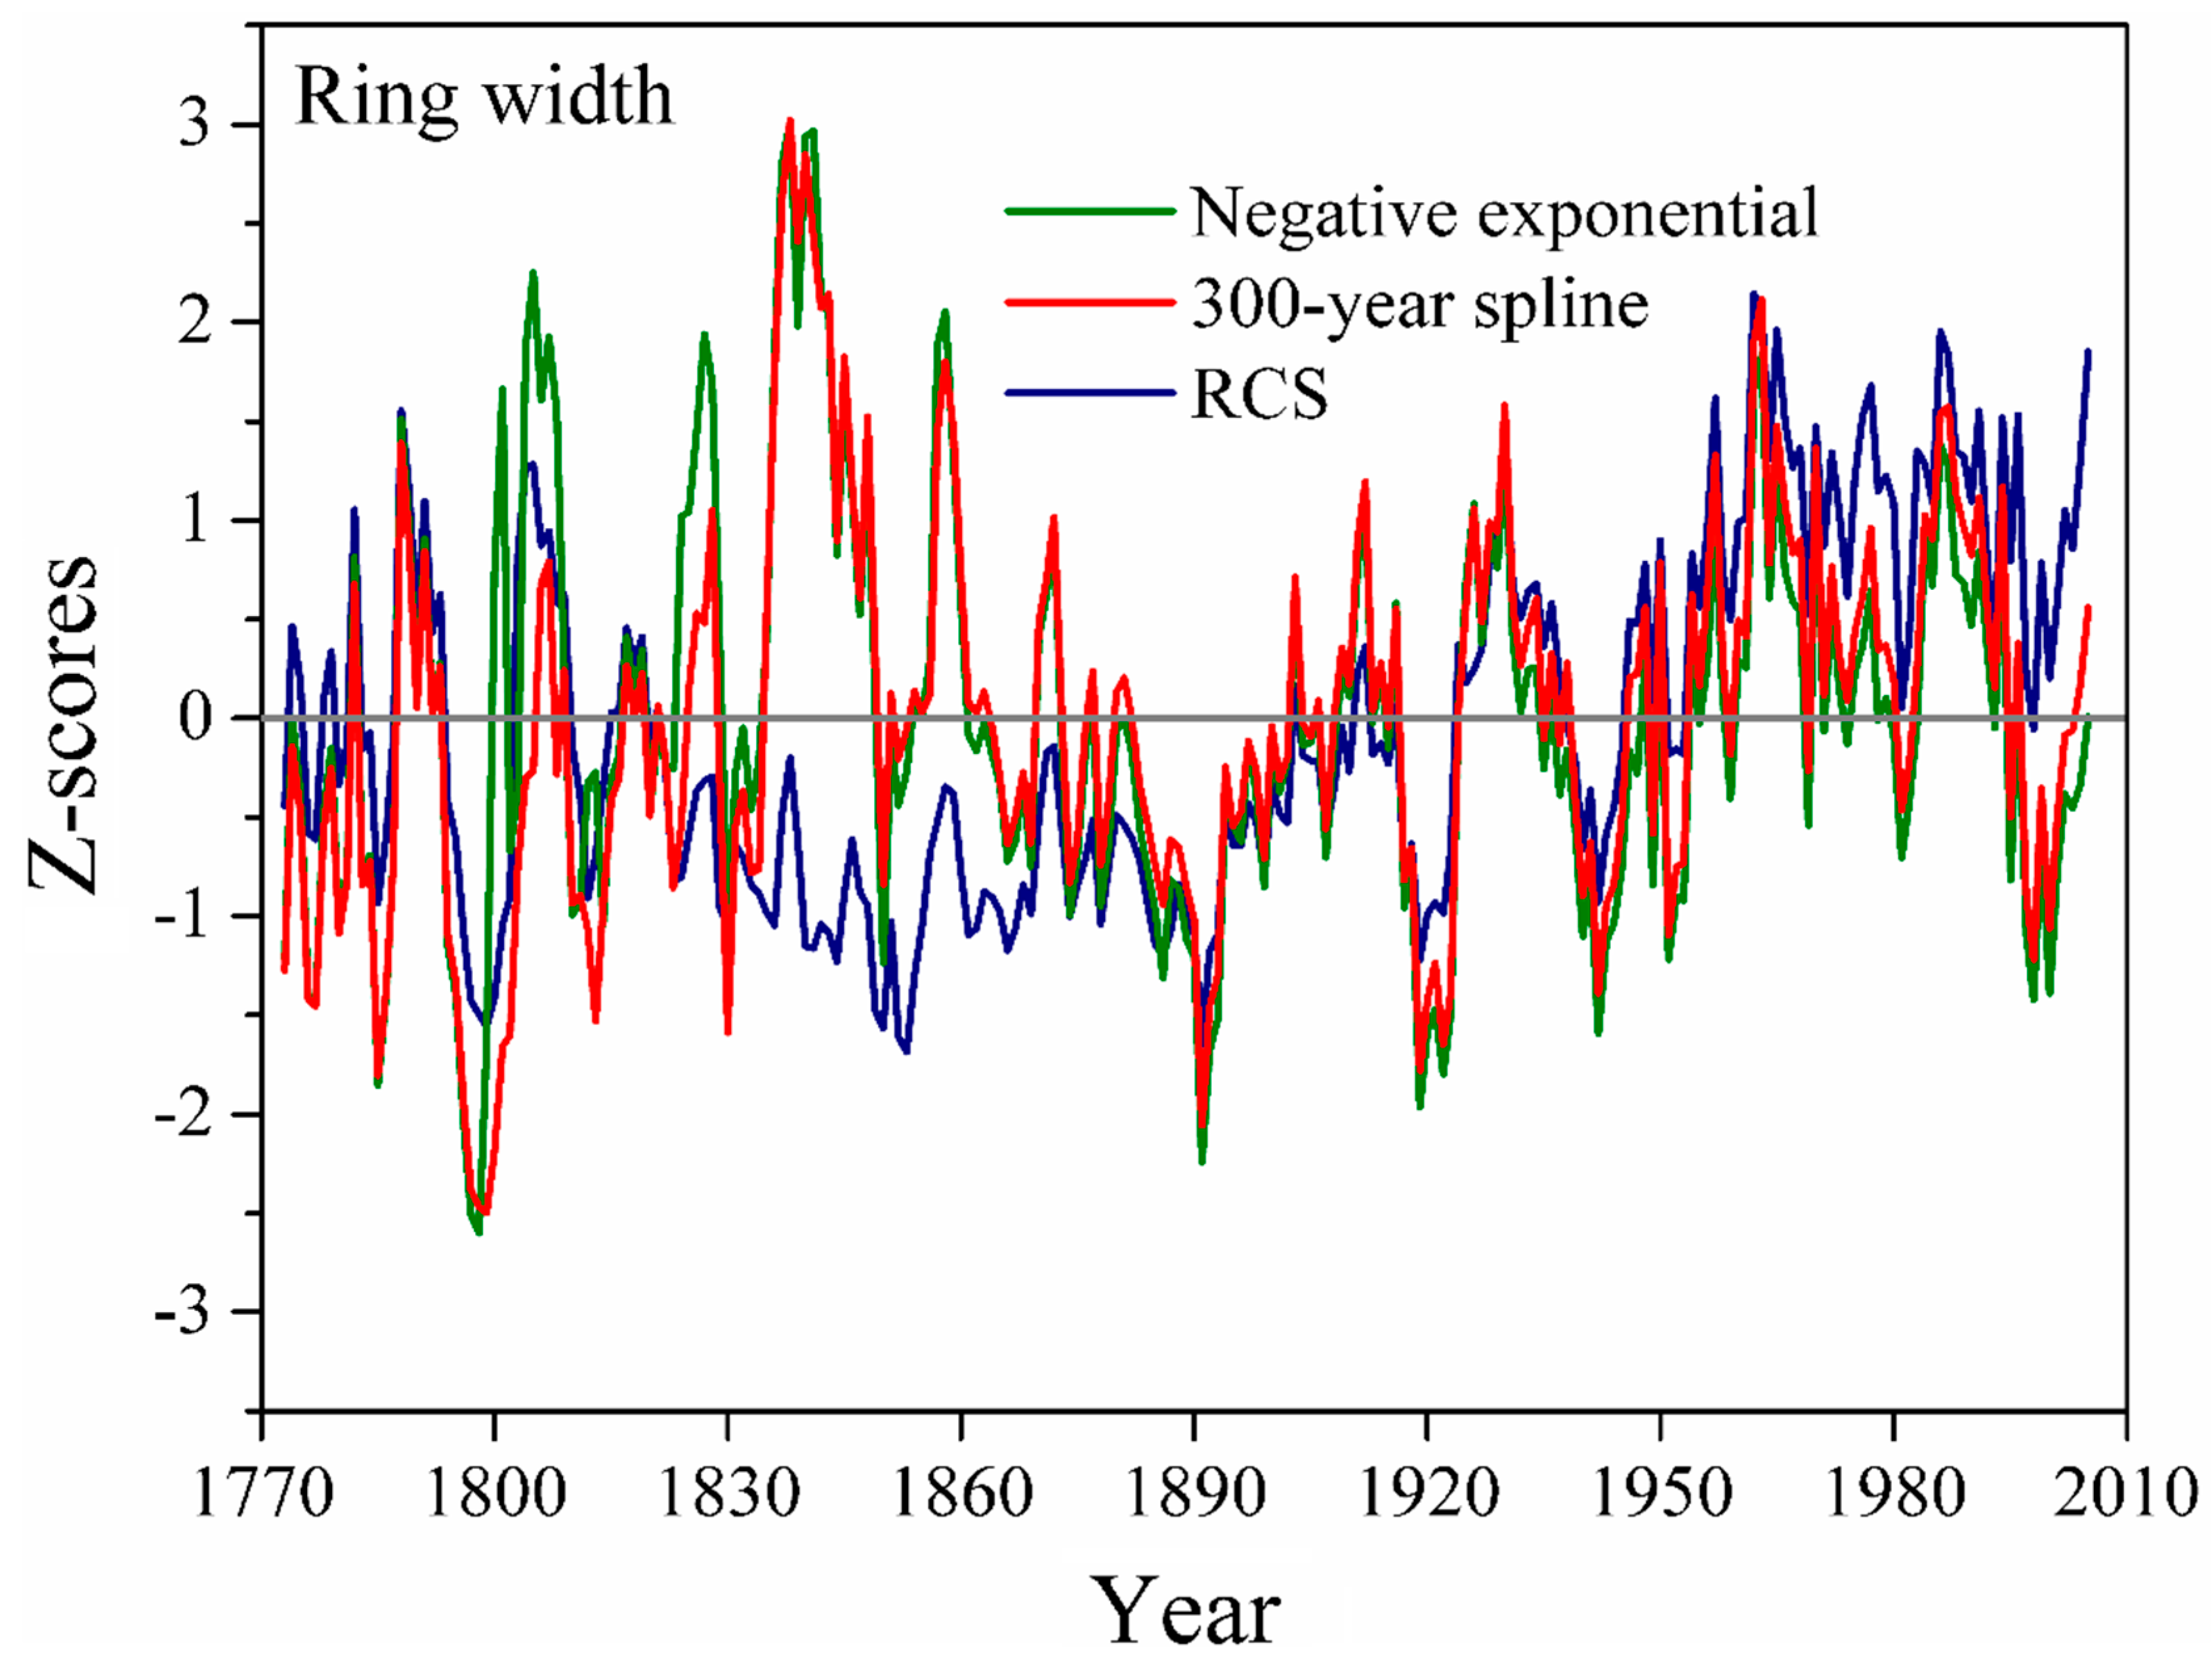
2.2. Development of Ring-Width Chronologies
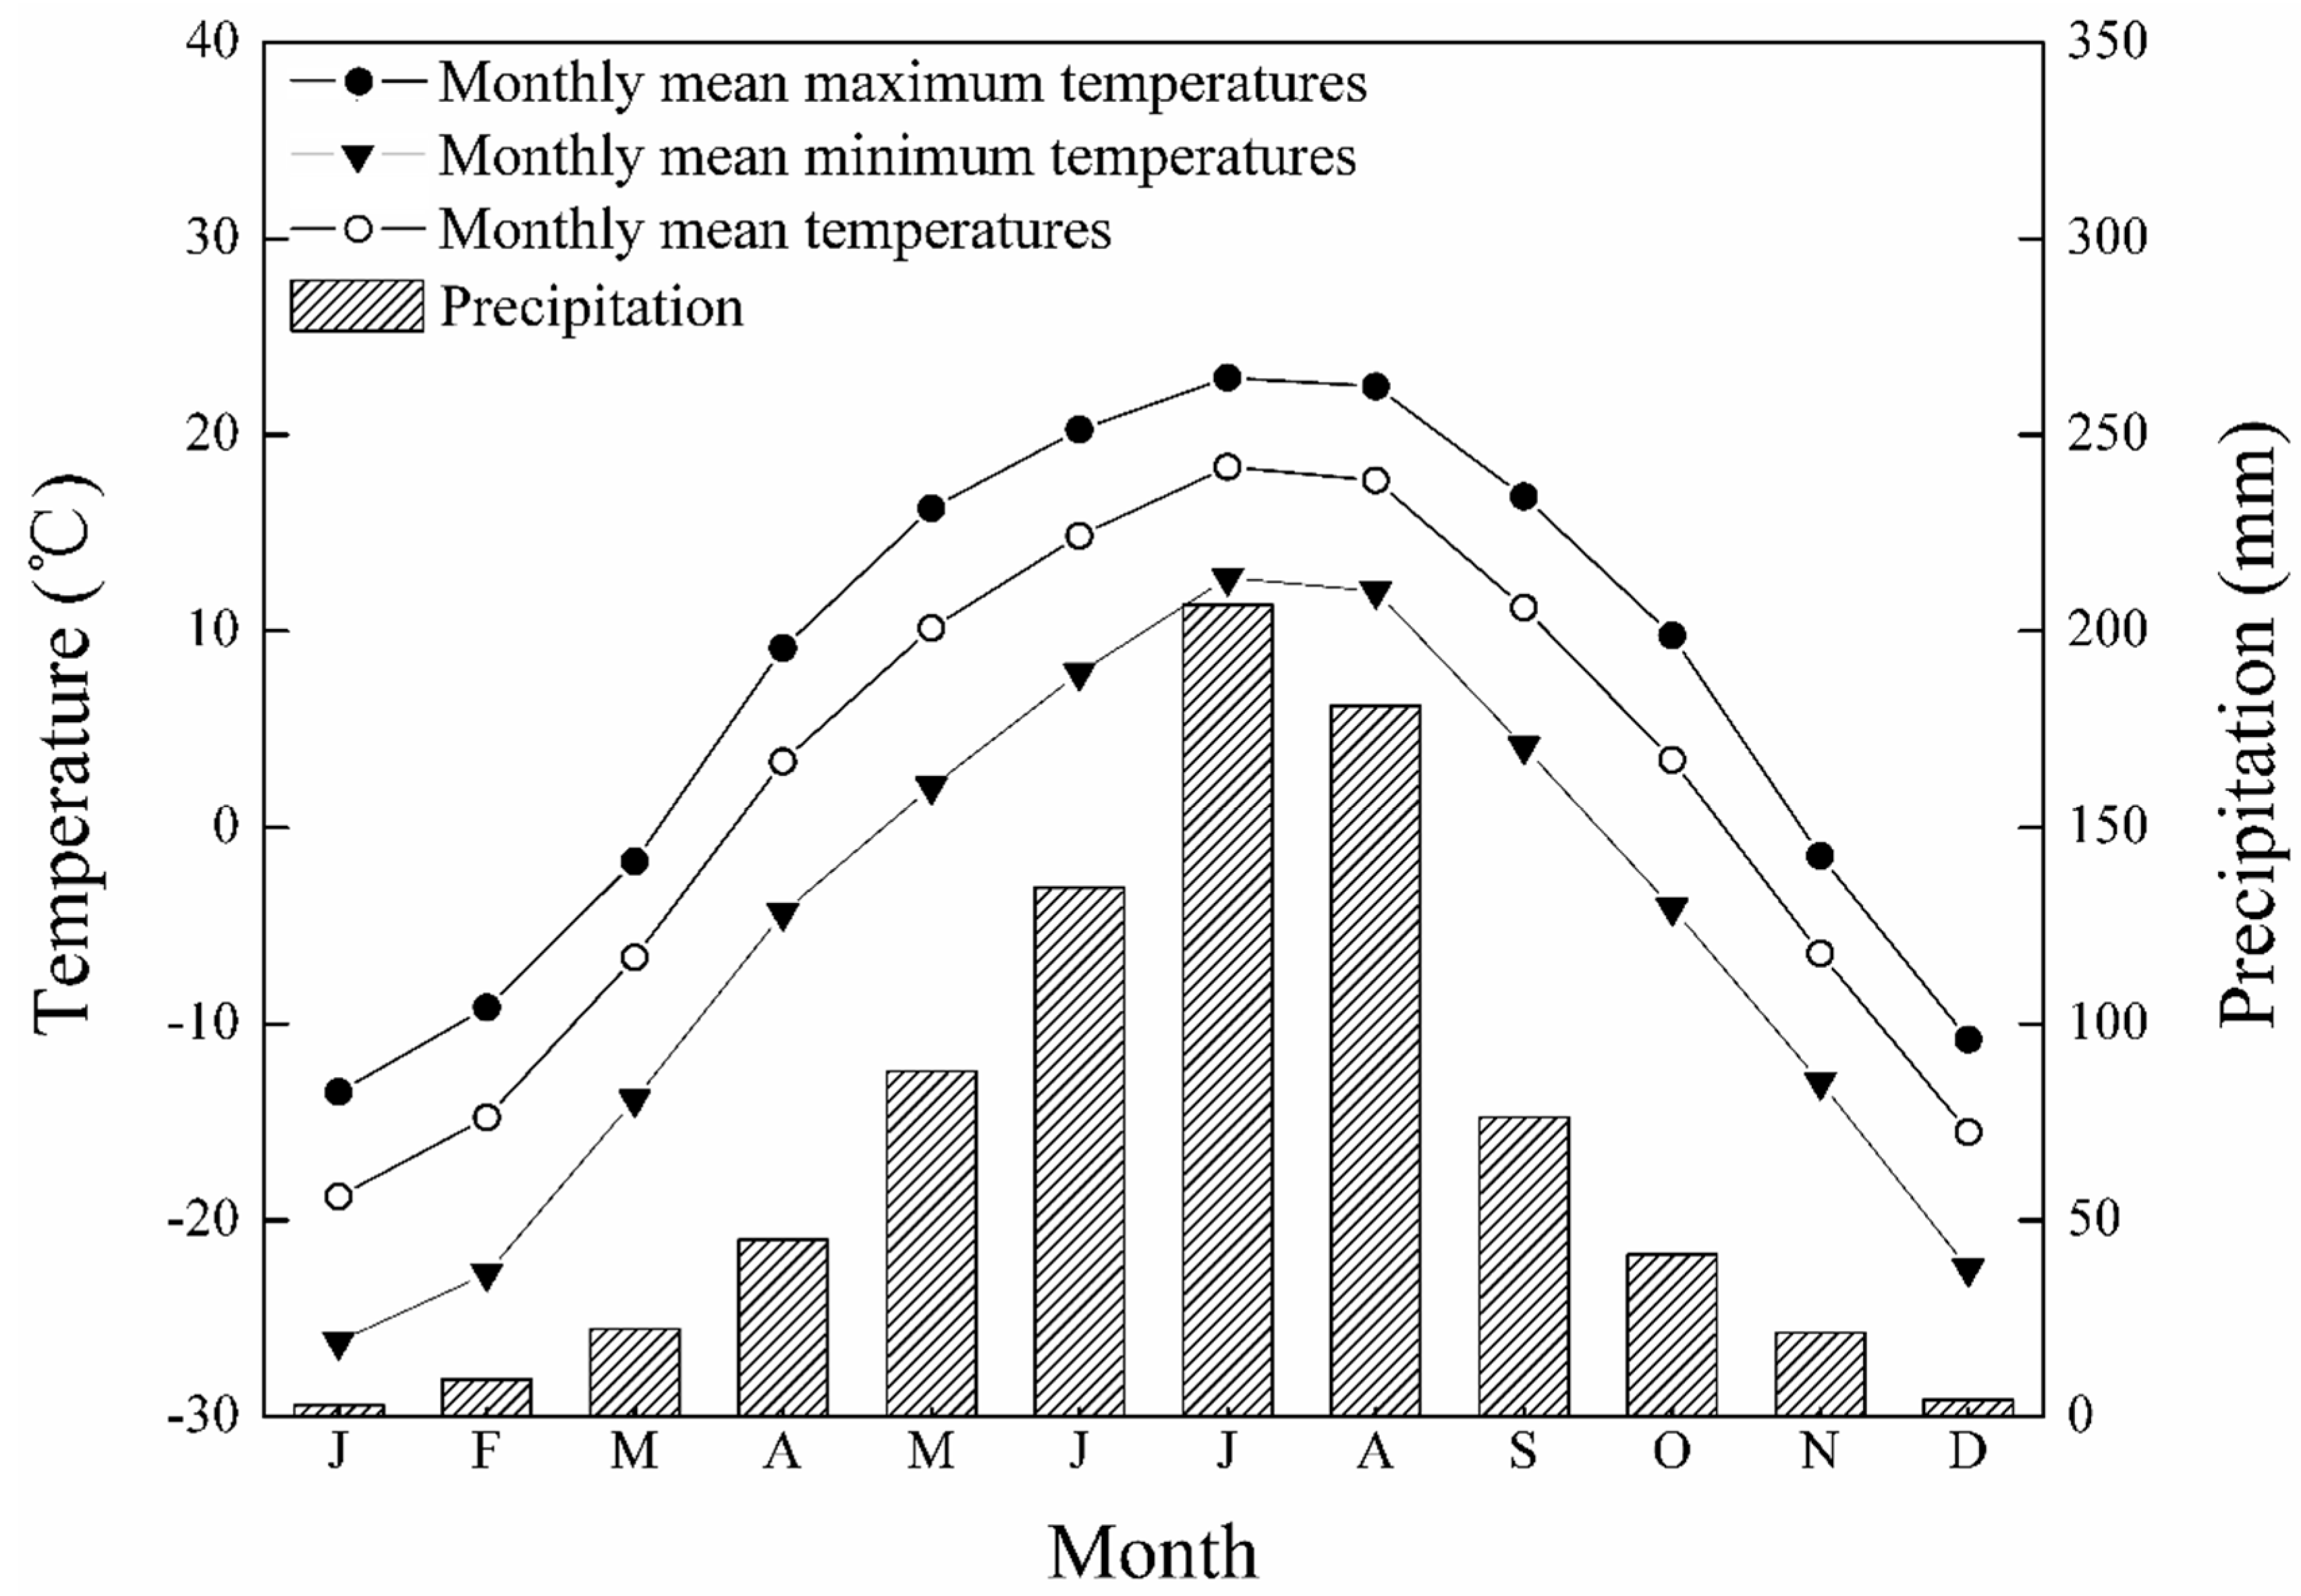
In the laboratory, the samples were pretreated, naturally air dried, glued to wooden holders, and then sanded with successively finer grits of sandpaper to highlight the tree rings [23,37,38]. The tree rings were cross-dated under a binocular microscope, and then the annual ring width was carefully measured using a Velmex measuring system interfaced with the Time Series Analysis Program (TSAP; Frank Rinntech, Heidelberg, Germany) with a resolution of 0.001 mm. The COFECHA program was used for quality control of the cross-dating and the measurements [38].
To eliminate the effects of stand dynamics, age, and any other non-climate-related growth variation, the cross-dated tree-ring data were detrended using three different techniques—negative exponential (EXP), regional curve standardization (RCS), and 300-year splines (SPL), via ARSTAN [37]. Each technique produced three chronologies, autoregressive (ARS), residual (RES), and standard (STD). The STD chronology with an EXP detrending was the best chronology because it contained more low frequency signals (Figure 3). Thus, the STD chronology from EXP was selected. The analysis was restricted to the period with an expressed population signal (EPS) > 0.85 to ensure the reliability of the chronology [39].

2.3. Climate Data

Meteorological data were collected from the Meteorological Stations in Erdao (42°24′ N, 128°16′ E, 591 m a. s. l.) and Tianchi (42°1′ N, 128°5′ E, 2623 m a. s. l.) in the Changbai Mountain area (CBM) (Figure 1a). The Mann–Kendall method [40,41] was applied to check the abrupt turning point of climate change. Monthly total precipitation (Prec), monthly mean minimum temperature (Tmin), monthly mean temperature (Tm), and monthly mean maximum temperature (Tmax) were used for the dendroclimatological analyses.

2.4. Statistical Methods

Growth/climate relationships were tested through the use of response functions and correlation analysis [42,43] to identify the best model for the climatic reconstruction (Figure 4a). Following this, a linear regression equation between tree-ring index chronology and climate data was calculated for the calibration period of 1959–2004. To check the stability of the relationship between tree-rings and temperature, the running correlation coefficient was calculated and the Mann-Kendall Test was applied (Figure 4b). The p-value associated with the Mann-Kendall test was statistically insignificant (tau = 0.122, two-sided p-value = 0.080289), suggesting the absence of a statistically significant upward/downward trend in the running correlation coefficient series. The statistical reliability of this model was verified by split sample calibration-verification tests [44]. All statistical analyses were performed using the commercial software SPSS12.0 (SPSS, Inc., Chicago, IL, USA). Spectral analysis can be used to extract the non-random signals stored in time series [23]. To explore the possible mechanisms affecting climate variability in this region, the frequency domain of the reconstructed series was examined through the multi-taper method (MTM) spectral analysis [45] (MTM software can be downloaded at http://www.ldeo. columbia.edu/res/fac/trl/). Additionally, spatial correlations between our reconstruction and the gridded CRUTS 4.01 temperature pattern from 1959 to 2004 were calculate based on the KNMI climate explorer (http://climexp.knmi.nl). This was done to assess the spatiotemporal representativeness of the reconstruction. The spatial correlations between the reconstructed temperature series in June–July and the June–July averaged HadlSST11° (Sea Surface Temperature from a grid temperature of 1 degree by 1 degree) were estimated during the period of 1870–2004 (http://climexp.knmi.nl).

3. Results

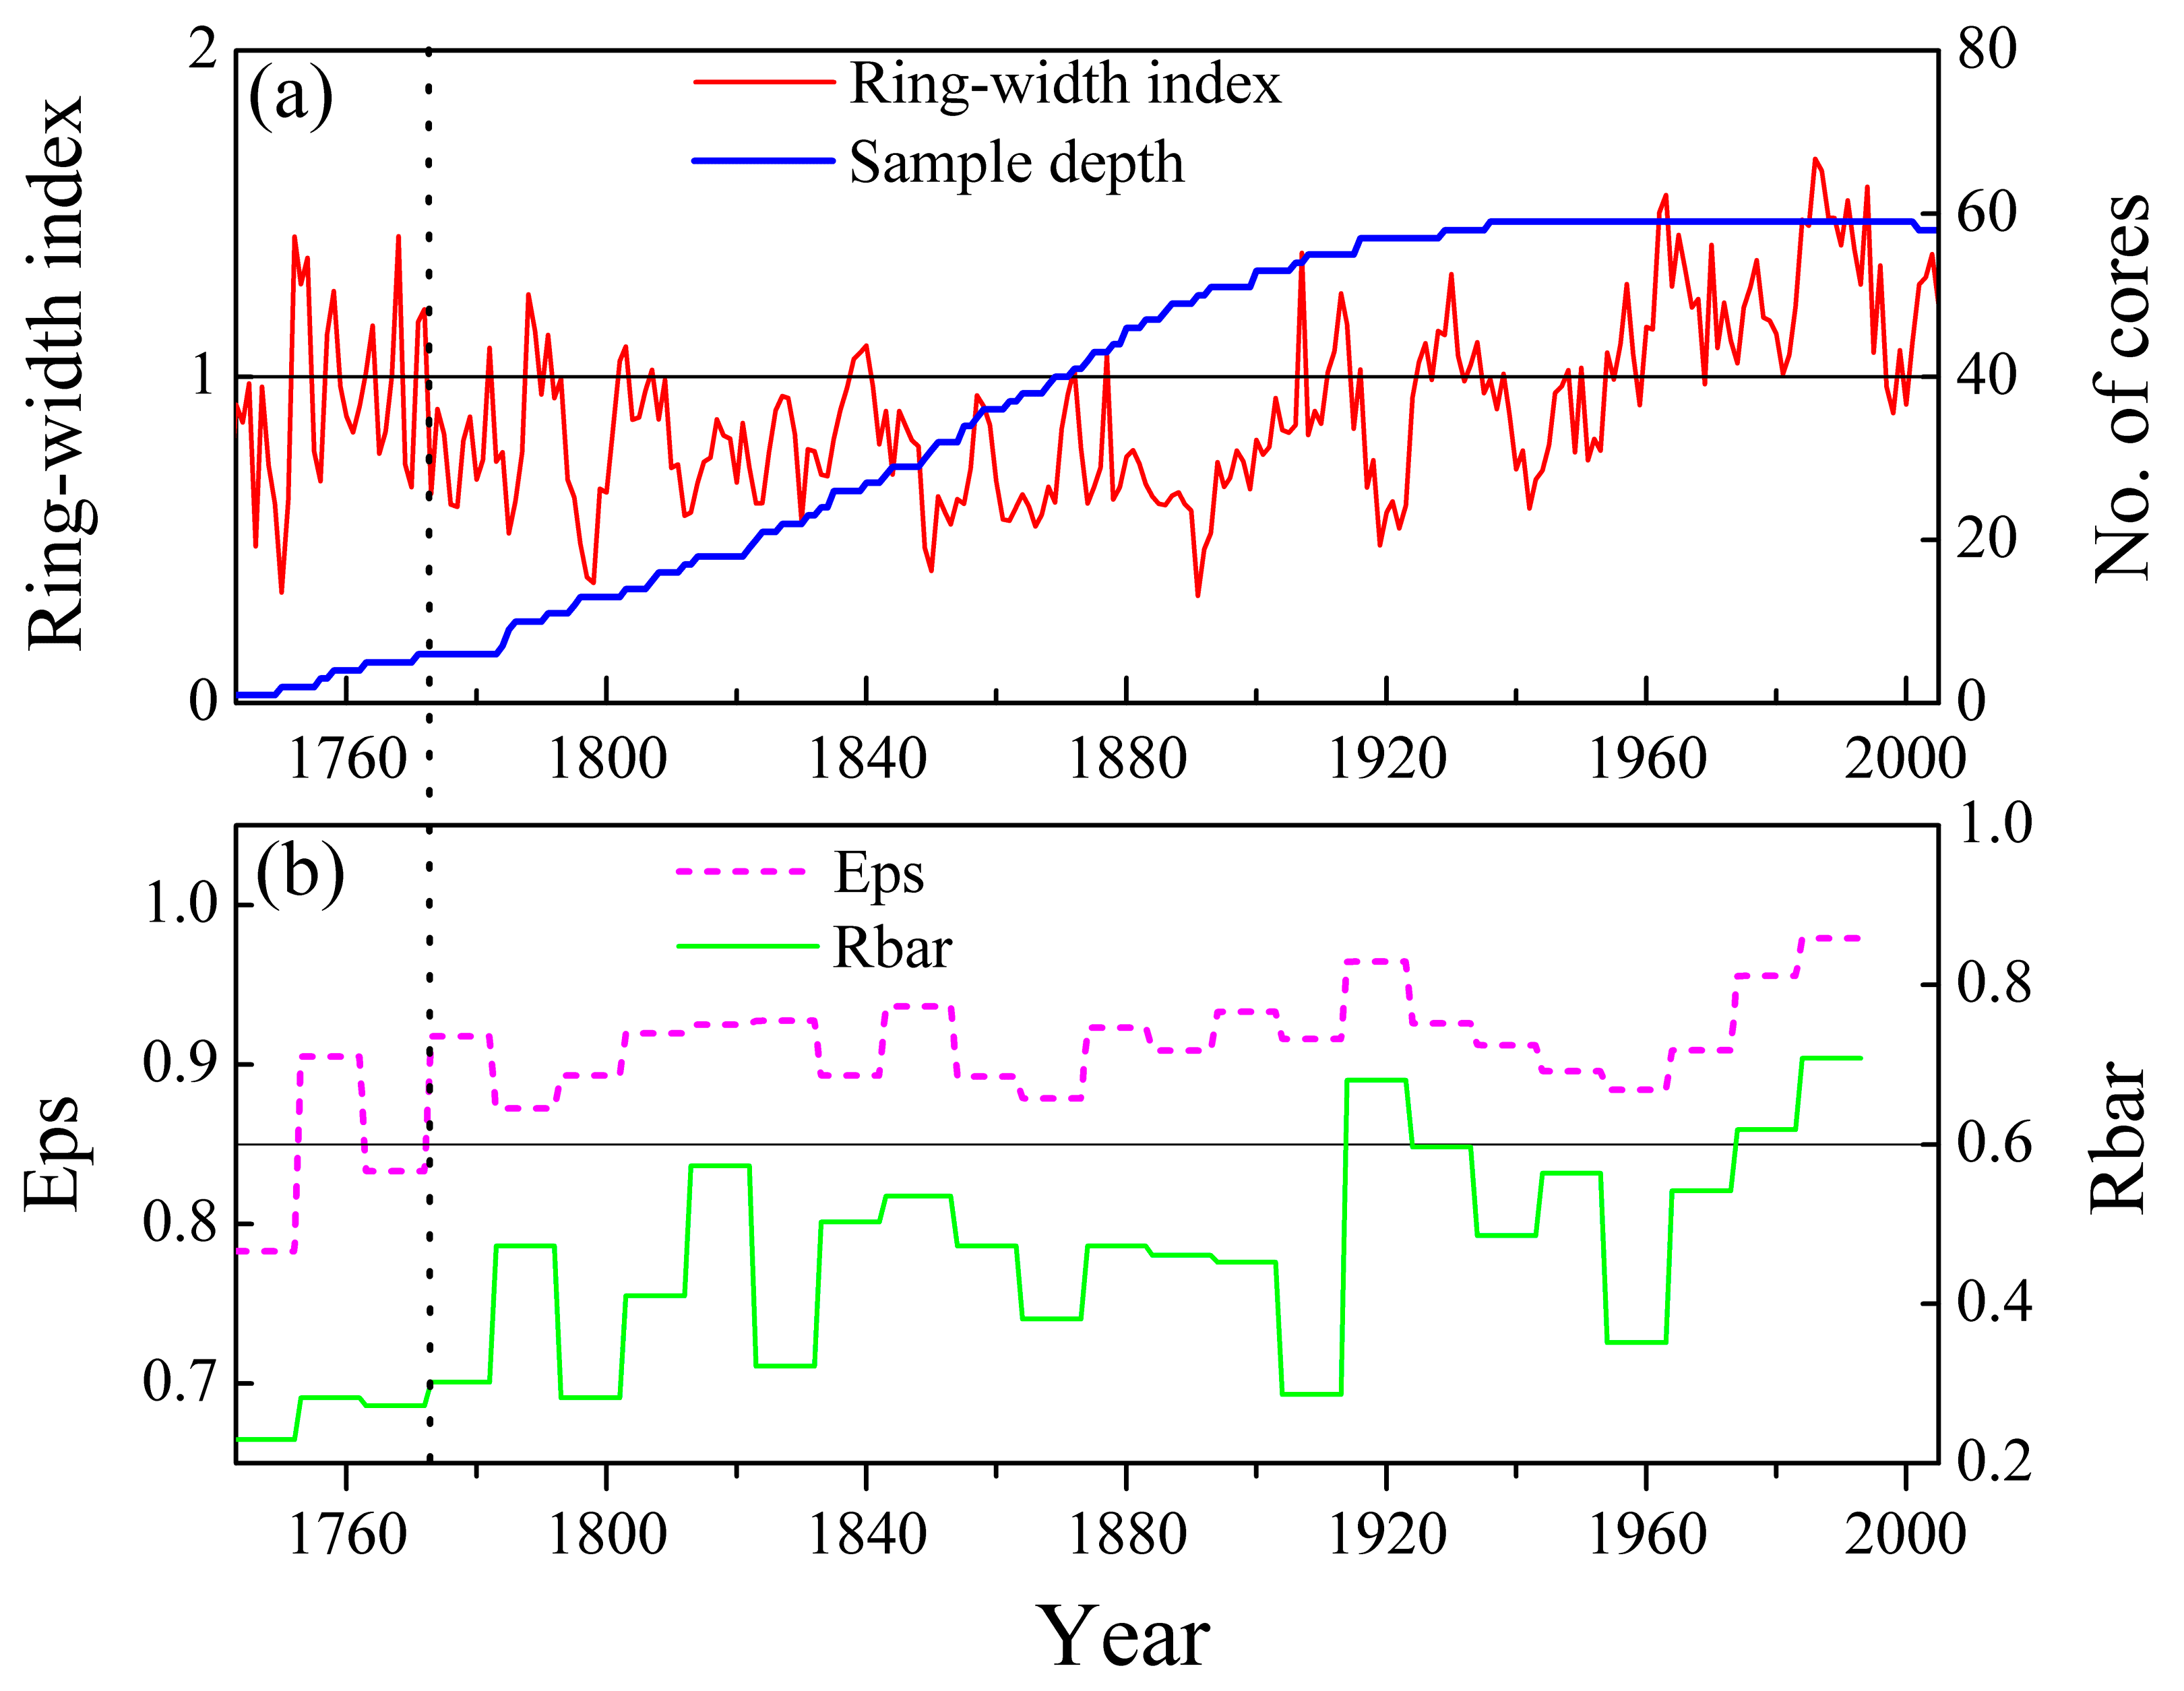
3.1. Chronology Statistics

The chronology statistics are shown in Table 1. The mean ring width (MRW) was 0.89 mm. The standard deviation (SD) was 0.15. The mean sensitivity (MS) of the STD chronology was 0.32, revealing that the chronology showed inter-annual variation and contained strong environmental signals. The first order autocorrelation was 0.68. The average correlation within a tree was 0.69 and the signal-to-noise ratio (SNR) was 4.6, revealing that the common growth limiting signals were contained in the tree-ring series. To ensure the validity and reliability of the reconstructed series, an EPS threshold value of 0.85 was employed to assess the most credible time span of the STD chronology. The threshold was met by a sample depth of six trees and a period of 1773–2005 (Figure 5).

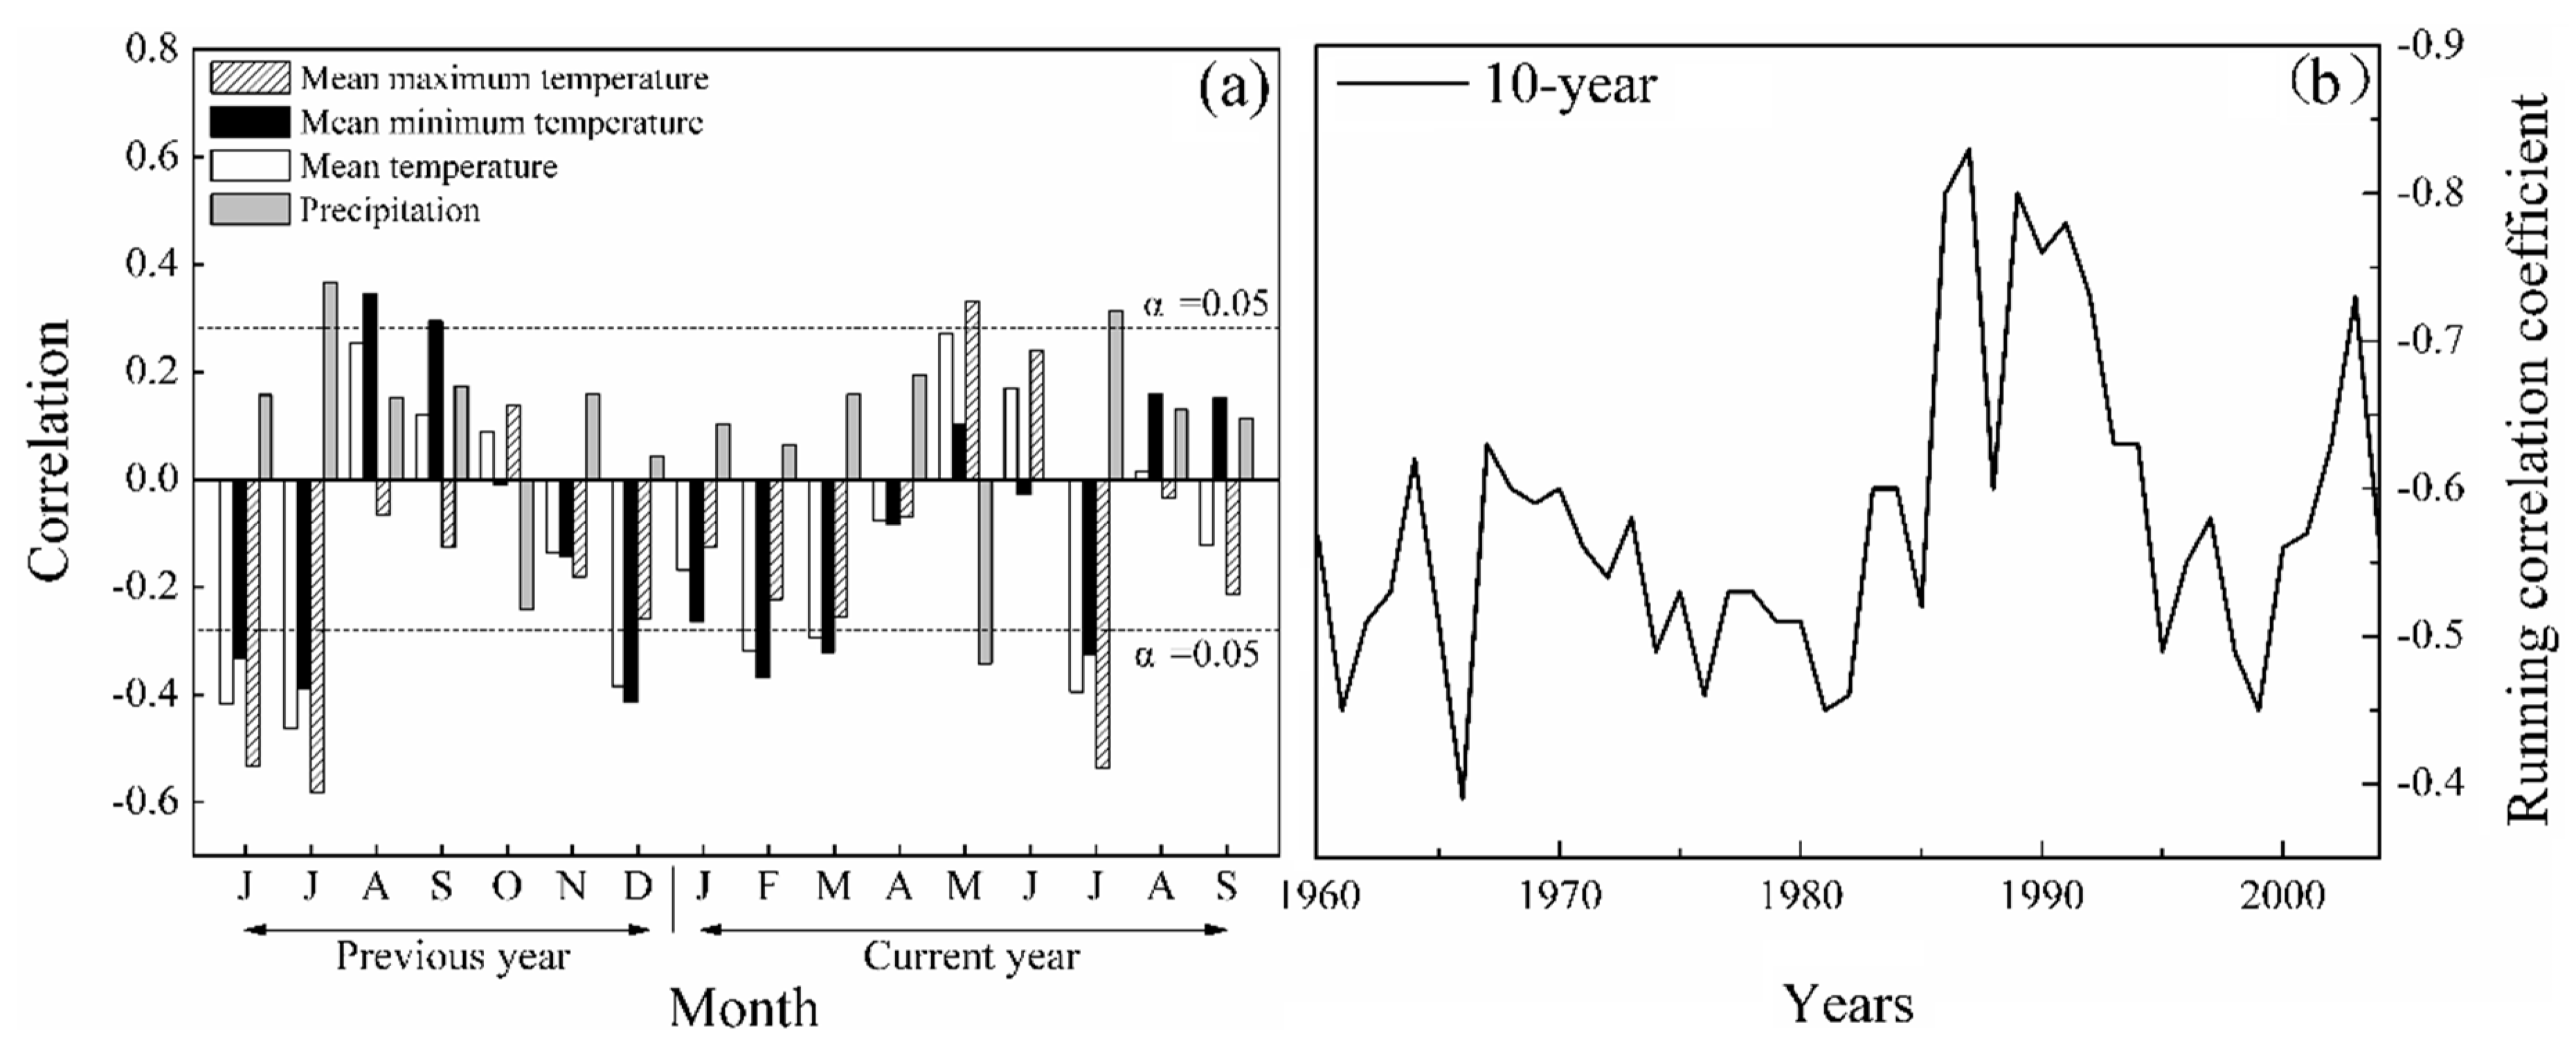
3.2. Growth/Climate Responses

The monthly mean temperatures and precipitation were used to compute the correlation coefficient between the tree-ring width index and climate variables from 1960 to 2005 (Figure 4a). The correlation analysis used climate data from the previous June and the current September. The significant negative correlations (p < 0.05) between the STD chronology and temperatures in the previous year June–July and current year July were found. The tree-ring width indices also showed significant negative correlations (p < 0.05) with the Tmin and Tmean from December of the previous year and February–March of the current year. Meanwhile, the previous August–September Tmin and current May Tmax were found to be significantly positively correlated with the radial growth of PJ. In addition, the radial growth of PJ had a significant positive correlation with the July precipitation of the previous year/the current year (p < 0.05), and had a significant negative correlation with the precipitation of May of the current year. After examining the different combinations of months, it was found that the correlation between the ring-width indices and monthly mean maximum temperature from June to July of the previous year was the best (Table 2). Therefore, the monthly mean maximum temperature from June to July of the previous year was reconstructed, using the PJ chronology.

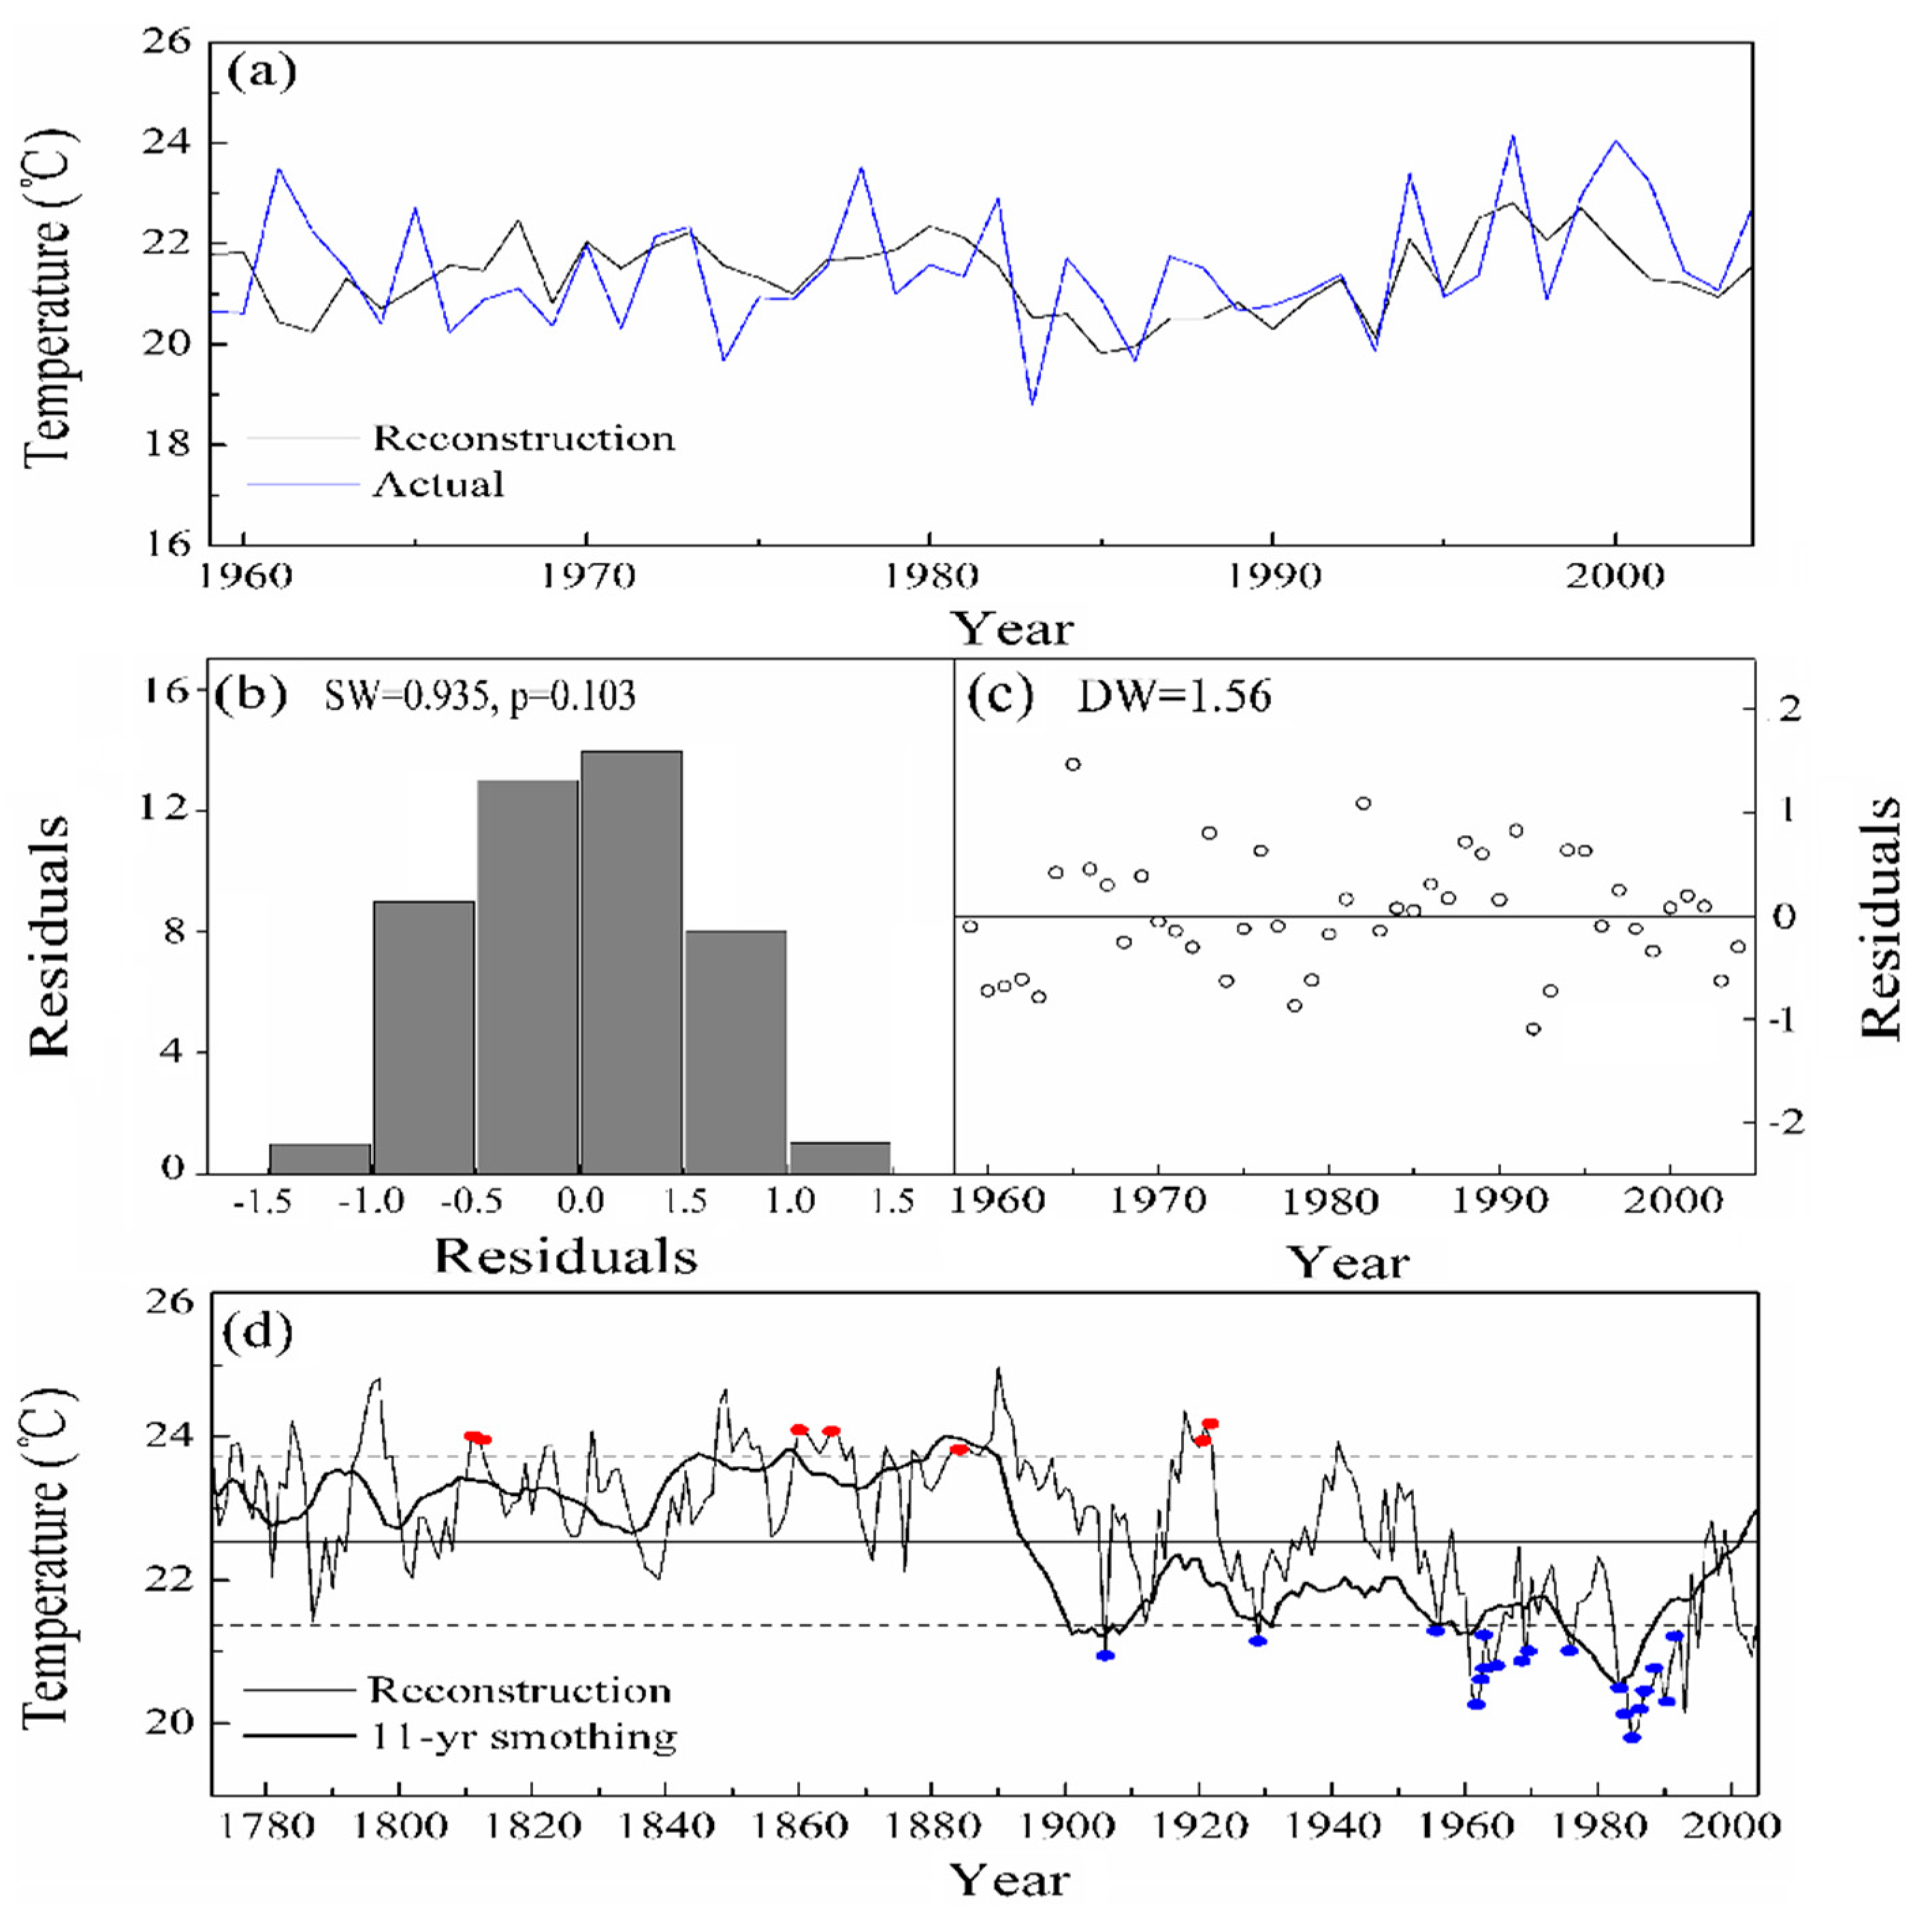
3.3. Maximum Temperature Reconstruction

A linear regression model was used to describe the relationship between the tree ring width and the mean maximum temperature from June to July of the previous year. The parameters of the model were derived from results obtained by the correlation analysis. The model was designed as follows:
PTmax6-7 = 26.22 − 3.84× Xt,
where PTmax6–7 is the mean maximum temperature from June to July of the previous year and Xt is the ring-width index of the Changbai Mountain (CBM) chronology at the t year. For the calibration period (1959–2004), the reconstruction accounted for 42.0% of the actual Tmax6–7. Running correlation analysis showed that the tree-ring proxy/climate relationship was stable over the entire calibration period (Figure 4b). The overall split calibration-verification tests indicated this model was acceptable (Table 3). The Durbin–Watson (DW) test was applied to analyze the residuals of the reconstruction, ranging from 1.50 to 1.72, suggesting that there is no linear trend or significant autocorrelation in the residuals (Figure 6b,c; Table 3). The positive coefficient of efficiency (CE) and reduction of error (RE) values (Table 3) revealed that model (1) was stable and reliable. These analyses demonstrated that this regression model was valid for temperature reconstructions.

3.4. Temperature Variability from AD 1772 to 2004

Based on model (1), the reconstructed Tmax6-7 series during 1772 and 2004 in the CBM area showed a mean of 22.81 °C and a standard deviation of σ = 1.03 °C (Figure 6d). We defined Tmax6–7 ≥ 23.84 °C (Mean+1σ) and Tmax6–7 ≤ 21.78 °C (Mean-1σ) as the threshold values for determining the warm years and cold years, respectively [27,47]. Based on these criteria, the reconstructed Tmax6–7 series contains 36 warm years and 34 cold years (Table S1 of the Supplementary Materials). The cold and warm years accounted for 16.4% and 14.4%, respectively. The 11-year smoothing average of the reconstructed Tmax6–7 series was used to reveal low-frequency information and to show temperature variability in this area (Figure 6d). After smoothing with an 11-year moving average, cold periods occurred in 1899–1913 (average value was 21.41 °C), 1955–1970 (21.49 °C), and 1975–1989 (20.97 °C), while warm periods occurred in 1881–1888 (23.93 °C) (Figure 6d, Table 4). Furthermore, there are six obvious processes of Tmax6–7 increasing in 1781–1791 (from 22.76 °C to 23.54 °C), 1800–1809 (from 22.72 °C to 23.44 °C), 1835–1845 (from 22.66 °C to 23.76 °C), 1900–1919 (from 21.47 °C to 22.30 °C), 1931–1942 (from 21.36 °C to 22.04 °C), and 1983–2004 (from 20.49 °C to 22.99 °C), and five obvious processes of Tmax6–7 decreasing in 1790–1800 (from 21.89 °C to 22.98 °C), 1810–1835 (from 23.40 °C to 22.66 °C), 1880–1901 (from 23.83 °C to 21.25 °C), 1917–1931 (from 22.36 °C to 21.36 °C), and 1970–1983 (from 21.75 °C to 20.49 °C) (Figure 6d). In addition, the temperatures during 1780–1890 were much warmer (average value was 23.35 °C) than the temperatures during 1900–2004 (average value was 21.65 °C) (Figure 6d).

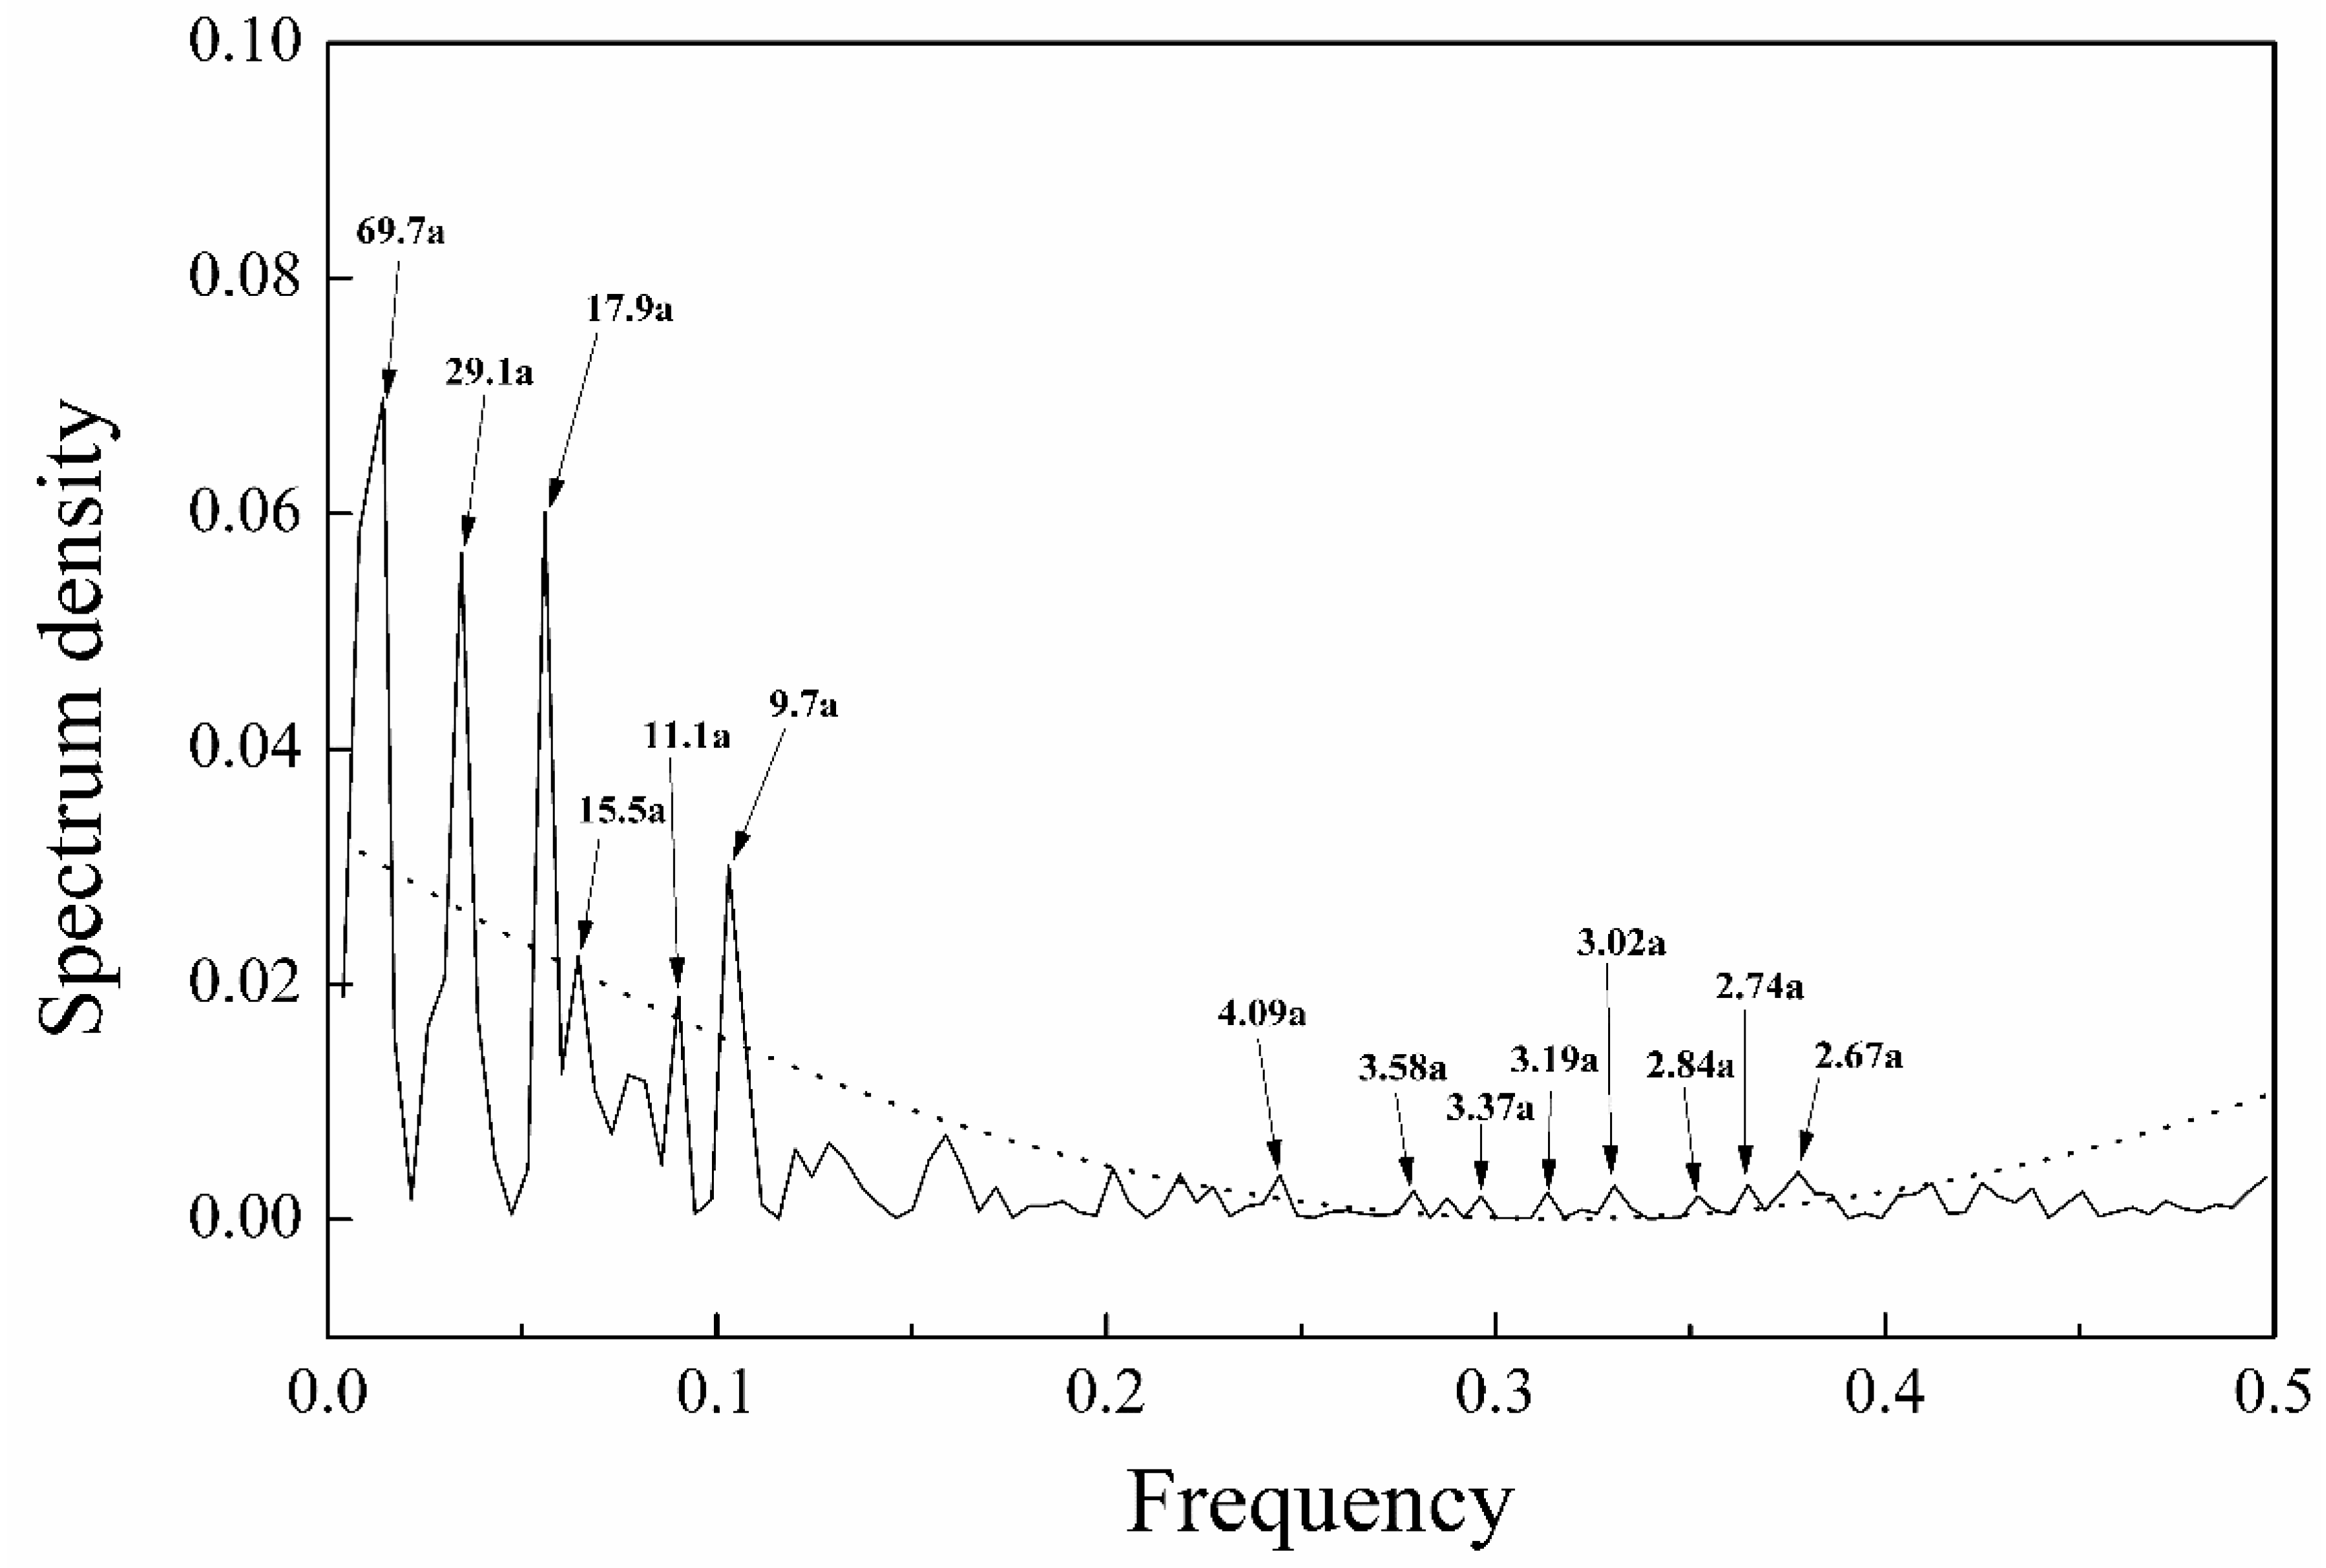
3.5. The Result of Periodicity Analyses

The multi-taper method (MTM) spectral analysis revealed that the Tmax6–7 reconstruction had 69.7-, 29.1-, 17.9-, 15.5-, 11.1-, 9.7-, 4.09-, 3.58-, 3.37-, 3.19-, 3.02-, 2.84-, 2.74-, and 2.67-year quasi-cycles over the past 233 years at the 95% confidence level (Figure 7).

4. Discussion

4.1. Physiological Significance of June–July Maximum Temperature

The correlation analysis showed that the higher summer temperature in the previous year (June–July) was the key factor limiting the radial growth of Picea jezoensis (PJ) in the Changbai Mountain (CBM) area, which indicates that the previous summer has a significant hysteresis effect on the radial growth of the PJ. The results of this study were consistent with the results of studies on Pinus tabulaeformis Carr in the Taihe Mountain area [48] and Larix sibirica in the Altai region of Mongolia [49]. The hot summer temperatures might limit the growth of PJ, which may be due to the increased forest respiration and/or evaporation of soil moisture [3]. During the high temperature period, the evaporation of soil moisture was greater than the precipitation, resulting in a deficit in the soil moisture, and thus the water requirements for the tree growth cannot be met [3,27]. The lack of water could lead to the closure of some stomata in the leaves, and then the photosynthetic activity would be weakened [27]. Meanwhile, the respiration consumed more accumulated matter, leaving less nutrients storing for the growth of the next growing season, which is then not available for the growth of trees in the following year [3,50].

4.2. Temperature–Rainfall Relationships and Comparision with Historical Document Records in Jilin Province

Drought is caused not only by a decrease in precipitation but also by an increase in temperature. Under normal precipitation conditions, high temperatures can cause severe droughts, while precipitation is accompanied by low temperatures [27,51]. Historical documents showed that drought or flooding events have occurred in Jilin Province since 1772 [46]. Extreme drought events were in good agreement with seven high-temperature years (1811, 1812, 1860, 1865, 1885, 1919, and 1921), and flooding disaster events were in good agreement with fifteen low-temperature years (1929, 1961, 1962, 1964, 1965, 1969, 1976, 1983–1985, and 1987–1991) in the reconstructed Tmax6–7 series (Figure 6b, Table S2 of the Supplementary Materials) [46].
Two severely cold years in the periods from 1953–1974 and 1980–1993 in Heilongjiang Province were captured in this reconstructed series (Figure 6d) [52]. The significantly low temperature years from 1953 to 1974 coincided with a slight decrease in solar activity (Figure 6d) [53]. The warm periods occurred from 1790–1800, 1845–1855, and 1857–1867 and were consistent with other results of tree-ring reconstructions in northeast China [54,55,56]. In addition, from 1780 to 1890, the average maximum temperature of June–July was higher compared to the period from 1900 to 1980. This temperature change may be related to the precipitation in the growing season (GS). The flood disasters in the GS of Jilin Province before 1800 were relatively small, occurring once every 5 years. The frequency and severity of flooding in 1801–1900 increased, once every 3.5 years; the frequency of floods during the period from 1901 to 1990 was 2.8 years [46]. Therefore, these results indicate that the reconstructed Tmax6–7 data was consistent with the historical records of the past 233 years.

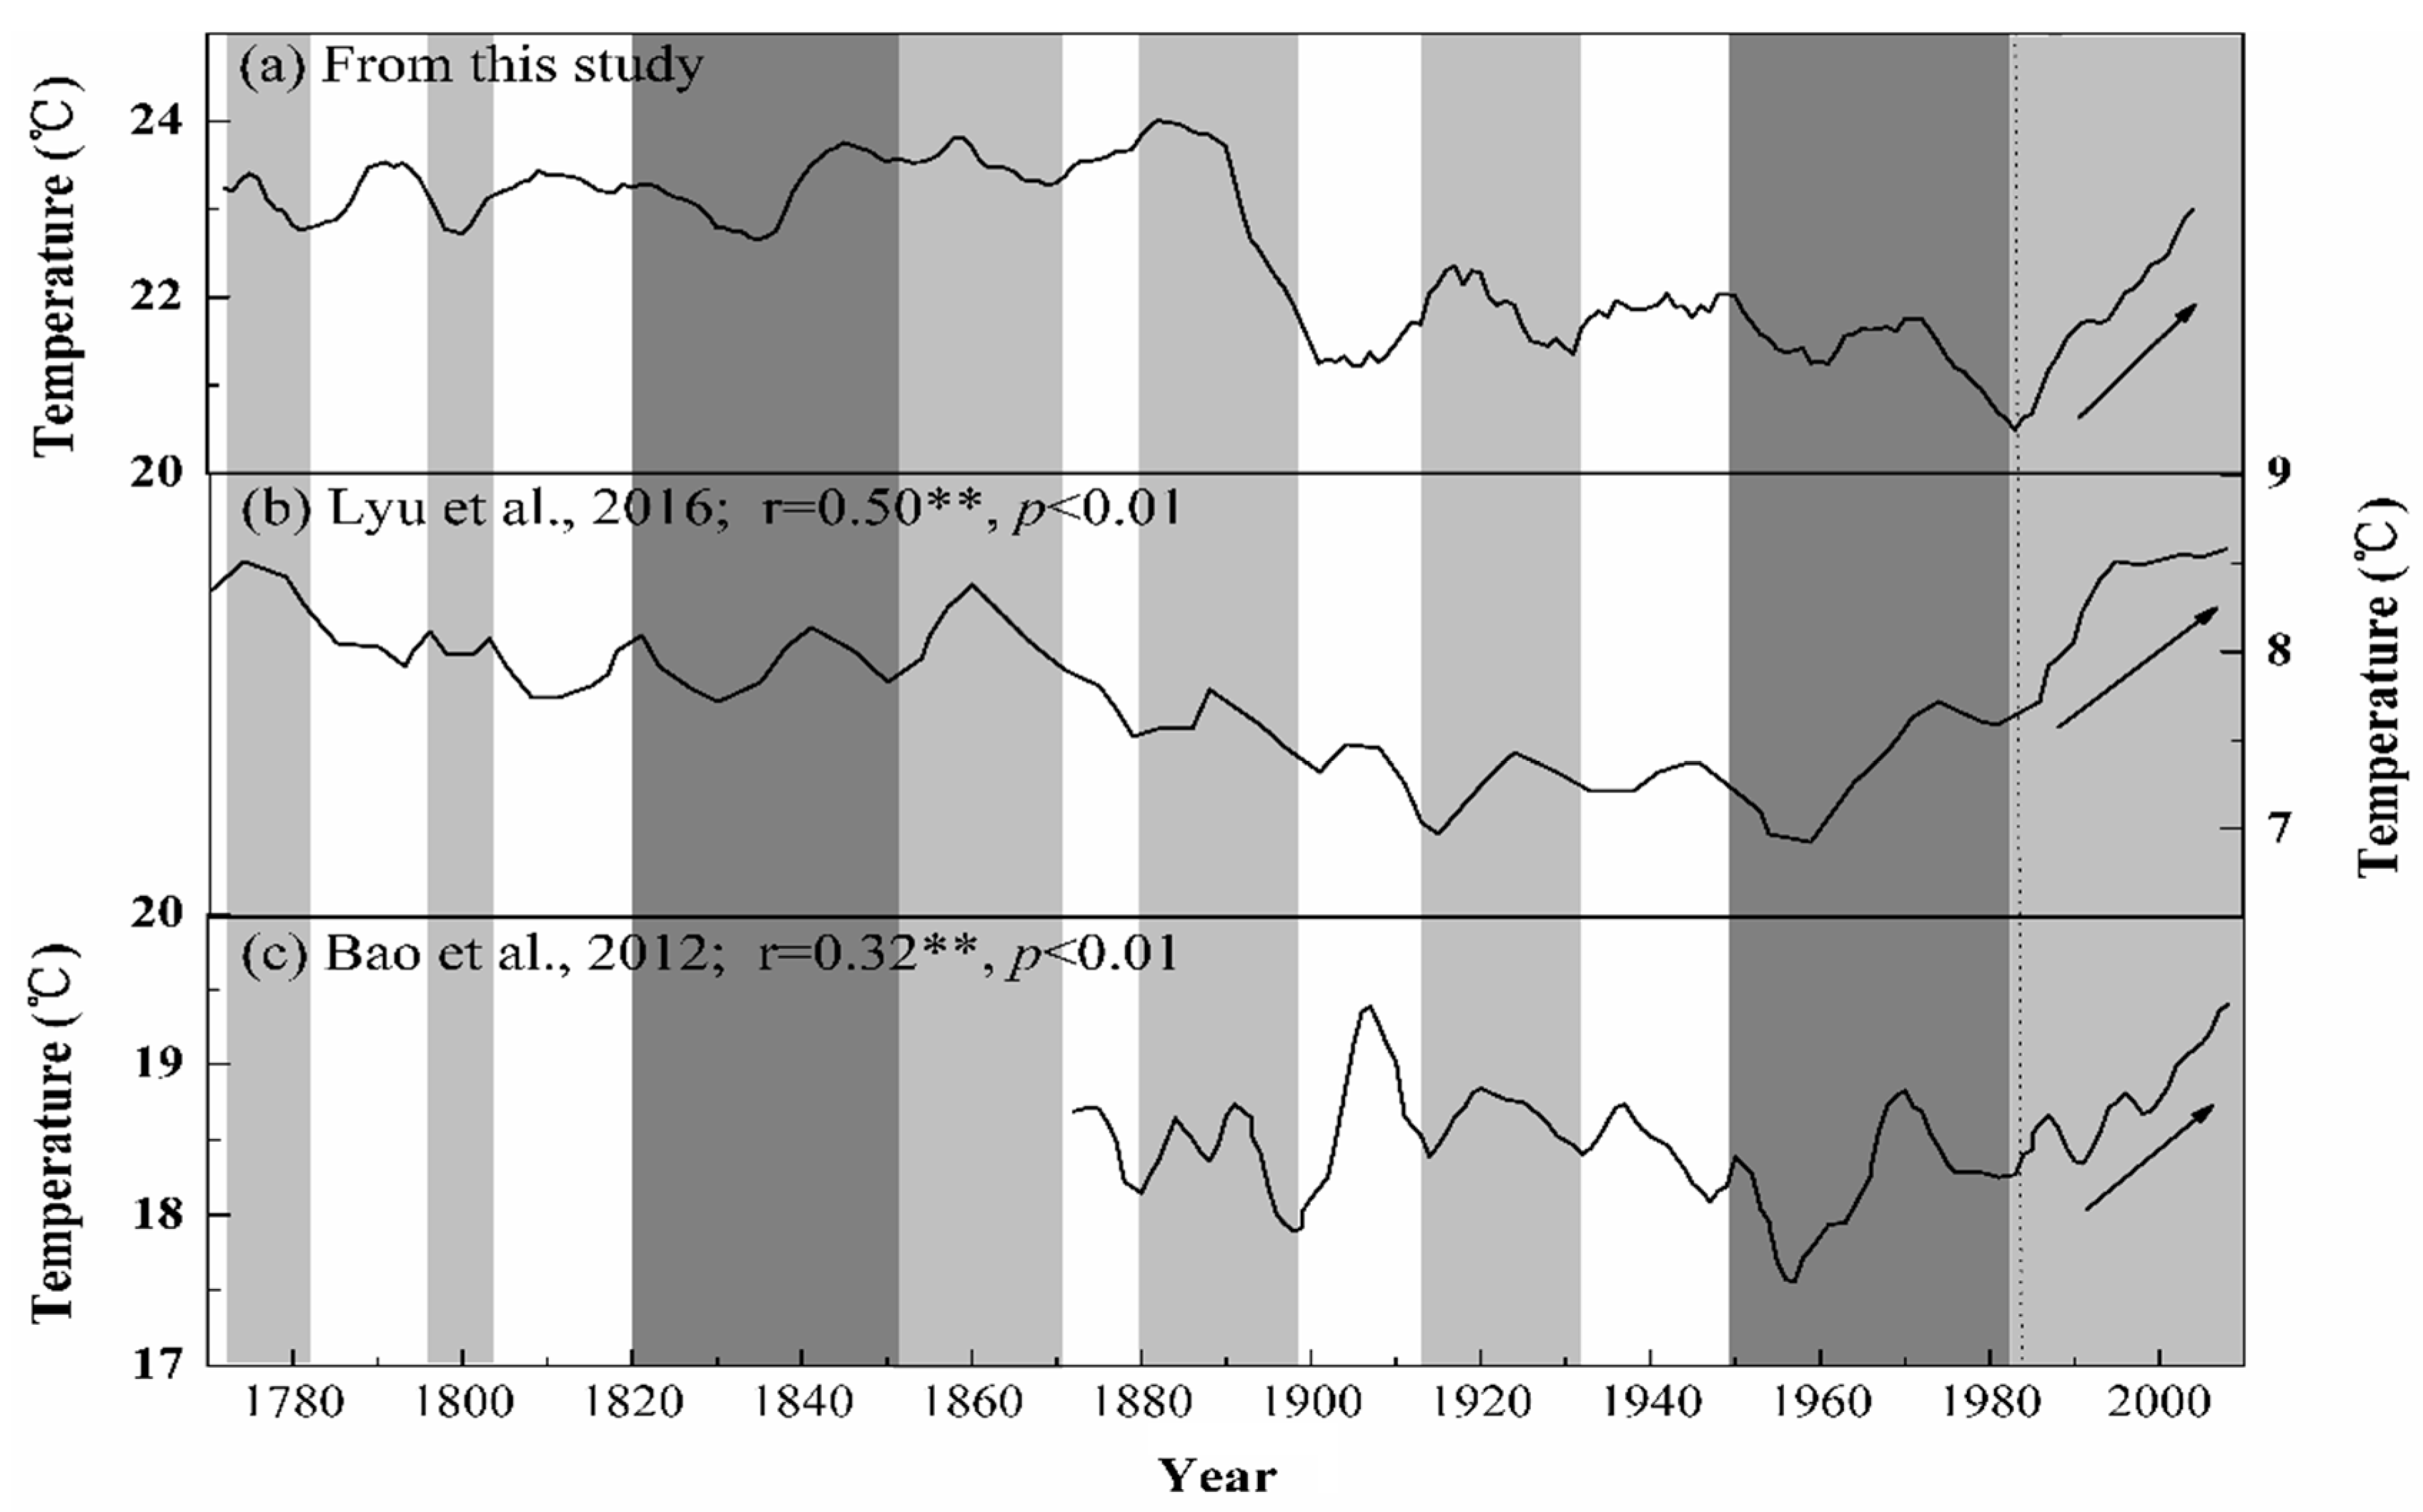
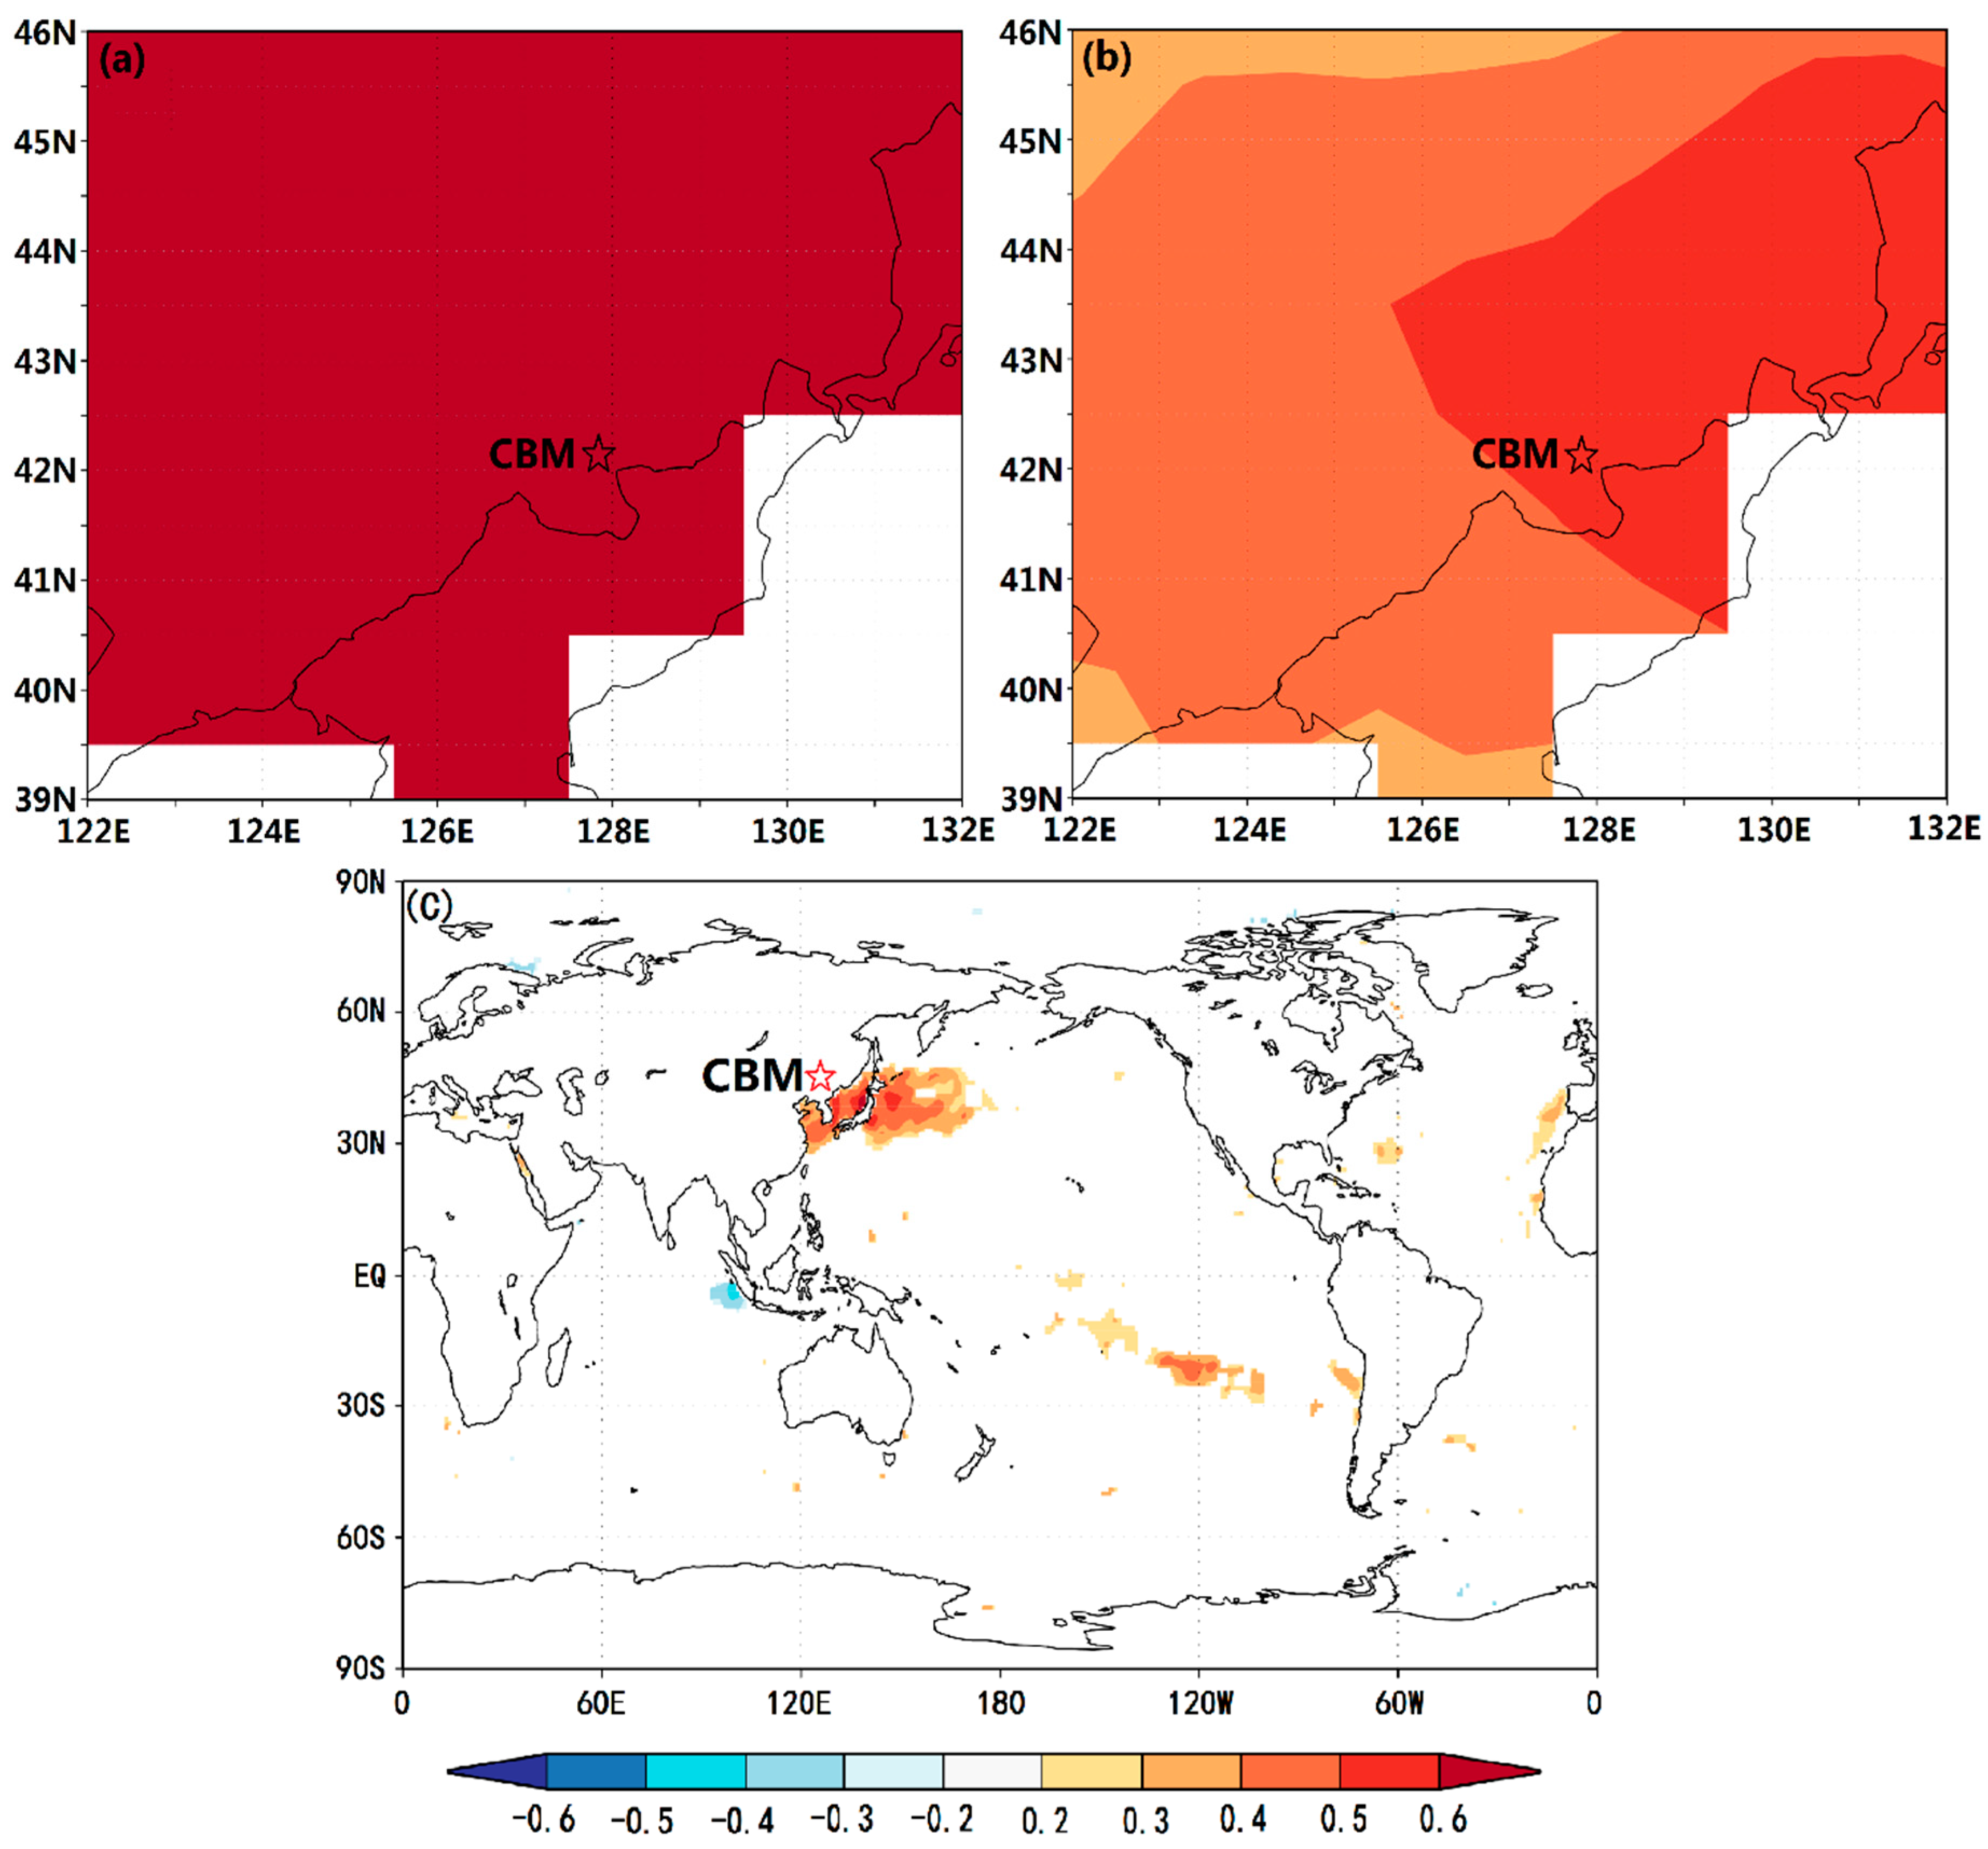
4.3. Regional- to Large-Scale Comparison

We compared the Tmax6–7 series in CBM with nearby tree-ring-based reconstruction temperature series in Laobai Mountain (LBM) (Figure 8b) [36] and Hailar (HLE) (Figure 8c) [27] to further test the validity of the reconstruction, and investigated the characteristics of climate variation in the study area of the CBM region (all three sites shown in Figure 1). A significantly positive correlation (r = 0.50, p < 0.01) between the reconstructed Tmax6–7 series (Figure 8a) and the reconstructed April–July temperature series in LBM (Figure 8b) was found, while our reconstruction of the Tmax6–7 had similar variations to the reconstructed April–September temperature series in HLE (r = 0.32, p < 0.01) (Figure 8c). The trend of temperature changes for some time intervals (1774–1784, 1823–1842, 1845–1870, 1888–1900, 1925–1932, 1948–1982, and 1983–2005) in the three reconstruction series was the same (Figure 8), indicating regional-scale climate change. In addition, the significantly positive correlations between the reconstructed Tmax6–7 series and regional gridded temperatures (Figure 9a,b) showed that the regional temperature variations were well captured by the reconstruction. Therefore, our reconstruction preserved reliable information on regional climate variability, and provided a valuable profile of past climatic variation in this area.

4.4. Periodicities and Possible Climate Drivers

The results of spectral analysis [57] revealed that the Tmax6–7 series has specific cycles, indicating that the Tmax6–7 in the CBM region may be affected by other factors. Significant peaks were observed at 4.09, 3.58, 3.37, 3.19, 3.02, 2.84, 2.74, and 2.67 years (Figure 7). These values were within the range of the ENSO cycle of 2–7 years [58,59,60]. A significant positive correlation between the Tmax6–7 series and sea surface temperatures (SSTs) of the western equatorial Pacific (Figure 9c) revealed a possible association between the Tmax6–7 changes and ENSO. Earlier studies have shown that the El Niño event was related to higher summer temperatures in China [27,33,61] and has already been observed in temperature reconstructions that were based on tree ring data from Northeast China [28,50]. The Changbai Mountain (CBM) is located at the boundary zone of the East Asia summer monsoon (EASM) [62,63]. The ENSO has a strong effect on the East Asian monsoon (EAM) and may cause temperature changes in monsoon-affected areas [64,65,66]. The EAM climate regimes dominate the rise and fall of the temperature, or the increase and decrease in the availability of water resources [60,67,68].
The cycles of 9.7 and 11.1 years may suggest the influence of solar effects, such as the amount of solar irradiance [69,70,71,72]. Correlation analyses revealed that the Tmax6–7 series had a significant positive correlation with the number of sunspots (http://www.sidc.be/silso/datafiles) from May to July of the current year (n = 233, 1772–2004, r = 0.21, p = 0.011), indicating that the Tmax6–7 series was most likely influenced by solar activity. An approximately 10-year cycle was detected from other works in northern China and suggests the effects of solar activity [14,19,27].
The significant spectral peaks appearing in 15.5, 17.9, 29.1, and 69.7 years may be related to the 15–30 and 50–70 year periods of the Pacific decadal oscillation (PDO) [73,74,75], which was confirmed by the significant positive correlation of the reconstructed Tmax6–7 series with the annual PDO (n = 225, r = 0.37, p < 0.05; 1772–1996) [76] and with SSTs in the eastern Pacific Ocean (Figure 9c). Some other works which were conducted near our study region discovered that the reconstructed climate series based on the tree-ring widths of Hailar pine, Mongolian pine, and Pinus tabulaeformis were also significantly correlated with the PDO [15,27,61].
As mentioned above, the complex connections between the solar activity, ENSO, and PDO suggest that the temperature in the CBM area indicated local-regional climate signals and global-scale climate changes.

5. Conclusions

A June–July mean maximum temperature reconstruction (1772–2004) was developed using tree-ring data from the Changbai Mountain (CBM) in the northeast of China. The reconstructed and observed temperature data showed coherence throughout the common periods. Compared with historical records, the warm and cold periods of the reconstructed record usually corresponded to temperature records in historical documents from Jilin Province of China. In addition, comparisons with other reconstructed temperature series from different regions and spatial correlations between the reconstructed Tmax6–7 series and gridded temperature record showed that the reconstructed temperature from the CBM area might contain both local and large-scale regional temperature variability. Some important cycles for temperature variability were exposed by the power spectrum analysis, indicating the possible linkage of regional temperature variations to the solar activity, ENSO and PDO.

Supplementary Materials

The following are available online at https://www.mdpi.com/1999-4907/10/5/416/s1, Table S1: Years of extremely high (>23.84 °C) and low (<21.78 °C) reconstructed mean maximum temperatures from June to July (Tmax6–7) from most extreme to least, Table S2: Flood and drought events recorded in historical archives in Jilin Province since 1772 [52].

Author Contributions

Data analysis: J.Z., X.Y. and Y.J.; writing original draft and revising: J.Z., X.W., L.H., J.W. and Y.J.; methodology, Y.J., J.Z., S.H. and Z.C.; investigation: Y.J., X.Y. and H.H.; software: G.L. and S.D.

Funding

The research was funded by the National Natural Science Foundation of China (Nos. 41330530, 41430639 and 41575153).

Conflicts of Interest

The authors declare no conflict of interest.

References

  1. Intergovernmental Panel on Climate Change. Climate Change 2014: Mitigation of Climate Change; Cambridge University Press: Cambridge, UK, 2014. [Google Scholar]
  2. Chen, P.Y.; Welsh, C.; Hamann, A. Geographic variation in growth response of Douglas-fir to interannual climate variability and projected climate change. Glob. Chang. Biol. 2010, 16, 3374–3385. [Google Scholar] [CrossRef]
  3. Huang, J.; Tardif, J.C.; Bergeron, Y.; Denneler, B.; Berninger, F.; Girardin, M. Radial growth response of four dominant boreal tree species to climate along a latitudinal gradient in the eastern Canadian boreal forest. Glob. Chang. Biol. 2010, 16, 711–731. [Google Scholar] [CrossRef]
  4. Crimmins, S.M.; Dobrowski, S.Z.; Greenberg, J.A. Changes in climatic water balance drive downhill shifts in plant species’ optimum elevations. Science 2011, 331, 177. [Google Scholar] [CrossRef]
  5. Jiang, Y.G.; Zhang, J.H.; Han, S.J.; Chen, Z.J.; Setälä, H.; Yu, J.H. Radial Growth Response of Larix gmelinii to Climate along a Latitudinal Gradient in the Greater Khingan Mountains, Northeastern China. Forests 2016, 7, 295. [Google Scholar] [CrossRef]
  6. Zhang, X.; Bai, X.; Chang, Y.; Chen, Z. Increased sensitivity of Dahurian larch radial growth to summer temperature with the rapid warming in Northeast China. Trees 2016, 30, 1799–1806. [Google Scholar] [CrossRef]
  7. Liang, J.; Xia, J.; Liu, L.; Wan, S.Q. Global patterns of the responses of leaf-level photosynthesis and respiration in terrestrial plants to experimental warming. J. Plant Ecol. 2013, 6, 437–447. [Google Scholar] [CrossRef] [Green Version]
  8. Lin, D.; Xia, J.; Wan, X.S. Climate warming and biomass accumulation of terrestrial plants: A meta-analysis. New Phytol. 2010, 188, 187–198. [Google Scholar] [CrossRef] [PubMed]
  9. Peng, J.; Peng, K.; Li, J. Climate-growth response of Chinese white pine (Pinus armandii) at different age groups in the Baiyunshan National Nature Reserve, central China. Dendrochronologia 2018, 49, 102–109. [Google Scholar] [CrossRef]
  10. Xie, J.; Chen, J.; Sun, G.; Chu, H.; Noormets, A.; Ouyang, Z.; John, R.; Wan, S.; Guan, W. Long-term variability and environmental control of the carbon cycle in an oak-dominated temperate forest. For. Ecol. Manag. 2014, 313, 319–328. [Google Scholar] [CrossRef]
  11. Ding, Y.H.; Dai, X.S. Temperature variation in China during the last 100 years. Meteorol. Mon. 1994, 12, 19–26. (In Chinese) [Google Scholar]
  12. Wang, L.; Wu, Z.; He, H.; Wang, F.; Du, H.; Zong, S. Changes in summer extreme precipitation in Northeast Asia and their relationships with the East Asian summer monsoon during 1961–2009. Int. J. Climatol. 2016, 37, 25–35. [Google Scholar] [CrossRef]
  13. Sun, L.; Shen, B.; Sui, B. The influences of East Asian Monsoon on summer precipitation in Northeast China. Clim. Dyn. 2017, 48, 1647–1659. [Google Scholar] [CrossRef]
  14. Liu, Y.; Zhang, X.; Song, H.; Cai, Q.; Li, Q.; Zhao, B. Tree-ring-width-based PDSI reconstruction for central Inner Mongolia, China over the past 333 years. Clim. Dyn. 2016, 48, 867–879. [Google Scholar] [CrossRef]
  15. Wang, Y.; Liu, Y. Reconstruction of March–June precipitation from tree rings in central Liaoning, China. Clim. Dyn. 2016, 49, 1–11. [Google Scholar] [CrossRef]
  16. Lean, J.; Rind, D. Evaluating sun–climate relationships since the Little Ice Age. J. Atmos. Sol.-Terr. Phys. 1999, 61, 25–36. [Google Scholar] [CrossRef]
  17. Bond, G.; Kromer, B.; Beer, J.; Muscheler, R.; Evans, M.N.; Showers, W.; Hoffmann, S.; Lotti-Bond, R.; Hajdas, I.; Bonani, G. Persistent Solar Influence on North Atlantic Climate During the Holocene. Science 2001, 294, 2130–2136. [Google Scholar] [CrossRef] [PubMed]
  18. Velasco Herrera, V.M.; Mendoza, B.; Herrera, G.V. Estimating Total Solar Irradiance Composites (ACRIM and PMOD): From the Medieval Warm Period to the 21st century. Can. J. Chem. 2011, 58, 1892–1893. [Google Scholar]
  19. Velasco Herrera, V.M.; Mendoza, B.; Herrera, G.V. Reconstruction and prediction of the total solar irradiance: From the Medieval Warm Period to the 21st century. New Astron. 2015, 34, 221–233. [Google Scholar] [CrossRef]
  20. Wang, Z.; Ding, Y.; He, J.; Yu, J. An updating analysis of the climate change in China in recent 50 years. Acta Meteorol. Sin. 2004, 62, 228–236. (In Chinese) [Google Scholar]
  21. Esper, J.; Cook, E.R.; Schweingruber, F.H. Low-frequency signals in long tree-ring chronologies for reconstructing past temperature variability. Science 2002, 295, 2250–2253. [Google Scholar] [CrossRef] [PubMed]
  22. Zhang, Q.; Cheng, G.; Yao, T. A 2,326-year tree-ring record of climate variability on the northeastern Qinghai-Tibetan Plateau. Geophys. Res. Lett. 2003, 30. [Google Scholar] [CrossRef] [Green Version]
  23. Fritts, H.C. Tree Rings and Climate; Academic Press: New York, NY, USA, 1976. [Google Scholar]
  24. Mann, M.E.; Zhang, Z.; Rutherford, S. Global signatures and dynamical origins of the Little Ice Age and Medieval Climate Anomaly. Science 2009, 326, 1256. [Google Scholar] [CrossRef]
  25. Cook, E.R.; Anchukaitis, K.J.; Buckley, B.M. Asian monsoon failure and megadrought during the last millennium. Science 2010, 328, 486–489. [Google Scholar] [CrossRef]
  26. Davi, N.; Jacoby, G.; Fang, K. Reconstructing drought variability for Mongolia based on a large-scale tree ring network: 1520–1993. J. Geophys. Res. Atmos. 2010, 115, 1842–1851. [Google Scholar] [CrossRef]
  27. Bao, G.; Liu, Y.; Linderholm, H.W. April–September mean maximum temperature inferred from Hailar pine (Pinus sylvestris var. mongolica) tree rings in the Hulunbuir region, Inner Mongolia, back to 1868 AD. Palaeogeogr. Palaeoclimatol. Palaeoecol. 2012, 313, 162–172. [Google Scholar] [CrossRef]
  28. Wang, Y.; Liu, Y.; Zhang, H.; Wang, H.; Guo, J. Temperature variability inferred from tree-ring records in Weichang region, China, and its teleconnection with large-scale climate forcing. Clim. Dynam. 2019, 50, 2157–2168. [Google Scholar] [CrossRef]
  29. Yu, D.; Liu, J.; Lewis, B.J. Spatial variation and temporal instability in the climate–growth relationship of Korean pine in the Changbai Mountain region of Northeast China. For. Ecol. Manag. 2013, 300, 96–105. [Google Scholar] [CrossRef]
  30. Chen, L.; Wu, S.; Pan, T. Variability of climate–growth relationships along an elevation gradient in the Changbai Mountain, northeastern China. Trees 2011, 25, 1133–1139. [Google Scholar] [CrossRef] [Green Version]
  31. Wang, H.; Shao, X.M.; Jiang, Y. The impacts of climate change on the radial growth of Pinus koraiensis along elevations of Changbai Mountain in northeastern China. For. Ecol. Manag. 2013, 289, 333–340. [Google Scholar] [CrossRef]
  32. Shao, X.; Wu, X. Reconstruction of climate change on Changbai Mountain, Northeast China using tree-ring data. Quat. Sci. 1997, 1, 76–83. (In Chinese) [Google Scholar]
  33. Zhu, H.F.; Fang, X.Q.; Shao, X.M.; Yin, Z. Tree ring-based February–April temperature reconstruction for Changbai Mountain in Northeast China and its implication for East Asian winter monsoon. Clim. Past Discuss. 2009, 5, 661–666. [Google Scholar] [CrossRef] [Green Version]
  34. Editorial Committee for Forestry of Jilin. Forest of Jilin; China Forestry Press: Beijing, China, 1988. (In Chinese) [Google Scholar]
  35. Wang, W.W.; Zhang, J.H.; Dai, G.H. Tree-ring based temperature variability in autumn over the past 240 years in Changbai Mountain. Chin. J. Ecol. 2012, 31, 787–793. (In Chinese) [Google Scholar]
  36. Lyu, S.; Li, Z.; Zhang, Y. A 414-year tree-ring-based April–July minimum temperature reconstruction and its implications for the extreme climate events, northeast China. Clim. Past. 2016, 12, 1879–1888. [Google Scholar] [CrossRef]
  37. Cook, E.R. Methods of Dendrochronology: Applications in Environmental Science; Springer Science & Business Media: Berlin, Germany, 1990. [Google Scholar]
  38. Holmes, R.L. Computer-Assisted Quality Control in Tree-Ring Dating and Measurement. Tree-Ring Bull. 1983, 44, 69–75. [Google Scholar]
  39. Wigley, T.M.L.; Briffa, K.R.; Jones, P.D. On the Average Value of Correlated Time Series, with Applications in Dendroclimatology and Hydrometeorology. J. Climatol. Appl. Meteorol. 1984, 23, 201–213. [Google Scholar] [CrossRef] [Green Version]
  40. Kendall, M.; Gibbons, J.D. Rank Correlation Methods, 5th ed.; Arnold: London, UK, 1990. [Google Scholar]
  41. Fu, C.B.; Wang, Q. The definition and detection of the abrupt climatic change. Sci. Atmos. Sin. 1992, 16, 482–493, (In Chinese, with English abstract). [Google Scholar]
  42. Blasing, T.J.; Solomon, A.M.; Duvick, D.N. Response functions revisited. J. Chem. Phys. 1984, 44, 1–15. [Google Scholar]
  43. Biondi, F.; Waikul, K. DENDROCLIM2002: A C++ program for statistical calibration of climate signals in tree-ring chronologies. Comput. Geosci. 2004, 30, 303–311. [Google Scholar] [CrossRef]
  44. Meko, D.M.; Graybill, D.A. Tree-ring reconstruction of upper Gila River discharge. Water Res. Bull. 1995, 31, 605–616. [Google Scholar] [CrossRef]
  45. Mann, M.E.; Lees, J.M. Robust estimation of background noise and signal detection in climatic time series. Clim. Chang. 1996, 33, 409–445. [Google Scholar] [CrossRef]
  46. Wen, K.G. China Meteorological Disaster in Jilin Province; China Meteorological Press: Beijing, China, 2008. (In Chinese) [Google Scholar]
  47. Zhang, T.; Yuan, Y.; Wei, W.; Yu, S.; Zhang, R.; Shang, H.; Chen, F.; Fan, Z.; Qin, L. Tree-ring-based temperature reconstruction for the northern Greater Higgnan Mountains, China, since A.D. 1717. Int. J. Climatol. 2013, 33, 422–429. [Google Scholar] [CrossRef]
  48. Ma, Y.; Liu, Y.; Song, H. A Standardized Precipitation Evapotranspiration Index Reconstruction in the Taihe Mountains Using Tree-Ring Widths for the Last 283 Years. PLoS ONE 2015, 10, e0133605. [Google Scholar] [CrossRef]
  49. Dulamsuren, C.; Khishigjargal, M.; Leuschner, C. Response of tree-ring width to climate warming and selective logging in larch forests of the Mongolian Altai. J. Plant Ecol. 2014, 7, 24–38. [Google Scholar] [CrossRef]
  50. Liu, H.; Park, W.A.; Allen, C.D. Rapid warming accelerates tree growth decline in semi-arid forests of Inner Asia. Glob. Chang. Biol. 2013, 119, 2500–2510. [Google Scholar] [CrossRef] [PubMed]
  51. Yi, L.; Yu, H.; Ge, J.; Lai, Z.; Xu, X.; Qin, L.; Peng, S. Reconstructions of annual summer precipitation and temperature in north-central China since 1470 AD based on drought/flood index and tree-ring records. Clim. Chang. 2012, 110, 469–498. [Google Scholar] [CrossRef]
  52. Wen, K.G. China Meteorological Disaster in Heilongjiang Province; China Meteorological Press: Beijing, China, 2007. (In Chinese) [Google Scholar]
  53. Beer, J.; Mende, W.; Stellmacher, R. The role of the sun in climatic forcing. Quat. Sci. Rev. 2000, 19, 403–415. [Google Scholar] [CrossRef]
  54. Yin, H.; Guo, P.; Liu, H.; Huang, L.; Yu, H.; Guo, S.; Wang, F. Reconstruction of the October mean temperature since 1796 at Wuying from tree ring data. Adv. Clim. Chang. Res. 2009, 5, 18–23. [Google Scholar]
  55. Wang, W.; Zhang, J.; Dai, G.; Wang, X.; Han, S.; Zhang, H.; Wang, Y. Variation of autumn temperature over the past 240 years in Changbai Mountain of Northeast China: A reconstruction with tree-ring records, China. J. Ecol. 2012, 31, 787–793. [Google Scholar]
  56. Zhu, L.; Li, S.; Wang, X. Tree-ring reconstruction of February-March mean minimum temperature back to 1790 AD in Yichun, Northeast China. Quat. Sci. 2015, 35, 1175–1184. [Google Scholar]
  57. Wei, F.Y. Modern Climate Statistics Diagnosis and Forecasting Techniques; China Meteorological Press: Beijing, China, 2010. (In Chinese) [Google Scholar]
  58. Su, M.F.; Wang, H.J. Relationship and its instability of ENSO—Chinese variations in droughts and wet spells. Sci. China Ser. D 2007, 50, 145–152. [Google Scholar] [CrossRef]
  59. Hocke, K. QBO in solar wind speed and its relation to ENSO. J. Atmos. Sol.-Terr. Phys. 2009, 71, 216–220. [Google Scholar] [CrossRef]
  60. Gergis, J.L.; Fowler, A.M. A history of ENSO events since A.D. 1525: Implications for future climate change. Clim. Chang. 2009, 92, 343–387. [Google Scholar] [CrossRef]
  61. Chen, Z.; Zhang, X.; Cui, M. Tree-ring based precipitation reconstruction for the forest–steppe ecotone in northern Inner Mongolia, China and its linkages to the Pacific Ocean variability. Glob. Planet. Chang. 2012, 86–87, 45–56. [Google Scholar] [CrossRef]
  62. Yang, G.; Chen, X.; Zhou, D. Ordination and gradient analysis of coniferous forest in Daxinganling. J. Northeas. For. Univ. 1992, 3, 42–47. [Google Scholar]
  63. Li, J.; Zeng, Q. A new monsoon index and the geographical distribution of the global monsoons. Adv. Atmos. Sci. 2003, 20, 299–302. [Google Scholar]
  64. Zhang, R.H.; Sumi, A.; Kimoto, M. A diagnostic study of the impact of El Niño on the precipitation in China. Adv. Atmos. Sci. 1999, 16, 229–241. [Google Scholar] [CrossRef]
  65. Wu, R.; Wang, B.A. Contrast of the East Asian Summer Monsoon-ENSO Relationship between 1962–1977 and 1978–1993. J. Clim. 2002, 15, 3266–3279. [Google Scholar] [CrossRef]
  66. Lu, R.Y. Interannual variation of North China rainfall in rainy season and SSTs in the equatorial eastern Pacific. Chin. Sci. Bull. 2005, 50, 2069–2073. [Google Scholar] [CrossRef]
  67. Li, J.; Cook, E.R.; D’Arrigo, R. Moisture variability across China and Mongolia: 1951–2005. Clim. Dynam. 2009, 32, 1173–1186. [Google Scholar] [CrossRef]
  68. Gao, J.; Shi, Z.; Xu, L. Precipitation variability in Hulunbuir, northeastern China since 1829 AD reconstructed from tree-rings and its linkage with remote oceans. J. Arid Environ. 2013, 95, 14–21. [Google Scholar] [CrossRef]
  69. Grootes, P.M.; Stuiver, M. Oxygen 18/16 variability in Greenland snow and ice with 103 to 105-year time resolution. J. Geophys. Res. 1997, 102, 26455–26470. [Google Scholar] [CrossRef]
  70. Nagovitsyn, Y.A. Solar activity during the last two millennia: Solar patrol in ancient and medieval China. Geomagn. Aeron. 2001, 41, 680–688. [Google Scholar]
  71. Ogurtsov, M.G.; Nagovitsyn, Y.A.; Kocharov, G.E.; Jungner, H. Long-period cycles of the Sun’s activity recorded in direct solar data and proxies. Sol. Phys. 2002, 211, 371–394. [Google Scholar] [CrossRef]
  72. Auer, G.; Piller, W.E.; Harzhauser, M. Two distinct decadal and centennial cyclicities forced marine upwelling intensity and precipitation during the late Early Miocene in central Europe. Clim. Past Discuss. 2015, 10, 1223–1264. [Google Scholar] [CrossRef]
  73. Minobe, S. Resonance in bidecadal and pentadecadal climate oscillations over the North Pacific: Role in climatic regime shifts. Geophys. Res. Lett. 1999, 26, 855–858. [Google Scholar] [CrossRef] [Green Version]
  74. Gedalof, Z.; Mantua, N.J.; Peterson, D.L. A multi-century perspective of variability in the Pacific Decadal Oscillation: New insights from tree rings and coral. Geophys. Res. Lett. 2002, 29, 57-1–57-4. [Google Scholar] [CrossRef]
  75. Ma, Z.G. The interdecadal trend and shift of dry/wet over the central part of north China and their relationship to the Pacific Decadal Oscillation (PDO). Chin. Sci. Bull. 2007, 52, 2130–2139. [Google Scholar] [CrossRef]
  76. MacDonald, G.M.; Case, R.A. Variations in the Pacific Decadal Oscillation over the past millennium. Geophys. Res. Lett. 2005, 32, L08703. [Google Scholar] [CrossRef]
Figure 1. Map showing the sampling site of CBM (Changbai Mountain) and meteorological stations in Erdao and Tianchi (a), and the sampling site of CBM and other locations mentioned in text for comparison, including Laobai Mountain (LBM): April–July temperature [36] and Hailar (HLE): April–September temperature [27] (b).
Forests 10 00416 g001
Figure 2. Total precipitation (in mm) and mean monthly temperature (in °C) in Changbai Mountain (CBM) (AD 1960–2005).
Forests 10 00416 g002
Figure 3. The EXP—negative exponential (green), RCS—regional curve standardization (blue), and SPL-300-year splines (red) chronologies from AD 1773 to 2005.
Forests 10 00416 g003
Figure 4. (a) Correlations between the standard chronology and monthly climate data, including monthly total precipitation (Prec), mean maximum temperature (Tmax), mean minimum temperature (Tmin), and mean temperature (Tm) from CBM during 1960–2005. The dashed lines indicate the 95% confidence level. (b) Running correlation between the ring-width index and mean maximum temperature from June to July of the previous year with a 10-year window.
Forests 10 00416 g004
Figure 5. (a) Ring-width STD chronology for the period 1743–2005 constructed for Picea jezoensis var. microsperma from Changbai Mountain in the northeast of China. The blue lines indicate the numbers of tree-ring series and (b) the expressed population signal (EPS) and average correlation between all series (Rbar) of the STD from AD 1743 to 2005. The vertical dash line indicates the point where EPS was higher than 0.85.
Forests 10 00416 g005
Figure 6. (a) Observed (blue line) and reconstructed (black line) Tmax6–7 for the common period of 1959–2004; (b) Shapiro–Wilk residuals normality test (SW); (c) Durbin–Watson test for residuals autocorrelation (DW); (d) reconstruction of Tmax6–7 in CBM for the last 233 years. The smoothed line indicates the 11-year moving average, red dots represent drought events, and blue dots represent flood events. The drought and flood events were recorded by [46].
Forests 10 00416 g006
Figure 7. The power spectrum analyses of reconstructed June–July mean maximum temperature. The 95% confidence limits for peaks in the power spectrum are indicated by the dash lines.
Forests 10 00416 g007
Figure 8. Comparison of June–July maximum temperature (Tmax6–7) reconstruction between (a) this study, (b) April–July temperature reconstruction by Lyu et al., 2016 [36], and (c) April–September temperature reconstruction by Bao et al., 2012 [27]. The light/dark gray shading areas represent the common warm/cold periods in different series.
Forests 10 00416 g008
Figure 9. Spatial correlation of (a) observed and (b) reconstructed June–July temperatures with regional gridded June–July temperatures from 1959 to 2004. (c) Spatial correlation for the reconstruction with June–July averaged HadlSST1 SST (sea surface temperatures) during the period of 1870–2004 (http://climexp.knmi.nl). The asterisk mark is the sampling position.
Forests 10 00416 g009
Table 1. Statistical features of STD chronology.
StatisticSTD
MS0.32
SD0.15
Kurtosis0.17
skewness0.45
First order autocorrelation0.68
Mean correlation between all series0.39
Mean correlation between the trees0.35
Mean correlation within a tree0.69
Period1934/1743–2005
SNR4.6
MRW (mm)0.89
EPS0.90
First year where EPS > 0.85 (number of trees)1773 (6)
Table 2. Correlations between the ring-width index and meteorological data for different month combinations over the common period of 1960–2005. Months are given as follows: p6–p7—previous June to July; p8–p9—previous August to September; p12–c3—previous December to current March; p12–c2—previous December to current February; p12–c1—previous December to current January; c1–c3—current January to March; c2–c3—current February to March. *: p < 0.05.
MonthsTminTmeanTmax
p6–p7−0.39 *−0.45 *−0.64 *
p8–p90.31 *0.17−0.12
p12–c3−0.37 *−0.31 *−0.21
p12–c2−0.35 *−0.26−0.19
p12–c1−0.29−0.25−0.16
c1–c3−0.33 *−0.31 *−0.22
c2–c3−0.36 *−0.30 *−0.27
Table 3. Statistics of calibration and verification test results for the common periods.
Parameter CalibrationVerificationCalibrationVerificationFinal Calibration
1960–19821983–20051983–20051960–19821960–2005
r−0.59−0.68−0.68−0.59−0.64
R20.350.460.460.350.42
R2adj0.34 0.44 0.41
DW1.72 1.50 1.56
RE0.350.460.460.31
CE0.350.410.460.22
t5.57.37.15.7
r—correlation coefficient; R2—explained variance; R2adj—adjusted for the loss of degrees of freedom; RE—reduction of error statistic; CE—coefficient of efficiency statistic; t—product means; DW—Durbin–Watson.
Table 4. Cold and warm periods based on the 11-year moving average June–July mean maximum temperature in the CBM region during AD 1772–2004.
Cold PeriodWarm Period
RankPeriodYearMean (°C)PeriodYearMean (°C)
11899–19131521.411881–1888923.93
21955–19701621.49
31975–19891520.97

