Article

Transcriptome Sequencing of Different Avocado Ecotypes: de novo Transcriptome Assembly, Annotation, Identification and Validation of EST-SSR Markers

1
Haikou Experimental Station, Chinese Academy of Tropical Agricultural Sciences, Haikou 570102, China
2
Institute of Vegetables, Liaoning Academy of Agricultural Sciences, Shenyang 110161, China
3
Tianjin Derit Seed Industry Co. Ltd., Tianjin 300384, China
4
College of Agriculture, Guangxi Vocational and Technical College, Nanning 530226, China
5
South Subtropical Crops Research Institute, Chinese Academy of Tropical Agricultural Sciences, Zhanjiang 524091, China
*
Author to whom correspondence should be addressed.
Forests 2019, 10(5), 411; https://doi.org/10.3390/f10050411
Submission received: 11 April 2019 / Revised: 7 May 2019 / Accepted: 8 May 2019 / Published: 12 May 2019
(This article belongs to the Section Forest Ecophysiology and Biology)

Abstract

:
Avocado (Persea americana Mill.) could be considered as an important tropical and subtropical woody oil crop with high economic and nutritional value. Despite the importance of this species, genomic information is currently unavailable for avocado and closely related congeners. In this study, we generated more than 216 million clean reads from different avocado ecotypes using Illumina HiSeq high-throughput sequencing technology. The high-quality reads were assembled into 154,310 unigenes with an average length of 922 bp. A total of 55,558 simple sequence repeat (SSR) loci detected among the 43,270 SSR-containing unigene sequences were used to develop 74,580 expressed sequence tag (EST)-SSR markers. From these markers, a subset of 100 EST-SSR markers was randomly chosen to identify polymorphic EST-SSR markers in 28 avocado accessions. Sixteen EST-SSR markers with moderate to high polymorphism levels were detected, with polymorphism information contents ranging from 0.33 to 0.84 and averaging 0.63. These 16 polymorphic EST-SSRs could clearly and effectively distinguish the 28 avocado accessions. In summary, our study is the first presentation of transcriptome data of different avocado ecotypes and comprehensive study on the development and analysis of a set of EST-SSR markers in avocado. The application of next-generation sequencing techniques for SSR development is a potentially powerful tool for genetic studies.

1. Introduction

Avocado belongs to the family Lauraceae of the order Laurales, which includes some of the oldest flowering plants in the fossil record and which was already widespread in the Early Cretaceous [1]. According to Chanderbali [2], Laurales (avocado and relatives) belong to a key clade, the magnoliids, containing most basal angiosperms in the widely accepted angiosperm phylogeny. In fact, avocado could become an established genetic model plant for the clarification of angiosperm evolution [2,3]. Avocado is composed of three ecotypes. The two “subtropical” (Guatemalan and Mexican) ecotypes, a species native to Mesoamerica, are now widely grown in warm to cool subtropical and Mediterranean climates in different countries and regions, while the “tropical” lowland (West Indian) ecotype is cultivated in tropical countries and warm subtropical regions [4]. These three ecotypes are distinguished and identified according to their genetic and morphological differences [1]. Avocado flowers exhibit a unique “protogynous dichogamous” opening behavior, which favors cross-pollination, and sterility barriers do not exist between or among the three ecotypes [1]. Many commercial avocado accessions are thus often natural or artificial hybrids [5]. The only available transcriptome data, to our knowledge, is that of the Hass cultivar, classified as a Guatemalan × Mexican hybrid, and an unknown Mexican accession [6,7,8], which extremely restricts genetic and breeding studies.
Avocado is among the most economically important subtropical/tropical fruit crops in the world, and increases in production are apparent throughout the world, such as in Mexico, the USA, Indonesia, Chile, Spain, Israel, Colombia, South Africa, and Australia were growth in production is considerable [1]. In the world, the total area of avocado cultivation has reached 563,916 hectares, with almost ten tons per hectare in the annual production of avocado in 2016 [9]. The consumption of avocado in the whole world has rapidly increased from 3,426,294 tons in 2008 to 5,567,044 tons in 2016 [9]. One factor contributing to these increases in production and consumption is the expansion of avocado products into new markets in parts of the world where avocado was previously unknown or scarcely available [1]. Certain constituents of avocado, including lipids, sugars, proteins, minerals, vitamins, and other nutrients and active ingredients, provide nutritive and health effects [10,11,12].
The precise identification of avocado germplasm needs to be undertaken to make these germplasm collections useful for plant breeders and farmers throughout the world [1]. Molecular characterization is essential for assessing the level of genetic diversity in avocado germplasm. Over the past two decades, several genetic diversity studies of avocado germplasm have been conducted using a variety of molecular marker types, including RAPDs (random amplified polymorphic DNA) [13], VNTRs (variable number of tandem repeats) [14], RFLPs (restricted fragment length polymorphisms) [15,16], SSRs (simple sequence repeats) [5,17,18], and SNPs (single nucleotide polymorphism) [19,20,21].
Of the many DNA markers that have been developed, SSRs, which consist of repeated nucleotide motifs of between one and six bases, are widely preferred in plant genetics and breeding because they are widely distributed and abundant in plant genomes, and they are genetically codominant, highly reproducible, multi-allelic, and well suited for high-throughput genotyping [22,23,24,25]. Transcriptome sequencing, which is based on next-generation sequencing technologies, is a high-throughput technique that facilitates the acquisition of a large number of unigene sequences for expressed sequence tag (EST)-derived marker development [26,27,28]. Because they are derived from genomic coding regions, EST-derived markers have an advantage over genomic DNA-derived markers, and therefore can be efficiently amplified to reveal conserved sequences among related species [29]. Rapid progress in the development of EST-SSR and EST-SNP loci based on transcriptome data has been made in sorghum [30], Indian mulberry [31], Lycium barbarum [32], Bletilla striata [33], Lilium [34], Chinese Hawthorn [35].
Transcriptome sequencing based on next-generation sequencing technology was performed in this study using six avocado cultivars derived from different ecotypes. We carried out de novo assembly and gene annotation, identified a set of EST-SSR markers, and assessed their application in genetic diversity of 28 selected avocado accessions. The datasets and results reported here can serve as a public resource for the identification, classification, and utilization of avocado germplasm resources.

2. Materials and Methods

2.1. Sample Collection, DNA Extraction, and RNA Extraction

For transcriptome research, six avocado cultivars were chosen from three pure ecotypes and two interracial hybrids, and their cultivation was widespread in the tropical and subtropical regions of the world in view of their higher quality or resistance to disease. These six avocado cultivars included one Guatemalan (Reed), one Mexican (Duke 7), one West Indian (Simmonds), one Guatemalan × Mexican (Fuerte), and two Guatemalan × West Indian (Beta and Tonnage) hybrids (Table 1). Apical buds, flowers, leaves, stems, and roots were collected from mature individuals of these six avocado cultivars. All organs sampled were collected according to the detailed description of Ibarra-Laclette [6] with minor modifications. The apical buds were from the developing buds emerging from shoot apical meristem, the flowers were from whole inflorescences with flowers at two stages of development (immature and mature), the leaves were from the two development stages of unexpanded and expanded leaves, the stems were from segments from young and old branches, and the root samples were from in vitro propagated seedlings [36]. All samples were promptly frozen in liquid nitrogen and stored at −80 °C. Total RNA was extracted using a plant RNA kit (Omega Bio-Tek, Norcross, GA, USA) and DNA was extracted from fresh leaves according to the procedure described by Ge [21].
For analysis of genetic diversity, 28 avocado accessions (2 Guatemalan, 2 Mexican, and 3 West Indian ecotypes, 7 Guatemalan × Mexican hybrids, and 14 Guatemalan × West Indian hybrids) were obtained from the Chinese Academy of Tropical Agricultural Sciences (Danzhou, Hainan Province, China; latitude 19°31′ N, longitude 109°34′ E, and altitude 20 m above sea level) and the South Subtropical Crops Research Institute, Chinese Academy of Tropical Agricultural Sciences (Zhanjiang, Guangdong Province, China; latitude 21°16′ N, longitude 110°22′ E, and altitude 30 m above sea level) (Table 1).

2.2. Library Construction and Transcriptome Sequencing

Briefly, mRNA was purified from total RNA (mixed samples including the equal amount of RNA from apical buds, flowers, leaves, stems, and roots, respectively) using poly-T oligo-attached magnetic beads. Fragmentation was carried out using divalent cations under elevated temperature in a NEBNext first-strand synthesis reaction buffer (5×). First-strand cDNA was synthesized using a series of random hexamer primers and reverse transcriptase, and second-strand cDNA was subsequently produced using DNA polymerase I and RNase H. cDNA libraries were constructed by ligating cDNA fragments to sequencing adapters followed by PCR amplification. The library preparations were sequenced on an Illumina HiSeq 2000 platform (Nanxin Bioinformatics Technology Co., Guangzhou, China).

2.3. Transcriptome Assembly, Annotation, and Coding Sequence Prediction

Clean data (clean reads) were obtained by removing low-quality reads, such as adapter sequences, reads with ambiguous poly-N runs, and reads in which more than 50% of bases had a Q-value ≤ 20, from the raw data. Two read files were independently established from each library and sample and used for transcriptome assembly in Trinity v2.5.1 [37] with min_kmer_cov set to 2 and all other parameters set to default values. The assembled transcripts were hierarchically clustered into unigenes on the basis of shared reads and expression using Corset [38].
Genes were functionally annotated by BLASTX alignment with an E-value threshold of 10−5 against the following databases: Clusters of Orthologous Groups of proteins (KOG/COG), Swiss-Prot (a manually annotated and reviewed protein sequence database), protein family (Pfam, assigned using the HMMER3.0 package), NCBI non-redundant protein sequence (Nr), and NCBI non-redundant nucleotide sequence (Nt) databases. The KEGG Automatic Annotation Server [39] was used to map these genes to the Kyoto Encyclopedia of Genes and Genomes (KEGG) metabolic pathway database. Gene Ontology (GO) annotations of unigenes were obtained using Blast2GO v2.5 [40] based on BLASTX hits against the Pfam and Nr databases with a cut-off E-value of 10−6. To predict coding sequences, all unigenes were first BLASTed against Nr and Swiss-Prot protein databases, and open reading frame data from the BLAST-hit unigenes were acquired directly. Second, coding sequences of non-hit unigenes and non-predicted but successfully matched unigenes were predicted using ESTScan v3.0.3.

2.4. Mining for Transcription Factor Families

Transcription-factor gene families were identified on the basis of categorically defined transcription factor families and criteria from KO, KOG, GO, Swiss-Prot, Pfam, Nr, and Nt databases using iTAK v1.2 with default parameters. The methods used to identify and classify transcription factors are described in Perez-Rodriguez [41].

2.5. EST-SSR Mining

To locate SSRs, we used MISA v1.0 with the following default settings: a minimum of five repeats, with a minimum motif length of 5 for tri- and hexanucleotides, 6 for dinucleotides, and 10 for single nucleotides.

2.6. Identification of Differentially Expressed Genes (DEGs)

To identify DEGs between two different samples, gene expression levels were quantified using the FRKM (expected number of Fragments Per Kilobase of transcript sequence per Millions of base pairs sequenced) method. Read counts of each sequenced library were adjusted using a single normalization factor in the edgeR program. Differential expression analysis of sample pairs was performed with the DEGSeq v1.20.0 R package, and a Benjamini–Hochberg-adjusted p-value of 0.005 and a log2 (fold change) of 1 were set as the threshold for significant differential expression. GO functional enrichment and KEGG pathway analysis of DEGs were performed using the GOseq R package and KOBAS v2.0. DEGs having corrected p-values ≤ 0.05 were considered to be significantly enriched in GO terms and KEGG pathways.

2.7. Identification of EST-SSR Markers

To screen EST-SSR loci, primers based on flanking sequences of the selected microsatellite loci were designed in Primer v3.0, with targeted sizes of PCR products ranging from 100 to 300 bp. Pa-eSSR were included as part of the assigned marker names to indicate Persea americana and EST-SSRs. A subset of 100 EST-SSR primer pairs was randomly selected for validation by polymerase chain reaction (PCR) amplification. The PCR amplification conditions were the same as described by Ge [22]. PCR products were analyzed using an MCE-202 multiNA microchip electrophoresis system (Shimadzu, Shanghai, China) in combination with a DR-C microchip and a DNA-500 Kitto estimate amplicon size and PCR specificity. Two internal standards (LM and UM) and the DNA ladder were used for the estimation of the amplicon sizes. No calling of sample detection was considered as null allele.

2.8. Data Analysis

The number of observed alleles (Na), effective number of alleles (Ne), observed heterozygosity (Ho), expected heterozygosity (He), and polymorphic information content (PIC) of each EST-SSR was assessed in POPGEN v1.32 [42]. Genetic distance was assessed in MEGA v4 [43]. Population structure analysis was performed in STRUCTURE v2.3.4 [44]. To obtain the optimal K value, K was set between 1 and 10, and five independent runs were performed for every K with a burn-in of 100,000 iterations, followed by 100,000 Markov Chain Monte Carlo iterations for every K value. Then, the delta K method described by Evanno [45] was used to detect the optimal K value by structureHarvester v0.6.94.

3. Results

3.1. Characterization of Transcriptome Sequencing Results and Sequence Annotation

A total of 29–45 million clean reads and 4.30–6.68 Gb of sequence data were generated from six cDNA libraries (Table S1). The avocado transcriptome data were deposited into GenBank (Reed: SRX5449731, Duke 7: SRX5449732, Simmonds: SRX5449733, Beta: SRX5449734, Fuerte: SRX5449735, Tonnage: SRX5449736). The high-quality reads were assembled using Trinity with default parameters into 366,618 transcripts with a mean length of 731 bp and 154,310 unigenes with a mean length of 922 bp (Table 2).
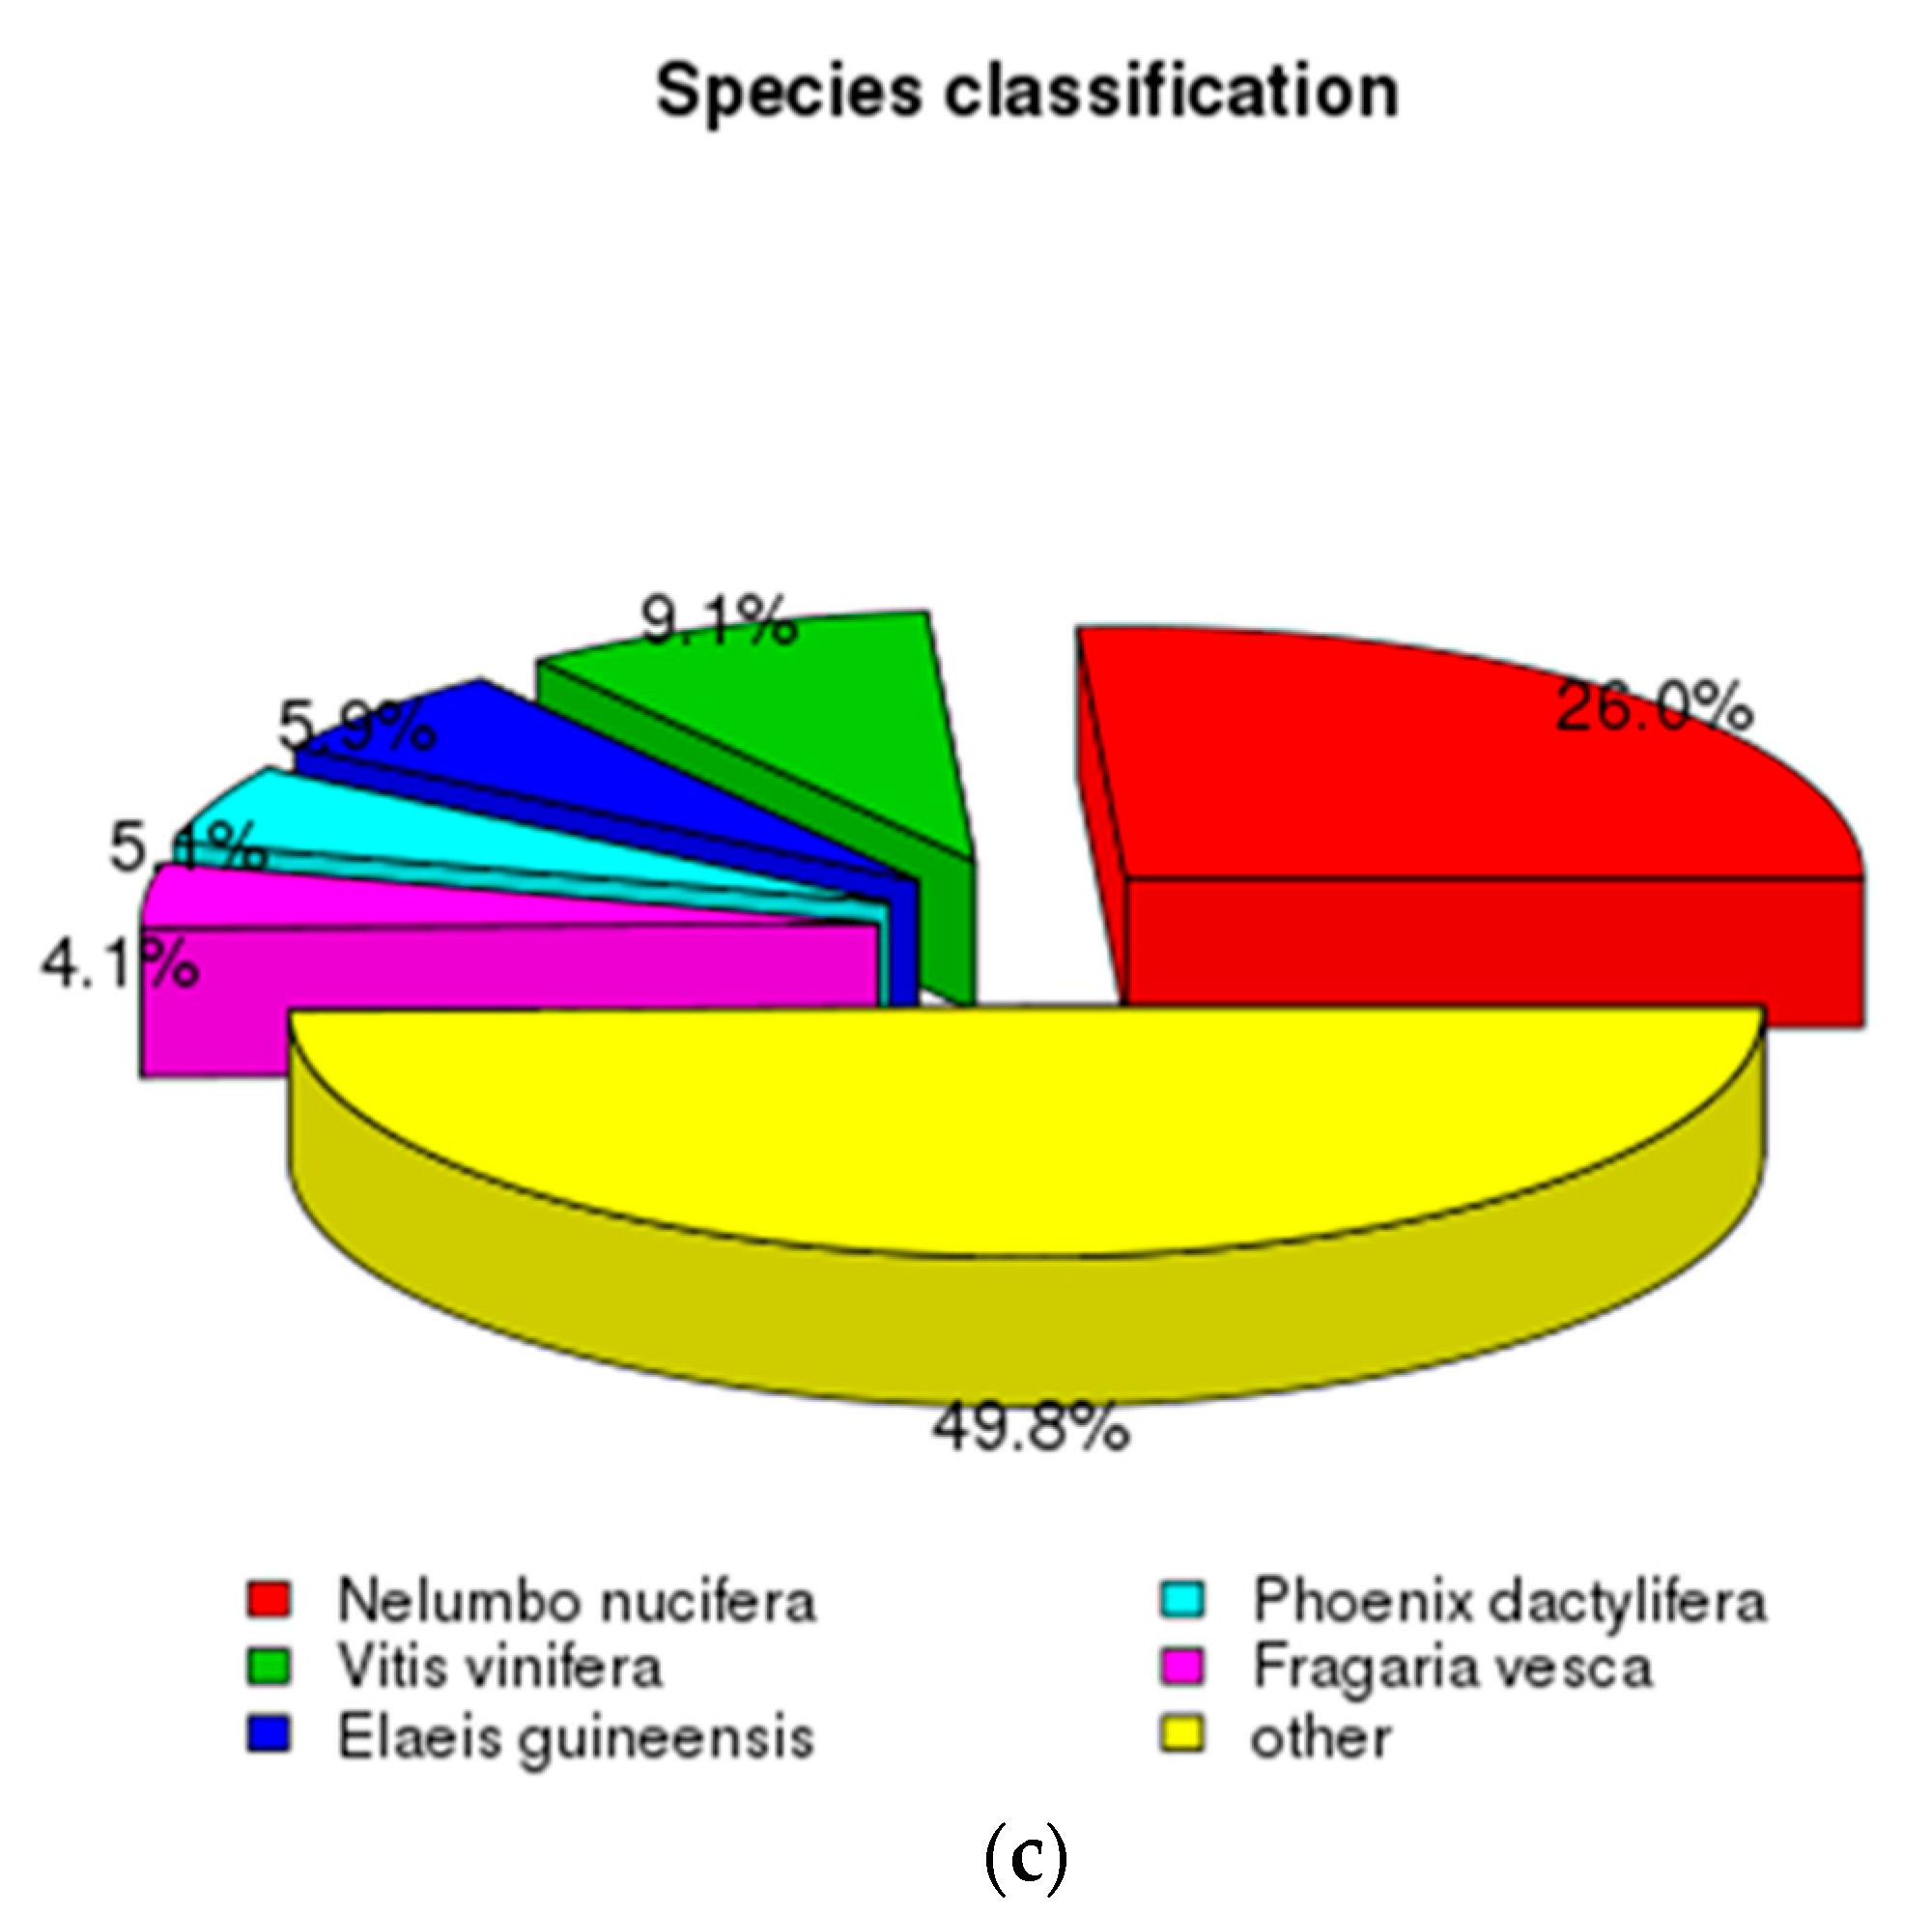
Among the 154,310 unigenes, 30,442 were longer than 1000 bp and accounted for 19.73% of the total unigenes. The length distributions of all transcripts and unigenes are listed in Figure 1A. According to these results, the sequencing quality was sufficient for subsequent analyses. Gene annotation using BLASTX indicated that 62,303 (40.37%), 35,699 (23.13%), 46,498 (30.13%), 48,324 (31.31%), 49,811 (32.27%), and 16,309 (10.56%) of the 154,310 avocado unigenes had significant matches with sequences in Nr, Nt, Swiss-Prot, Pfam, GO, and KOG databases, respectively. A total of 35.10% of unigenes were close homologs to previously deposited sequences (E < 1 × 10−60), while the remaining 63.10% had E-values between 1 × 10⁻⁵ and 1 × 10−60 (Figure 1B). The closest matching species to each unigene were Nelumbo nucifera (26.0% of all unigenes), Vitis vinifera (9.10%), Elaeis guineensis (5.90%), Phoenix dactylifera (5.10%), and Fragaria vesca (4.10%) (Figure 1C).
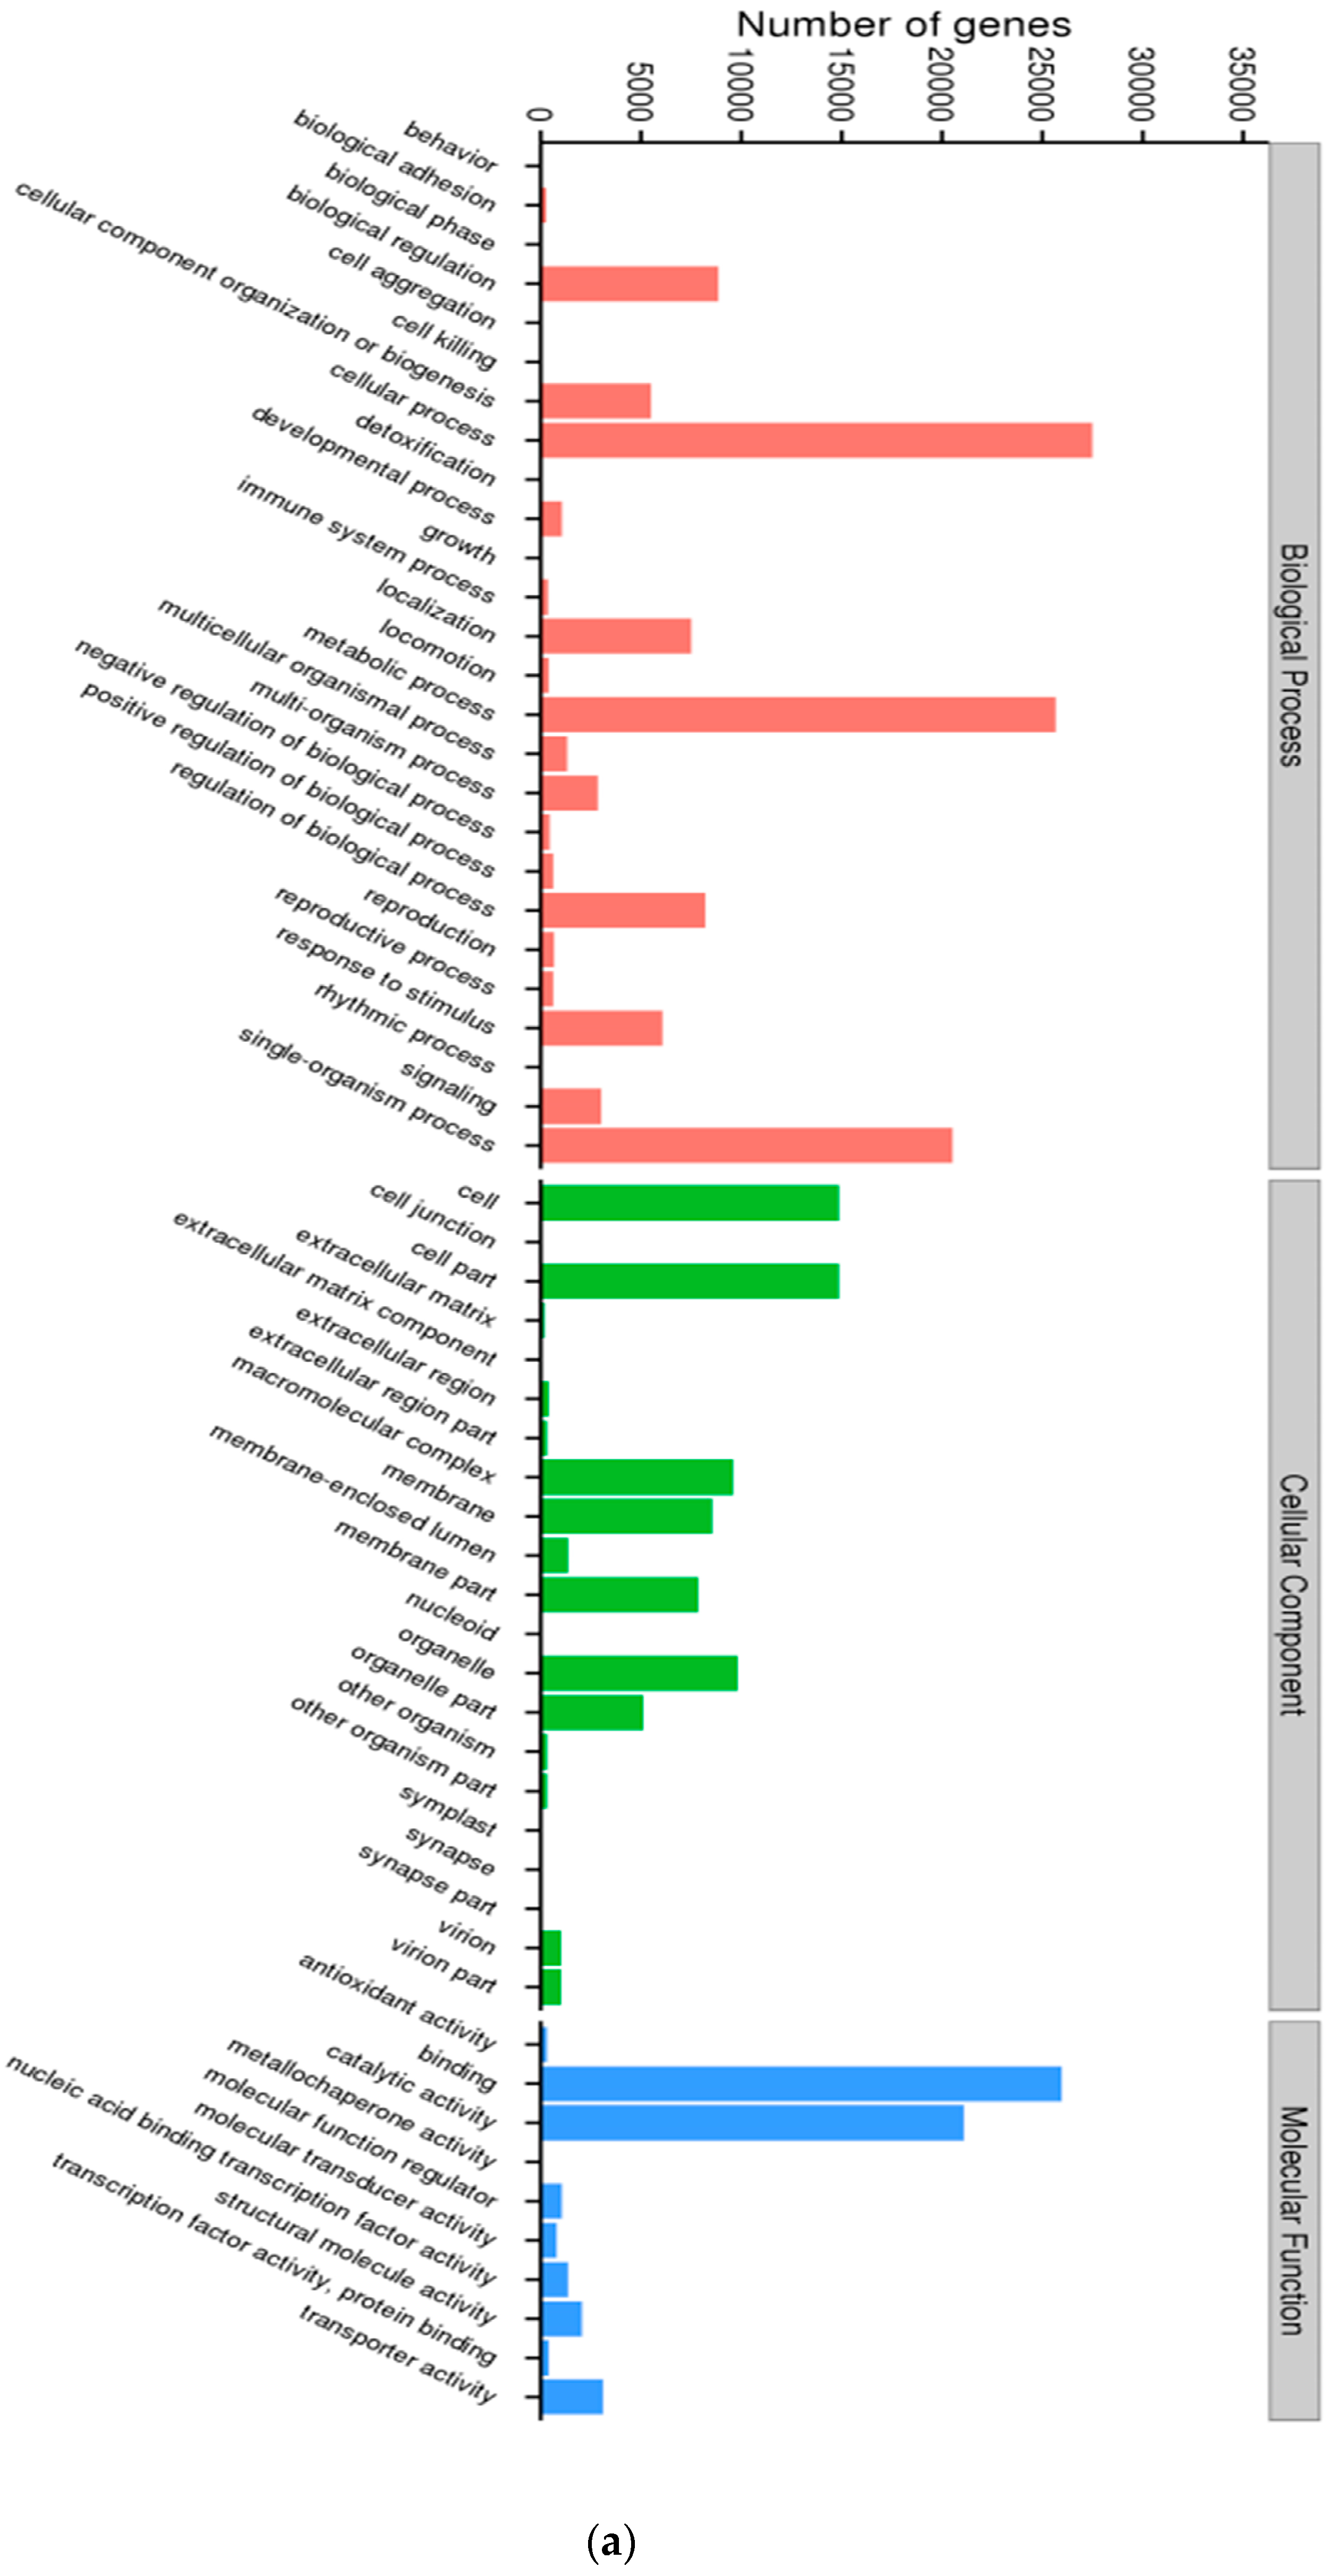
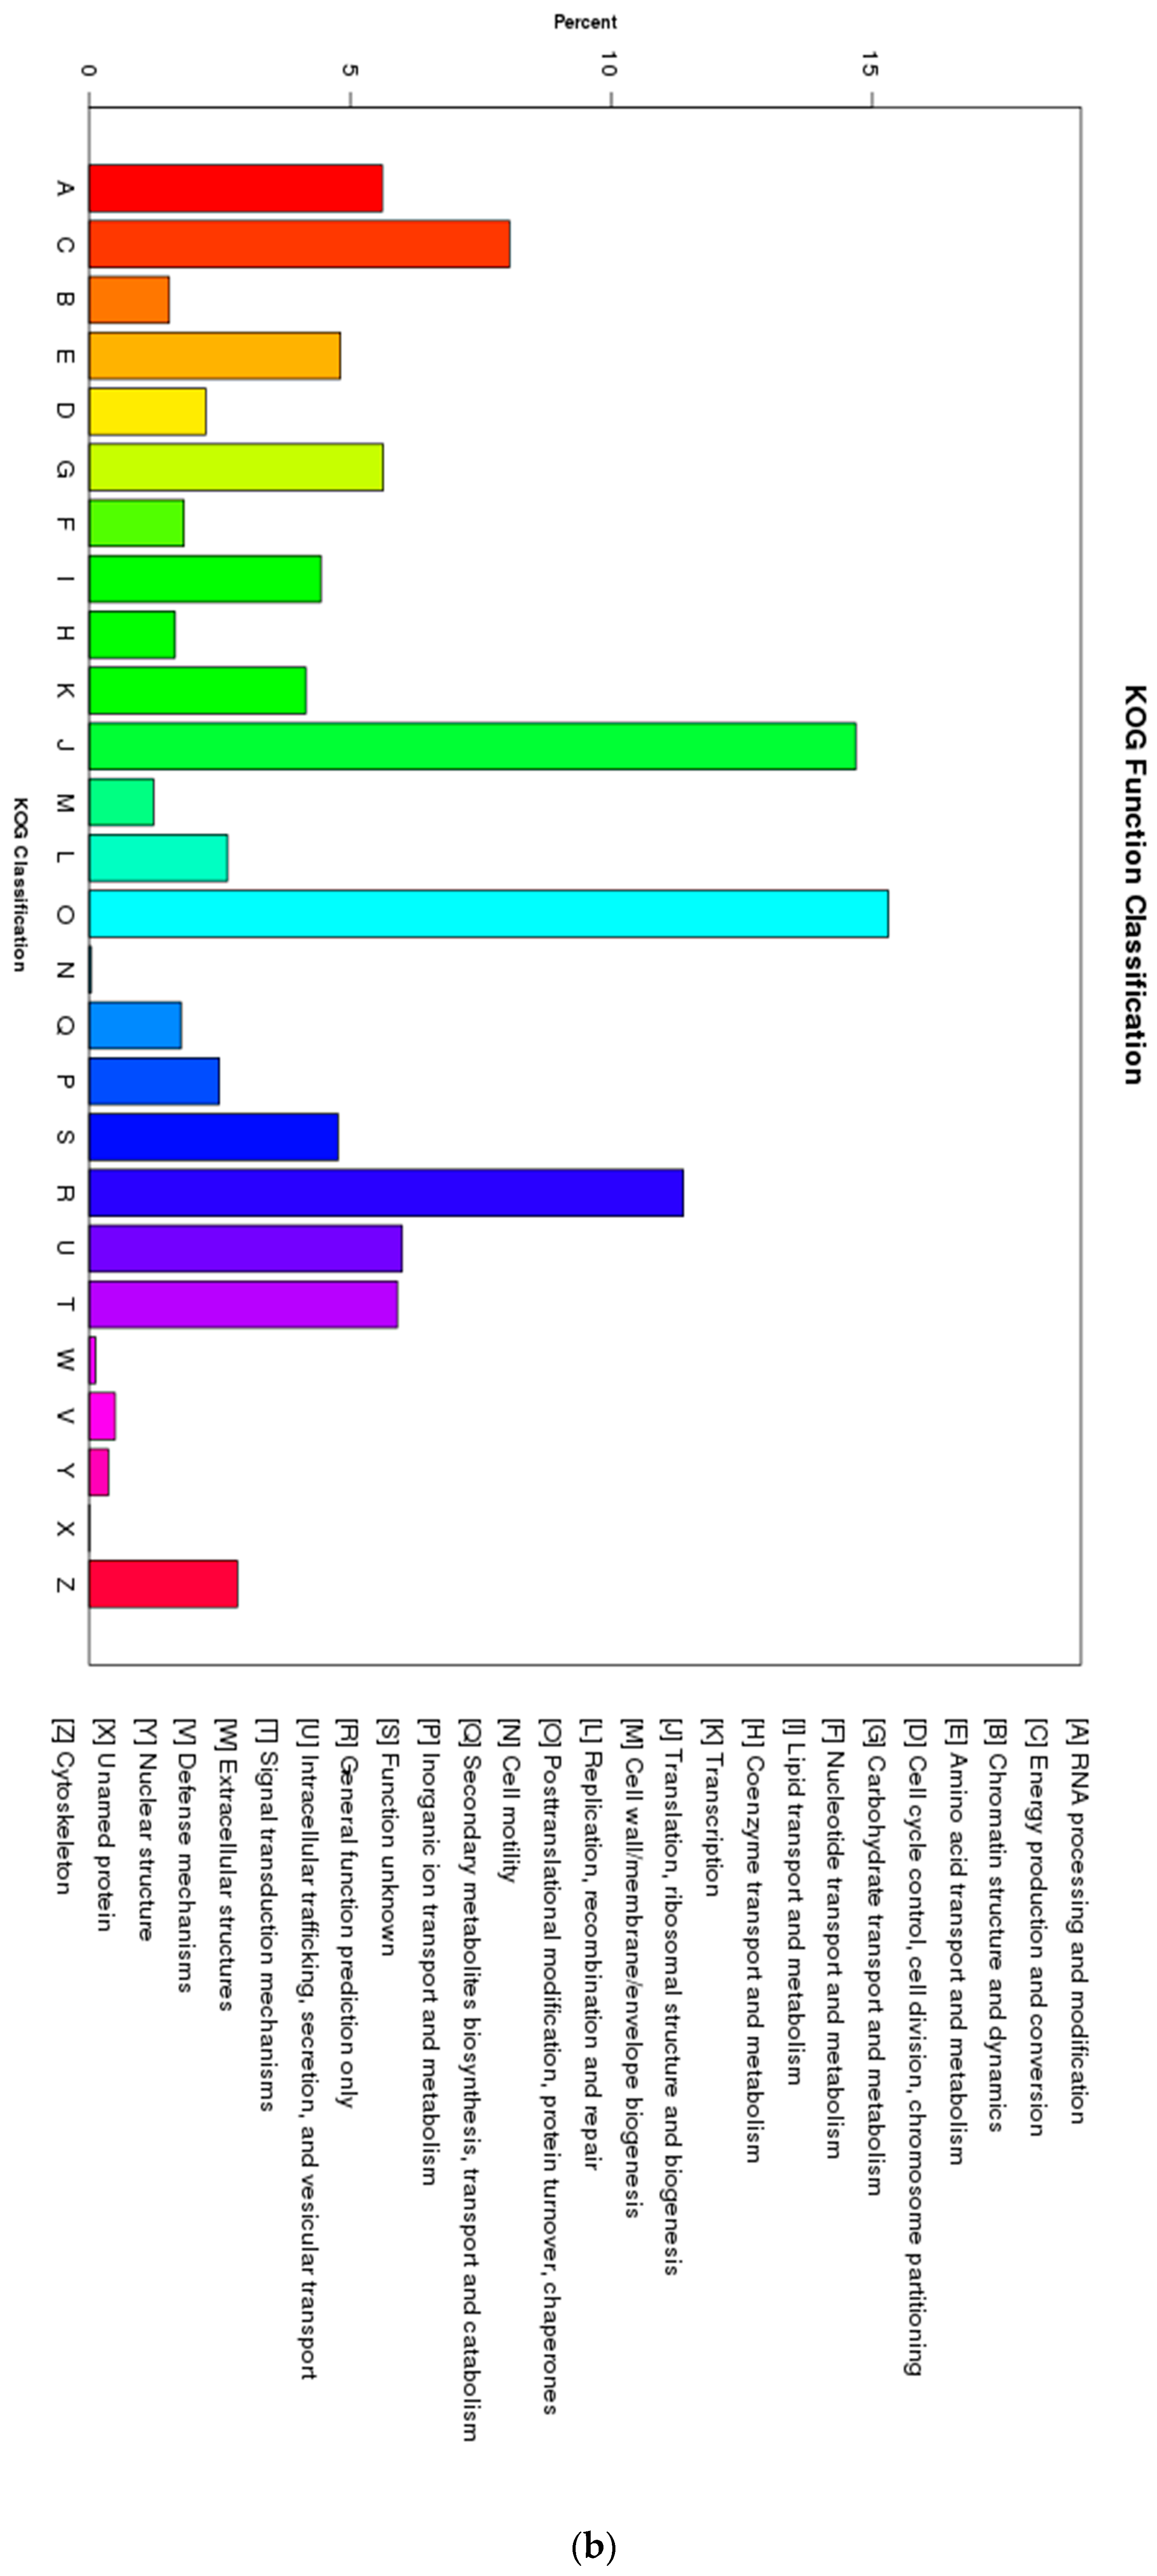
To further predict and classify the functions of annotated unigenes, we analyzed their matching GO terms, COG classifications, and KEGG pathway assignments. A total of 49,811 unigenes were assigned to 57 subcategories of three main GO functional categories: 121,944 to biological processes, 75,749 to cellular components, and 56,167 to molecular functions (Figure 2A, Table S2). Next, 16,309 unigenes were functionally classified into 26 KOG categories (Figure 2B, Table S3). Among the 26 categories, the most heavily represented group was “posttranslational modification, protein turnover, chaperones” (2497 unigenes. 13.93%), followed by “translation, ribosomal structure and biogenesis” (2395 unigenes, 13.37%) and “general function prediction only” (1856 unigenes, 10.36%). The smallest categories were “cell motility” and “unnamed protein”. Finally, 25,162 unigenes were assigned to 120 KEGG pathways in five main categories (Figure 2C, Table S4). The most represented pathways were related to ribosome (1607 unigenes), purine metabolism (1203 unigenes), and carbon metabolism (1143 unigenes).

3.2. Coding Sequence Prediction and Mining for Transcription Factor Families

According to a BLAST search, 49,038 coding sequences (CDSs) exactly matched sequences in NR and Swiss-Prot protein databases (additional file 1), while 89,865 CDSs were perfectly predicted through ESTScan v3.0.3 (additional file 2). CDS lengths revealed by BLAST searches of NR and Swiss-Prot databases ranged from 39 to 16,473 bp, whereas CDS lengths based on ESTScan varied from 51 to 9300 bp. In total, 2878 putative avocado transcription factors distributed in 81 families were identified and represented 1.87% of avocado unigenes (Table S5). The transcription factors were identified and classified as described by Perez-Rodriguez [21]. The most abundant transcription factor categories included MYB (253 unigenes), AP2-EREBP (159), C2H2 (154), NAC (140), and orphans (128).

3.3. Analysis of DEGs

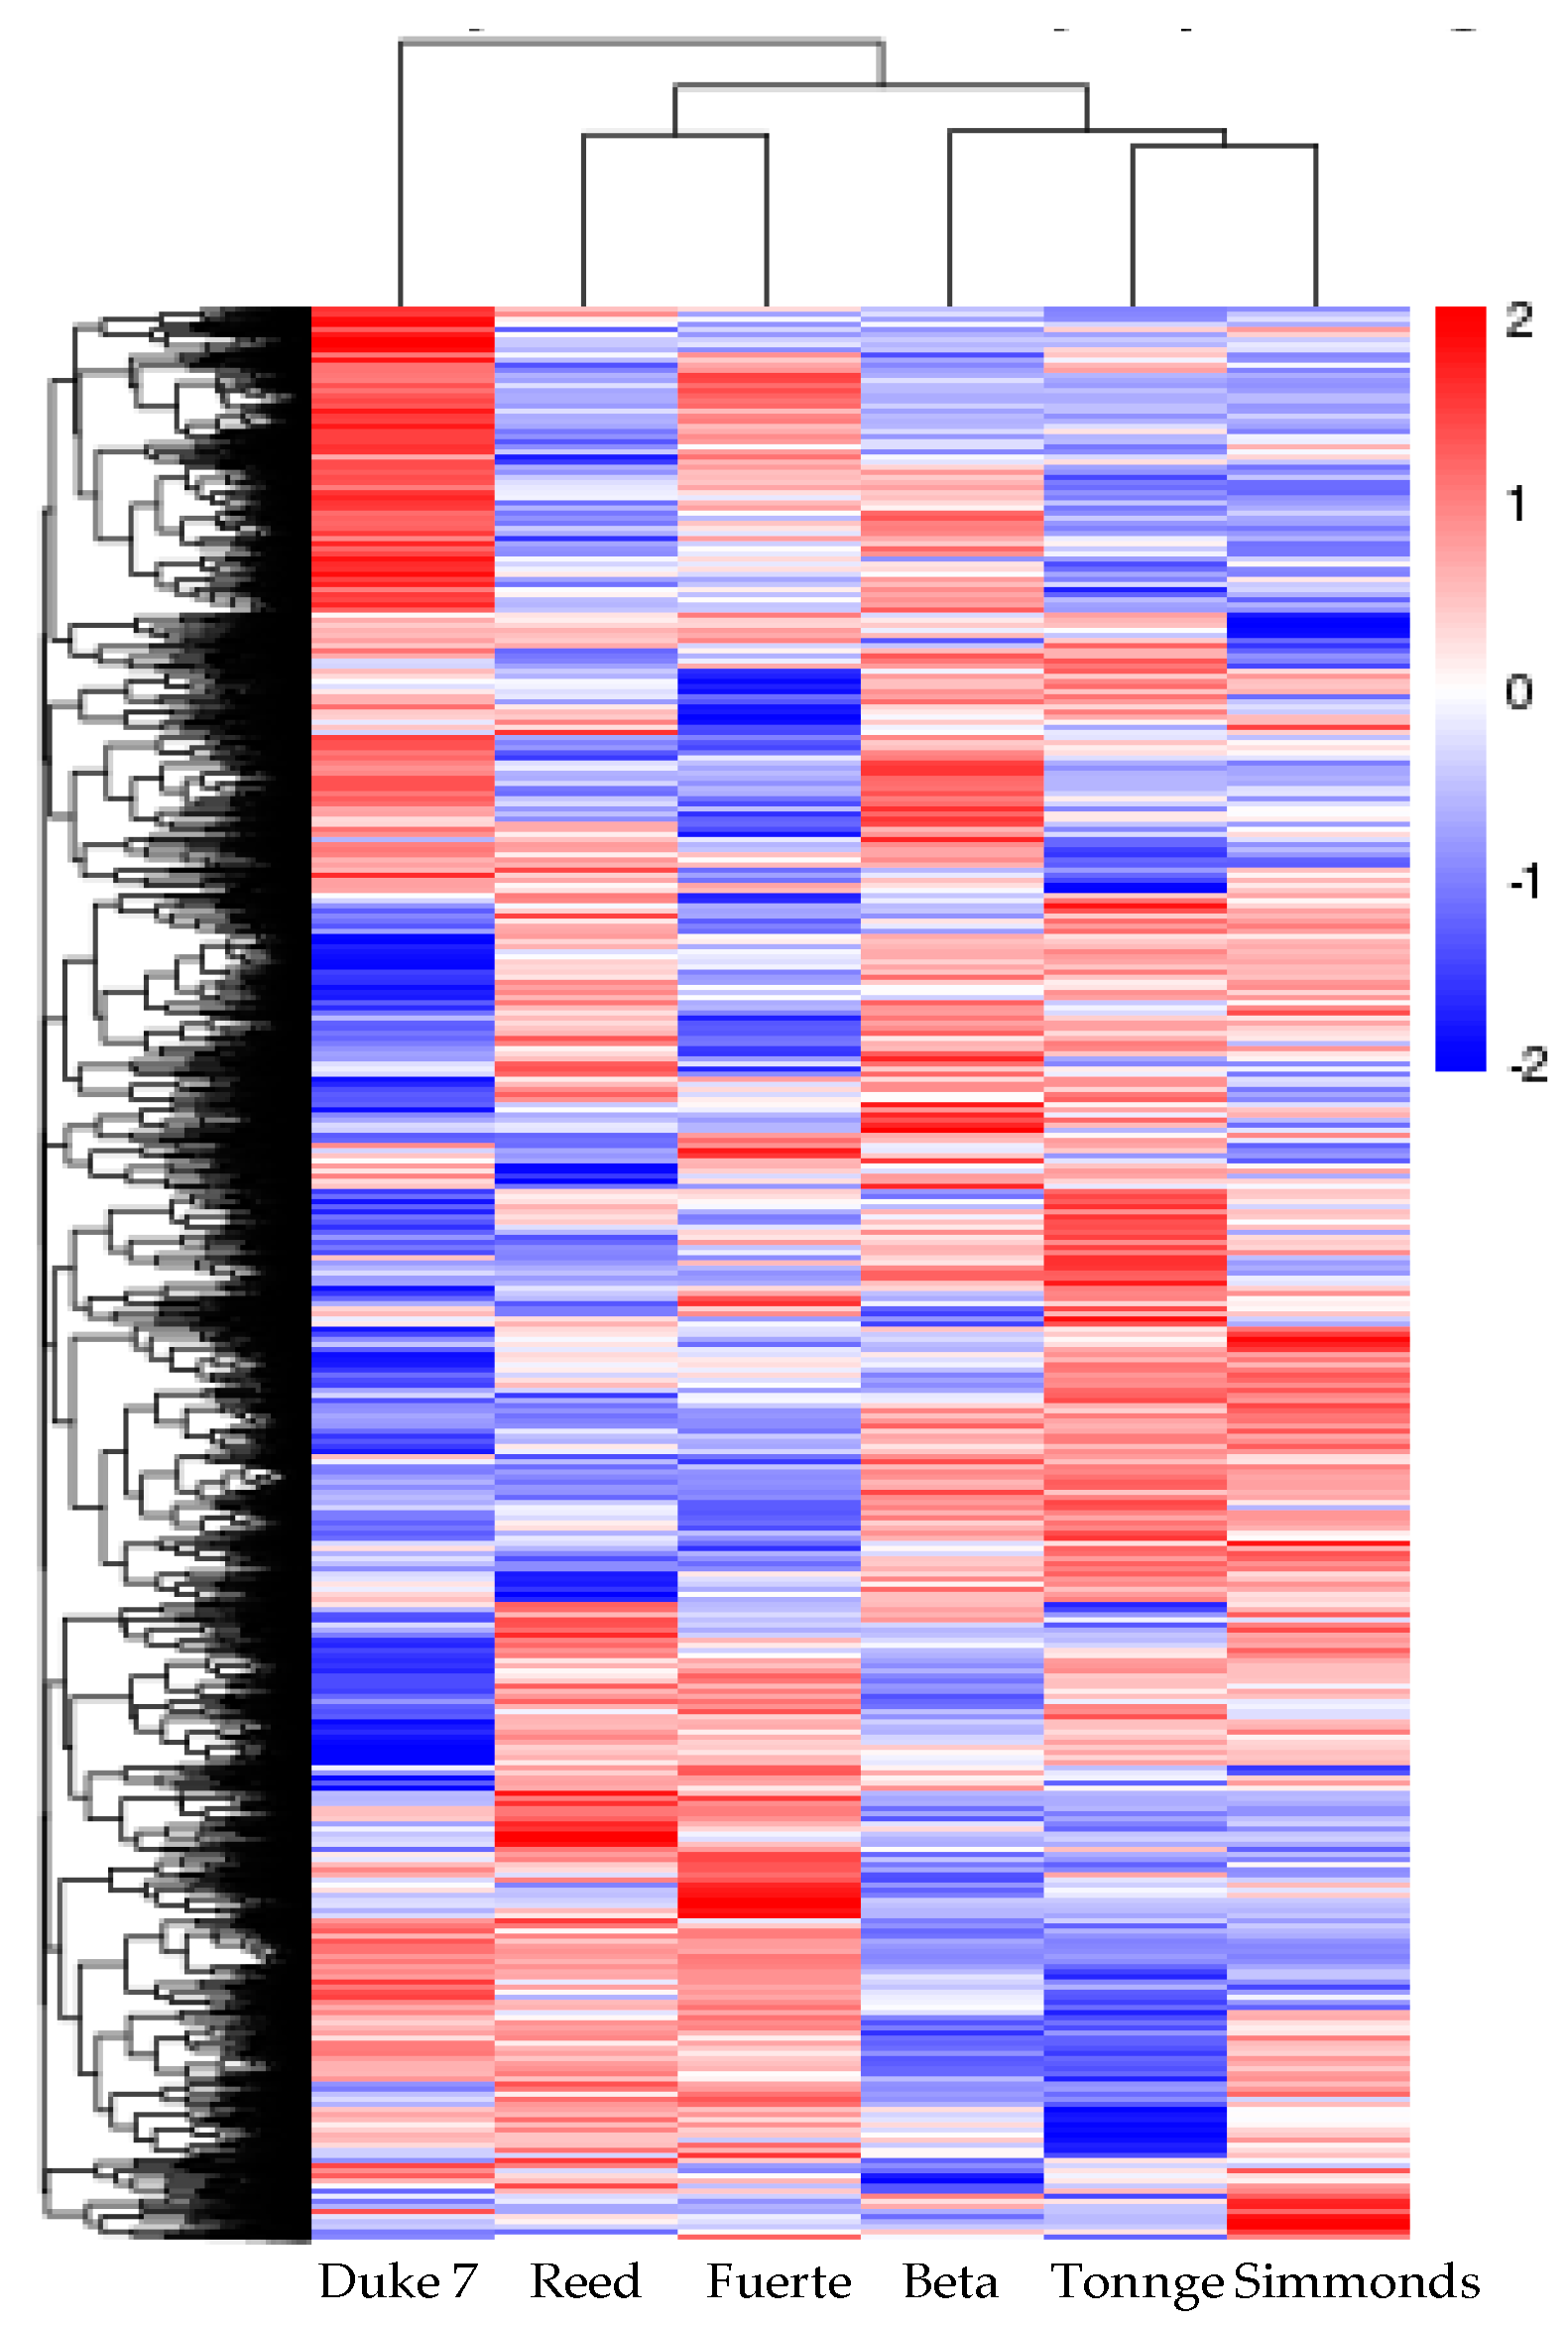
Among the six avocado cultivars, 6925 unigenes were differentially expressed: 5622 in Duke 7, 5393 in Reed, 5393 in Simmonds, 5055 in Fuerte, 4624 in Beta, and 4840 in Tonnage (Table S6; Figure 3). The number of shared DEGs between each sample pair varied from 1048 to 3559 (Table 3). The maximum number of DEGs was found between Duke 7 and Simmonds, while the minimum number was between Simmonds and Tonnage. In addition, the numbers of DEGs were generally higher between Duke 7 and each of other five avocado cultivars except Fuerte. For three pure ecotype avocado cultivars, in Duke 7 (Mexican), 1792 unigenes exhibited up-regulation and 1767 unigenes exhibited down-regulation as compared to Simmonds (West Indian), followed by 1376 up-regulated and 1143 down-regulated against Reed (Guatemalan). Similarly, a pairwise comparison of Reed (Guatemalan) and Simmonds (West Indian) exhibited 1096 and 1088 unigenes which were up-and down-regulated, respectively.

3.4. Frequency and Distribution of Different Types of EST-SSR Loci

The 154,310 detected unigene sequences comprising 142,337,653 bp in this study included 43,270 sequences containing 55,558 SSR loci (Table 4). Of these SSR-containing unigene sequences, 9789 harbored more than one SSR locus. Mononucleotide motifs were the most abundant (34,104, 61.38%), followed in order by di- (13,72; 24.69%), tri- (7161, 12.89%), tetra- (511, 0.92%), penta- (34, 0.06%) and hexanucleotide (28, 0.05%) motif repeats (Table 5).
The number of SSR repeats per locus ranged from five to 24. SSRs with more than 10 repeats were the most abundant, followed by those with six, five, and seven random repeats. Among the 94 different repeat types, (A/T)n was far and away the most abundant (98.88%). The six other main motif types were (AG/CT)n (17.10%), (AT/AT)n (4.58%), (AAG/CTT)n (4.18%), (AC/GT)n (2.90%), and (ATC/ATG)n (2.12%) (Table S7).

3.5. Development of Polymorphism EST-SSR Markers and Genetic Diversity

Using Primer 3, we developed 74,580 EST-SSR markers from the 55,558 SSR loci (Table S8). To test EST-SSR marker amplification, a subset of 100 EST-SSR markers was randomly chosen and used with seven pure ecotype accessions (Walter Hole, Duke 7, Nabal, Reed, Pollock, Donnie, and Simmonds) (Table S9). Of the tested markers, 31 (31%) successfully generated amplification products, while 26 primer pairs amplified nonpolymorphic products, and 43 did not amplify any clear DNA bands. The 31 polymorphic EST-SSR markers, which comprised 2 di-, 24 tri-, and 5 tetranucleotide motif-based markers, were further detected in all 28 known-ecotype avocado accessions. Finally, 16 polymorphic EST-SSR markers, whose missing allele frequencies were less than 10% in all 28 avocado accessions, were selected (Table S10).
A total of 98 alleles of the 16 polymorphic EST-SSR markers were detected in 28 avocado accessions, of which 32 alleles were considered to be accession-specific, and 66 alleles were generally detected in multiple accessions (Table S10). The 32 accession-specific alleles were derived from 18 accessions: two accessions (Loretta and Mian No.1) with three accession-specific alleles; 10 accessions (Nabal, Bacon, Simmonds, Miguel, Beta, Guikenda No. 2, Guiyan No. 8, Guiyan No. 10, Pinkerton, and Hass) with two accession-specific alleles each; and six accessions (Tonnage, Duke 7, Guikenda No. 3, Guikenda No. 4, Choquette, and Donnie) with only one accession-specific allele each.
The 16 polymorphic EST-SSRs were applied to evaluate diversity parameters (Table 6). Na amplified per SSR locus varied from three to 12, with a mean of 6.13, Ne varied from 1.44 to 6.75, with an average of 3.53, and Ho ranged from 0.00 to 0.39, averaging 0.06. He ranged from 0.30 to 0.85, with an average of 0.66, and PIC values ranged from 0.27 to 0.84, with an average of 0.61.

3.6. Genetic Relationship Analysis Based on Polymorphic EST-SSRs from Transcriptome Data

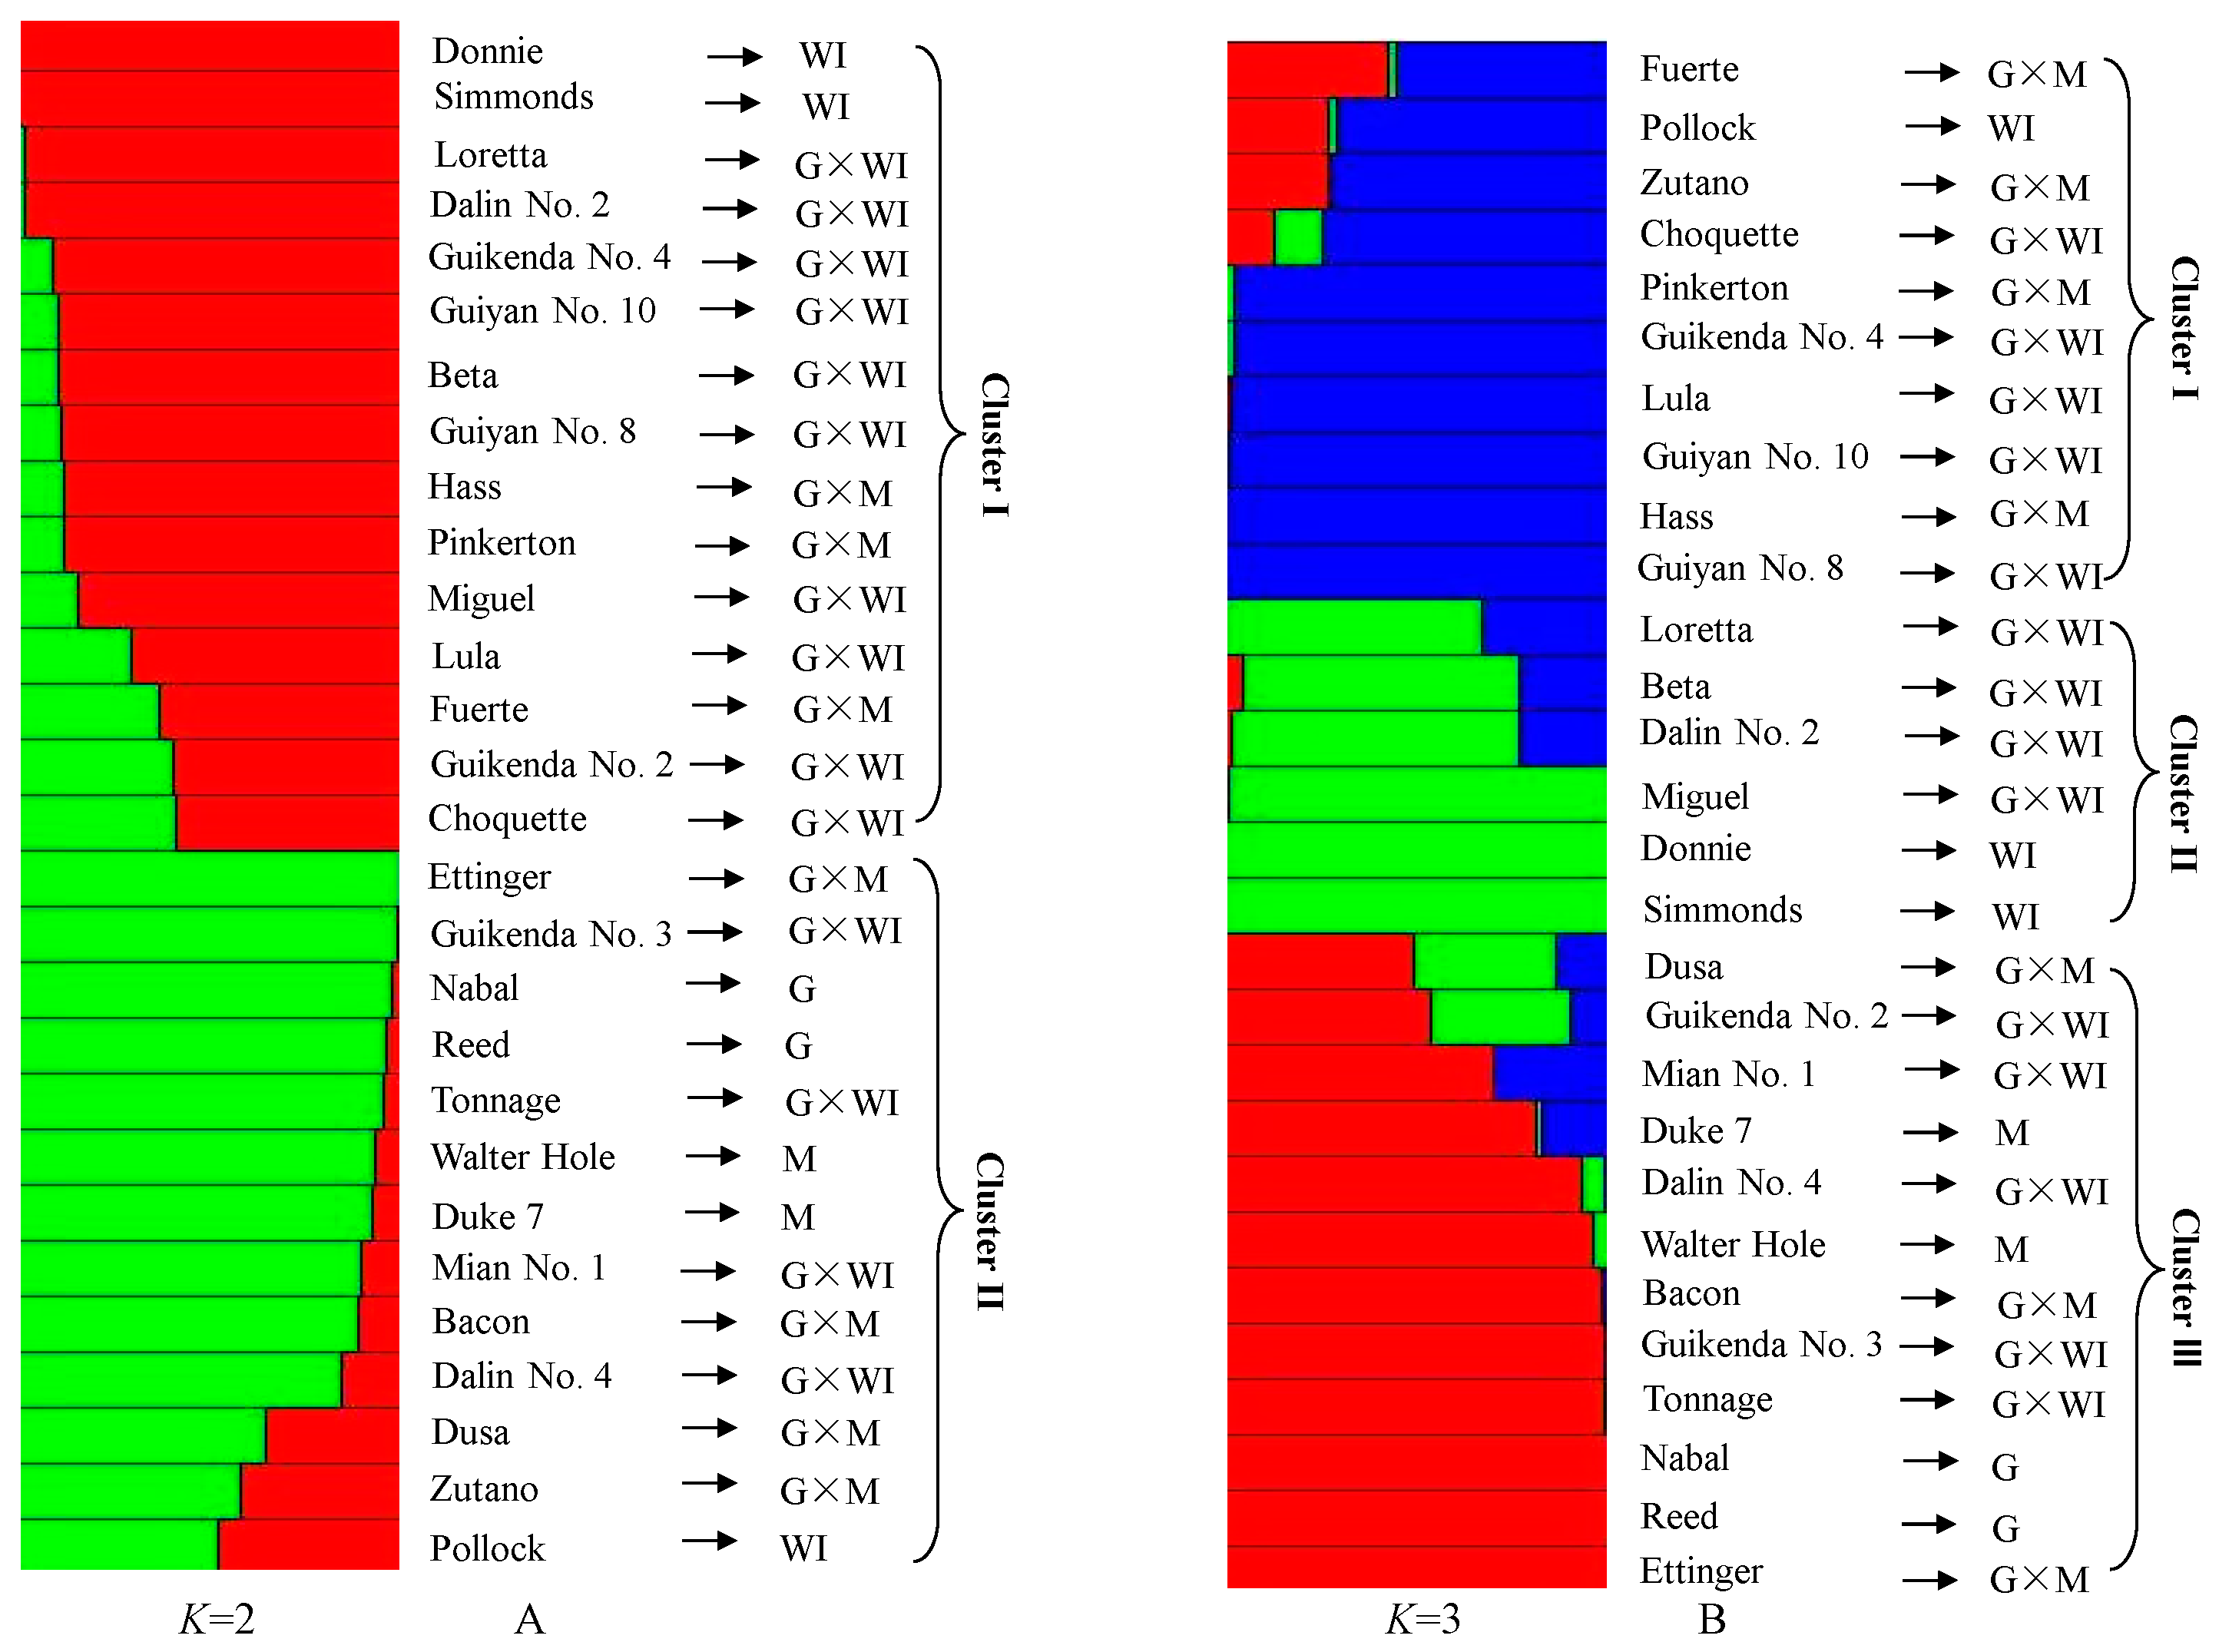
The genetic distances among the 28 avocado accessions based on 16 polymorphic EST-SSRs using MEGA v4 demonstrated that the genetic distances varied from 0.38 to 0.93 among the 28 avocado accessions (Table S11), and these avocado accessions were obviously distinct from each other. In the model-based analysis (Figure 4), assignment of all 28 individuals from the three ecological races and two interracial hybrids to genetic clusters using STRUCTURE revealed that the model with K = 2 grouped 15 individuals into cluster I, which was composed of two West Indian, ten Guatemalan × West Indian hybrids, and three Guatemalan × Mexican hybrid accessions, and the other 13 individuals together as cluster II, which was composed of the two Mexican, four Guatemalan × Mexican hybrids, two Guatemalan, and four Guatemalan × West Indian hybrid accessions (Figure 4). With the model K = 3, cluster I included one West Indian, five Guatemalan × West Indian hybrids, and four Guatemalan × Mexican hybrid accessions; in cluster II, two West Indian accessions were joined into a single cluster along with four Guatemalan × West Indian hybrid accessions; cluster III contained two Mexican, three Guatemalan × Mexican hybrids, two Guatemalan, and five Guatemalan × West Indian hybrid accessions (Figure 4). The genetic distances among the 28 avocado accessions and the results of STRUCTURE based on the 28 avocado accessions all demonstrated that the newly developed 16 polymorphic EST-SSRs from transcriptome data in this study could clearly and effectively distinguish the 28 avocado accessions.

4. Discussion

Avocado is a member of the family Lauraceae of the order Laurales [1]. Lauraceae is composed of 50 genera comprising 2500 to 3000 species of mostly trees and some shrubs, but only the genome of Cinnamomum micranthum has been sequenced. The lack of genomic information has hampered critical research on augmenting marker assisted breeding programs for avocado [21]. Hence, the development of an effective marker system to assess genetic diversity in avocado collections facilitates the maintenance of germplasm and cultivar improvement. Transcriptome sequencing and de novo assembly has proven to be an important tool for gene discovery in many organisms and an effective method for molecular marker development [23,24,25,35]. De novo assembly of avocado cv. “Hass” transcriptome during mesocarp development was conducted and identified tissue-specific regulation and biosynthesis of TAG, respectively [7,8]. Moreover, the transcriptomes of aerial buds, leaves, flowers, stems, seeds, and roots from an unknown Mexican accession were determined using different sequencing platforms, and it revealed strong differences in gene expression patterns between different organs [6]. Until recently, however, little attention has been paid to the transcriptome assemblies generated from different avocado ecotypes and the development of EST-SSRs from transcription sequencing. The transcriptome assembly generated in our study, which includes 4.30–6.68 Gb of sequence data from six avocado cultivars derived from different ecotypes, provides a large number of expressed unigenes that can contribute to downstream analyses in genetic studies and breeding improvement programs. Avocado is a highly variable species and has different ecotypes representing distinct evolutionary lineages [1]. The six avocado cultivars subjected to transcriptome sequencing in the present study were classified as Mexican, Guatemalan, and West Indian races and Guatemalan × Mexican and Guatemalan × West Indian hybrids. The transcriptomes in this study revealed strong differences in differentially expressed unigenes between different ecotypes. For the analyses of differentially expressed unigenes, differentially expressed unigenes between Duke 7 (Mexican) and Simmonds (West Indian) presented more than those between Duke 7 (Mexican) and Reed (Guatemalan), which suggested that Duke 7 (Mexican) and Reed (Guatemalan) could possess more close genetic relationships than Duke 7 (Mexican) and Simmonds (West Indian). This was also confirmed by our previous study [21]. Our transcriptome data may thus facilitate the studies on genetic diversity across avocado ecotypes. In addition, the numbers of differentially expressed unigenes were generally higher between Duke 7 and each of the other five avocado cultivars. In addition to the ecotype factor, the cultivar/rootstock factor could also contribute to more differentially expressed unigenes. Duke 7, classified as rootstock, is resistant to Persea cinnamomi, while the other five cultivars are known for their high fruit quality [1].
Because it is inexpensive and rapid, transcriptome sequencing is useful for obtaining a large number of unigene sequences from organisms lacking a reference sequence [46,47,48]. The N50 and mean lengths of avocado unigenes in our study were 1283 bp and 922 bp, respectively, which implies that our sequence assembly was accurate and effective. These N50 and mean lengths were higher than those obtained for other species, respectively, such as sweet potato (765 and 481 bp,) [49], Bletilla striata (957 and 612 bp) [33], Mucuna pruriens (987 and 626 bp) [50], Calanthe masuca (1,196 and 704 bp) [51], Calanthe sinica (1086 and 625 bp) [51],and Onobrychis viciifolia (1224 and 709 bp) [52]. The 154,310 unigenes derived from 29–45 million clean reads produced by Illumina sequencing in this study will facilitate further research on the physiology, biochemistry, and molecular genetics of avocado and related species.
In this study, an average of 1.28 SSR loci were detected per SSR-containing unigene sequence and the distribution density of SSR loci was 4.41 kb per SSR locus, both of which are intermediate between those of other species. For example, the average numbers of SSR loci per sequence and kb per SSR locus are, respectively, 1.35 and 4.02 in centipedegrass [53], 1.19 and 4.35 in Bletilla striata [33], and 1.26 and 5.33 in Mucuna pruriens [54]. SSR motif type and abundance are the main characteristics of microsatellites. Similar to the results of the previous research [33], the most abundant motif types in this study were mononucleotides (34,104, 61.38%), followed by dinucleotides (13,720, 24.69%) and trinucleotides (7161, 12.89%). Within our polymorphic SSR set, (A/T)n and (AG/CT)n were the most prevalent in their respective repeat class, similar to findings in other species [33,55,56]. The bias towards (A/T)n is likely due to remnants of mRNA poly-A tails [53]. Prior research has also suggested that (AG/CT)n repeat motifs are generally present in the 5′ untranslated regions and may be involved in transcription and regulation [54,56]. alternatively, AG/CT motifs are present in CUC and UCU codons and translate to Ala and Leu, respectively, the most abundant amino acids in proteins [33]. The 100 EST-SSR markers randomly selected for validation in this study had an amplification rate of 57%, and 31 were markedly polymorphic. This amplification rate and polymorphism percentage is lower than that of a previous report [5]. In a subsequent genetic diversity analysis of these polymorphic EST-SSR markers among the 28 avocado accessions, 16 markers produced three to 12 alleles (6.13 alleles per locus), which was lower than 9.75 alleles per SSR locus of Alcaraz and Hormaza [57], 11.40 alleles per SSR locus of Gross-German and Viruel [5], and 18.8 alleles per SSR locus of Schnell [18]. This could be because the expressed sequences, from which EST-SSR are derived, are highly conserved. Nevertheless, in this study, we report an efficient protocol for the development of EST-SSR markers of avocado cultivars from RNA-sequence. In addition, 32 accession-specific alleles derived from 18 accessions were detected and could be used for molecular identification of the corresponding accession. A PIC above 0.5 is generally considered to be a high polymorphism rate [58]. In the present study, 13 out of 16 polymorphic EST-SSRs had a high polymorphism rate, and the exceptions were Pa-eSSR-16 (PIC = 0.27), Pa-eSSR-10 (PIC = 0.33), and Pa-eSSR-3 (PIC = 0.46). These 13 EST-SSRs were highly informative and had high resolving power. SSRs are notorious for having relatively high frequencies of null alleles, and SSRs with such average prevalence of null alleles (up to 15% for some loci) could bias allele frequencies, reduce the observed heterozygosity, increase apparent levels of inbreeding seriously, and therefore misleading in the genetic diversity analysis [59]. In this study, seven null alleles were detected, including one from Pa-eSSR-3, two from Pa-eSSR-6, one from Pa-eSSR-9, one from Pa-eSSR-11, one from Pa-eSSR-12, and one from Pa-eSSR-14; and the percentage of null alleles for each locus would not affect the accuracy of genetic diversity analysis of avocado. These five primers failed to amplify any product in one or two genotypes. This can be explained by the fact that the ESTs, which are derived from cDNAs, lack introns and EST-SSRs that are unrecognized intron splice sites could disrupt priming sites resulting in failed amplification, alternatively, large introns could fall between the primers resulting in a product that is either too large or, in extreme cases, failed amplification [60].
The rough separation of the 28 avocado accessions into a Mexican and Guatemalan genotype-related population and a West Indian genotype-related population by STRUCTURE is reasonable and in agreement with previous reports [18,21]. These results suggested that Mexican, Guatemalan, and Mexican and Guatemalan hybrids were most closely related to one another, while West Indian and Guatemalan × West Indian hybrids were closer to each other. At K = 3, STRUCTURE model-based inference could not obviously distinguish the 28 avocado accessions based on three ecotypes and two interracial hybrids. The cause of the phenomenon could be that the number of interracial hybrids was more than the number of the pure ecotypes, especially for Guatemalan × West Indian hybrids, the number of which was half of all the 28 avocado accessions. Similarly, Alcaraz and Hormaza [59] analyzed the genetic diversity of 78 avocado cultivars using 16 gSSRs, and only 18 pure ecotypes could be observed in this avocado collection. Their results indicated that the dendrogram generated from UPGMA cluster analysis could be roughly divided into two main clusters with no bootstrap support and with accessions of different origin intermixed. Gross-German and Viruel [5] suggested that interracial hybrid character could alter the diversity distribution and blurred the clear boundaries among avocado ecotypes. However, these 16 polymorphic EST-SSRs could clearly and effectively distinguish the 28 avocado accessions based on the results of the genetic distances and STRUCTURE among the 28 avocado accessions. There is no doubt that these novel EST-SSR markers will be helpful for future research on germplasm conservation and breeding programs for avocado. In addition, the analysis of genetic diversity is a prerequisite for its exploration and utilization.

5. Conclusions

In summary, we obtained 32.44 Gb of sequence data representing six avocado cultivars: one Guatemalan, one Mexican, and one West Indian, and one Guatemalan × Mexican, and two Guatemalan × West Indian hybrids. A total of 154,310 unigenes with an average length of 922 bp were detected and annotated in Nr, Nt, Swiss-Prot, Pfam, GO, and KOG databases. Among these unigenes, 49,811, 16,309, and 25,162 were assigned to GO, KOG, and KEGG classifications, respectively. We detected 55,558 SSR loci in 43,270 unigene sequences and used them to develop 74,580 EST-SSR markers. From a randomly selected subset comprising 100 EST-SSR markers, we finally detected 16 polymorphic EST-SSR markers harboring a total of 98 alleles, which ranged from three to 12 per locus. STRUCTURE analysis separated the 28 avocado accessions into two groups. These newly developed 16 EST-SSR markers should serve as a significant resource for the assessment of avocado accessions and may contribute to the better management of avocado resources for germplasm conservation and breeding programs.

Supplementary Materials

The following are available online at https://www.mdpi.com/1999-4907/10/5/411/s1. Table S1. Characteristics of six accessions based on transcriptome data; Table S2. Characteristics of GO annotations of assembled avocado unigenes; Table S3. Characteristics of KOG classifications of assembled avocado unigenes; Table S4. Characteristics of KEGG pathways of assembled avocado unigenes; Table S5. Transcription factors identified in the avocado assembly; Table S6. Expression levels (FPKM) of all differentially expressed genes in the avocado assembly; Table S7. Frequencies of different repeat motifs in EST-SSRs from avocado; Table S8. Characteristics of avocado EST-SSR markers in this study; Table S9. Summary of 100 EST-SSR markers used for amplification; Table S10. Summary of 16 EST-SSRs in 28 avocado accessions; Table S11. The genetic distances among 28 avocado accessions based on 16 polymorphic EST-SSRs from transcriptome data; Additional file 1. BLAST-based coding sequence prediction against NR and Swiss-Prot protein databases; Additional file 2. Coding sequence prediction using ESTScan.

Author Contributions

Y.G. and R.Z. conceived and designed the experiments; L.T., B.W., and T.Z. performed the experiments; T.W analyzed the data; F.M. and Z.X. assisted in the completion of the experiments; H.C. and M.Z. contributed materials; and Y.G. wrote the paper.

Funding

This research was funded by the National Natural Science Foundation of China (grant number 31701883) and the Natural Science Foundation of Hainan Province of China (grant number 319QN266).

Acknowledgments

We gratefully acknowledge Weihong Ma and Pingzhen Lin from the Haikou Experimental Station of the Chinese Academy of Tropical Agricultural Sciences for their valuable support in avocado resource collection. We thank Barbara Goodson for editing the English text of a draft of this manuscript.

Conflicts of Interest

The authors declare no conflict of interest.

References

  1. Schaffer, B.; Wolstenholme, B.N.; Whiley, A.W. The Avocado: Botany, Production and Uses, 2nd ed.; CPI Group (UK) Ltd.: Croydon, UK, 2012. [Google Scholar]
  2. Chanderbali, A.S.; Albert, V.A.; Ashworth, V.E.T.M.; Clegg, M.T.; Litz, R.E.; Soltis, D.E.; Soltis, P.S. Persea americana (avocado): Bringing ancient flowers to fruit in the genomics era. BioEssays 2008, 304, 386–396. [Google Scholar] [CrossRef]
  3. Chanderbali, A.S.; Albert, V.A.; Leebens-Mackd, J.; Altmane, N.S.; Soltis, D.E.; Soltis, P.S. Transcriptional signatures of ancient floral developmental genetics in avocado (Persea americana; Lauraceae). Proc. Natl. Acad. Sci. USA 2009, 106, 8929–8934. [Google Scholar] [CrossRef] [Green Version]
  4. Galindo-Tovar, M.E.; Ogata-Aguilar, N.; Arzate-Fernandez, A.M. Some aspects of avocado (Persea americana Mill.) diversity and domestication in Mesoamerica. Genet. Resour. Crop Evol. 2008, 55, 441–450. [Google Scholar] [CrossRef]
  5. Gross-German, E.; Viruel, M.A. Molecular characterization of avocado germplasm with a new set of SSR and EST-SSR markers: Genetic diversity, population structure, and identification of race-specific markers in a group of cultivated genotypes. Tree Genet. Genomes 2013, 9, 539–555. [Google Scholar] [CrossRef]
  6. Ibarra-Laclette, E.; Méndez-Bravo, A.; Pérez-Torres, C.A.; Albert, V.A.; Mockaitis, K.; Kilaru, A.; López-Gómez, R.; Cervantes-Luevano, J.I.; Herrera-Estrell, L. Deep sequencing of the Mexican avocado transcriptome, an ancient angiosperm with a high content of fatty acids. BMC Genom. 2015, 16, 599. [Google Scholar] [CrossRef] [PubMed]
  7. Kilaru, A.; Cao, X.; Dabbs, P.B.; Sung, H.J.; Rahman, M.M.; Thrower, N.; Zynda, G.; Podicheti, R.; Ibarra-Laclette, E.; Herrera-Estrella, L.; et al. Oil biosynthesis in a basal angiosperm: Transcriptome analysis of Persea Americana mesocarp. BMC Plant Biol. 2015, 15, 203. [Google Scholar] [CrossRef]
  8. Vergara-Pulgar, C.; Rothkegel, K.; González-Agüero, M.; Pedreschi, R.; Campos-Vargas, R.; Defilippi, B.G.; Meneses, C. De novo assembly of Persea americana cv.’Hass’ transcriptome during fruit development. BMC Genom. 2019, 20, 108. [Google Scholar] [CrossRef] [PubMed]
  9. FAOSTAT. 2019. Available online: http://www.fao.org/faostat/en/#data/QC (accessed on 27 April 2019).
  10. Dreher, M.L.; Davenport, A.J. Hass avocado composition and potential health effects. Crit. Rev. Food Sci. 2013, 53, 738–750. [Google Scholar] [CrossRef]
  11. Galvão, M.D.S.; Narain, N.; Nigam, N. Influence of different cultivars on oil quality and chemical characteristics of avocado fruit. Food Sci. Technol. 2014, 34, 539–546. [Google Scholar] [CrossRef] [Green Version]
  12. Ge, Y.; Si, X.Y.; Cao, J.Q.; Zhou, Z.X.; Wang, W.L.; Ma, W.H. Morphological characteristics, nutritional quality, and bioactive constituents in fruits of two avocado (Persea americana) varieties from hainan province, China. J. Agric. Sci. 2017, 9, 8–17. [Google Scholar] [CrossRef]
  13. Fiedler, J.; Bufler, G.; Bangerth, F. Genetic relationships of avocado (Persea americana Mill.) using RAPD markers. Euphytica 1998, 101, 249–255. [Google Scholar] [CrossRef]
  14. Mhameed, S.; Sharon, D.; Kaufman, D.; Lahav, E.; Hillel, J.; Degani, C.; Lavi, U. Genetic relationships within avocado (Persea americana Mill.) cultivars and between Persea species. Theor. Appl. Genet. 1997, 94, 279–286. [Google Scholar] [CrossRef]
  15. Furnier, G.R.; Cummings, M.P.; Clegg, M.T. Evolution of the avocados as revealed by DNA restriction site variation. J. Hered. 1990, 81, 183–188. [Google Scholar] [CrossRef]
  16. Davis, J.; Henderson, D.; Kobayashi, M. Genealogical relationships among cultivated avocado as revealed through RFLP analysis. J. Hered. 1998, 89, 319–323. [Google Scholar] [CrossRef]
  17. Ashworth, V.E.T.M.; Clegg, M.T. Microsatellite markers in avocado (Persea americana Mill.). genealogical relationships among cultivated avocado genotypes. J. Hered. 2003, 94, 407–415. [Google Scholar] [CrossRef] [PubMed]
  18. Schnell, R.J.; Brown, J.S.; Olano, C.T.; Power, E.J.; Krol, C.A.; Kuhn, D.N.; Motamayor, J.C. Evaluation of avocado germplasm using microsatellite markers. J. Am. Soc. Hortic. Sci. 2003, 128, 881–889. [Google Scholar] [CrossRef]
  19. Chen, H.; Morrel, P.L.; Ashwoth, V.E.T.M.; De la Cruz, M.; Clegg, M.T. Nucleotide diversity and linkage disequilibrium in wild avocado (Persea americana Mill.). J. Hered. 2008, 99, 382–389. [Google Scholar] [CrossRef] [PubMed]
  20. Chen, H.; Morrel, P.L.; Ashwoth, V.E.T.M.; De la Cruz, M.; Clegg, M.T. Tracing the geographic origins of mayor avocado cultivars. J. Hered. 2009, 100, 56–65. [Google Scholar] [CrossRef] [PubMed]
  21. Ge, Y.; Zhang, T.; Wu, B.; Tan, L.; Ma, F.N.; Zou, M.H.; Chen, H.H.; Pei, J.L.; Liu, Y.Z.; Chen, Z.H.; et al. Genome-wide assessment of avocado germplasm determined from specific length amplified fragment sequencing and transcriptomes: Population structure, genetic diversity, identification, and application of race-specific markers. Genes 2019, 10, 215. [Google Scholar] [CrossRef]
  22. Ge, Y.; Ramchiary, N.; Wang, T.; Liang, C.; Wang, N.; Wang, Z.; Choi, S.R.; Lim, Y.P.; Piao, Z.Y. Development and linkage mapping of unigene-derived microsatellite markers in Brassica rapa L. Breed. Sci. 2011, 61, 160–167. [Google Scholar] [CrossRef] [Green Version]
  23. Hou, M.Y.; Mu, G.J.; Zhang, Y.J.; Cui, S.L.; Yang, X.L.; Liu, L.F. Evaluation of total flavonoid content and analysis of related EST-SSR in Chinese peanut germplasm. Crop Breed. Appl. Biotechnol. 2017, 17, 221–227. [Google Scholar] [CrossRef] [Green Version]
  24. Azevedo, A.O.N.; Azevedo, C.D.O.; Santos, P.H.A.D.; Ramos, H.C.C.; Boechat, M.S.B.; Arêdes, F.A.S.; Ramos, S.R.R.; Mirizola, L.A.; Perera, L.; Aragão, W.M.; et al. Selection of legitimate dwarf coconut hybrid seedlings using DNA fingerprinting. Crop Breed. Appl. Biotechnol. 2018, 18, 409–416. [Google Scholar] [CrossRef]
  25. Ferreira, F.; Scapim, C.A.; Maldonado, C.; Mora, F. SSR-based genetic analysis of sweet corn inbred lines using artificial neural networks. Crop Breed. Appl. Biotechnol. 2018, 18, 309–313. [Google Scholar] [CrossRef]
  26. Penin, A.A.; Klepikova, A.V.; Kasianov, A.S.; Gerasimov, E.S.; Logacheva, M.D. Comparative analysis of developmental transcriptome maps of Arabidopsis thaliana and Solanum lycopersicum. Genes 2019, 10, 50. [Google Scholar] [CrossRef]
  27. Qiao, F.; Cong, H.Q.; Jiang, X.F.; Wang, R.X.; Yin, J.M.; Qian, D.; Wang, Z.N. De novo characterization of a cephalotaxus hainanensis transcriptome and genes related to paclitaxel biosynthesis. PLoS ONE 2014, 9, e106900. [Google Scholar] [CrossRef]
  28. Weisberg, A.J.; Kim, G.; Westwood, J.H.; Jelesko, J.G. Sequencing and de novo assembly of the toxicodendron radicans (Poison Ivy) transcriptome. Genes 2017, 8, 317. [Google Scholar] [CrossRef]
  29. Wu, J.; Cai, C.F.; Cheng, F.Y.; Cui, H.L.; Zhou, H. Characterization and development of EST-SSR markers in tree peony using transcriptome sequences. Mol. Breed. 2014, 34, 1853–1866. [Google Scholar] [CrossRef]
  30. Chopra, R.; Burow, G.; Hayes, C.; Emendack, Y.; Xin, Z.G.; Burke, J. Transcriptome profiling and validation of gene based single nucleotide polymorphisms (SNPs) in sorghum genotypes with contrasting responses to cold stress. BMC Genom. 2015, 16, 1040. [Google Scholar] [CrossRef]
  31. Thumilan, B.M.; Sajeevan, R.S.; Madhuri, B.J.T.; Nataraja, K.N.; Sreeman, S.M. Development and characterization of genic SSR markers from Indian mulberry transcriptome and their transferability to related species of Moraceae. PLoS ONE 2016, 11, e0162909. [Google Scholar] [CrossRef]
  32. Chen, C.L.; Xu, M.L.; Wang, C.P.; Qiao, G.X.; Wang, W.W.; Tan, Z.Y.; Wu, T.T.; Zhang, Z.S. Characterization of the Lycium barbarum fruit transcriptome and development of EST-SSR markers. PLoS ONE 2017, 12, e0187738. [Google Scholar] [CrossRef]
  33. Xu, D.; Chen, H.; Aci, M.; Pan, Y.; Shangguan, Y.; Ma, J.; Li, L.; Qian, G.; Wang, Q.X. De Novo assembly, characterization and development of EST-SSRs from Bletilla striata transcriptomes profiled throughout the whole growing period. PLoS ONE 2018, 13, e0205954. [Google Scholar] [CrossRef] [PubMed]
  34. Biswas, M.K.; Nath, U.K.; Howlader, J.; Bagchi, M.; Natarajan, S.; Kayum, M.A.; Kim, H.T.; Park, J.I.; Kang, J.G.; Nou, I.S. Exploration and exploitation of novel SSR markers for candidate transcription factor genes in Lilium species. Genes 2018, 9, 97. [Google Scholar] [CrossRef]
  35. Ma, S.L.Y.; Dong, W.S.; Lyu, T.; Lyu, Y.M. An RNA sequencing transcriptome analysis and development of EST-SSR markers in Chinese hawthorn through Illumina sequencing. Forests 2019, 10, 82. [Google Scholar] [CrossRef]
  36. Chen, Z.H.; Ge, Y.; Sun, P.G.; Sun, C.J.; Wu, Q. The effects of propagating material and culture conditions on the propagation coefficient of avocado seedlings. China Fruit 2017, 5, 61–64. [Google Scholar] [CrossRef]
  37. Grabherr, M.G.; Haas, B.J.; Yassour, M.; Levin, J.Z.; Thompson, D.A.; Amit, I.; Adiconis, X.; Fan, L.; Raychowdhury, R.; Zeng, Q.D.; et al. Trinity: Reconstructing a full-length transcriptome without a genome from RNA-Seq data. Nat. Biotechnol. 2011, 29, 644–652. [Google Scholar] [CrossRef] [PubMed]
  38. Davidson, N.M.; Oshlack, A. Corset: Enabling differential gene expression analysis for de novo assembled transcriptomes. Genome Biol. 2014, 15, 410. [Google Scholar] [CrossRef] [PubMed]
  39. Kanehisa, M.; Araki, M.; Goto, S.; Hattori, M.; Hirakawa, M.; Itoh, M.; Katayama, T.; Kawashima, S.; Okuda, S.; Tokimatsu, T.; et al. KEGG for linking genomes to life and the environment. Nucleic Acids Res. 2008, 36, 480–484. [Google Scholar] [CrossRef]
  40. Götz, S.; García-Gómez, J.M.; Terol, J.; Williams, T.D.; Nagaraj, S.H.; Nueda, M.J.; Robles, M.; Talon, M.; Dopazo, J.; Conesa, A. High-throughput functional annotation and data mining with the Blast2GO suite. Nucleic Acids Res. 2008, 36, 3420–3435. [Google Scholar] [CrossRef] [Green Version]
  41. Perez-Rodriguez, P.; Riano-Pachon, D.M.; Correa, L.G.; Rensing, S.A.; Kersten, B.; Mueller-Roeber, B. PlnTFDB: Updated content and new features of the plant transcription factor database. Nucleic Acids Res. 2010, 38, 822–827. [Google Scholar] [CrossRef]
  42. Krawczak, M.; Nikolaus, S.; von Eberstein, H.; Croucher, P.J.; El Mokhtari, N.E.; Schreiber, S. PopGen: Population based recruitment of patients and controls for the analysis of complex genotype-phenotype relationships. Community Genet. 2006, 9, 55–61. [Google Scholar] [CrossRef]
  43. Tamura, K.; Dudley, J.; Nei, M.; Kumar, S. MEGA4: Molecular evolutionary genetics analysis (MEGA) software version 4.0. Mol. Biol. Evol. 2007, 24, 1596–1599. [Google Scholar] [CrossRef]
  44. Pritchard, J.K.; Stephens, M.; Donnelly, P. Inference of population structure using multilocus genotype data. Genetics 2000, 155, 945–959. [Google Scholar]
  45. Evanno, G.; Regnaut, S.; Goudet, J. Detecting the number of clusters of individuals using the software STRUCTURE: A simulation study. Mol. Ecol. 2005, 14, 2611–2620. [Google Scholar] [CrossRef]
  46. Du, M.; Li, N.; Niu, B.; Liu, Y.; You, D.; Jiang, D.; Ruan, C.Q.; Qin, Z.Q.; Song, T.W.; Wang, W.T. De novo transcriptome analysis of Bagarius yarrelli (Siluriformes: Sisoridae) and the search for potential SSR markers using RNA-Seq. PLoS ONE 2018, 13, e0190343. [Google Scholar] [CrossRef] [PubMed]
  47. Liu, F.M.; Hong, Z.; Yang, Z.J.; Zhang, N.N.; Liu, X.J.; Xu, D.P. De Novo transcriptome analysis of Dalbergia odorifera T. Chen (Fabaceae) and transferability of SSR markers developed from the transcriptome. Forests 2019, 10, 98. [Google Scholar] [CrossRef]
  48. Li, W.; Zhang, C.P.; Jiang, X.Q.; Liu, Q.C.; Liu, Q.H.; Wang, K.L. De Novo transcriptomic analysis and development of EST–SSRs for Styrax japonicas. Forests 2018, 9, 748. [Google Scholar] [CrossRef]
  49. Wang, Z.Y.; Fang, B.P.; Chen, J.Y.; Zhang, X.J.; Luo, Z.X.; Huang, L.F.; Chen, X.L.; Li, Y.L. De novo assembly and characterization of root transcriptome using Illumina paired-end sequencing and development of cSSR markers in sweetpotato (Ipomoea batatas). BMC Genom. 2010, 11, 726. [Google Scholar] [CrossRef]
  50. Sathyanarayana, N.; Pittala, R.K.; Tripathi, P.K.; Chopra, R.; Singh, H.R.; Belamkar, V.; Bhardwaj, P.K.; Doyle, J.J.; Egan, A.N. Transcriptomic resources for the medicinal legume Mucuna pruriens: de novo Transcriptome assembly, annotation, identification and validation of EST-SSR markers. BMC Genom. 2017, 18, 409. [Google Scholar] [CrossRef]
  51. Hu, C.; Yang, H.X.; Jiang, K.; Wang, L.; Yang, B.; Hsireh, T.; Lan, S.; Huang, W.C. Development of polymorphic microsatellite markers by using de novo transcriptome assembly of Calanthe masuca and C. sinica (Orchidaceae). BMC Genom. 2018, 19, 800. [Google Scholar] [CrossRef] [PubMed]
  52. Mora-Ortiz, M.; Swain, M.T.; Vickers, M.J.; Hegarty, M.J.; Kelly, R.; Smith, L.M.J.; Skot, L. De-novo transcriptome assembly for gene identification, analysis, annotation, and molecular marker discovery in Onobrychism viciifolia. BMC Genom. 2016, 17, 756. [Google Scholar] [CrossRef] [PubMed]
  53. Li, J.; Guo, H.; Wang, Y.; Zong, J.; Chen, J.; Li, D.D.; Li, L.; Wang, J.J.; Liu, J.X. High-throughput SSR marker development and its application in a centipedegrass (Eremochloa ophiuroides (Munro) Hack.) genetic diversity analysis. PLoS ONE 2018, 13, e0202605. [Google Scholar] [CrossRef]
  54. Mun, J.H.; Kim, D.J.; Choi, H.K.; Gish, J.; Debellé, F.; Mudge, J.; Denny, R.; Endré, G.; Saurat, O.; Dudez, A.M. Distribution of microsatellites in the genome of Medicago truncatula: A resource of genetic markers that integrate genetic and physical maps. Genetics 2006, 172, 2541–2555. [Google Scholar] [CrossRef]
  55. Chen, H.; Wang, L.; Wang, S.; Liu, C.; Blair, M.W.; Cheng, X. Transcriptome Sequencing of Mung Bean (Vigna radiate L.) Genes and the identification of EST-SSR markers. PLoS ONE 2015, 10, e0120273. [Google Scholar] [CrossRef] [PubMed]
  56. Zhang, L.; Yuan, D.; Yu, S.; Li, Z.; Cao, Y.; Miao, Z.; Qian, H.; Tang, K. Preference of simple sequence repeats in coding and non-coding regions of Arabidopsis thaliana. Bioinformatics 2004, 20, 1081–1086. [Google Scholar] [CrossRef] [Green Version]
  57. Alcaraz, M.L.; Hormaza, J.I. Molecular characterization and genetic diversity in an avocado collection of cultivars and local Spanish genotypes using SSRs. Heredity 2007, 144, 244–253. [Google Scholar] [CrossRef]
  58. Botstein, D.; White, R.L.; Skolnick, M.; Davis, R.W. Construction of a genetic linkage map in man using restriction fragment length polymorphisms. Am. J. Hum. Genet. 1980, 32, 314–331. [Google Scholar] [PubMed]
  59. Oddou-Muratorio, S.; Vendramin, G.G.; Buiteveld, J.; Fady, B. Population estimators or progeny tests: What is the best method to assess null allele frequencies at SSR loci? Conserv. Genet. 2009, 10, 1343. [Google Scholar] [CrossRef]
  60. Ellis, J.R.; Burke, J.M. EST-SSRs as a resource for population genetic analyses. Heredity 2007, 99, 125–132. [Google Scholar] [CrossRef] [Green Version]
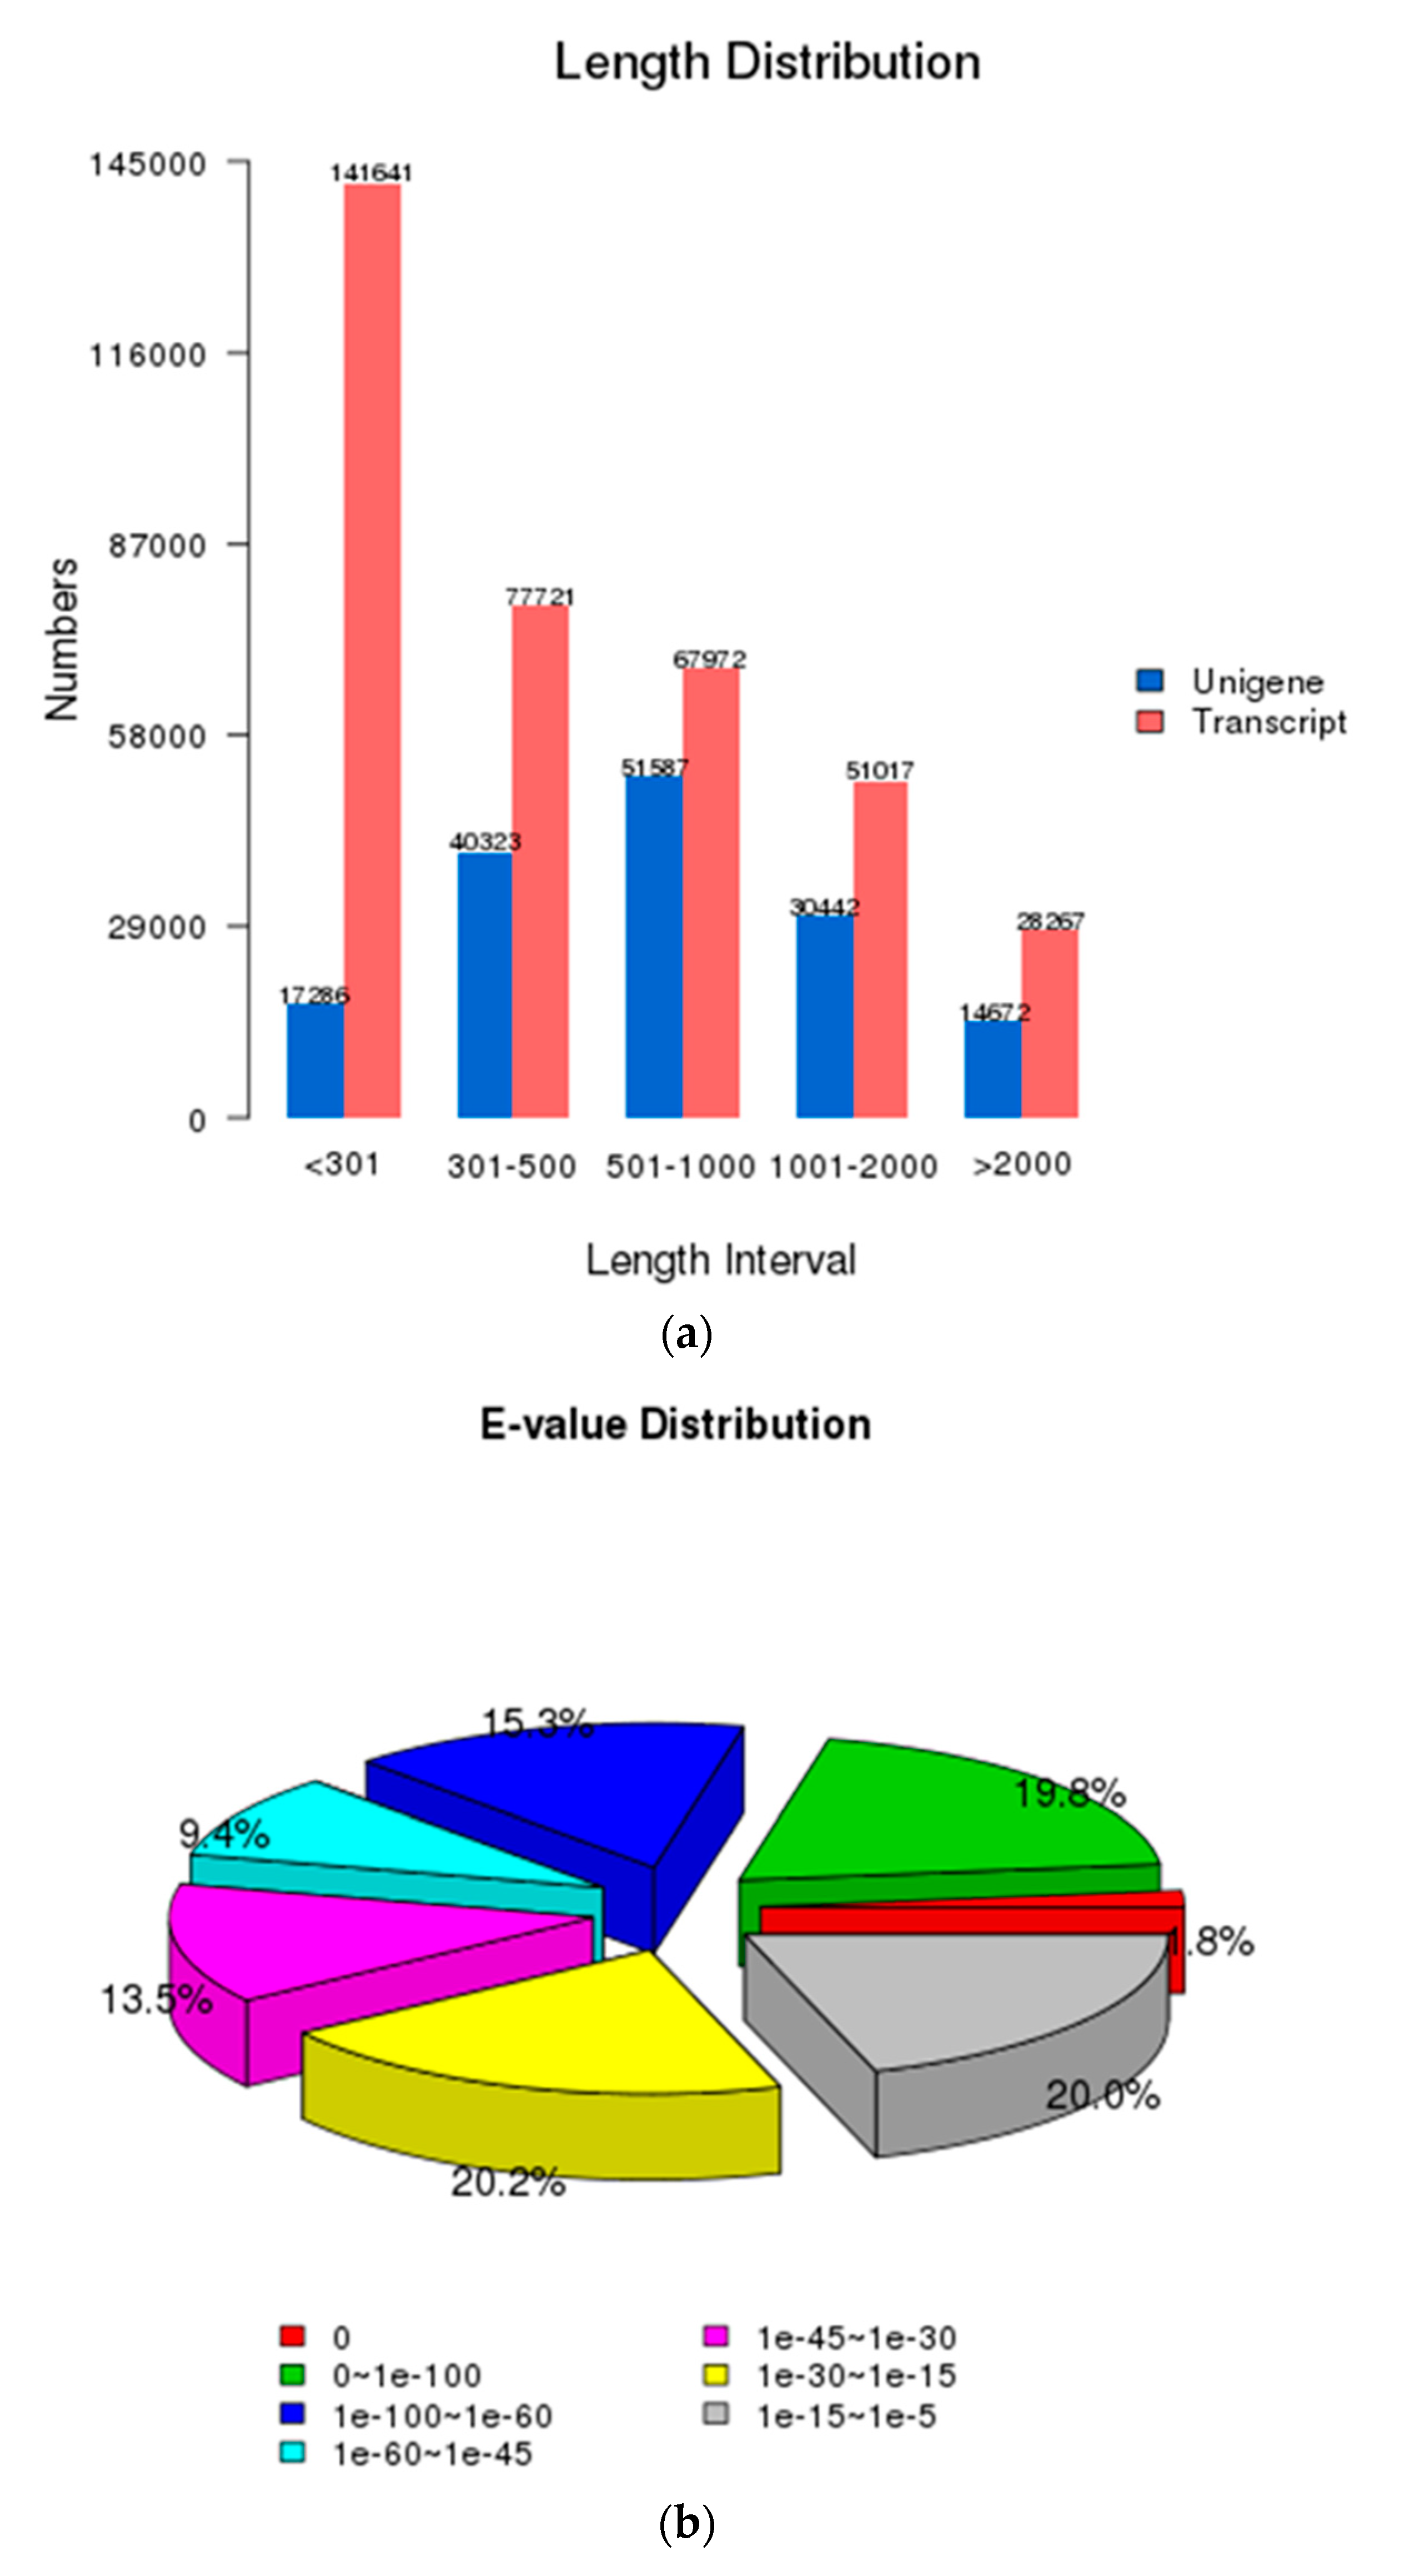
Figure 1. Characteristics of transcripts and unigenes. (a) Transcript and unigene length distributions. (b) E-value distribution of top BLASTX matches per unigene. (c) Distribution of top-matching species for each unigene from BLASTX comparisons of avocado sequences with other plant species.
Forests 10 00411 g001aForests 10 00411 g001b
Figure 2. Functional classification of assembled unigenes (ac). Unigene functional predictions based on gene ontology (a), euKaryotic orthologous groups (b), and Kyoto Encyclopedia of Genes and Genomes (c) databases.
Forests 10 00411 g002aForests 10 00411 g002bForests 10 00411 g002c
Figure 3. Heat map of differentially expressed genes of six avocado cultivars transcriptomes. The various shades in the boxes show similar tendencies of gene expression. Labels along the right side correspond to unigenes names (see Table S6).
Forests 10 00411 g003
Figure 4. Population structure of avocado. (A) Population structure analysis of 28 avocado accessions under number of populations (K = 2) based on 16 polymorphic EST-SSRs from transcriptome data using STRUCTURE, each individual is represented by a vertical bar. (B) Population structure analysis of 28 avocado accessions at K = 3 based on 16 polymorphic EST-SSRs from transcriptome data using STRUCTURE, each bar represents a single individual.
Forests 10 00411 g004
Table 1. Sources of the 28 avocado accessions evaluated in this study.
AccessionOriginSourceRace 1Type
Walter HoleCalifornia, USACATAS, Hainan, ChinaMC
Duke 7California, USACATAS-SSCRI, Guangdong, ChinaMRS
NabalAntigua, GuatemalaCATAS, Hainan, ChinaGC
ReedCalifornia, USACATAS-SSCRI, Guangdong, ChinaGC
PollockFlorida, USCATAS, Hainan, ChinaWIC
DonnieFlorida, USACATAS, Hainan, ChinaWIC
SimmondsFlorida, USACATAS-SSCRI, Guangdong, ChinaWIC
BaconCalifornia, USACATAS, Hainan, ChinaG × MC
HassCalifornia, USACATAS, Hainan, ChinaG × MC
PinkertonCalifornia, USACATAS, Hainan, ChinaG × MC
ZutanoCalifornia, USACATAS, Hainan, ChinaG × MC
EttingerKefar Malal, IsraelCATAS, Hainan, ChinaG × MC
FuertePuebla, MexicoCATAS-SSCRI, Guangdong, ChinaG × MC
DusaWestfalia Estate, South AfricaCATAS, Hainan, ChinaG × MRS
MiguelFlorida, USACATAS, Hainan, ChinaG × WIC
LorettaFlorida, USACATAS, Hainan, ChinaG × WIC
BetaFlorida, USACATAS-SSCRI, Guangdong, ChinaG × WIC
ChoquetteFlorida, USACATAS, Hainan, ChinaG × WIC
LulaFlorida, USACATAS, Hainan, ChinaG × WIC
TonnageFlorida, USACATAS-SSCRI, Guangdong, ChinaG × WIC
Guikenda No. 2Guangxi, ChinaCATAS, Hainan, ChinaG × WIC
Guikenda No. 3Guangxi, ChinaCATAS, Hainan, ChinaG × WILS
Guikenda No. 4Guangxi, ChinaCATAS, Hainan, ChinaG × WILS
Guiyan No. 8Guangxi, ChinaCATAS, Hainan, ChinaG × WILS
Guiyan No. 10Guangxi, ChinaCATAS, Hainan, ChinaG × WILS
Daling No. 2Guangxi, ChinaCATAS, Hainan, ChinaG × WILS
Daling No. 4Guangxi, ChinaCATAS, Hainan, ChinaG × WILS
Mian No. 1Guangxi, ChinaCATAS, Hainan, ChinaG × WILS
1 The ecotype of each avocado accession was determined according to Ge [16]. Origin: breeding location; Source: collection site; G: Guatemalan; M: Mexican; WI: West Indian (local selections of interracial hybrids indicated by “LS”; C: commercial cultivar; RS: rootstock (commercialized clones or seedlings); CATAS: Chinese Academy of Tropical Agricultural Sciences; CATAS-SSCRI: South Subtropical Crops Research Institute, Chinese Academy of Tropical Agricultural Sciences.
Table 2. Summary of generated transcripts and unigenes.
CategoryTranscriptsUnigenes
Min length201201
Mean length731922
Median length382627
Max length17,23917,230
N5012711283
N90269432
Total nucleotides268,157,161142,337,653
Table 3. The number of differentially expressed genes (DEGs) identified by pairwise comparisons of gene expression levels in six avocado accessions.
Sample NameNo. of DEGsNo. of Up-Regulated DEGsNo. of Down-Regulated DEGs
Duke 7 versus Reed251913761143
Duke 7 versus Simmonds355917921767
Duke 7 versus Fuerte1808954854
Duke 7 versus Beta211510511064
Duke 7 versus Tonnage297815101468
Reed versus Simmonds218410961088
Reed versus Fuerte1265579686
Reed versus Beta20388701168
Reed versus Tonnage1313636677
Simmonds versus Fuerte246712131254
Simmonds versus Beta1112406706
Simmonds versus Tonnage1048472576
Fuerte versus Beta246711101313
Fuerte versus Tonnage19431010933
Beta versus Tonnage1456847609
Table 4. Statistical summary of simple sequence repeats (SSRs) identified in avocado.
SourceNumber
Total number of sequences examined154,310
Total size of examined sequences (bp)142,337,653
Total number of identified SSRs55,558
Number of SSR containing sequences43,270
Number of sequences containing more than 1 SSR9789
Number of SSRs present in compound formation2661
Table 5. Summary of repeat unit numbers in avocado expressed sequence - simple sequence repeats tag (EST-SSR) loci.
SSR Motif LengthRepeat Unit Number
5678910>10Total%
Mono------10,46523,63934,10461.38
Di--3628263828563051135419313,72024.69
Tri-44611992679254--716112.89
Tetra-473350201-5110.92
Penta-25711---340.06
Hexa-178012--280.05
Total4976567033182885305711,82023,83255,558
%8.9610.215.975.195.502.1342.90
Table 6. Diversity parameters associated with 16 polymorphic EST-SSRs analyzed in 28 avocado accessions.
Marker NameUnigene IDNa 1Ne 2Ho 3He 4PIC 5
Pa-eSSR-1c20669_g0_i0104.310.390.780.74
Pa-eSSR-2c92252_g2_i053.530.000.720.67
Pa-eSSR-3c77919_g2_i142.230.000.550.46
Pa-eSSR-4c63541_g0_i152.480.140.600.54
Pa-eSSR-5c40793_g0_i094.980.110.800.77
Pa-eSSR-6c40000_g0_i062.910.000.660.60
Pa-eSSR-7c22125_g0_i043.090.000.680.62
Pa-eSSR-8c76175_g0_i284.780.000.790.77
Pa-eSSR-9c90335_g0_i0126.750.150.850.84
Pa-eSSR-10c83091_g0_i031.560.000.360.33
Pa-eSSR-11c64286_g0_i042.650.000.620.55
Pa-eSSR-12c92291_g1_i0107.040.190.860.84
Pa-eSSR-13c79749_g0_i052.610.040.620.57
Pa-eSSR-14c80732_g1_i142.510.000.600.54
Pa-eSSR-15c115429_g2_i163.560.000.720.68
Pa-eSSR-16c85149_g0_i031.440.000.300.27
Total98
Mean6.133.530.060.660.61
1 Number of observed alleles, 2 effective number of alleles, 3 observed heterozygosity, 4 expected heterozygosity, 5 polymorphism information content.