Article

Microsite Effects on Physiological Performance of Betula ermanii at and Beyond an Alpine Treeline Site on Changbai Mountain in Northeast China

1
Key Laboratory of Forest Ecology and Management, Institute of Applied Ecology, Chinese Academy of Sciences, Shenyang 110016, China
2
Jiyang College, Zhejiang A & F University, Zhuji 311800, China
3
Swiss Federal Research Institute WSL, CH-8903 Birmensdorf, Switzerland
*
Author to whom correspondence should be addressed.
Forests 2019, 10(5), 400; https://doi.org/10.3390/f10050400
Submission received: 21 April 2019 / Revised: 5 May 2019 / Accepted: 6 May 2019 / Published: 9 May 2019
(This article belongs to the Special Issue Alpine and Polar Treelines in a Changing Environment)

Abstract

:
The alpine treeline demarcates the temperature-limited upper elevational boundary of the tree life form. However, this treeline does not always occur exclusively as a sharp “line”, outposts of tree groups (OTG) with a height of at least 3 m are often observed in microsites up to several hundred meters beyond the line of continuous forest on some mountains. This suggests that other factors such as microenvironment may play a significant role in compensating for the alpine tree facing growth-limiting low temperature conditions. To test the microenvironment effects, this study compared the differences in growing conditions (climate and soil properties) and ecophysiological performance of Erman’s birch (Betula ermanii Cham.) trees growing in a continuous treeline site (CTL, ~1950 m above sea level, a.s.l.) and OTGs (~2050 m a.s.l.) on Changbai Mountain in northeastern China. The results show the average 2-m air temperature for OTG was slightly lower in the non-growing season than which at the CTL (−10.2 °C < −8.4 °C), there was no difference in growing season air temperature and soil temperature at 10 cm depth between CTL and OTG. The contents of focal soil nutrients in CTL and OTG were similar. Difference in K and Mn contents between sites were detected in leaves, difference in K, Mn, and Zn in shoots. However, comparing similarity of ecophysiological performances at an individual level, trees at CTL and OTG show no significant difference. Our study reveals that mature trees at the CTL and OTG experience generally similar environmental conditions (climate and soil properties) and exhibit similar overall ecophysiological performance (reflected in carbon reserves and nutrients). This might provide insight into how mature trees might be able to survive in areas higher than the continuous treeline, as well as the importance of microclimatic amelioration provided by protective microsites and the trees themselves.

1. Introduction

The alpine treeline marks the upper limit of the elevational distribution of trees (generally defined as 3m or greater in height) [1,2]. The climate at the alpine treeline is commonly characterized by low temperature, high radiation, strong winds, and a short growing season [2]. Of all these adverse factors, low temperature has long been recognized as the fundamental limit to tree growth [1]. The average temperature in the warmest month was initially suggested to explain the elevational position of the alpine treeline in the Alps (calculated as 10 °C), as reviewed by Gehrig-Fasel, et al. [3]. Other investigations around the world have found this temperature to range from 6 °C to 13 °C, depending on the geographical location of mountainous terrain [4]. According to Körner and Paulsen [5], the position of the global alpine treeline is commonly determined by soil temperature of 6.7 ± 0.8 °C at 10 cm-depth in the growing season. However, the importance of air temperature has recently been re-emphasized, as, for example, by Li, et al. [6] who reported a critical minimum air temperature as 0.7 ± 0.4 °C for xylem growth of Smith fir. In general, below these temperature thresholds, trees cannot grow to a mature size.
Despite the aforementioned limits, clonal tree groups and tree clusters with a height of > 3 m are quite often observed up to a few hundred meters beyond the alpine treeline on high mountains worldwide [7]. Such tree outposts distributed above the treeline, or outpost of tree groups (OTGs) are generally associated with depressions microsites and the microenvironment created by trees themselves. Microsites have been regarded as an integrated proxy for many environmental factors, including air and soil temperature [8,9], soil water and nutrient availability [10,11], geomorphologic processes [12], and snow redistribution and persistence [13,14]. Microsites modify environmental factors to influence the survival, growth, and development of trees beyond the alpine treeline [15,16]. For example, wind-blown ridge sites are commonly characterized by shallow soil and snow-free ground in winter. Leeward slopes and depressions tend to accumulate snow, which can protect seedlings from frost damage [17], desiccating winds [18,19], and xylem embolism [20]. On the other hand, thick snow cover and delays in onset of snowmelt will shorten the growing season and may increase fungal infections [21].
To date, most studies related to microsite effects have focused on seedlings and saplings [22,23,24,25]. Establishment, survival and growth rate of saplings in extreme mountain environment is considered to be highly connected to shelter availability and shelter type [23]. But microsite effects, especially in the canopy climate aspect, might weaken as trees grow to a height exceeding 3 m, since taller crowns decouple trees from the near-ground surface climate and more closely immerse them within the prevailing atmosphere, this was summaries as “boundary effect” by previous studies [24,26,27]. Root expansion and litter accumulation has also been shown to eliminate initial habitat influences on trees [28]. Thus, microsite effects may weaken to some degree as trees grow. Also, as the lapse rate of temperature, air temperature will drop by 0.6 °C as altitude increase per 100 m. That means the large trees at the OTGs might face severe low temperature limitation.
Treeline dynamics is a slow and long-term process, key characteristics of which can be identified through investigating environmental conditions and monitoring trees in long-term fixed plots. At the same time, comparing the differences in growing conditions (climate and soil properties) and ecophysiological performance of trees growing near the treeline (i.e., closed forest) vs. OTG trees may also lead to a better understanding of how trees respond to extreme environments at high elevations, and of possible trends in treeline dynamics from another perspective. Considering that OTG trees can grow to tree height (i.e., > 3 m), and the temperature conditions they might face as we discussed above, we would expect that: (1) there might be differences in 2 m air temperatures between CTL and OTGs, but similar soil temperature might be detected for CTL and OTG considering that soil temperature change might lag behind air temperatures (because of soil physics, e.g., heat capacity, heat conductance, also buffer against diurnal); (2) even though many studies have reported that carbon supply is not limited for trees at the treeline [29,30,31,32], in a recent study covering multiple tree species across a broad geographical scale, treeline trees had significantly lower non-structural carbohydrates (NSC) concentration in their roots in winter than those growing at low elevation sites [33], suggesting that carbon supply may still be limited for trees at the treeline. Considering that fact, we will also test if trees growing at CTL and OTG exhibit similar carbon reserves and other ecophysiological performance (e.g., nutrient supply), which can ensure that trees can grow to a large size. For different nutrients, we expect the macroelements (TC, TN, TP K) in leaves and shoots are not significantly different for CTL and OTG trees, based on the fact that these nutrients are required in relatively large quantities for the normal physiological processes.
A birch (Betula) species was selected as the focal object of study, given that as an important and widespread broadleaf alpine timberline genus, it has not been as thoroughly studied as have conifer treeline species [34]. Therefore, this study, by comparing growing environments of birches at (CTL) and beyond a treeline (OTG) on Changbai Mountain in Northeast China, and their corresponding ecophysiological performance (as reflected in NSCs and nutrient contents), may help us to better understand why large trees (>3 m in height) can be observed in microsites up to hundred meters beyond the continuous treeline, if microsites effects still works for these outposts trees.

2. Materials and Methods

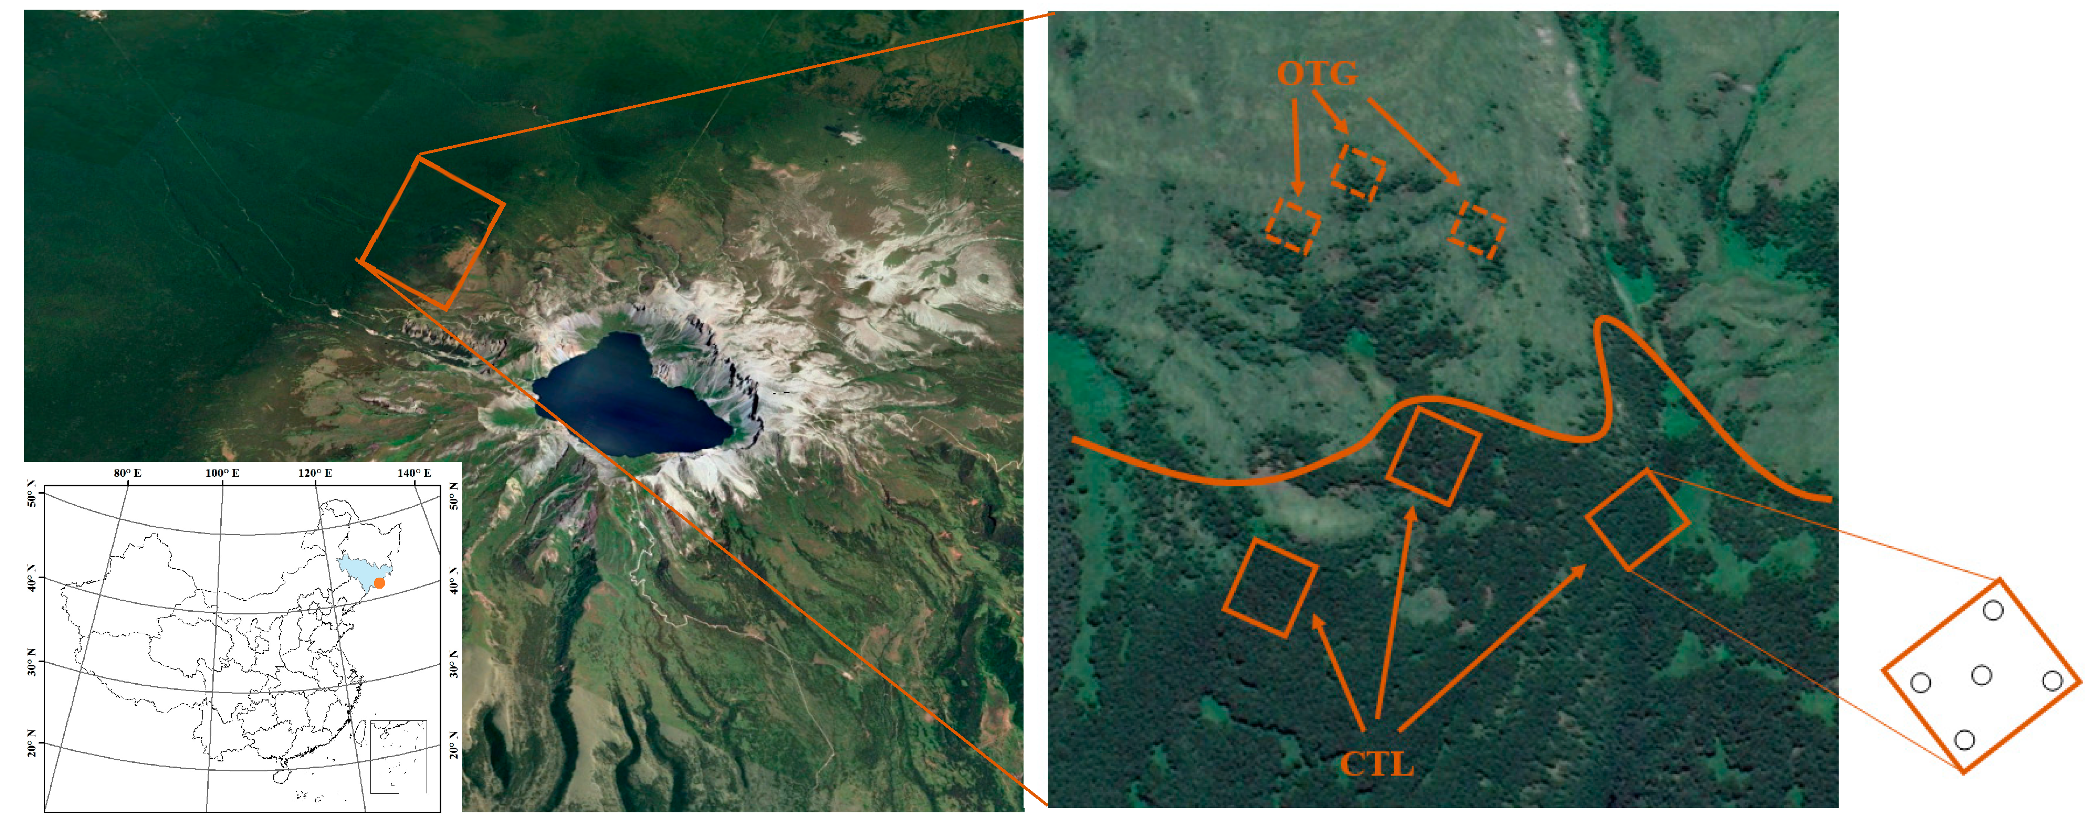
2.1. Study Site Description

This study was conducted on Changbai Mountain (41°43′–42°26′N, 127°42′–128°17′E), in northeastern China. On the north slope, a pure Erman’s birch (Betula ermanii Cham.) forest is distributed from 1700 m above sea level (a.s.l.) upward and forms a continuous and abrupt alpine treeline (CTL) at 1950 m a.s.l. Above the CTL, outposts of tree groups (OTG)—trees reaching 3m height—occur in depression microsites up to 2050 m a.s.l., accompanied by both krummholz birch (shrubby) and perennial shrub species Rhododendron chrysanthum Pall. and Vacciniumu liginosum L. [35].
The study area has a temperate continental montane climate, with cold windy winters and rainy summers. As the peak summit station recorded (Changbai Mountain Meteorological Service Bureau, during the past 30 years), average annual temperature ranges from –2.3 °C to –3.8 °C, and annual precipitation varies from 1000 mm to 1100 mm, approximately 80% of which occurs between June and September. Average annual wind speed ranges from 6 to 10 m s-1, with gales of more than 200-day duration. The growing season for treeline trees generally extends from the end of May to the first severe frost, normally in late September. Soils originated from volcanic float stone, with depth ranging from 5 to 30 cm, have extremely low water-holding capacity [36,37], with soil pH of 5.2. Previous studies confirmed that global warming relieves the temperature limitation on the alpine treeline, contributing to an intense treeline upward shift (33 m per 1 °C increase) since 1985 [38].

2.2. Plant Sampling and Chemical Analyses

In 2012, along the contour of the abrupt, continuous alpine treeline (CTL), three plots (20 m × 30 m) spaced at a distance of at least 50 m were established. From the irregularly shaped outposts of tree groups (OTG), three plots of largest size (approximately 60 m2) were selected that contained more than 5 mature birches at least 3 m of height, these plots were approximately 80 m higher in elevation than the CTL (Figure 1). In each CTL and OTG plot, 5 healthy, mature birch at least 3 m of height from each were selected for sampling. Non-shaded mature leaves and 1-year-old shoots (without bark) on leading branches were collected from selected trees. In each plot, leaves and shoots from the five selected trees were separately pooled, forming a mixed (i.e., 5-tree) sample for each tissue.
The NSC reserves in trees fluctuate during the growing season. In the early stage of the growing season, leaves and shoots act as carbon sinks, utilizing sugars transported from storage organs—i.e., roots and stems—that were stored in the past year. In the middle and late growing season, when the leaf development stage is finished, then carbohydrates are transported to stored organs [39]. With this in mind, sampling work in this study was conducted in the early, middle and late stages of the growing season (June 19, July 30 and September 7, respectively).
All plant samples were kept in a cool-box immediately after sampling. Samples were heated in a microwave oven (40 s at 600 W) within a maximum of 5 hours after collection to minimize biological activity and then were oven-dried to constant mass at 65 °C for approximately 48 hours. The oven-dried material was ground to fine powder and stored at 4 °C for further analysis.
The non-structural carbohydrates (NSC) concentration in plant samples is defined here as the sum of the mobile sugars plus starch. Anthrone method was used to determine total mobile sugars and starch concentrations [40]. Briefly, powdered material was extracted using 80% ethanol, incubated at 80 °C in a water bath shaker for 30 min, and then centrifuged at 5000 rpm for 5 min. After repeating this procedure twice, the combined supernatants for soluble sugar was spectrophotometrically measured at 620 nm using anthrone reagent and calculated the concentrations of soluble carbohydrate from standard regression equations using glucose as a standard. As for starch releases, the residue was boiled in distilled water for 15 min and then 9.2 M HClO4 solution was added and kept for 15 min to hydrolyze the starch. Then an additional 4 mL of distilled water was added to the tube and centrifuged the mixture at 5000 rpm for 10 min, following which we extracted the pellet again with 2 mL 4.6 M HClO4 solution. We then spectrophotometrically analyzed the combined supernatants for starch at 620 nm using anthrone reagent with glucose as a standard. We calculated starch concentration by multiplying glucose concentrations by a conversion factor of 0.9 [40,41]. The concentrations of soluble sugar and starch were all expressed on a dry matter (d.m.) basis (%).
Total carbon (TC, %) and total nitrogen (TN, mg/g, includes NO3-N, NH4-N, and microbe biomass forms) concentrations were determined with an elemental analyser (Elementar Analysensysteme Hanau, Germany). The total phosphorus (TP, mg/g) concentration was determined using an Auto Analyzer (AA3, Bran + Luebb GmbH, Germany). The nutrient concentrations of Potassium (K, mg/g), Calcium (Ca, mg/g), Magnesium (Mg, mg/g), Manganese (Mn, mg/g), Iron (Fe, μg/g), and Zinc (Zn, μg/g) in plant were measured through atomic absorption (PE Analyst 800, USA).

2.3. Soil Sampling and Chemical Analyses

Along with plant sampling, soil was sampled at a 10-cm depth at all selected trees. Using previous data as a reference, it was found that soil nutrients at the studied sites do not change substantially across the growing season (<10% change between seasons). Thus, soil samples collected from the same plot were mixed to create one sample for chemical measurements. After air-drying the soil, soil nutrients (TC, TN, TP, K, Ca, Mg, Mn, Fe, and Zn) were measured via the same methods used for plant tissues.

2.4. Climate Data Collection

At each site (CTL and OTG), micro-climatic loggers (−30 °C~50 °C, HOBO H8 Pro Temperature Logger, USA) were installed 2 m above the ground (on one tree at two selected plots, n = 2) avoiding direct sunlight to monitor 2-m air temperature. Loggers were also placed at a soil depth of 10 cm to monitor soil temperature (n = 2). All loggers recorded the temperature at 30 min intervals from May 20, 2009 to May 20, 2010. Growing season was defined to be when the average daily soil temperatures at 10-cm depth exceeded 3.2 °C [5].

2.5. Data Analyses

The average air and soil temperatures recorded from the same site (CTL or OTG) was used to calibrate each other (in case data miss for long time or large difference between the two loggers). The average daily air or soil temperature from each site was then calculated for further analysis. Paired-t test was used to test if air or soil temperature differs in growing and non-growing season between sites. Student’s t-test was used to assess whether soil nutrients, differed significantly between CTL and OTG.
Two-way analysis of variance (ANOVA) was used to test if sites (CTL and OTG), growing season stages had significant effects on nutrients (TC, TN, TP, K, Ca, Mg, Mn, Fe, and Zn) or NSC and its components (total sugars and starch) in shoots and leaves. The Tukey–Kramer Honest Significant Difference method was used to examine differences between each responsive factor that differs between sites. Factor Analysis of Mixed Data (FAMD) [42] was then employed to compare the similarity between individuals by taking into account a mixed types of variables—both quantitative (plant tissue nutrients, NSC and its components) and qualitative (sites, tissues, growing season stages)—to test the extent to which ecophysiological performance varied between CTL and OTG sites, tissues, and growing stages. All statistical tests were conducted and all figures drawn with R 3.5.1 [43].

3. Results

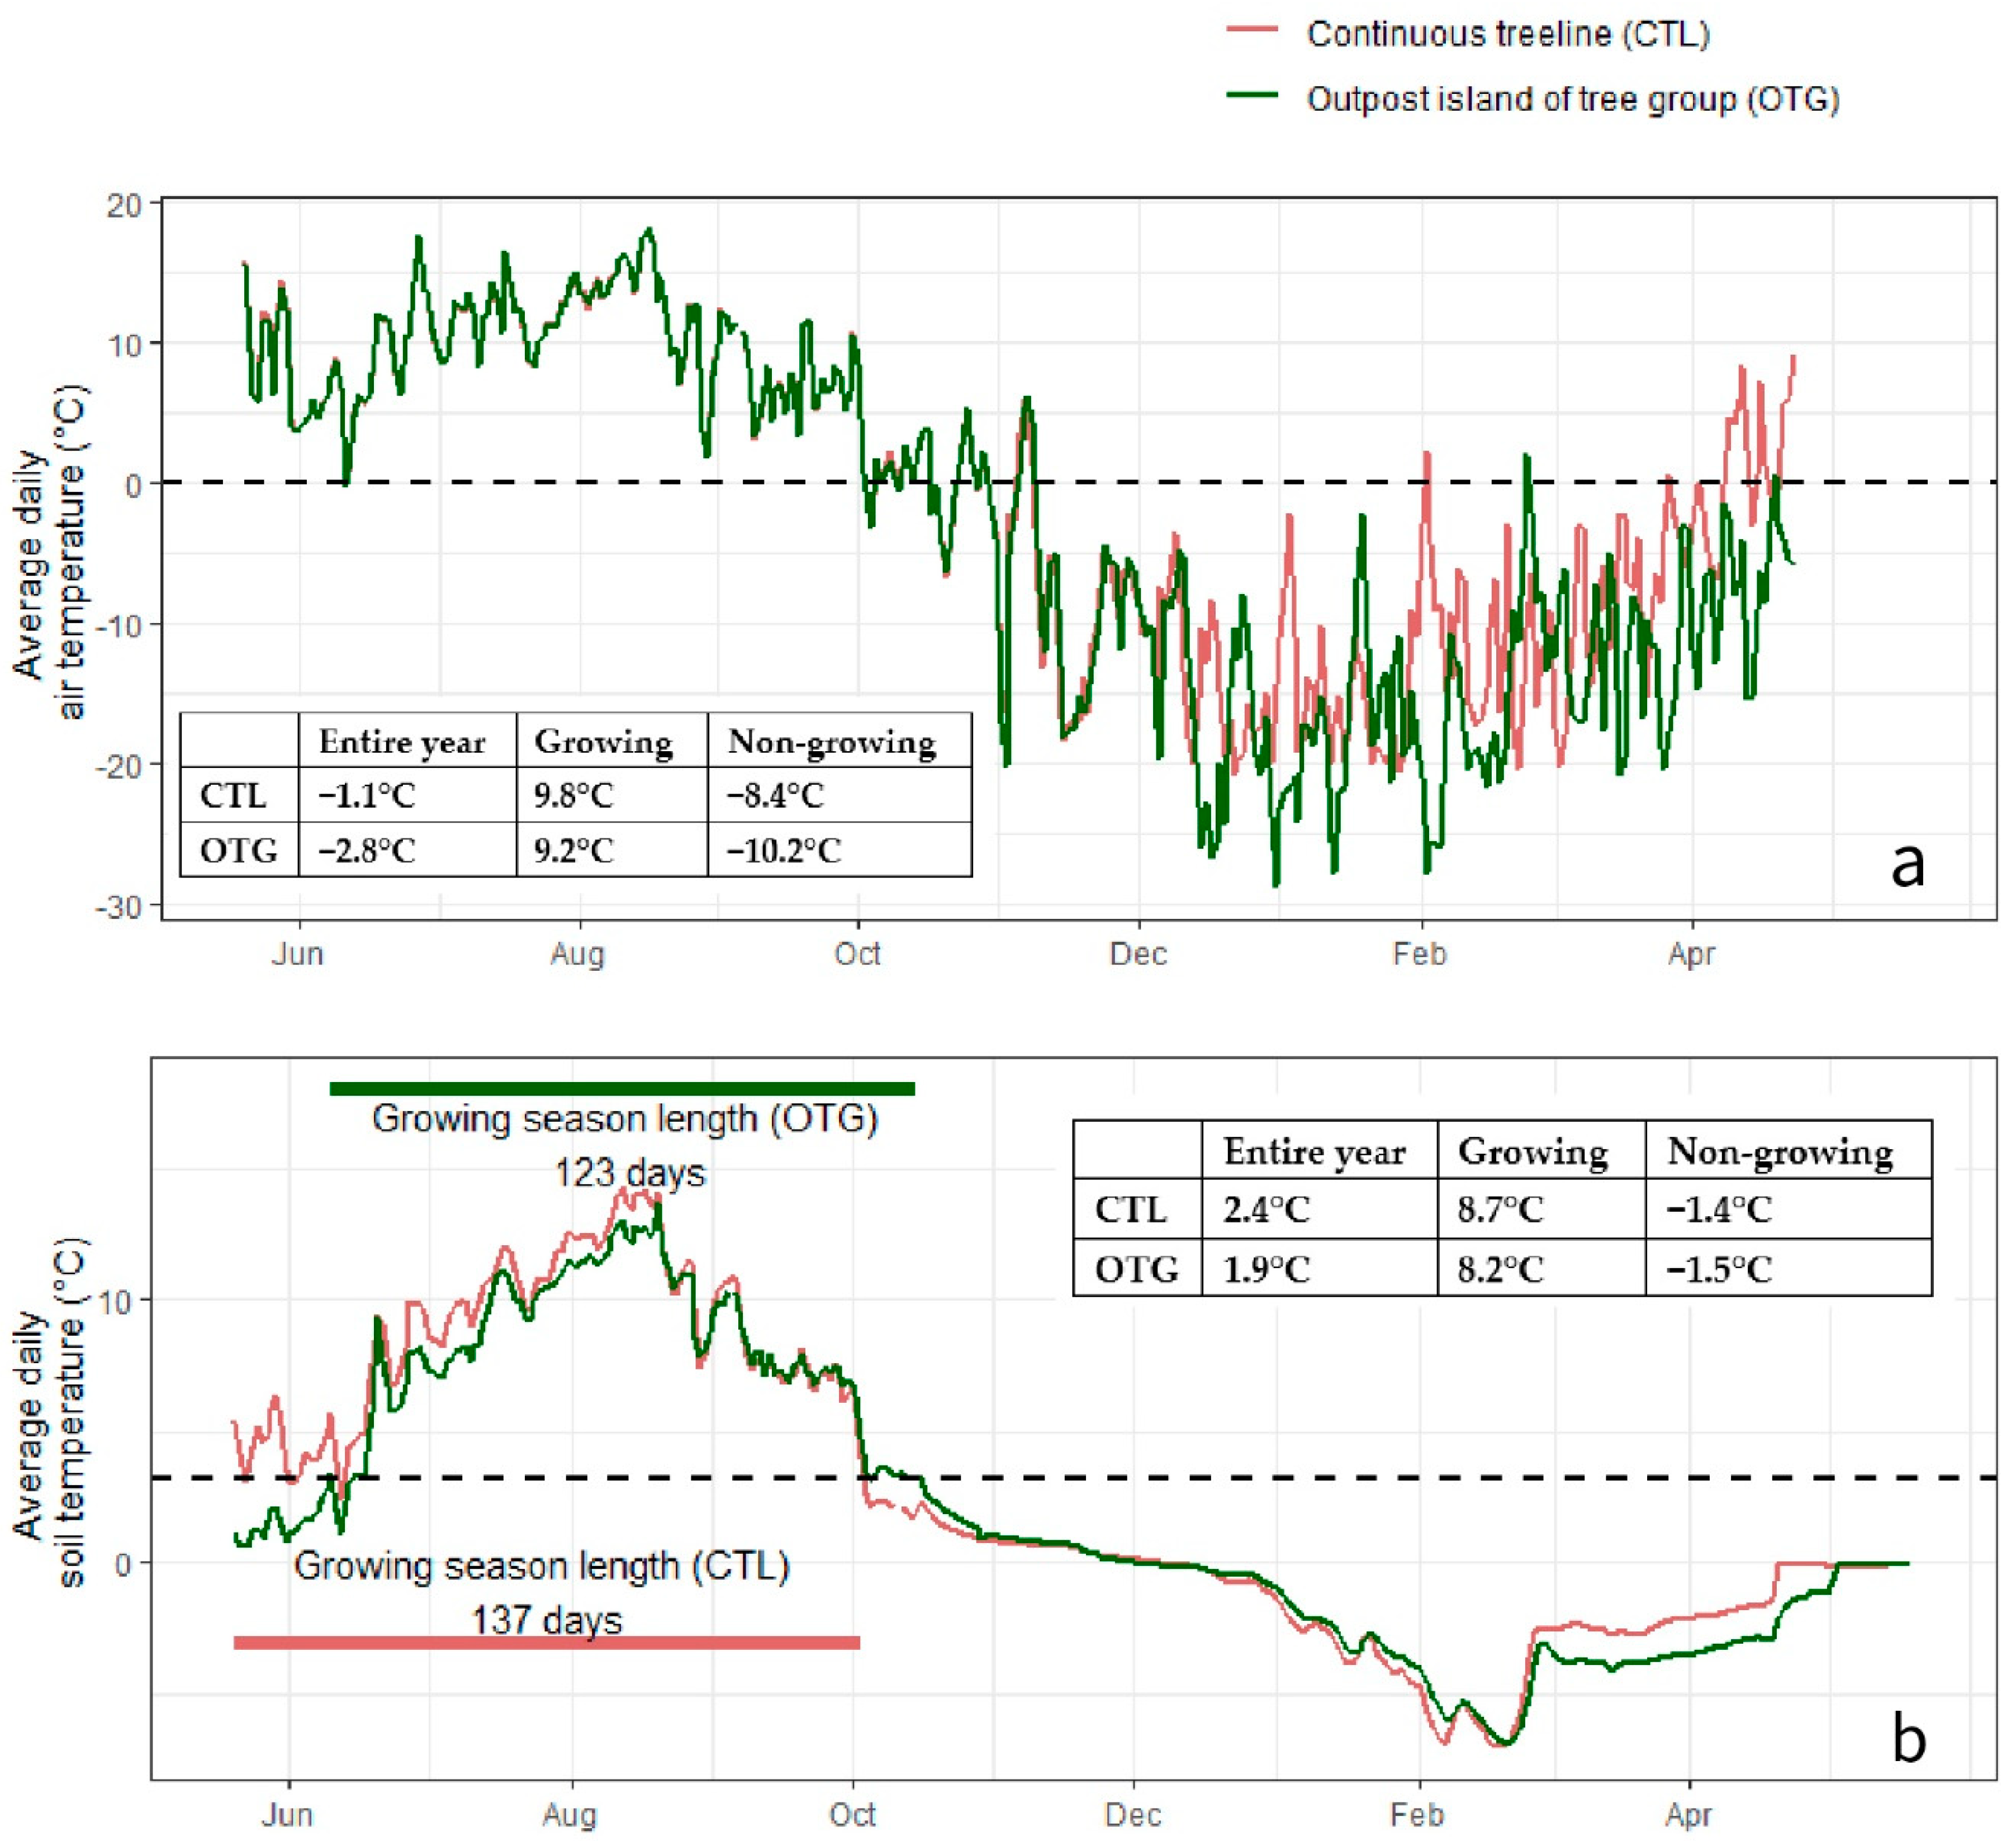
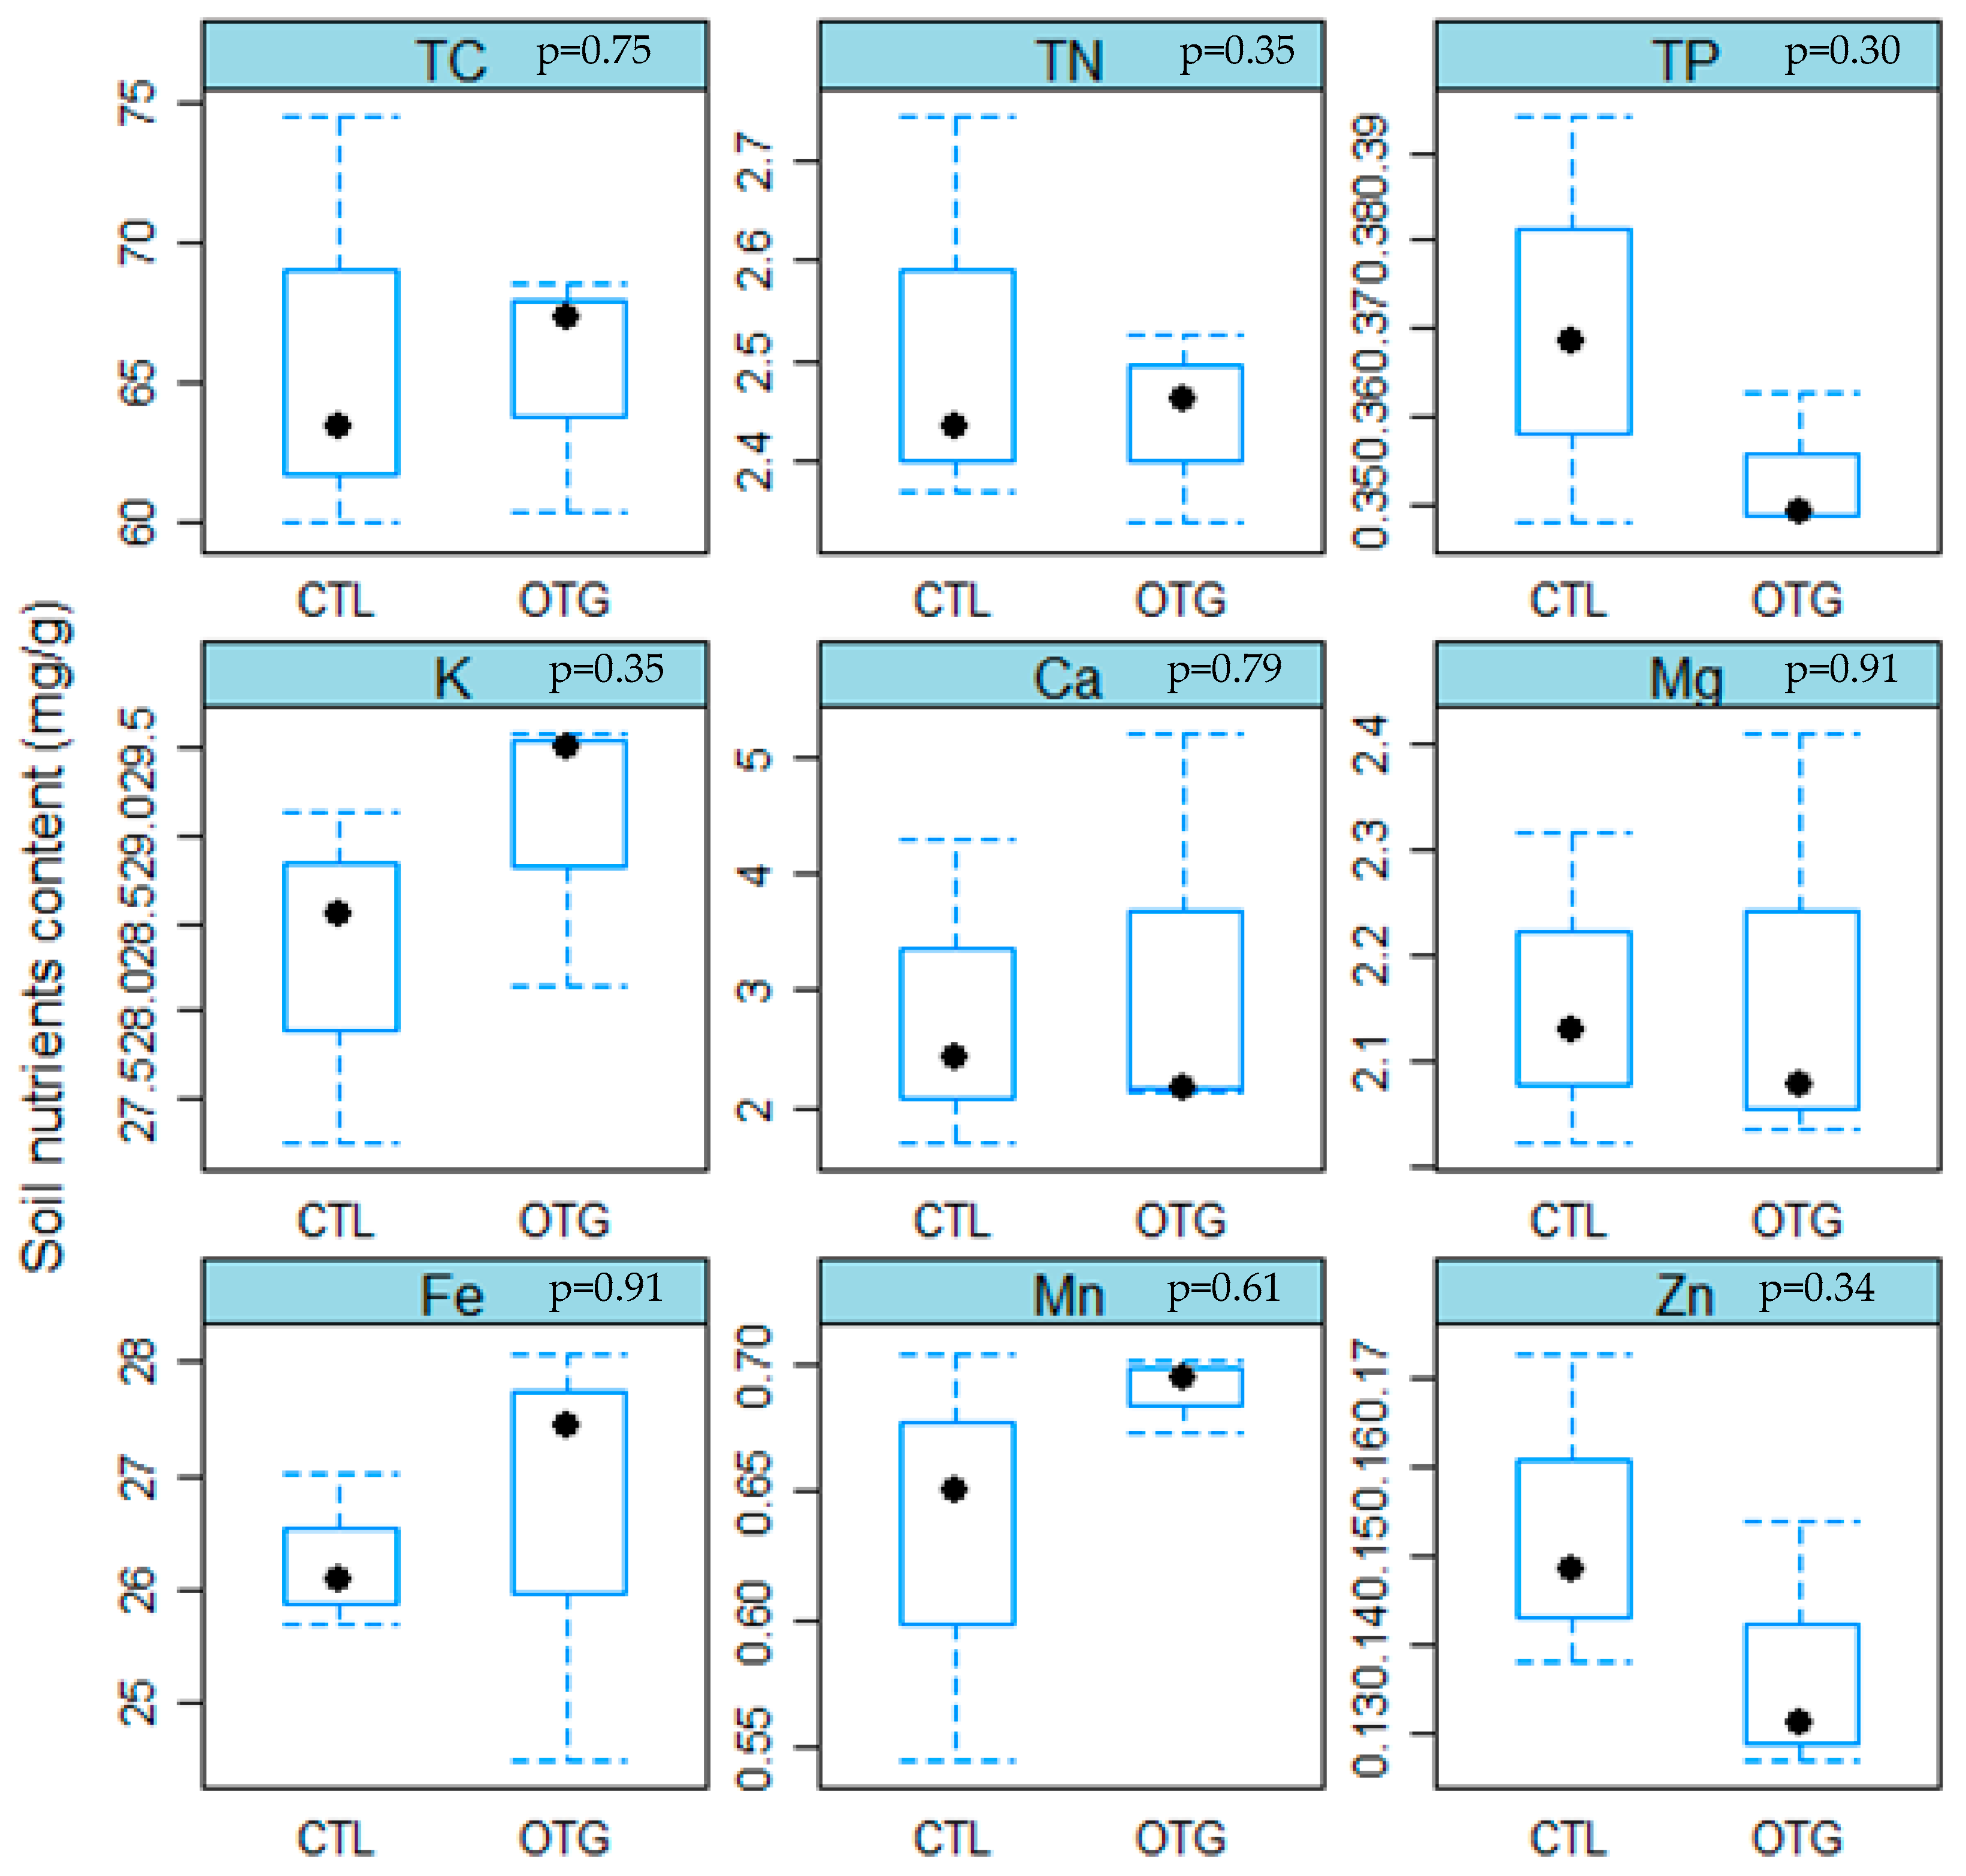
3.1. Climate Conditions and Soil Properties

The growing season at OTG (123 days) was 14 days shorter than the growing season at the CTL (137 days) (Figure 2a). The average 2-m air temperature for OTG was slightly lower in the non-growing season than the temperature at the CTL (−10.2 °C < −8.4 °C). The air temperature in the growing season and soil temperature at 10-cm-depth for the entire year showed no differences between sites (p > 0.05) (Figure 2a,b). The concentrations of focal soil nutrients in CTL and OTG were similar (Figure 3).

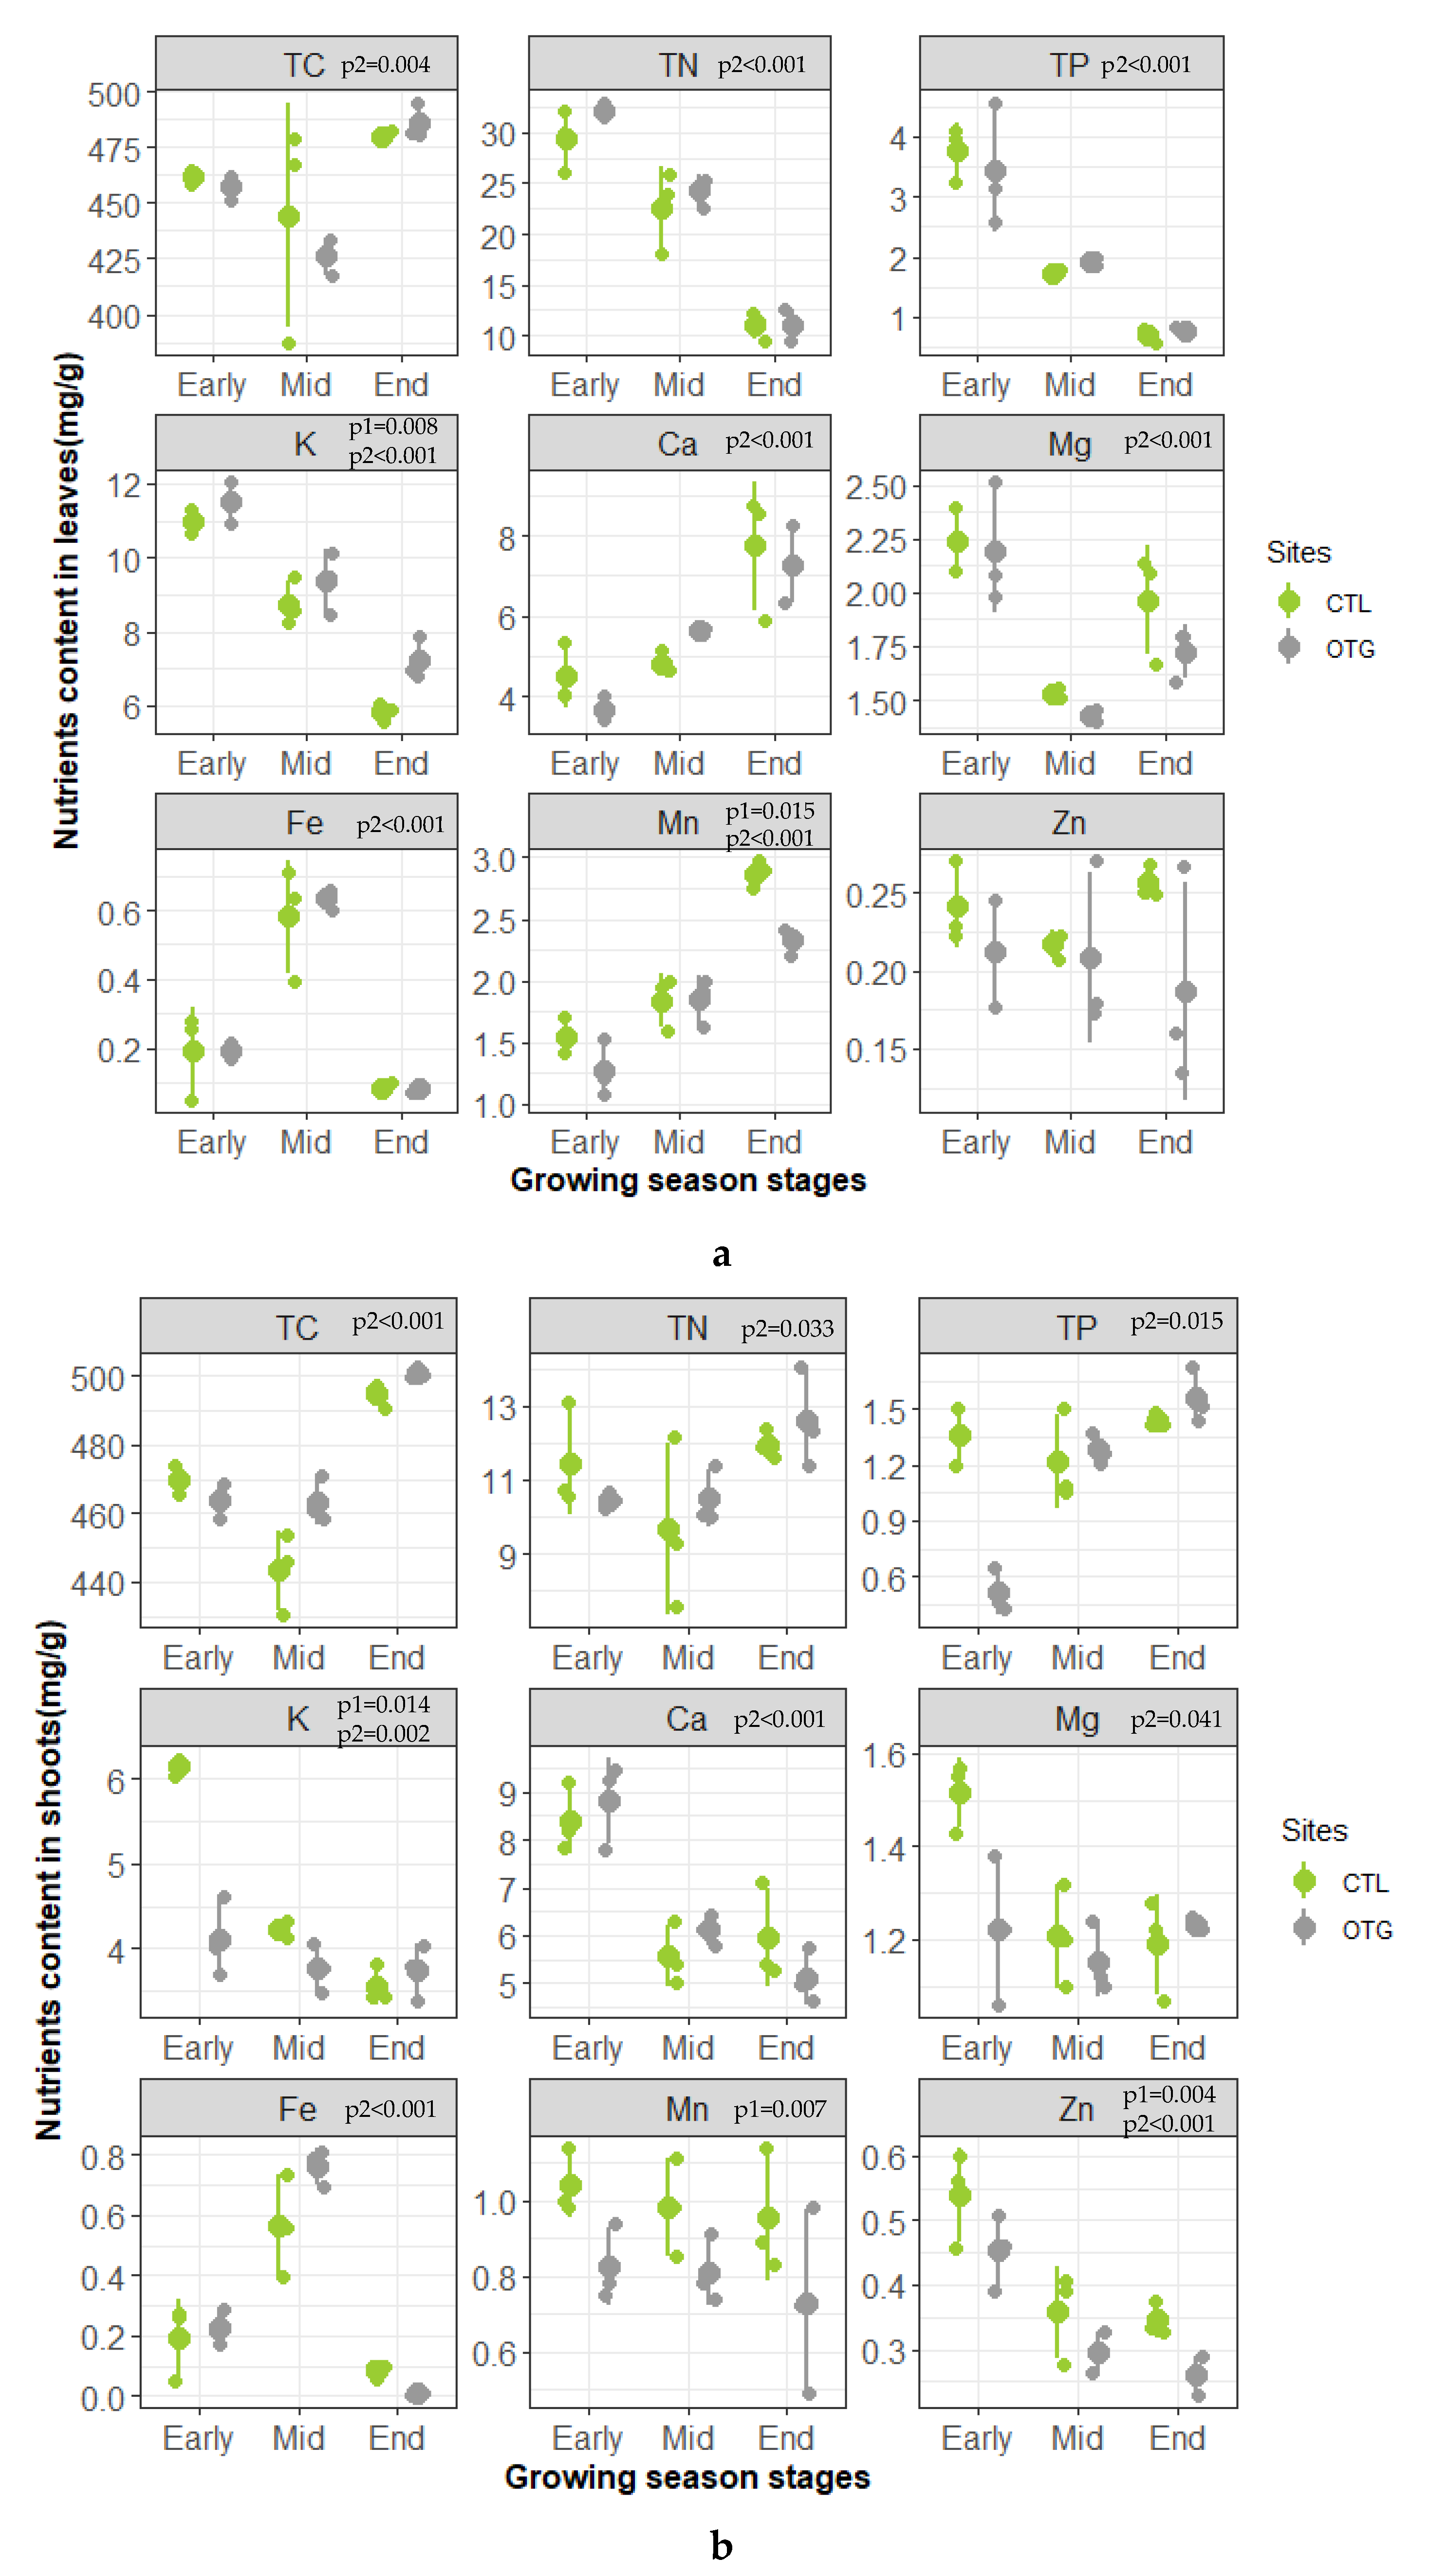
3.2. Plant Nutrients

Those measured nutrients in leaves other than Zn changed significantly across the growing season (all p < 0.01, Figure 4, Table S1). Leaf K and Mn contents differed significantly between CTL and OTG sites (p < 0.01), in which, leaves from OTG trees had significantly higher K but lower Mn than leaves from CTL trees (Figure 4a).
With the exception of Mn, shoot nutrients were significantly affected by growing season stage (p < 0.05). Site significantly affected K, Mn, and Zn in shoots (p < 0.05). Shoots of OTG trees had significantly lower K, Mn, and Zn compared to those of CTL trees (Figure 4b, Table S2). Other nutrients measured in shoots did not differ significantly between OTG and CTL trees.

3.3. Non-Structural Carbohydrates (NSCs)

In both leaves and shoots, the concentration of NSC, sugars, and starch all changed significantly with growing season stages (p < 0.001, Figure 5). Site had significant effects on NSC content in shoots: trees in OTG had significantly lower NSC (p < 0.05) in early season compared to those at the CTL (Figure 5; Tables S3 and S4).

3.4. Relationships between Nutrients and NSC

Together, differences in organs, growing season stages, and sites (CTL vs. OTG) explained 54.8% of the variance in nutrients and NSC. The differences in overall ecophysiological performance of trees between CTL and OTG were far less than those between organs and stages (Figure 6a,b).

4. Discussion

4.1. Microsite-Modulated Climate in Growing and Non-Growing Seasons

Results showed that CTL and OTG sites with approximately 80 m difference in altitude had similar aboveground (2 m) air temperature during the growing season, but that OTG had colder air temperature than the CTL in the non-growing season (Figure 2a). This finding is partly consistent with our initial expectation that microsite effects may become negligible as trees grow to become taller than ~ 3 m, since taller crowns decouple trees from the near-ground surface climate and are more deeply immersed within the prevailing atmosphere [24,26,27]. Also, the altitude of OTGs is 80~100 m higher than which of CTL sites, this will also cause a temperature difference in some degree. But the inconsistency trend in growing and non-growing season shows that tree height not being the only factor that determines the microclimate of trees. As the previous study summarized, compact canopy with clustered branchlets and foliage will bring warmth to the trees [44]. The trees growing in OTG site adopting “compact” life forms might help them to create their own microclimate, decouple from the cold ambient air, and achieve higher heat accumulation in their leaf canopy than isolated trees. Thus, air temperature in the growing season at CTL and OTG were similar. However, in the non-growing season birch trees (especially isolated OTG individuals) lose most of their heat-capturing ability due to the loss of their deciduous leaves. That could explain why OTG trees had lower non-growing season air temperature.
In the present study, CTL and OTG had similar soil temperatures at 10 cm depth in both growing and non-growing seasons (Figure 2b). Soil temperature at the treeline is thought to be affected by the combined effects of topographic features and snow cover (if in winter) [44]. The mature trees at and beyond the treeline were all observed to be situated in depressions. Trees growing in protective depressions in both CTL and OTG sites receive protection from snow cover during the winter. This finding might partly explain why these two sites also had similar non-growing season soil temperatures.

4.2. Similar Soil Nutrient Concentrations

No significant differences were detected between the CTL and OTG for any measured soil nutrients (Figure 3). This may be because the distance between CTL and OTG is not enough to produce large climatic conditions and soil nutrient mineralization differences. In winter, mineralization in unfrozen soil with snow, nutrient release after soil thawing and meltwater input will further reduce soil nutrient differences between individuals on fine scales [44]. At present, there have been no studies directly showing treeline trees are enduring nutrient deficits [44], e.g., Li, et al. [45] studied trees at Himalayan treelines, and other studies on Betula pubescence ssp. tortuosa and Betula ermanii Cham. [46,47]. The knowledge of nutrients supply status in OTGs requires consideration of nutrient conditions in plant tissues, considering that even many studies reported highest N content in the needles or leaves, while their growth rate was still the lowest [44].

4.3. Generally Similar Ecophysiological Performances

Leaves sampled at OTG displayed significantly higher concentrations of K and lower concentrations of Mn than did CTL. K plays an important role in improving plant survival under cold stress; higher K in OTG leaves thus enhanced their tolerance for cold [48]. The range of Mn concentrations suitable for plant growth is thought to be 0.03–0.10 mg/g, but in this study, leaf Mn accumulated throughout the growing stage and reached toxic levels for trees at both sites [49]. This accumulation might be related to the fact that Mn has low mobility and always accumulates in old leaves. Mn exits the tree with deciduous leaf fall [50]. For shoots, concentrations of K, Mn, and Zn were all significantly lower in OTG than at CTL (Figure 4b). In addition to improving cold tolerance, K is also thought to function in the long-distance transport of photosynthetic carbon (C) in the phloem [51]. The shortage of K in shoots at OTG in the early growing season stage is also in accordance with the supply status of C.
In leaves, no difference was detected for NSC and its components between CTL and OTG for the entire growing season (Figure 5). This indicates that C supply is not more limited for trees growing in OTG than at the CTL. For shoots, OTG had lower NSC content (Figure 5). Early growing season starch in shoots acts as the main C source for bud break and leaf development; 2–6 weeks after leaf expansion, the carbon reserves will recover [52]. On Changbai Mountain, bud break occurs from mid-May to June, while the samples in this study in which NSC was measured were taken just after leaf expansion, when starch in shoots might not have fully recovered. The phenological variation and difference in growing season length might also affect carbon reserves in trees. By mid-season, the concentration of starch in shoots recovered to a higher level. In general, however, NSC and its components did not differ between sites, indicating that C supply of OTG trees is not more limited relative to that of CTL trees during the entire growing season. In line with nutrients status and carbon reserves results, the ecophysiological performances of trees growing at the CTL and OTG sites were found to differ much less with respect to site than with respect to organs and influence of sampling time (Figure 6).
As discussed in the previous studies [27,44], the reason why mature trees cannot rise to higher elevations like other seedlings or shrubs is because they cannot maintain enough heat like the latter plants, that is, heat level is still limiting the growth of mature trees. For seedlings, the microsites (special microtopography type such as depressions) has long been considered to be the precondition for their establishment [53]. Successfully established seedlings can grow to adult size after several warm winters. In this study, the adult trees observed at the OTG sites were evidence that trees could grow above the treeline. Evaluating the climatic conditions of CTL and OTG trees, it was found that in the growing season there was no difference between trees in CTL and OTG (for both air and soil), but in the non-growing season OTG was ~2 °C lower in air temperature than which of CTL, their soil temperature was still similar. The result obtained may come from the combined effects of canopy climate and microtopography, but because of the limited data, we cannot clearly distinguish their effect separately.

5. Conclusions

On the north slope of Changbai Mountain, Erman’s birch is the single tree species forming a continuous treeline at 1950 m a.s.l. However, outposts of tree groups reaching a height of 3 m can also be observed in microsites up to 80 meters beyond the continuous treeline. Trees growing at and beyond the alpine treeline displayed similar thermal and edaphic conditions as well as ecophysiological performances (as reflected in carbon reserves and nutrients). This might help to provide insight into how mature trees might be able to survive in areas higher than the continuous treeline, as well as the importance of microclimatic amelioration provided by protective microsites and the trees themselves.

Supplementary Materials

The following are available online at https://www.mdpi.com/1999-4907/10/5/400/s1, Table S1: Multiple comparisons among average nutrients contents in leaves at different growing season stages and sites; Table S2: Multiple comparisons among average nutrients contents in shoots at different growing season stages and sites; Table S3: Multiple comparisons among average NSCs concentration in leaves at different growing season stages and sites; Table S4: Multiple comparisons among average NSCs concentration in shoots at different growing season stages and sites.

Author Contributions

Under the direction of M.L. and D.Y., X.W. contributed primarily to the writing of the manuscript. Q.W. worked with investigative work. L.D. offered valuable advice on the study.

Funding

This research was funded by the National Natural Science Foundation of China (41571197, 41371076), and in part supported by the Open Fund from the Academy of Science, Changbai Mountain (201503) and Startup Fund for Young Scholar (Jiyang College, JY2018RC05).

Acknowledgments

We sincerely appreciate suggestions for manuscript revisions from Jiaqing Liu and Hua Chen.

Conflicts of Interest

The authors declare no conflict of interest.

References

  1. Wieser, G.; Holtmeier, F.-K.; Smith, W.K. Treelines in a changing global environment. In Trees in a Changing Environment; Springer: Dordrecht, The Netherlands, 2014; pp. 221–263. [Google Scholar]
  2. Wieser, G.; Tausz, M. Current concepts for treelife limitation at the upper timberline. In Trees at Their Upper Limit; Springer: Dordrecht, The Netherlands, 2007; pp. 1–18. [Google Scholar]
  3. Gehrig-Fasel, J.; Guisan, A.; Zimmermann, N.E. Evaluating thermal treeline indicators based on air and soil temperature using an air-to-soil temperature transfer model. Ecol. Model. 2008, 213, 345–355. [Google Scholar] [CrossRef]
  4. Li, M.-H.; NK, K. The state of knowledge on alpine treeline and suggestions for future research. J. Sichuan For. Sci. Technol. 2005, 26, 36–42. [Google Scholar]
  5. Körner, C.; Paulsen, J. A world-wide study of high altitude treeline temperatures. J. Biogeogr. 2004, 31, 713–732. [Google Scholar] [CrossRef]
  6. Li, X.; Liang, E.; Gricar, J.; Rossi, S.; Cufar, K.; Ellison, A. Critical minimum temperature limits xylogenesis and maintains treelines on the Tibetan Plateau. Available online: https://www.biorxiv.org/content/early/2016/12/13/093781.full.pdf (accessed on 4 May 2019).
  7. Friedrich-Karl, H.; Gabriele, B. Feedback effects of clonal groups and tree clusters on site conditions at the treeline: Implications for treeline dynamics. Clim. Res. 2017, 73, 85–96. [Google Scholar]
  8. Scherrer, D.; Körner, C. Topographically controlled thermal-habitat differentiation buffers alpine plant diversity against climate warming. J. Biogeogr. 2011, 38, 406–416. [Google Scholar] [CrossRef]
  9. Drik, W.; Roland, P.; Jörg, L. Alpine Soil Temperature Variability at Multiple Scales. Arct. Antarct. Alp. Res. 2010, 42, 117–128. [Google Scholar] [Green Version]
  10. Schirmer, M.; Lehning, M. Persistence in intra-annual snow depth distribution: 2. Fractal analysis of snow depth development. Water Resour. Res. 2011, 47. [Google Scholar] [CrossRef] [Green Version]
  11. Stoeckel, D.M.; Miller-Goodman, M.S. Seasonal nutrient dynamics of forested floodplain soil influenced by microtopography and depth. Soil Sci. Soc. Am. J. 2001, 65, 922–931. [Google Scholar] [CrossRef]
  12. Derbyshire, E.; Hails, J.R.; Gregory, K.J. Geomorphological Processes: Studies in Physical Geography; Elsevier: London, UK, 2013. [Google Scholar]
  13. Erickson, T.A.; Williams, M.W.; Winstral, A. Persistence of topographic controls on the spatial distribution of snow in rugged mountain terrain, Colorado, United States. Water Resour. Res. 2005, 41. [Google Scholar] [CrossRef] [Green Version]
  14. Litaor, M.I.; Williams, M.; Seastedt, T.R. Topographic controls on snow distribution, soil moisture, and species diversity of herbaceous alpine vegetation, Niwot Ridge, Colorado. J. Geophys. Res. Biogeosci. 2008, 113. [Google Scholar] [CrossRef] [Green Version]
  15. Hughes, N.M.; Johnson, D.M.; Akhalkatsi, M.; Abdaladze, O. Characterizing Betula Litwinowii Seedling Microsites at the Alpine-Treeline Ecotone, Central Greater Caucasus Mountains, Georgia. Arct. Antarct. Alp. Res. 2009, 41, 112–118. [Google Scholar] [CrossRef] [Green Version]
  16. Johnson, A.C.; Yeakley, J.A. Seedling Regeneration in the Alpine Treeline Ecotone: Comparison of Wood Microsites and Adjacent Soil Substrates. Mt. Res. Dev. 2016, 36, 443–451. [Google Scholar] [CrossRef]
  17. Mayr, S.; Hacke, U.; Schmid, P.; Schwienbacher, F.; Gruber, A. Frost drought in conifers at the alpine timberline: Xylem dysfunction and adaptations. Ecology 2006, 87, 3175–3185. [Google Scholar] [CrossRef]
  18. Malanson, G.P.; Butler, D.R.; Fagre, D.B.; Walsh, S.J.; Tomback, D.F.; Daniels, L.D.; Resler, L.M.; Smith, W.K.; Weiss, D.J.; Peterson, D.L.; et al. Alpine treeline of Western North America: Linking organism-to-landscape dynamics. Phys. Geogr. 2007, 28, 378–396. [Google Scholar] [CrossRef]
  19. Renard, S.M.; McIntire, E.J.; Fajardo, A. Winter conditions—Not summer temperature -influence establishment of seedlings atwhite spruce alpine treeline in Eastern Quebec. J. Veg. Sci. 2016, 27, 29–39. [Google Scholar] [CrossRef]
  20. Mamet, S.D.; Kershaw, G.P. Age-dependency, climate, and environmental controls of recent tree growth trends at subarctic and alpine treelines. Dendrochronologia 2013, 31, 75–87. [Google Scholar] [CrossRef]
  21. Barbeito, I.; Brucker, R.L.; Rixen, C.; Bebi, P. Snow Fungi-Induced Mortality of Pinus cembra at the Alpine Treeline: Evidence from Plantations. Arct. Antarct. Alp. Res. 2013, 45, 455–470. [Google Scholar] [CrossRef]
  22. Hofgaard, A.; Dalen, L.; Hytteborn, H. Tree recruitment above the treeline and potential for climate-driven treeline change. J. Veg. Sci. 2009, 20, 1133–1144. [Google Scholar] [CrossRef]
  23. Resler, L.M.; Butler, D.R.; Malanson, G.P. Topographic shelter and conifer establishment and mortality in an alpine environment, Glacier National Park, Montana. Phys. Geogr. 2005, 26, 112–125. [Google Scholar] [CrossRef]
  24. Li, M.H.; Yang, J. Effects of microsite on growth of Pinus cembra in the subalpine zone of the Austrian Alps. Ann. For. Sci. 2004, 61, 319–325. [Google Scholar] [CrossRef]
  25. Li, M.H.; Yang, J.; Kräuchi, N. Growth responses of Picea abies and Larix decidua to elevation in subalpine areas of Tyrol, Austria. Can. J. For. Res. 2003, 33, 653–662. [Google Scholar]
  26. Greenwood, S.; Chen, J.C.; Chen, C.T.; Jump, A.S. Temperature and sheltering determine patterns of seedling establishment in an advancing subtropical treeline. J. Veg. Sci. 2015, 26, 711–721. [Google Scholar] [CrossRef] [Green Version]
  27. Scherrer, D.; Koerner, C. Infra-red thermometry of alpine landscapes challenges climatic warming projections. Glob. Chang. Biol. 2010, 16, 2602–2613. [Google Scholar] [CrossRef]
  28. Boateng, J.O.; Heineman, J.L.; McClarnon, J.; Bedford, L. Twenty year responses of white spruce to mechanical site preparation and early chemical release in the boreal region of northeastern British Columbia. Can. J. For. Res. 2006, 36, 2386–2399. [Google Scholar] [CrossRef]
  29. Hoch, G.; Körner, C. The carbon charging of pines at the climatic treeline: A global comparison. Oecologia 2003, 135, 10–21. [Google Scholar] [CrossRef]
  30. Hoch, G.; Körner, C. Growth, demography and carbon relations of Polylepis trees at the world’s highest treeline. Funct. Ecol. 2005, 19, 941–951. [Google Scholar] [CrossRef]
  31. Peili, S.; Christian, K.; Hoch, G. A test of the growth-limitation theory for alpine tree line formation in evergreen and deciduous taxa of the eastern Himalayas. Funct. Ecol. 2008, 22, 213–220. [Google Scholar] [Green Version]
  32. Günter, H.; Christian, K. Global patterns of mobile carbon stores in trees at the high-elevation tree line. Glob. Ecol. Biogeogr. 2011, 21, 861–871. [Google Scholar]
  33. Li, M.H.; Jiang, Y.; Wang, A.; Li, X.; Zhu, W.; Yan, C.F.; Du, Z.; Shi, Z.; Lei, J.; Schönbeck, L.; et al. Active summer carbon storage for winter persistence in trees at the cold alpine treeline. Tree Physiol. 2018, 9, 1345–1355. [Google Scholar] [CrossRef]
  34. Liang, E.; Dawadi, B.; Pederson, N.; Eckstein, D. Is the growth of birch at the upper timberline in the Himalayas limited by moisture or by temperature? Ecology 2014, 95, 2453–2465. [Google Scholar] [CrossRef]
  35. Yu, D.P.; Wang, Q.W.; Liu, J.Q.; Zhou, W.M.; Qi, L.; Wang, X.Y.; Zhou, L.; Dai, L.M. Formation mechanisms of the alpine Erman’s birch (Betula ermanii) treeline on Changbai Mountain in Northeast China. Trees 2014, 28, 935–947. [Google Scholar] [CrossRef]
  36. Chen, L.Z.; Bao, X.C.; Li, C.G. Structural characteristics of certain dominant species on the northern slope of Changbai mountain in Jilin province. J. Plant Ecol. 1964, 2, 207–225. [Google Scholar]
  37. Yu, D.P.; Wang, G.G.; Dai, L.M.; Wang, Q.L. Dendroclimatic analysis of Betula ermanii forests at their upper limit of distribution in Changbai Mountain, Northeast China. For. Ecol. Manag. 2007, 240, 105–113. [Google Scholar] [CrossRef]
  38. Du, H.; Liu, J.; Li, M.H.; Büntgen, U.; Yang, Y.; Wang, L.; Wu, Z.; He, H.S. Warming-induced upward migration of the alpine treeline in the Changbai Mountains, northeast China. Glob. Chang. Biol. 2018, 24, 1256–1266. [Google Scholar] [CrossRef] [PubMed]
  39. Tamir, K.; Yann, V.; Günter, H. Coordination between growth, phenology and carbon storage in three coexisting deciduous tree species in a temperate forest. Tree Physiol. 2016, 36, 847–855. [Google Scholar] [Green Version]
  40. Mitsuru, O.; Takuro, S.; Toshiaki, T. Redistribution of carbon and nitrogen compounds from the shoot to the harvesting organs during maturation in field crops. Soil Sci. Plant Nutr. 1991, 37, 117–128. [Google Scholar] [Green Version]
  41. Wang, Q.-W.; Qi, L.; Zhou, W.; Liu, C.-G.; Yu, D.; Dai, L. Carbon dynamics in the deciduous broadleaf tree Erman’s birch (Betula ermanii) at the subalpine treeline on Changbai Mountain, Northeast China. Am. J. Bot. 2018, 105, 42–49. [Google Scholar] [CrossRef] [PubMed]
  42. Pagès, J. Analyse Factorielle de Donnees Mixtes. Rev. Stat. Appl. 2004, 4, 93–111. [Google Scholar]
  43. R Core Team. R: A Language and Environment for Statistical Computing; R Foundation for Statistical Computing: Vienna, Austria, 2015. [Google Scholar]
  44. Körner, C. Alpine Treelines; Springer: Basel, Switzerland, 2012. [Google Scholar]
  45. Li, M.H.; Xiao, W.F.; Shi, P.; Wang, S.G.; Zhong, Y.D.; Liu, X.L.; Wang, X.D.; Cai, X.H.; Shi, Z.M. Nitrogen and carbon source–sink relationships in trees at the Himalayan treelines compared with lower elevations. Plant Cell Environ. 2008, 31, 1377–1387. [Google Scholar] [CrossRef]
  46. Gaku, K. Intraspecific variation of leaf traits in several deciduous species in relation to length of growing season. Ecoscience 1996, 3, 483–489. [Google Scholar]
  47. Karlsson, P.S.; Nordell, K.O. Intraspecific variation in nitrogen status and photosynthetic capacity within mountain birch populations. Ecography 1988, 11, 293–297. [Google Scholar] [CrossRef]
  48. Manning, D.A. Mineral sources of potassium for plant nutrition. A review. Agron. Sustain. Dev. 2010, 30, 281–294. [Google Scholar] [CrossRef]
  49. Limin, R.; Peng, L. Review of manganese toxicity and the mechanisms of plant tolerance. Acta Ecol. Sin. 2007, 27, 357–367. [Google Scholar]
  50. Xu, W.B.; Shao, X.Q.; Wang, Y.T.; Wang, K. Advances in research on physiological effects of manganese on plants and manganese poisoning. Grassl. Lawns 2011, 3, 5–14. [Google Scholar]
  51. Epron, D.; Cabral, O.M.; Laclau, J.P.; Dannoura, M.; Packer, A.P.; Plain, C.; Battie-Laclau, P.; Moreira, M.Z.; Trivelin, P.C.; Bouillet, J.P.; et al. In situ 13CO2 pulse labelling of field-grown eucalypt trees revealed the effects of potassium nutrition and throughfall exclusion on phloem transport of photosynthetic carbon. Tree Physiol. 2016, 36, 6–21. [Google Scholar] [CrossRef] [PubMed]
  52. Klein, T.; Bader, M.K.F.; Leuzinger, S.; Mildner, M.; Schleppi, P.; Siegwolf, R.T.W.; Korner, C. Growth and carbon relations of mature Picea abies trees under 5years of free-air CO2 enrichment. J. Ecol. 2016, 104, 1720–1733. [Google Scholar] [CrossRef]
  53. Friedrich-Karl, H.; Gabriele, B. Landform Influences on Treeline Patchiness and Dynamics in a Changing Climate. Phys. Geogr. 2012, 33, 403–437. [Google Scholar]
Figure 1. Study sites and plots located on the north-facing slope of Changbai Mountain, Northeast China. Rectangles with solid lines represent investigated study plots close to the continuous treeline (CTL, ~1950 m above sea level (a.s.l.)), rectangles with dotted lines represent outposts of tree groups (OTG, ~2050 m a.s.l.) (Adapted from Google Earth image), 5 birches in each plot were selected for sampling.
Forests 10 00400 g001
Figure 2. Average daily 2-m air temperature (a) and average daily 10-cm depth soil temperature (b) at continuous treeline site (CTL) and outpost-islands of tree group (OTG) on the north-facing slope of Changbai Mountain. Data was recorded from May 20, 2009 to May 20, 2010 (during the last 30 days, air temperature data was missing because of devices problem). The mean air or soil temperature in growing, non-growing, and the entire year was calculated and shown on the figure.
Forests 10 00400 g002
Figure 3. Soil nutrient contents (TC, TN, TP, K, Ca, Mg, Fe, Mn, and Zn) at the continuous treeline (CTL) and outposts of tree groups (OTG) sites on the north facing-slope of Changbai Mountain. The black points represent median values, the p values in panel titles show difference of variables between CTL and OTG analyzed by t-test. All the soil nutrients content showed no difference between CTL and OTG sites.
Forests 10 00400 g003
Figure 4. Nutrient contents in leaves (a) and shoots (b) of Erman’s birch trees growing at the continuous treeline (CTL) and outposts beyond the treeline (OTG) on Changbai Mountain. The full data (scatter points) is shown on the figures, with large points show Mean ± SD. The p values from two-way ANOVA were shown in the figures, p1 represents difference between sites, while p2 represents difference between growing stages.
Forests 10 00400 g004
Figure 5. Non-structural carbohydrates (NSC and its components—total sugar and starch—dry mass (d.m.) fraction) (%) in leaves and shoots of Erman’s birch grown at CTL and OTG. The full data is shown on the figures, with large points show Mean ± SD. The p values from two-way ANOVA were shown in the figure, p1 represents difference between sites, while p2 represents difference between sampling stages.
Forests 10 00400 g005
Figure 6. Factor analysis of mixed data (FAMD) used to show associations between quantitative variables (NSCs and nutrients) and qualitative variables (microsites, tissues and sampling seasons). On the factor map (a), 36 points represents characteristics of samples from 3 samples × 3 seasons × 2 organs × 2 sites. Cos2—the square of cosine value, represents the importance of the variable, a higher cos2 means this variable has a relatively larger contribution to the principal components, will distribute near the edge of the circle in the graph. Individual points with similar profiles are close to each other. On the factor map (b), multiple categorical variables were separately colored.
Forests 10 00400 g006

