Article

Effect of Long-Term vs. Short-Term Ambient Ozone Exposure on Radial Stem Growth, Sap Flux and Xylem Morphology of O3-Sensitive Poplar Trees

1
Consiglio Nazionale delle Ricerche (CNR), Istituto di Ricerca sugli Ecosistemi Terrestri (IRET), Via Madonna del Piano 10, 50019 Sesto Fiorentino, Italy
2
Consiglio Nazionale delle Ricerche (CNR), Istituto Valorizzazione Legno e Specie Arboree (IVALSA), Via Madonna del Piano 10, 50019 Sesto Fiorentino, Italy
3
Research Centre for Forestry and Wood, Council for Agricultural Research and Economics (CREA), 00198 Rome, Italy
*
Author to whom correspondence should be addressed.
Forests 2019, 10(5), 396; https://doi.org/10.3390/f10050396
Submission received: 18 March 2019 / Revised: 29 April 2019 / Accepted: 4 May 2019 / Published: 7 May 2019

Abstract

:
High ozone (O3) pollution impairs the carbon and water balance of trees, which is of special interest in planted forests. However, the effect of long-term O3 exposure on tree growth and water use, little remains known. In this study, we analysed the relationships of intra-annual stem growth pattern, seasonal sap flow dynamics and xylem morphology to assess the effect of long term O3 exposure of mature O3-sensitive hybrid poplars (‘Oxford’ clone). Rooted cuttings were planted in autumn 2007 and drip irrigated with 2 liters of water as ambient O3 treatment, or 450 ppm ethylenediurea (N-[2-(2-oxo-1-imidazolidinyl)ethyl]-N0-phenylurea, abbreviated as EDU) solution as O3 protection treatment over all growing seasons. During 2013, point dendrometers and heat pulses were installed to monitor radial growth, stem water relations and sap flow. Ambient O3 did not affect growth rates, even if the seasonal culmination point was 20 days earlier on average than that recorded in the O3 protected trees. Under ambient O3, trees showed reduced seasonal sap flow, however, the lower water use was due to a decrease of Huber value (decrease of leaf area for sapwood unit) rather than to a change in xylem morphology or due to a direct effect of sluggish stomatal responses on transpiration. Under high evaporative demand and ambient O3 concentrations, trees showed a high use of internal stem water resources modulated by stomatal sluggishness, thus predisposing them to be more sensitive water deficit during summer. The results of this study help untangle the compensatory mechanisms involved in the acclimation processes of forest species to long-term O3 exposure in a context of global change.

1. Introduction

Tropospheric ozone (O3) is considered a serious health issue for forests [1] in many areas of the world [2]. Regional-scale assessments showed that the dominant trend in North America during 1995–2014 was a significant decrease in O3, while there was no change in Europe and a significant increase in East Asia [2]. Studies under controlled or semi-controlled conditions have demonstrated negative impacts of O3 on tree biochemistry [3], functionality [4], molecular responses [5] and growth [6], as reviewed by Li et al. [7]. Therefore, O3 pollution has the potential to affect the services provided by forest ecosystems, such as carbon sequestration and wood production. One of the major unanswered questions about O3 impacts on mature trees, however, is still about growth under real-world conditions [8]. The assessment of the long-term O3 effect on forest stand productivity still remains insufficiently detailed [9] and contrasting results were often reported in the literature. Net primary productivity (NPP) of aspen trees was insensitive to long-term O3 fumigation treatments [10] and similar results were reported for Picea abies (L.) H. Karst. forest stands [9]. On the contrary, 8-year free-air O3-fumigation of a beech forest induced a decline of 10 m3 ha−1 y−1 of woody biomass [11]. However, the net primary productivity of three forest communities composed of trembling aspen, paper birch and sugar maple was unaffected by long-term O3 fumigation, because the growth of O3-tolerant genotypes compensated the reduction of NPP of O3-sensitive genotypes [12]. These results suggested that the sensitivity to O3 is species-specific, and within a species can be genotype dependent [13]. Thus O3-sensitive species or genotypes were successfully used to detect tree response to elevated O3 concentration in Betula pendula Roth. [14], Populus tremuloides Michx. [12] and Populus maximoviczii Henry × berolinensis Dippel. [15].
A full understanding of O3 impacts on forest growth is constrained by the complexity of field studies. In particular, long-term studies with adult trees lack a traditional control plot under O3-free conditions. To overcome this issue, treatments with the chemical ethylenediurea (N-[2-(2-oxo-1-imidazolidinyl)ethyl]-N0-phenylurea, abbreviated as EDU) are recommended [16,17]. Repeated applications of EDU at concentrations of up to 400 ppm are recognized to sufficiently protect against O3 phytotoxicity [18,19]. In previous papers we showed that the long term exposure of the O3-sensitive hybrid poplar ‘Oxford’ clone decreased stem growth and leaf total area [20] with an early leaf shedding [21] and reduced above- [15] and below-ground biomass [22] relative to trees protected by EDU. Thus the combined use of O3-sensitive poplar genotype and EDU protective treatment is an advantageous strategy to study tree response to O3.
Forest stand productivity is commonly estimated by growth models based on the annual increment of stem basal area (stem area surface at breast height). Although the annual stem diameter increment is considered the most suitable proxy of forest productivity [23], recent findings showed that it is not sufficient to detect the impact of environmental stress on tree growth [11]. The analyses of the intra-annual radial growth pattern (i.e., the change of basal area per unit of time) is already successfully used to assess forest health and tree vigor, as well as to investigate the response of trees to changing environment [24,25]. Point dendrometers are commonly used to monitor intra-annual stem growth pattern. Dendrometers signals (i.e., stem radial variations) are analysed through empirical methods [26], mathematical functions [27,28] or fitting models [29,30] to extrapolate information about growth rates, phenology or tree response to the environment. The dendrometers permit a high time and space resolution data acquisition (micrometric stem radial changes are recorded over a reduced time period—minutes or hour) thus providing both detailed stem growth pattern over the year (irreversible changes) and hourly or daily stem radial changes (reversible changes) related to the tree water status [25,31,32]. Amplitude and duration of the stem daily radius variations (MDS, maximum daily stem shrinkage) were used to assess tree water status in response to drought [33,34,35], low temperatures [36], warming [37] and water deficit combined with warming [38,39]. Although point dendrometers are widely used in studying the ecophysiology of woody species, they have rarely been used to assess the effect of O3 on stem growth and water relations of trees. The decrease of daily stem growth rates under episodically high O3 concentration was recorded by stem cycle analyses in a mixed deciduous natural stand Appalachian forest [40]. The growth reduction was mediated by an increase of daily stem shrinkage, showing that O3 increased the tree sensitivity to water stress as already previously reported for yellow poplar [41]. These results highlighted the potential role of dendrometers to assess the effect of O3 on forest health and tree sensitivity to environmental constraints.
Sap flux density is commonly used as a suitable proxy of canopy conductance [42] and can give useful information on stomatal behaviour [43]. As O3 uptake and transpiration are strictly correlated, the whole-tree O3 uptake can be estimated by sap flow based approach [44,45]. In addition, the sap flow measurement was used to assess the effect of elevated O3 concentration on tree water use in different forest species and communities with contrasting results. Previous findings based on the simultaneous measurements of stem radius and sap flux density revealed synchronization of water storage and transpiration dynamics in olive [27] and Picea abies (L.) H. Karst [46]. These results support the hypothesis that the simultaneous use of stem radius changes and sap fluxes could address the issues of synchronization between plant signals and environmental variables, thus giving important information about the acclimation strategy to high O3.
The effect of long term O3 exposure on wood traits has rarely been addressed in forest species. In a tree, the hydraulic efficiency depends on xylem traits, and lumen vessel diameter is linearly related to sap fluxes and transpiration [47]. In a recent work, we did not observe significant changes in the physical wood structure of the ‘Oxford’ poplar clone after six years of ambient O3 exposure [20]. On the contrary, O3 treatments induced a reduction of fiber cell wall thickening and the number of cambial initials in hybrid poplar as result of a higher wood lignin content of the treated trees than that of the control [48]. Increasing O3 concentration induced changes in vessel frequency distribution in silver birch, but this effect was genotype-dependent [49]. These results highlight the need to deepen the investigation on the role of xylem traits in the response of trees to O3.
In this study, we aimed at analyzing the relationships of intra-annual stem growth pattern, seasonal sap flow dynamics and xylem morphology to assess the effect of long-term ambient O3 exposure on mature O3-sensitive poplar trees protected and unprotected by EDU. We hypothesized that: (1) the recurrent O3 leaf injury affected stem growth during periods with high level of O3 pollution and water deficit; (2) unprotected trees had a lower sap flow than the EDU-protected ones; (3) the decrease of sap flow under O3 was a direct effect of the reduced leaf gas exchange, rather than of a reduction of xylem hydraulic conductivity.

2. Materials and Methods

2.1. Site and Treatment Description

One-year-old cuttings of the O3-sensitive clone ‘Oxford’, Populus maximoviczii Henry × berolinensis Dippel, were planted in Autumn 2007 at the Antella experimental site in central Italy (43°44′ N, 11°16′ E, 50 m a.s.l.). For this clone, a critical range of stomatal O3 uptake and visible injury was already defined over a prolonged ozone exposure [6].
The study area is sited on post-agricultural area and according to the Köppen and Geiger climate classification, the site is classified as Csa (temperate-dry summer-hot summer) with mean annual temperature of 14.7 °C and total annual precipitation 1200 mm [21]. The original forest ecosystem was mainly represented to broadleaved forest dominated by Quercus pubescens Willd., Quercus robur L., Fraxinus ornus L. and Ostrya carpinifolia Scop. typical of the Tuscany landscape.
Trees were cultivated as single-trunk free-canopy individuals at a spacing of 1 m × 3 m. Every week during the growing season (April to October) each tree was drip irrigated with 2 L of water (WAT or watered treated trees) as ambient O3 treatment, or 450 ppm EDU solution (EDU or protected trees) as O3 protection treatment. A general description of the site, experimental design, EDU treatments, and results of biomass growth after 3 and 6 years is already reported [15,20,22,50]. Heat pulse sensors and dendrometers were installed on 5 WAT trees and 5 EDU trees in 2012 and 2013, respectively. Results presented in this paper refer to the year 2013, i.e., when the trees were 7 years old and mean plant height and stem diameter at breast height (DBH) were 7.4 ± 0.5 m and 7.7 ± 0.5 cm for WAT and 8.4 ± 0.6 m and 10.5 ± 1.7 cm for EDU, respectively.

2.2. Environmental Variables

Hourly means of air temperature (T, °C), relative humidity (RH, %), and precipitation (P, mm) were recorded by a modular weather station (110-WS-16, Novalynx Corporation, Auburn, CA, USA) at canopy height. Vapour pressure deficit (D, kPa) was calculated using the Goff-Gratch formulation for saturated water vapour pressure [51].
Ozone concentrations were recorded at canopy height by an annually-calibrated O3 monitor (Model 202, 2B Technologies, Inc., Boulder, CO, USA). Ozone exposure was expressed as 24-h mean (M24). AOT40 and POD0, i.e., the accumulated exposure over a threshold of 40 ppb and the accumulated stomatal O3 flux over the 2013 growing season, were 16 ppm h and 34.9 mmol m−2, respectively, as calculated according to UN/ECE [52,53]. For O3 concentration, data acquisition started on DOY (day of the year) 121.
In order to assess the effect of O3 exposure, the growing season was ideally divided in two periods characterized by contrasting intensity of air vapour pressure deficit and O3 concentration (M24) as follows: (1) low evaporative demand (D <1 kPa), mean temperature <30°C and M24 <40ppb; (2) high evaporative demand (D >1.5 kPa), daily maximum temperature >30°C, M24 >40ppb.
Soil moisture was measured in the root layer (30 cm depth) by EC-5 sensors equipped with an EM5b data logger (Decagon Devices Inc., Pullman, WA, USA). The soil was sandy clay loam characterized by volumetric water content of 0.27 m3 m−3 at field capacity (soil matric potential of −0.03 MPa) and 0.17 m3 m−3 at wilting point (soil matric potential −1.5 MPa) [15].

2.3. Stem Radius Growth

Stem radius variation was detected using high-resolution automatic point dendrometers, i.e., RS Pro LM10 linear variable transducers (Rs Component s.r.l., Cinisello Balsamo, MI, Italy) that measured the linear displacement of a stainless-steel sensing rod (effective travel 10 ± 0.5 mm, linear thermal expansion coefficient 2.5 × 10⁻⁶ K−1), pressed against the bark [54]. The transducer was mounted on a steel rigid frame composed of two attachment plates anchored to the stem by adjusting two connecting steel rods. The dendrometers were installed on the trunk at breast height (130 cm), and shielded from direct sunlight and weather damage by aluminum foils. The operating principles are described in Traversari et al. [35]. Calibration of the transducer was performed on a bimonthly basis, as suggested in Cocozza et al. [55]. Raw data were recorded every 15 min, and hourly and daily averages were calculated with a CR 1000 data logger (Campbell Scientific, Inc. Logan, UT, USA). Hourly signals were recorded from mid-March (DOY 74) to mid-December (DOY 347) 2013 on five individual poplar plants per each treatment (WAT and EDU).

2.4. Sap Flow

Granier-type sensors [56] were inserted radially at breast height into 20 mm depth of the north side of the trunk (to avoid the sun-exposed side) of the same 10 trees (five per treatment) in spring 2012. The average stem diameter at the level of sensor installation was 75 mm. The sensors consisted of a pair of copper-constant thermocouples vertically spaced; the upper probe was continuously heated through a heating wire supplied with a constant power source (120 mA). The temperature difference of the two probes was recorded to obtain the volume flux density of sap flow per plant (Js, g cm−2 s−1). The temperature difference was estimated on a daily basis in order to avoid errors in the daily maximum and daily total flow calculations due to season and soil drying/rewetting cycles. For each plant, the sap flux density was integrated over the sapwood area to obtain sap flow (Sf, kg h−1).

2.5. Tree Harvest, Xylem Morphology and Huber Value

In April 2014, the five trees in each treatment (EDU and WAT) were harvested and woody stem discs of 8–10 cm in thickness were collected at 130 cm from the collar. Fresh stem discs were immediately scanned and the sapwood area (AS, m2) was measured, excluding pith and bark sections using Image J software (National Institute of Health, Bethesda, MD, USA, 2014). For each tree, all leaves were gathered, the total leaf area (AL, m2) was calculated as sum of each single leaf area and used to calculate the Huber value (Hv, sapwood-to-leaf area ratio) [57] following the following equation:
H v = A S A L
From each stem disc, four prismatic woody samples containing the last three growth rings (corresponding to the growing seasons 2011, 2012, 2013) were collected, placed in 50:50 mixture of ethanol and water and stored at 5°C. The samples were then fixed through ice on a Peltier plate and transverse sections of 8–12 mm thickness were cut using a rotary microtome. The sections were stained with a solution of 0.04% safranin, 0.15% astrablue and 2% acetic acid in distilled water and permanently fixed with the Eukitt histological mounting medium (BIO-OPTICA MILANO SPA, Milan, Italy). A Nikon Eclipse 800E light microscope connected to a Nikon DS-Fi2 microscope camera (Nikon Corporation, Tokyo, Japan) was used for anatomical observations. Digital images of cross-sections (1 mm2) belonging to the woody ring formed during 2013 were then analyzed and transversal stem structure examination was performed on four to six independent images per section using the computer program NIKON NIS-ELEMENTS software (Nikon Instruments Inc., Melville, NY, USA).
For each image, the vessel density (Vd, N mm−2) and vessel diameter (dm, mm) were calculated for each cross section. The diameter of each vessel was calculated as the diameter of a circle with an area equivalent to the lumen cross-section. The hydraulic weighted vessel diameter, DH (mm) [58] was calculated as
D H = 2 ( r 5 r 4 )
where r = radius in mm. The calculation of DH incorporates the disproportionate contribution of large vessels to total flow and gives the average diameter needed for a given vessel density to result in the theoretical hydraulic conductivity for that stem [59]. The theoretical specific xylem hydraulic conductivity (Kst) was calculated using the Hagen–Poiseuille equation for ideal capillaries assuming laminar flow [60]
K st = ( π ρ 128   ×   η   × A i m a g e ) × D v 4
where ρ is the density of water (998.2 Kg m−3 at 20 °C); η is the viscosity of water (1.002 × 10⁻⁹ MPa s at 20 °C), Aimage is the area of the analyzed image (m2) and Dv is the vessel diameter.

2.6. Data Analyses

In the first step, we evaluated the effect of long-term O3 exposure on the intra-annual pattern of stem radial growth and sap flow of WAT and EDU trees. To reduce high daily frequency oscillation, we calculated the radial increment (ΔR, mm) as average of the maximum values of stem radius over a five-day period (pentad) following the procedure proposed by Boriaud et al. [61]. Time series obtained by the sum of the pentad (Pentad ΔR) were fitted with a Gompertz model [29] using non linear regression of the Sigma plot 12.0 statistic package (Systat Software, Inc., Point Richmond, CA, USA). From DOY 90 to DOY255, the intra-annual stem radial growth pattern was expressed as
Δ Rsum = I + A e [ e ( β k t ) ]
where A, b, k, and t were the parameters of the function representing growth asymptote, time-axis placement and rate of change of the curve and time (expressed as DOY), respectively. The parameter I represented the stem radius of the tree, which was set to zero at DOY 90 for all the trees. The estimated seasonal stem radial growth was obtained by summing the parameters I and A [62]. The β/κ ratio was calculated to determine ti (time of the inflection point, DOY) following the procedure proposed by Rossi et al. [63]. The ti was used to compare the time of the culmination of the stem growth rate of the EDU and WAT plants. The DOY of growth rest was empirically estimated on the basis of the position of the upper asymptote deriving from the Gompertz fitting. Significant differences in the Gompertz parameters between treatments were detected by t-test for p < 0.05.
In the second step, we evaluated the effect of short term high O3 exposure on the daily stem radial growth, water status and sap flow of WAT and EDU-treated trees. The time series of M24 was evaluated in order to select time windows in which O3 exceeded the arbitrary threshold of 40 ppb M24. We thus selected a 10-day period (from DOY 214 to DOY 224) during which M24 exceeded 40 ppb with peaks of 80 ppb. From DOY 214 to DOY 224, the daily stem radius increment, ΔR (mm), was calculated following the stem cycle analyses approach [64]. The ΔR was obtained as difference between stem radius maximum of two successive cycles, whilst MDS (maximum daily shrinkage) was the difference between the maximum and minimum of stem radius within the same cycle. The rate of ΔR or MDS (mm h−1) was calculated by dividing the values by the duration of stem growth or contraction, respectively. Instantaneous stem water deficit, ΔWi (mm), was extracted by de-trending the daily time series of ΔR using a piecewise linear regression (Figure S1.) They were then plotted against hourly sap flow data to compare internal daily stem water balance in EDU and WAT trees.

2.7. Statistical Analyses

The statistical unit was the individual tree (N = 5). Data were checked for normal distribution (Kolmogorov-Smirnov test) and the effect of the treatment was assessed by one-way analysis of variance (ANOVA) and Student t-test (p < 0.05). The effects of O3 and time on rate of ΔR and MDS were assessed by two-way ANOVA. Data that did not pass the normality test were analysed by non parametric Mann-Whitney test (p < 0.05).

3. Results

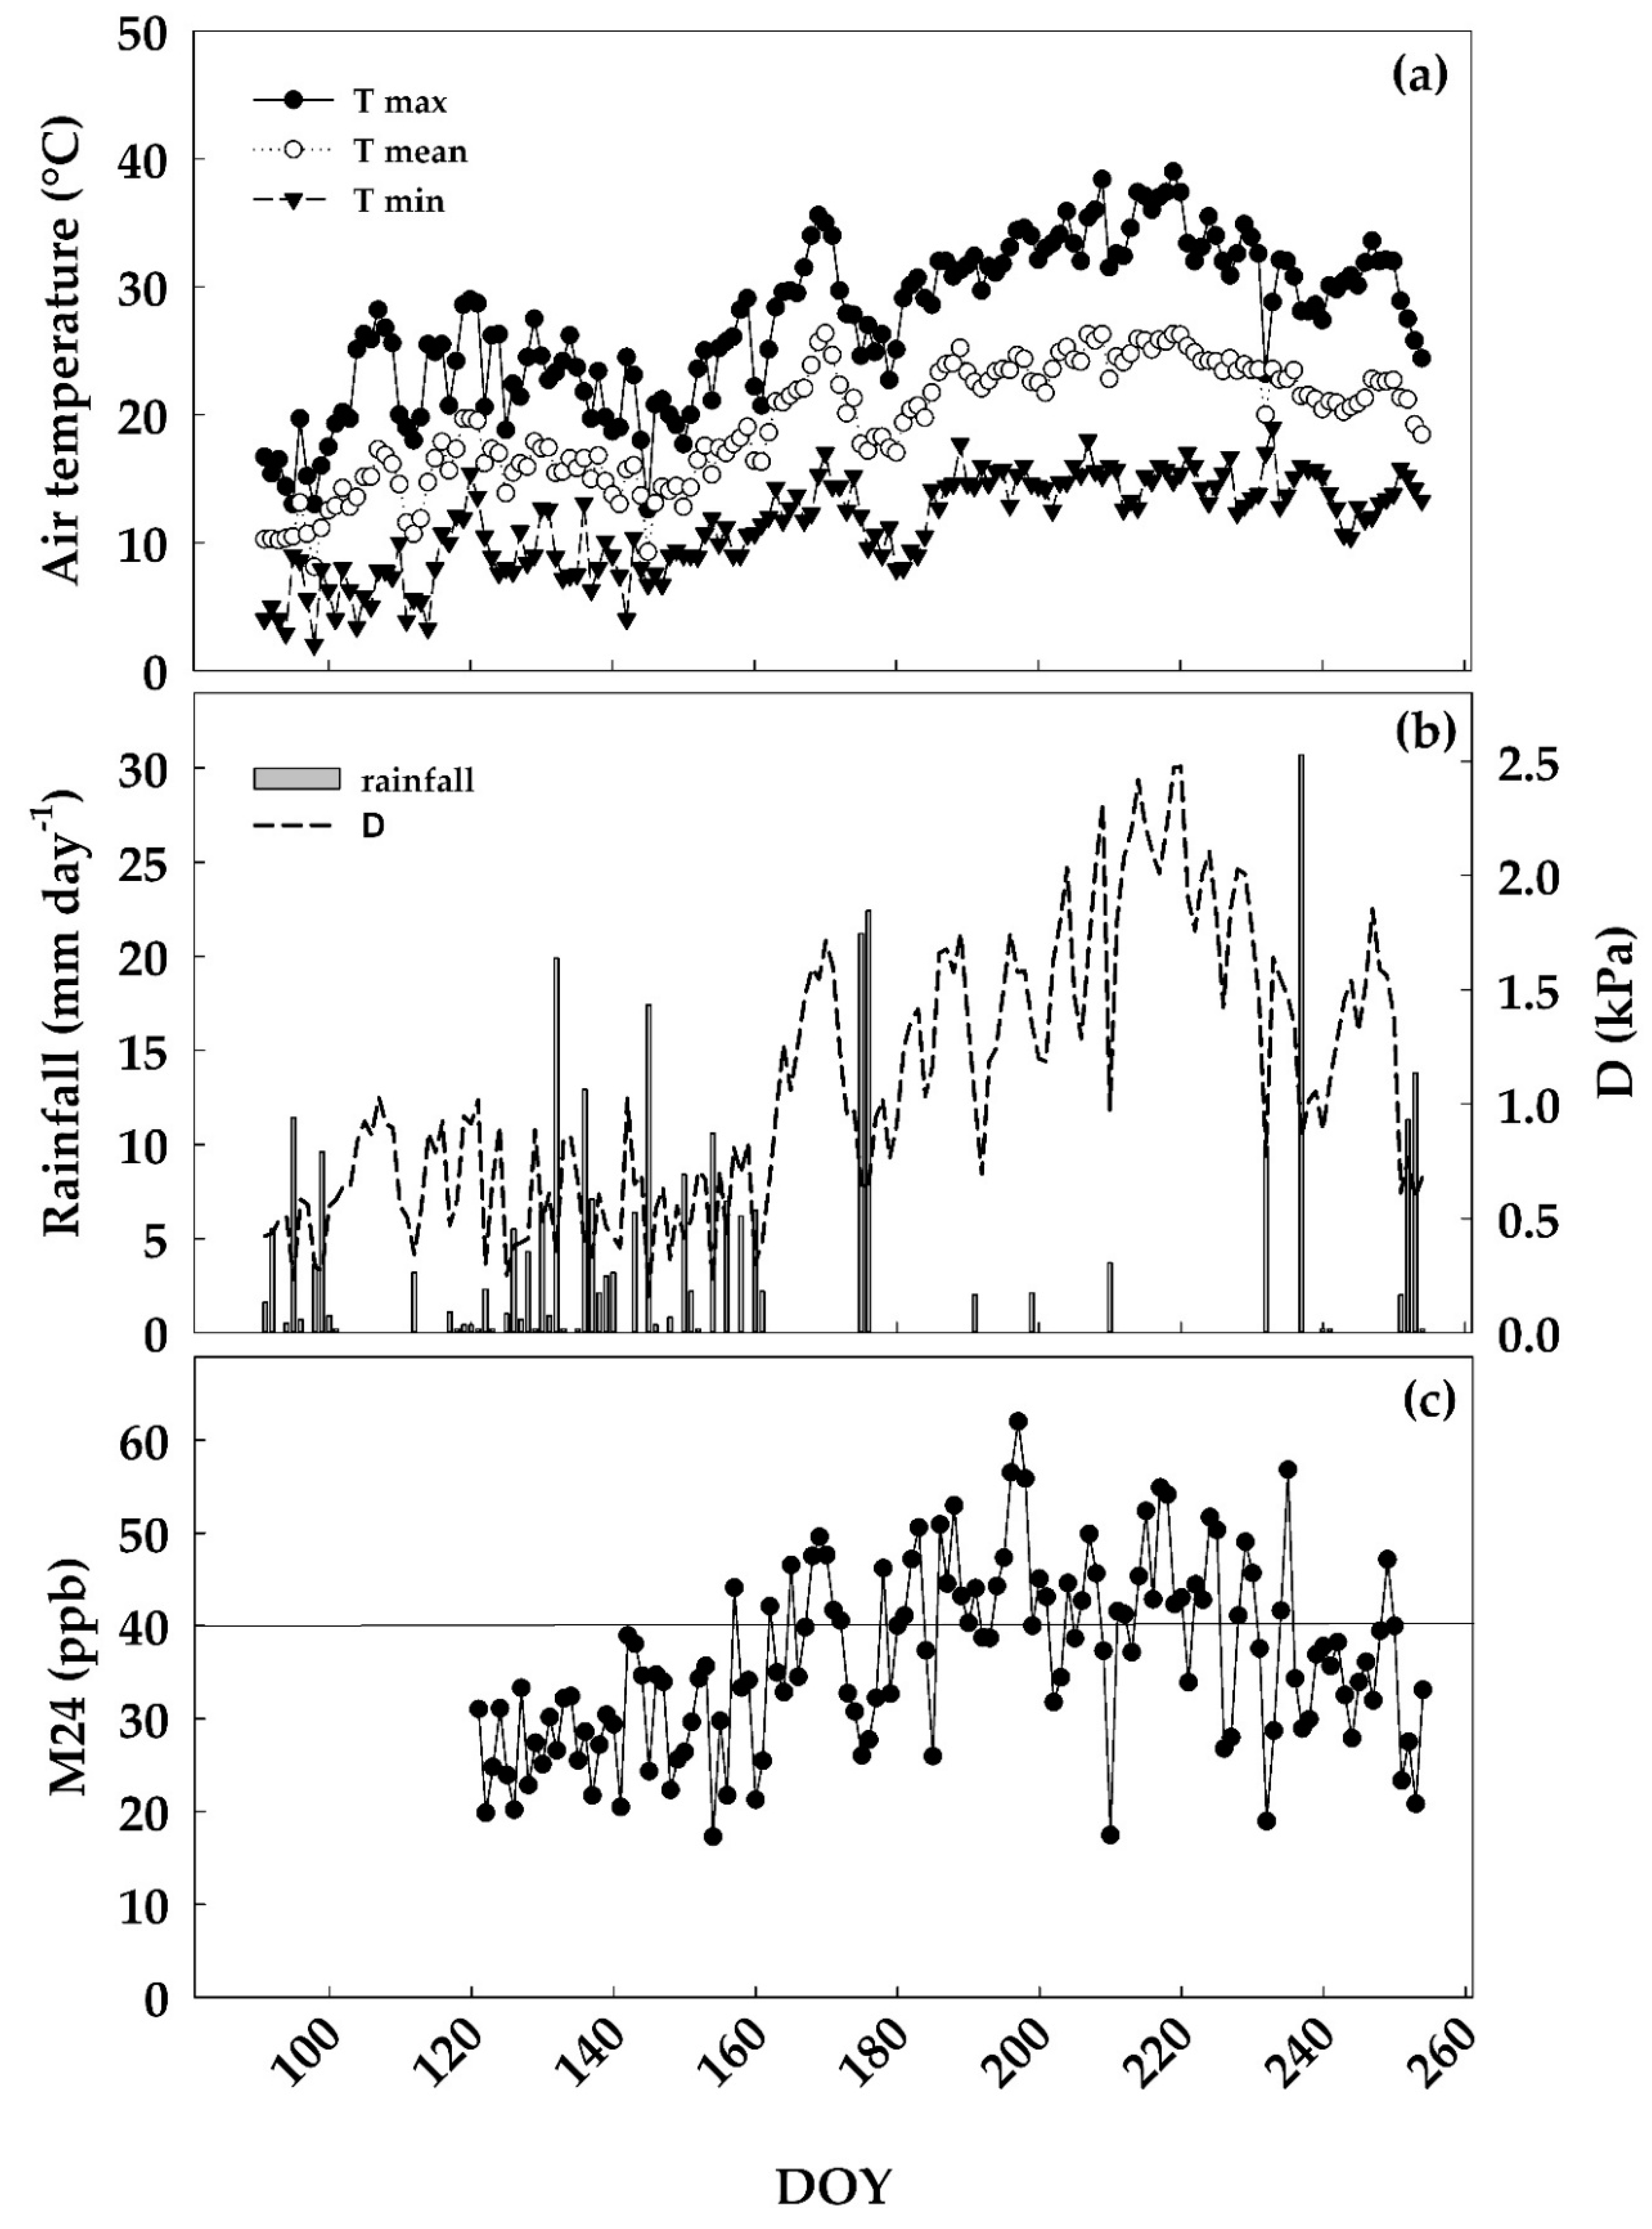
3.1. Environmental Conditions

The environmental parameters recorded at the site during 2013 (Figure 1) showed a typical Mediterranean pattern, with spring characterized by recurrent rainy events, low D (<1 KPa) and M24 (<40 ppb), and dry summer with high temperature (daily maximum temperature over 30°C), D (> 1.5 KPa) and M24 (> 40 ppb). From DOY 160 to DOY 225 the gradual increase of the evaporative demand (from 1 kPa on DOY 160 to 2.5 kPa on DOY 225) induced a water deficit condition as a consequence of increasing temperature (daily maximum temperature >30°C) and sporadic rainy events. From DOY 214 to DOY 224, M24 ranged between 40 and 55 ppb (9 days with multiple peaks over 40 ppb) in correspondence with the highest values of D.

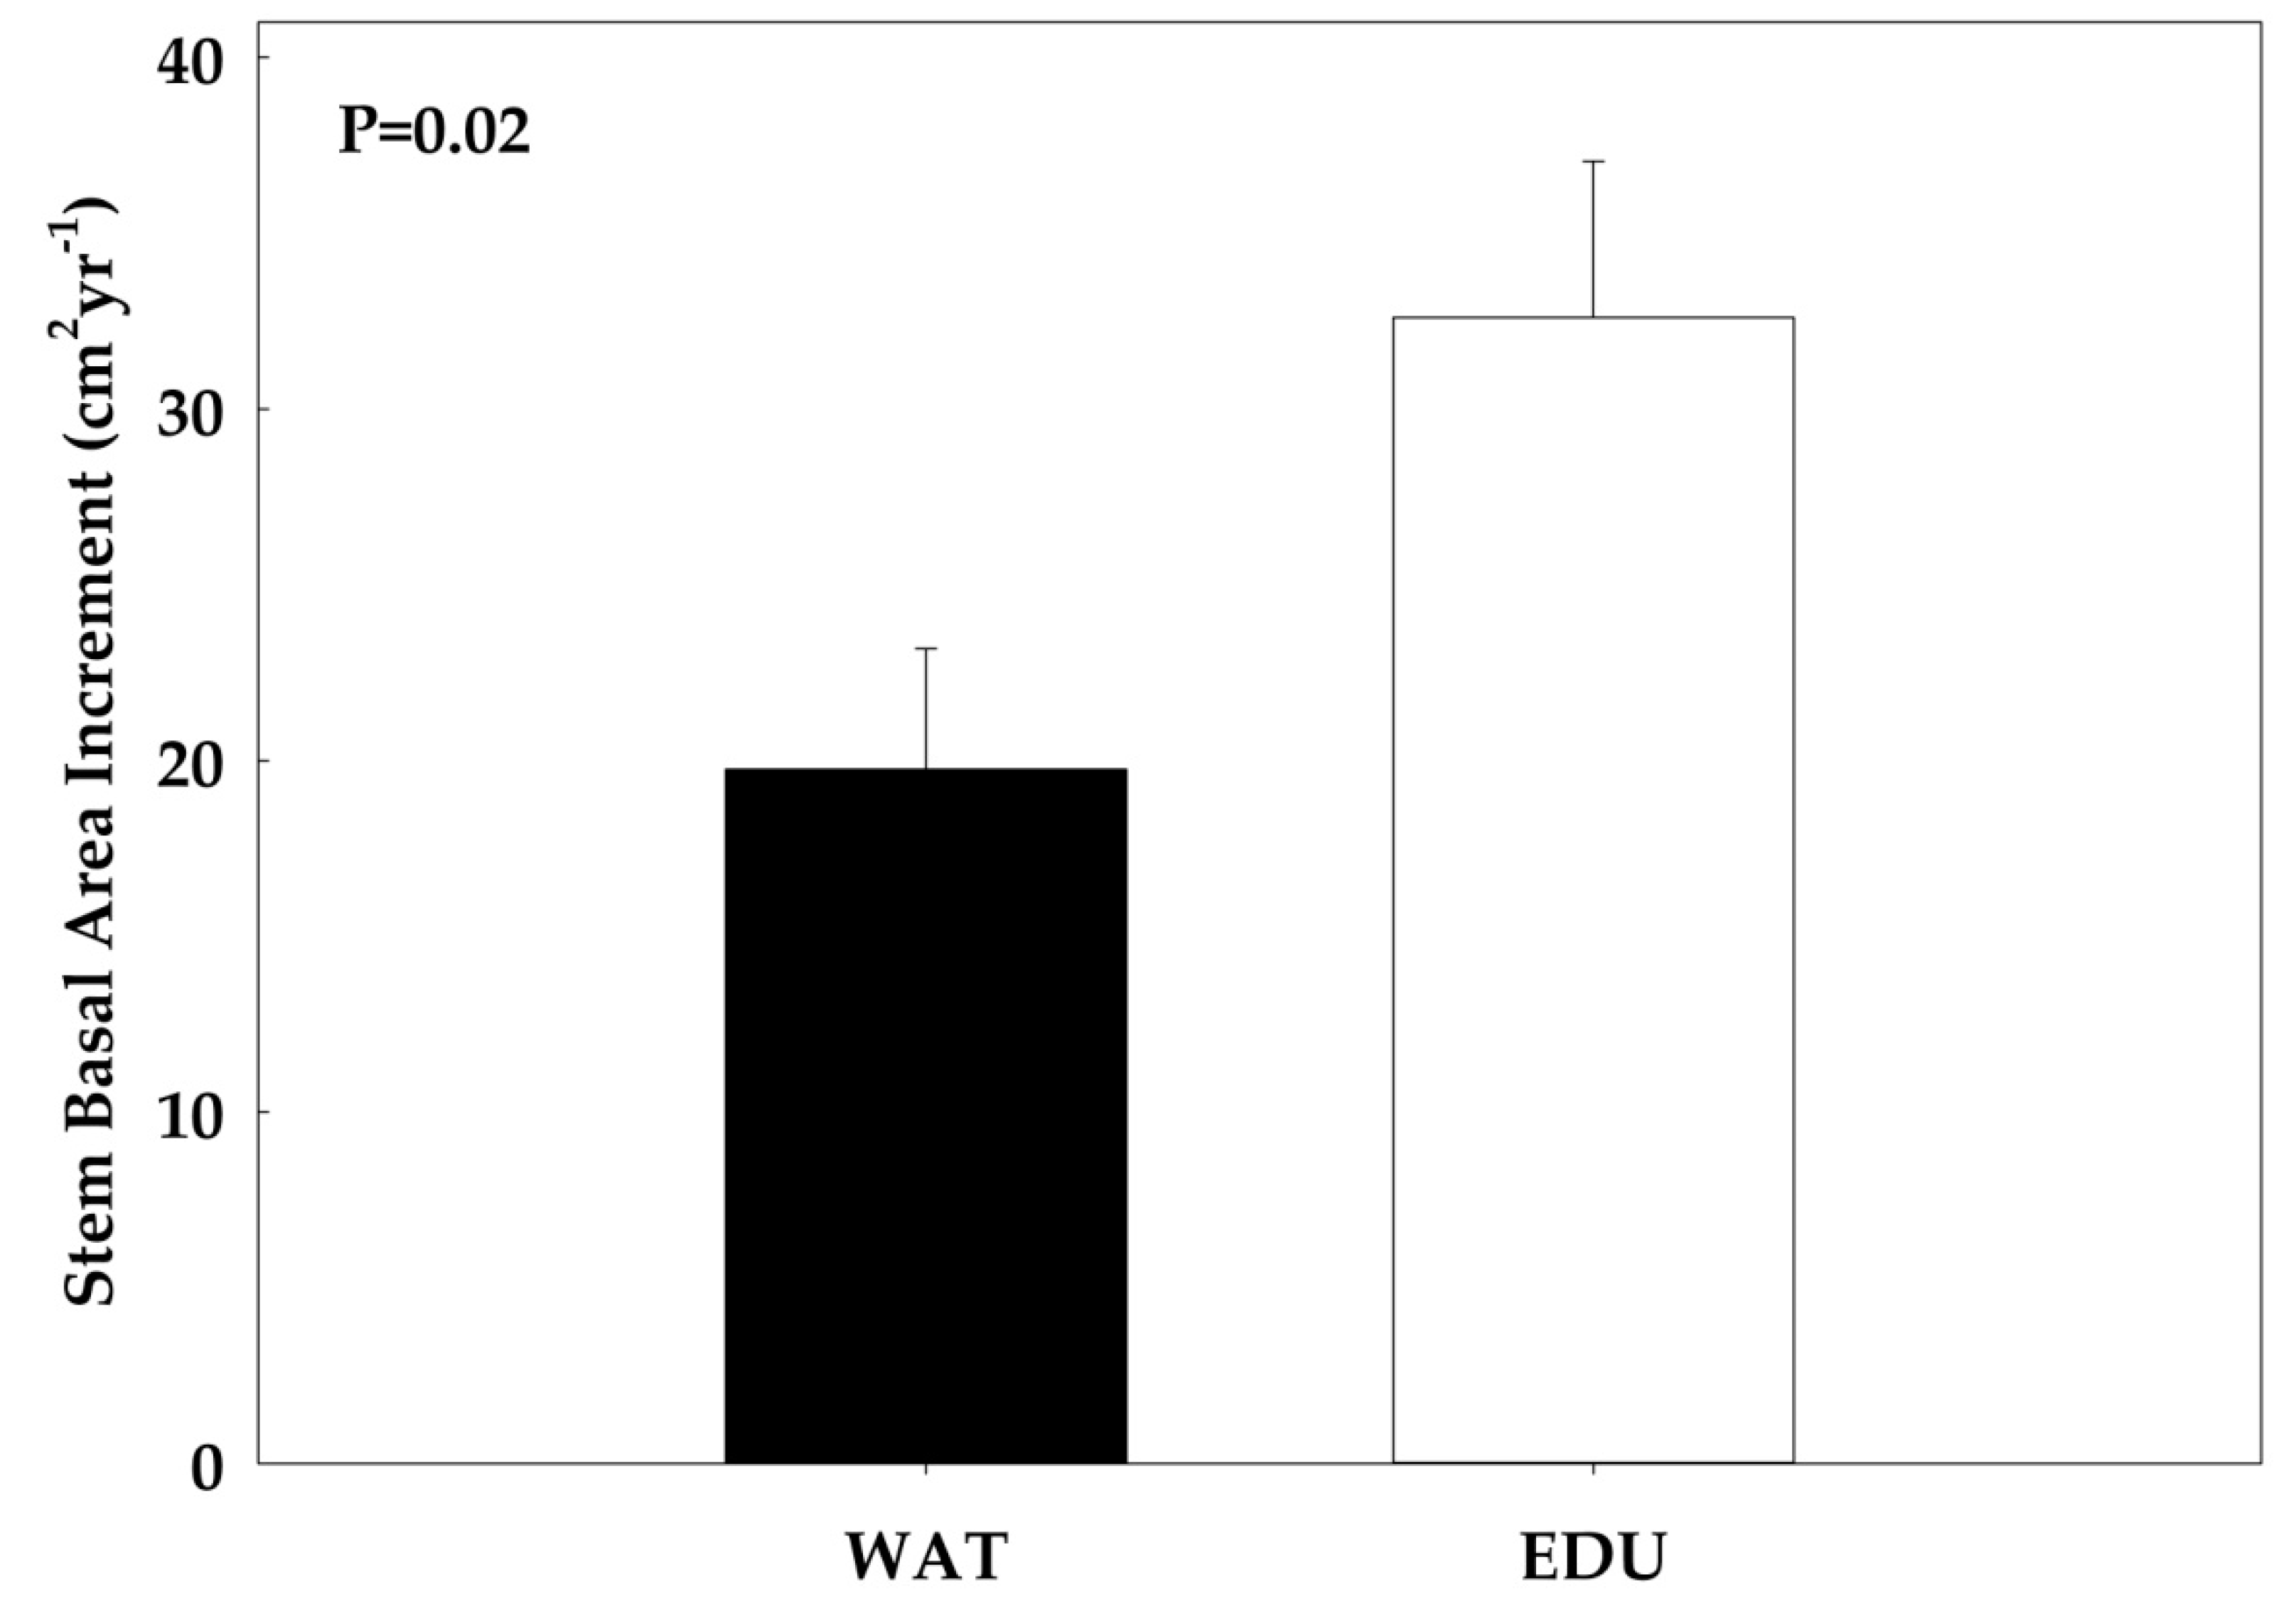
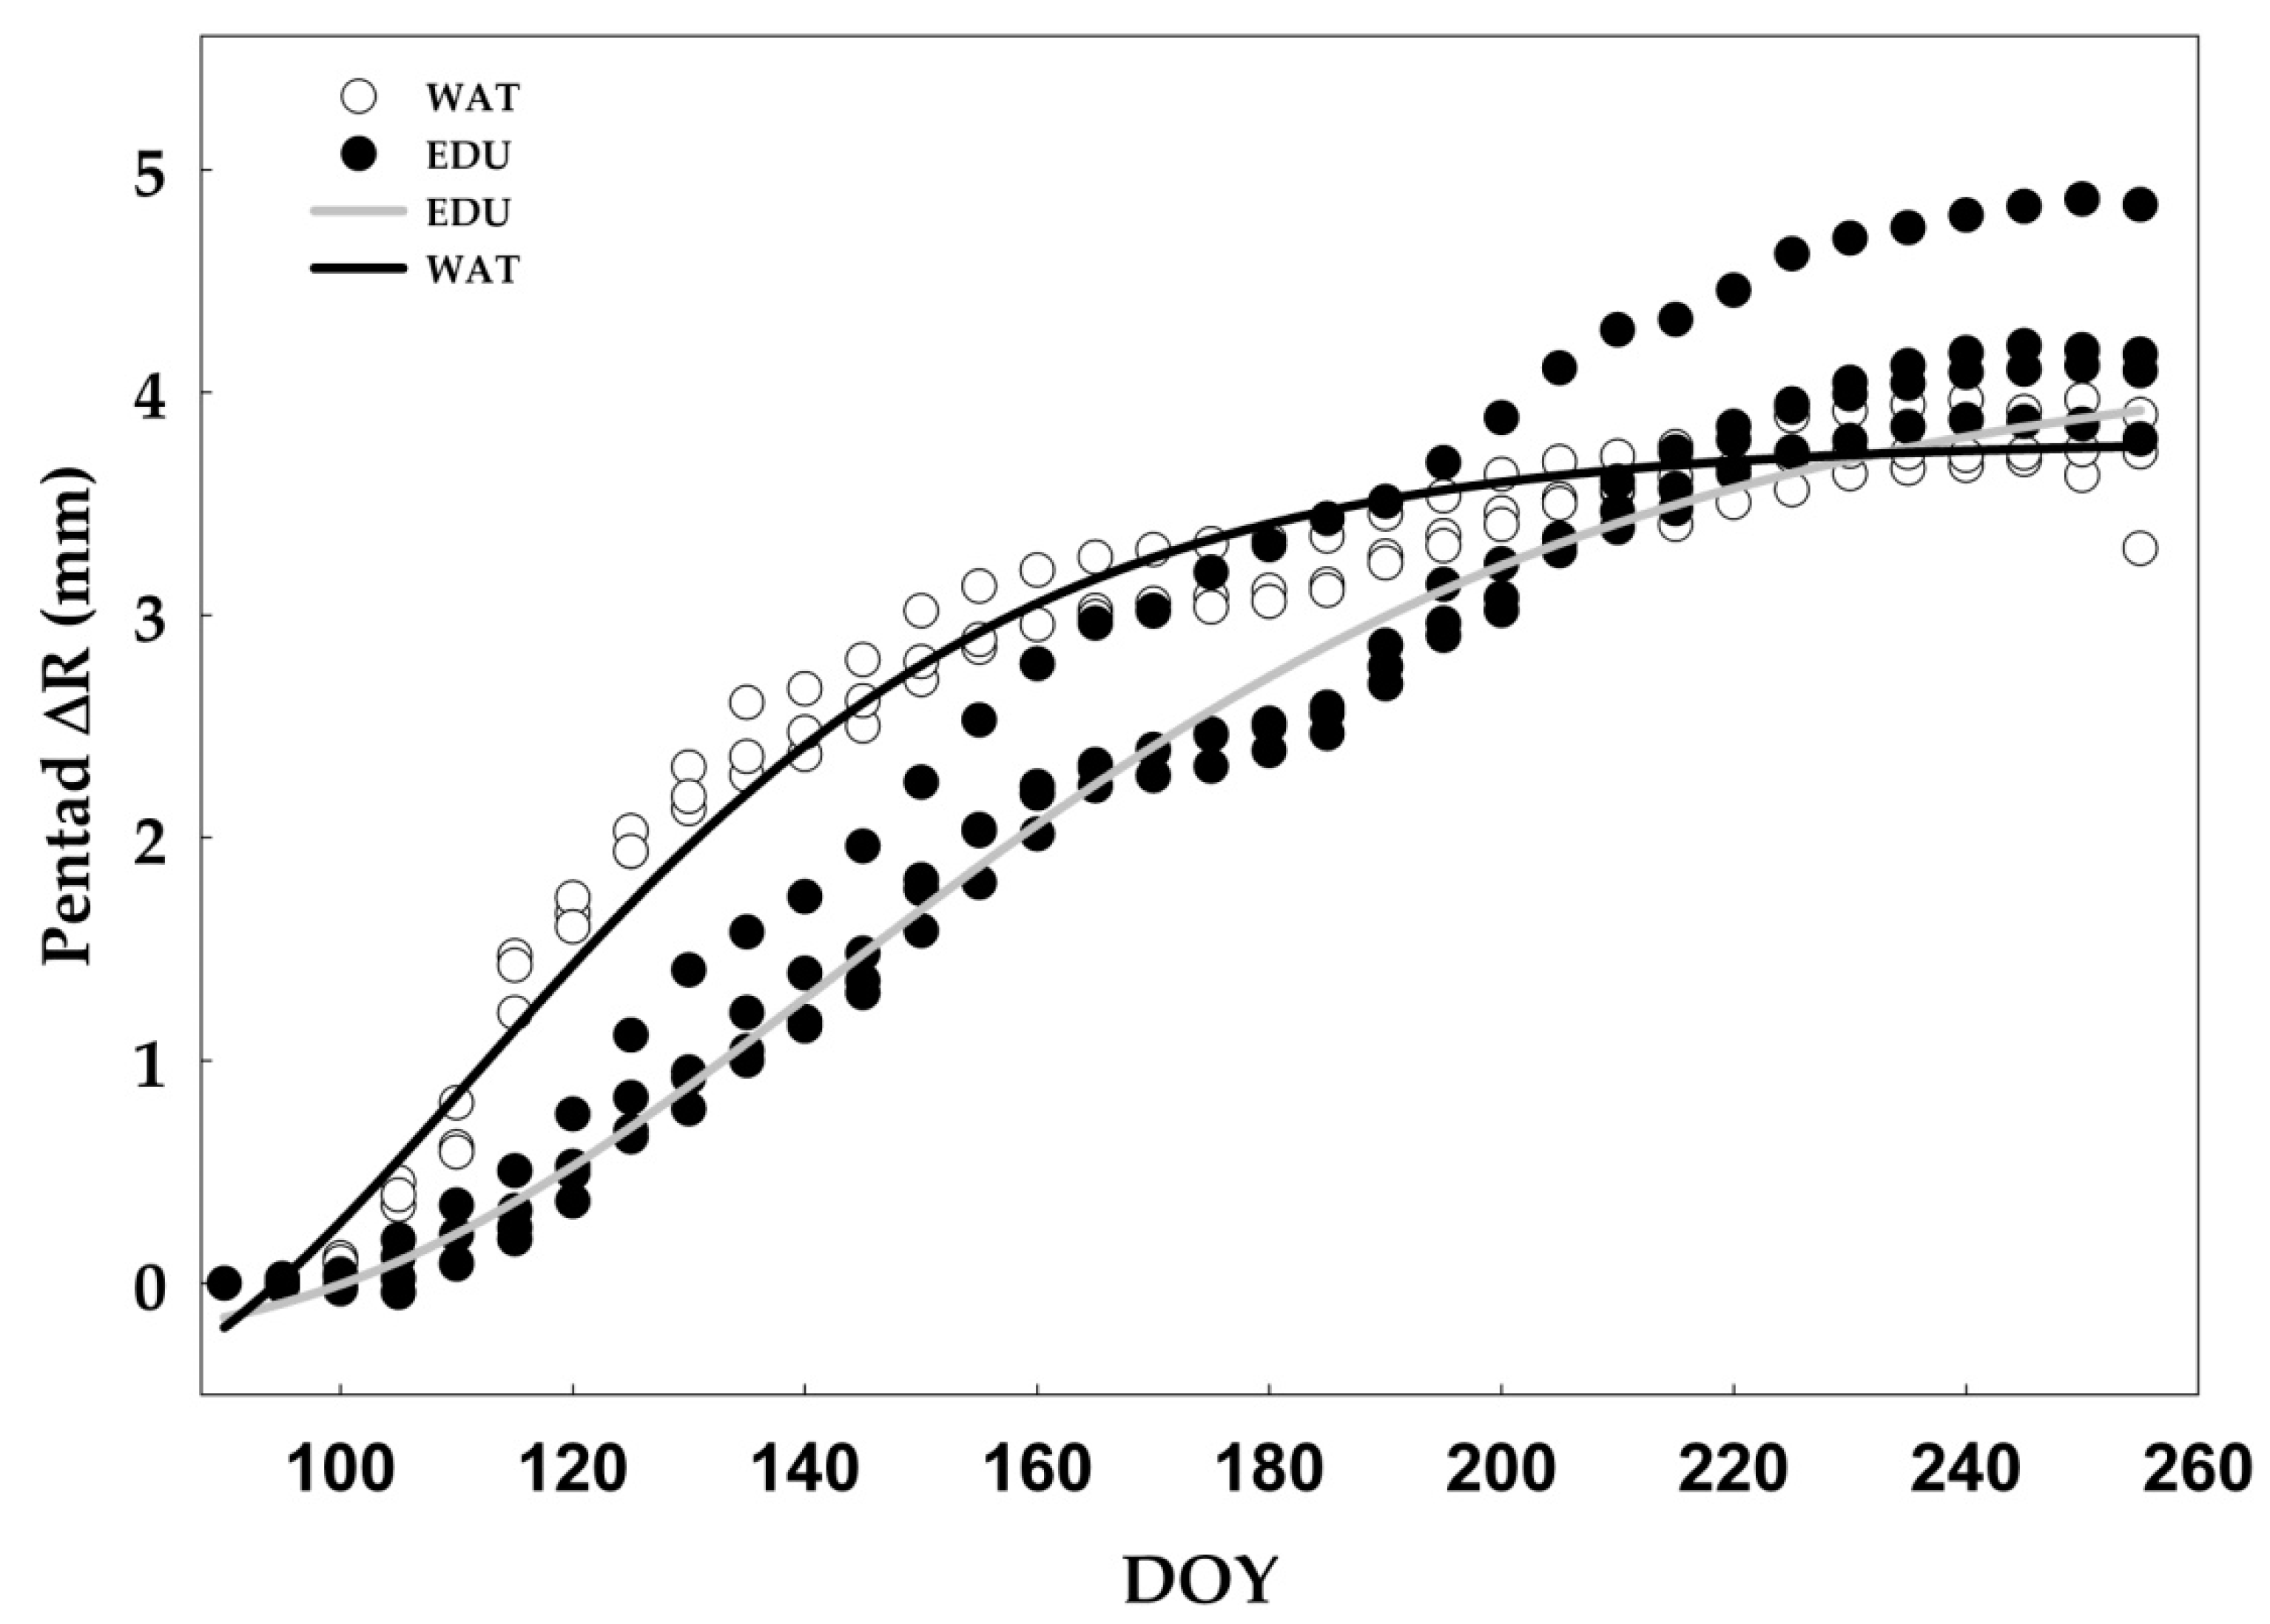
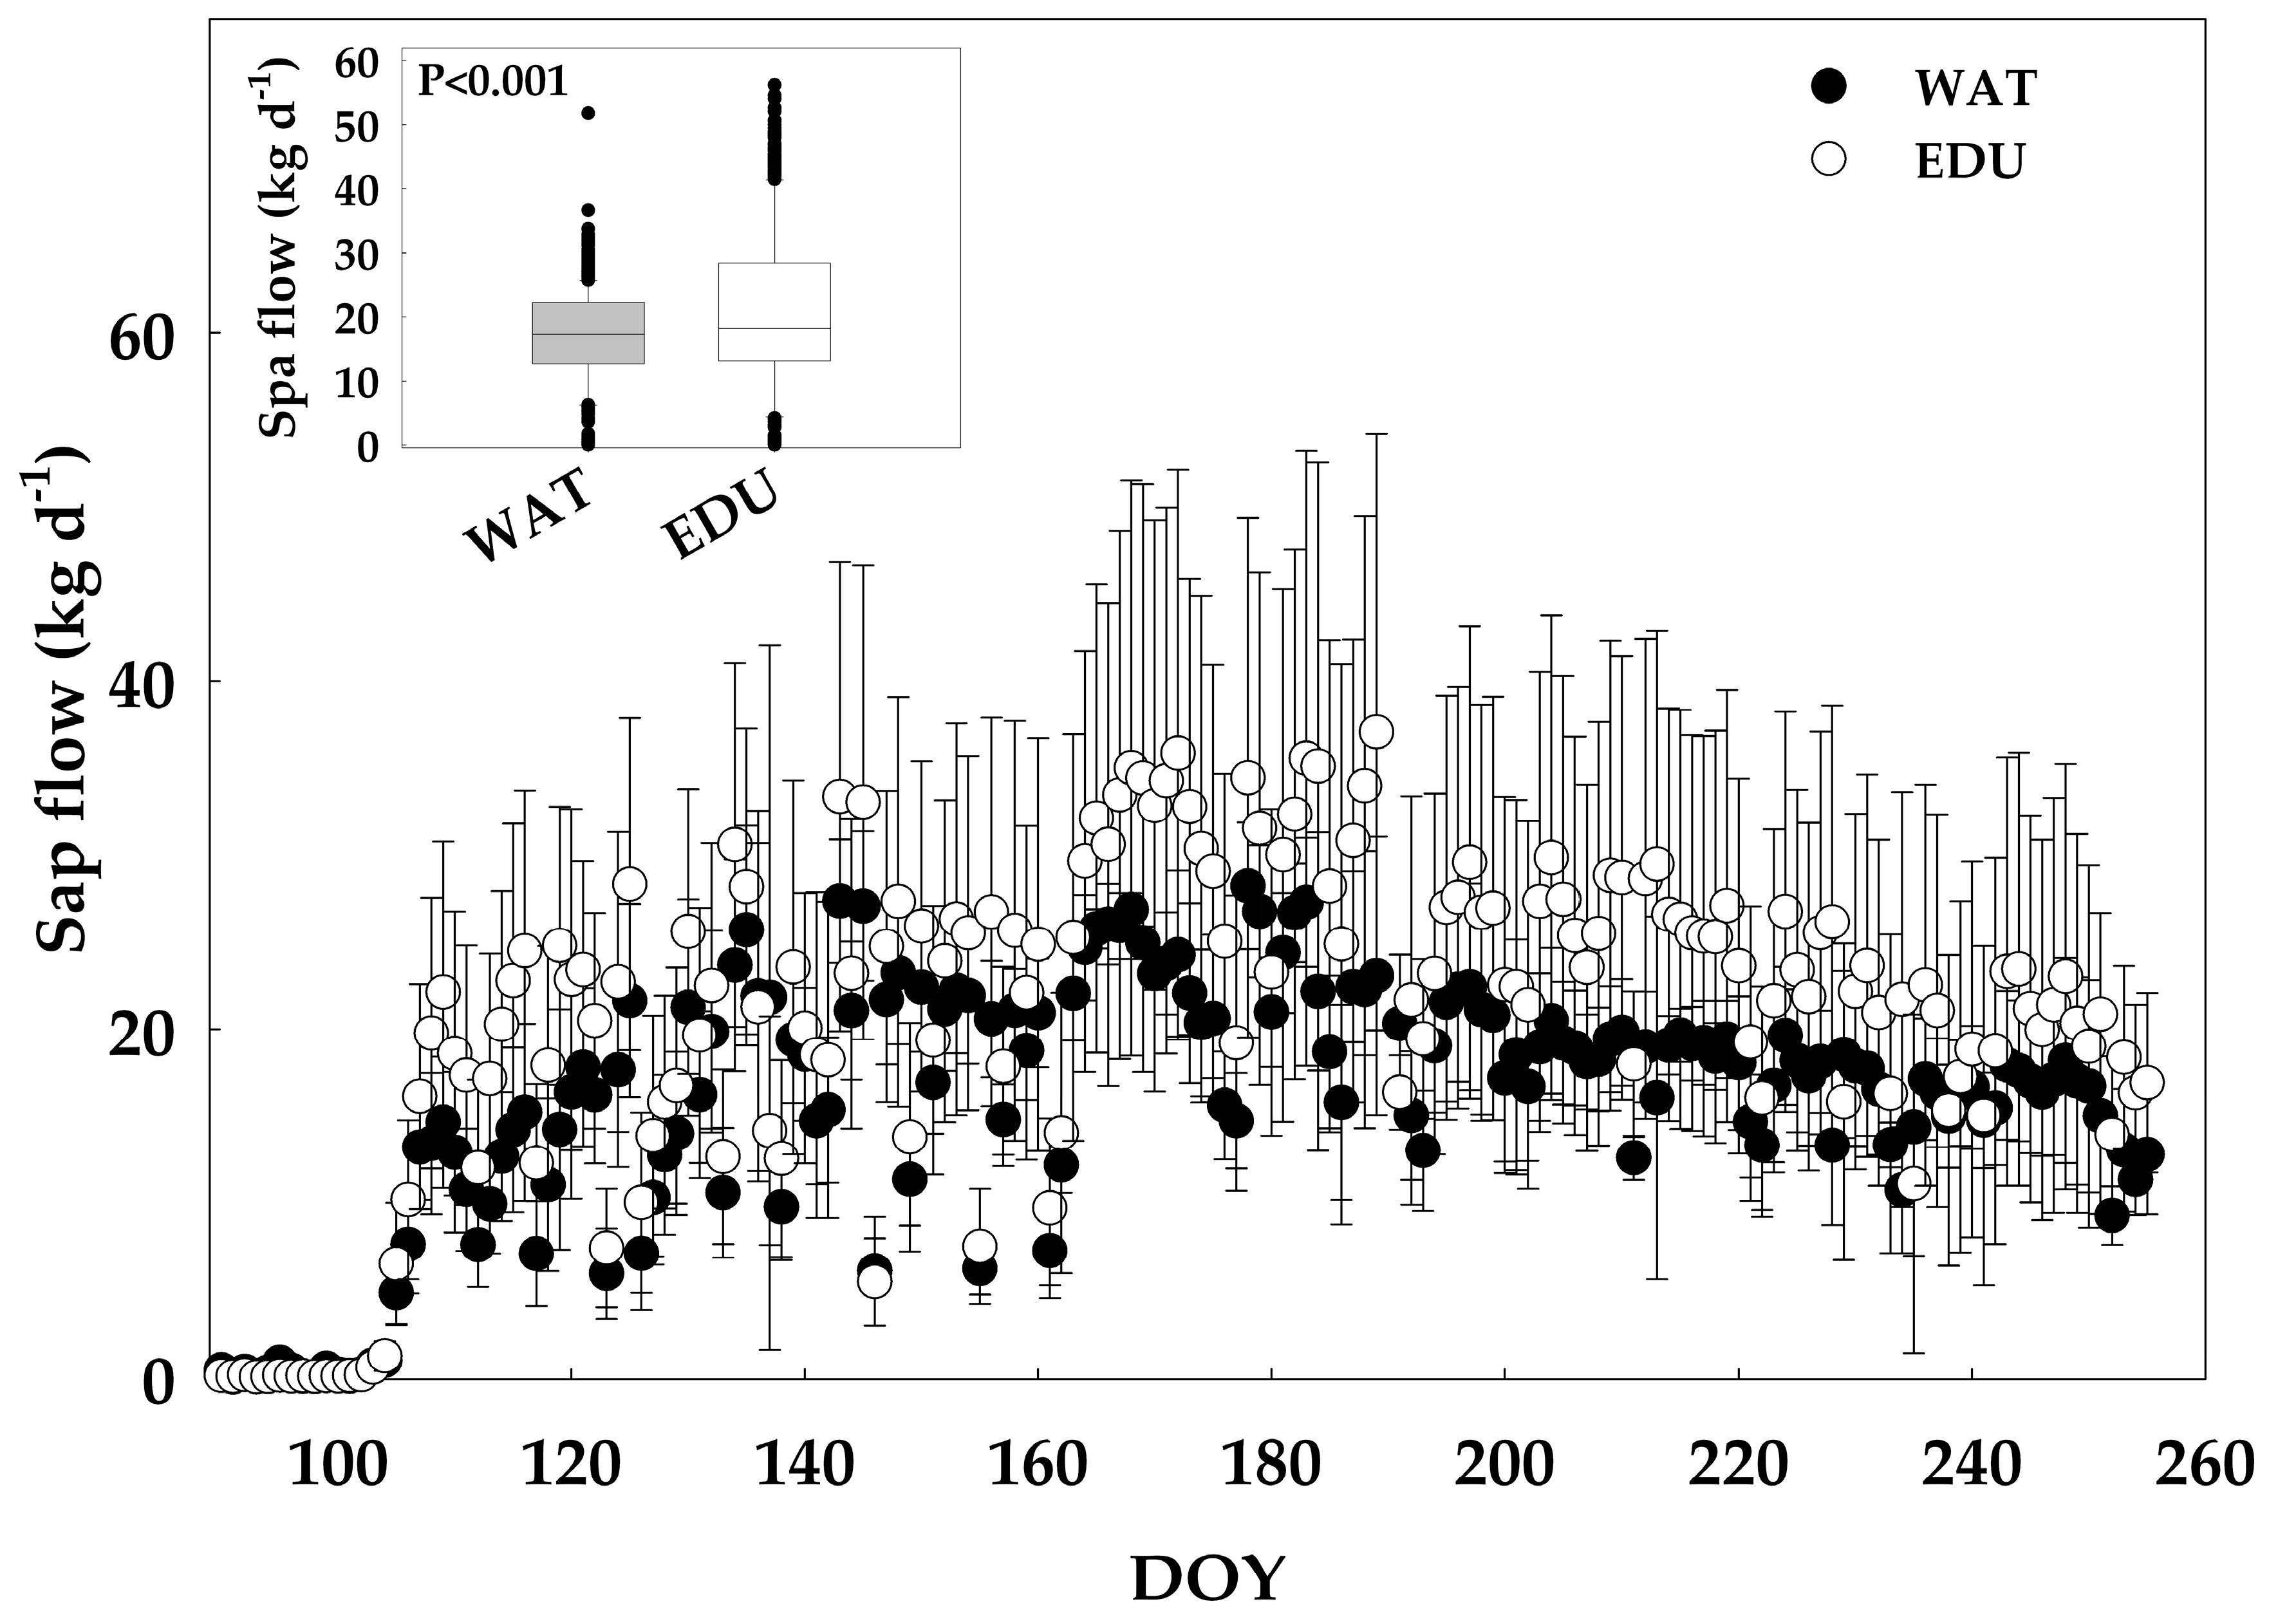
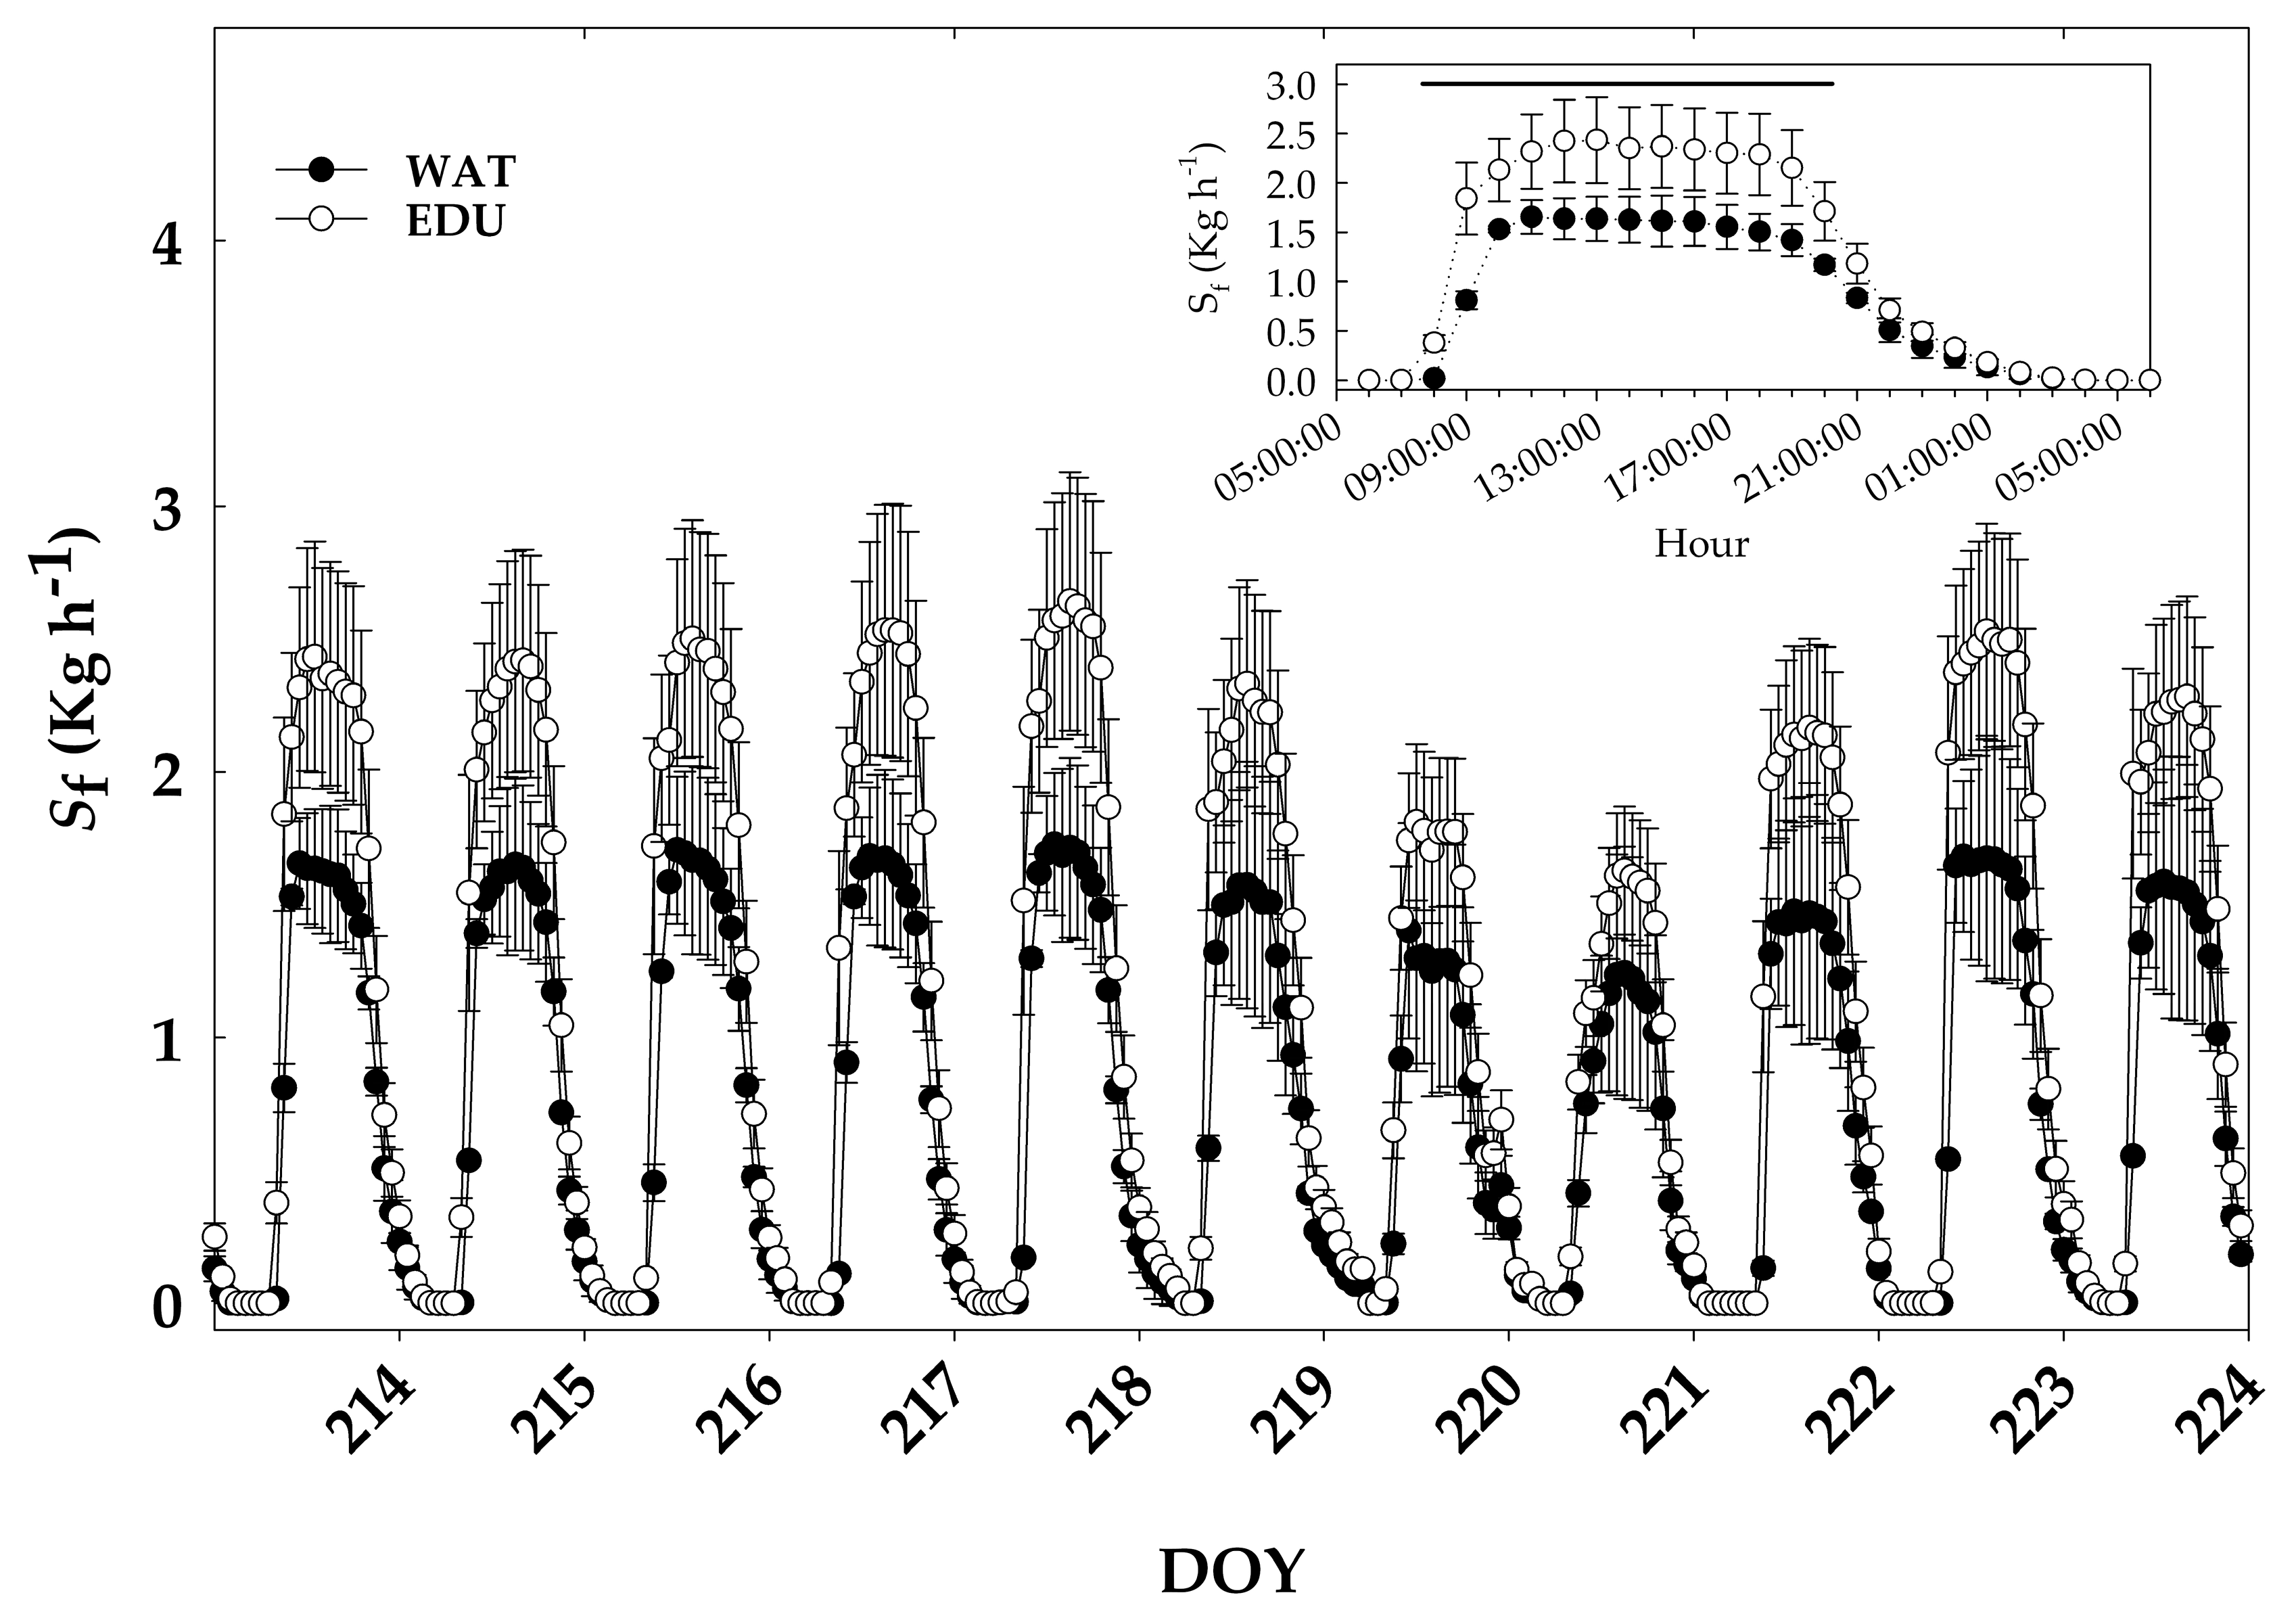
3.2. Effect of Long-term O3 Exposure on Intra-annual Radial Stem Growth and Seasonal Sap Flux Density

In 2013, the stem basal areas at breast height were 19.7 ± 7.6 and 32.6 ± 9.9 cm2 for WAT and EDU trees, respectively. The long-term O3 exposure of ‘Oxford’ poplar clone induced a decrease of the stem basal area increment in WAT trees during 2013 (Figure 2).
Overall, the cumulative sums of pentad ΔR over the season resulted in a typical S-shaped curve (Figure 3).
The parameters deriving from the fitting analyses permitted to describe the intra-annual radial stem growth pattern. WAT and EDU trees had similar radial growth rates and had a stem radial increment of 3.51 mm and 3.48 mm, respectively, at the end of the growing season. After the winter plateau, a general slight increase of ΔR occurred before a sharp period of exponential growth culminating between mid-April and early May, depending on the treatment (Table 1).
The inflection point (ti) occurred earlier in WAT (DOY 122) and later in EDU trees (DOY 144) whilst the values of k, i.e., the rate of change of the curve slope, were similar between treatments (0.025 and 0.032 × 10⁻² in EDU and WAT trees, respectively).
From DOY 90 to DOY 256, EDU and WAT trees displayed similar patterns of daily Sf (Figure 4). However, EDU trees had a significantly higher Sf than WAT ones (p < 0.001).
The median values of Sf were 17.3 and 18.5 kg d−1 for WAT and EDU trees, respectively. Half of the observed Sf ranged from 12.7 to 22.2 kg d−1 and 13.1 to 28.4 kg d−1 for WAT and EDU trees, respectively. During winter, the sap flow was negligible. From DOY 100 and DOY 110, Sf increased rapidly in concomitance with bud burst and leaf expansion. From DOY 110 to DOY 170, the pattern of Sf slightly increased both in EDU and WAT trees, even if a wide range of sudden daily oscillations was recorded (from 6 kg d−1 on DOY 146 to 36 kg d−1 on DOY 168). Multiple low Sf values occurred in concomitance with a rainy period and under low levels of D. After DOY 170 and until DOY 200, Sf reached the highest values of the season. Sf was higher than 20 kg d−1 on average with maximum values of 28.3 kg d−1 on DOY 179 and 40.9 kg d−1 on DOY 190 for WAT and EDU trees, respectively. From DOY 190 to DOY 256, Sf slightly decreased in EDU and WAT trees in response to high evaporative demand (D>1.5 kPa for 10 days) and elevated temperature (maximum temperature >30°C).
Long-term O3 exposure did not induce changes in xylem morphology and consequently in xylem hydraulic parameters (Table 2).
Vessel density and average vessel diameter were similar in WAT and EDU trees (90.5 vs 90.6 n mm−2 and 26.3 vs. 28 mm, respectively) as well as Kst ranged from 2.2 to 2.5 kg s−1m−1MPa−1 in WAT and EDU trees. However, the long-term exposure to ambient O3 pollution induced changes in the ratio between total leaf area and sapwood area. The Huber value of WAT trees (1.2 × 10⁴) was significantly higher than that of EDU ones (1.5 × 10⁴). Thus, under O3 exposure WAT trees supported lower leaf area per unit of sapwood area than EDU plants.

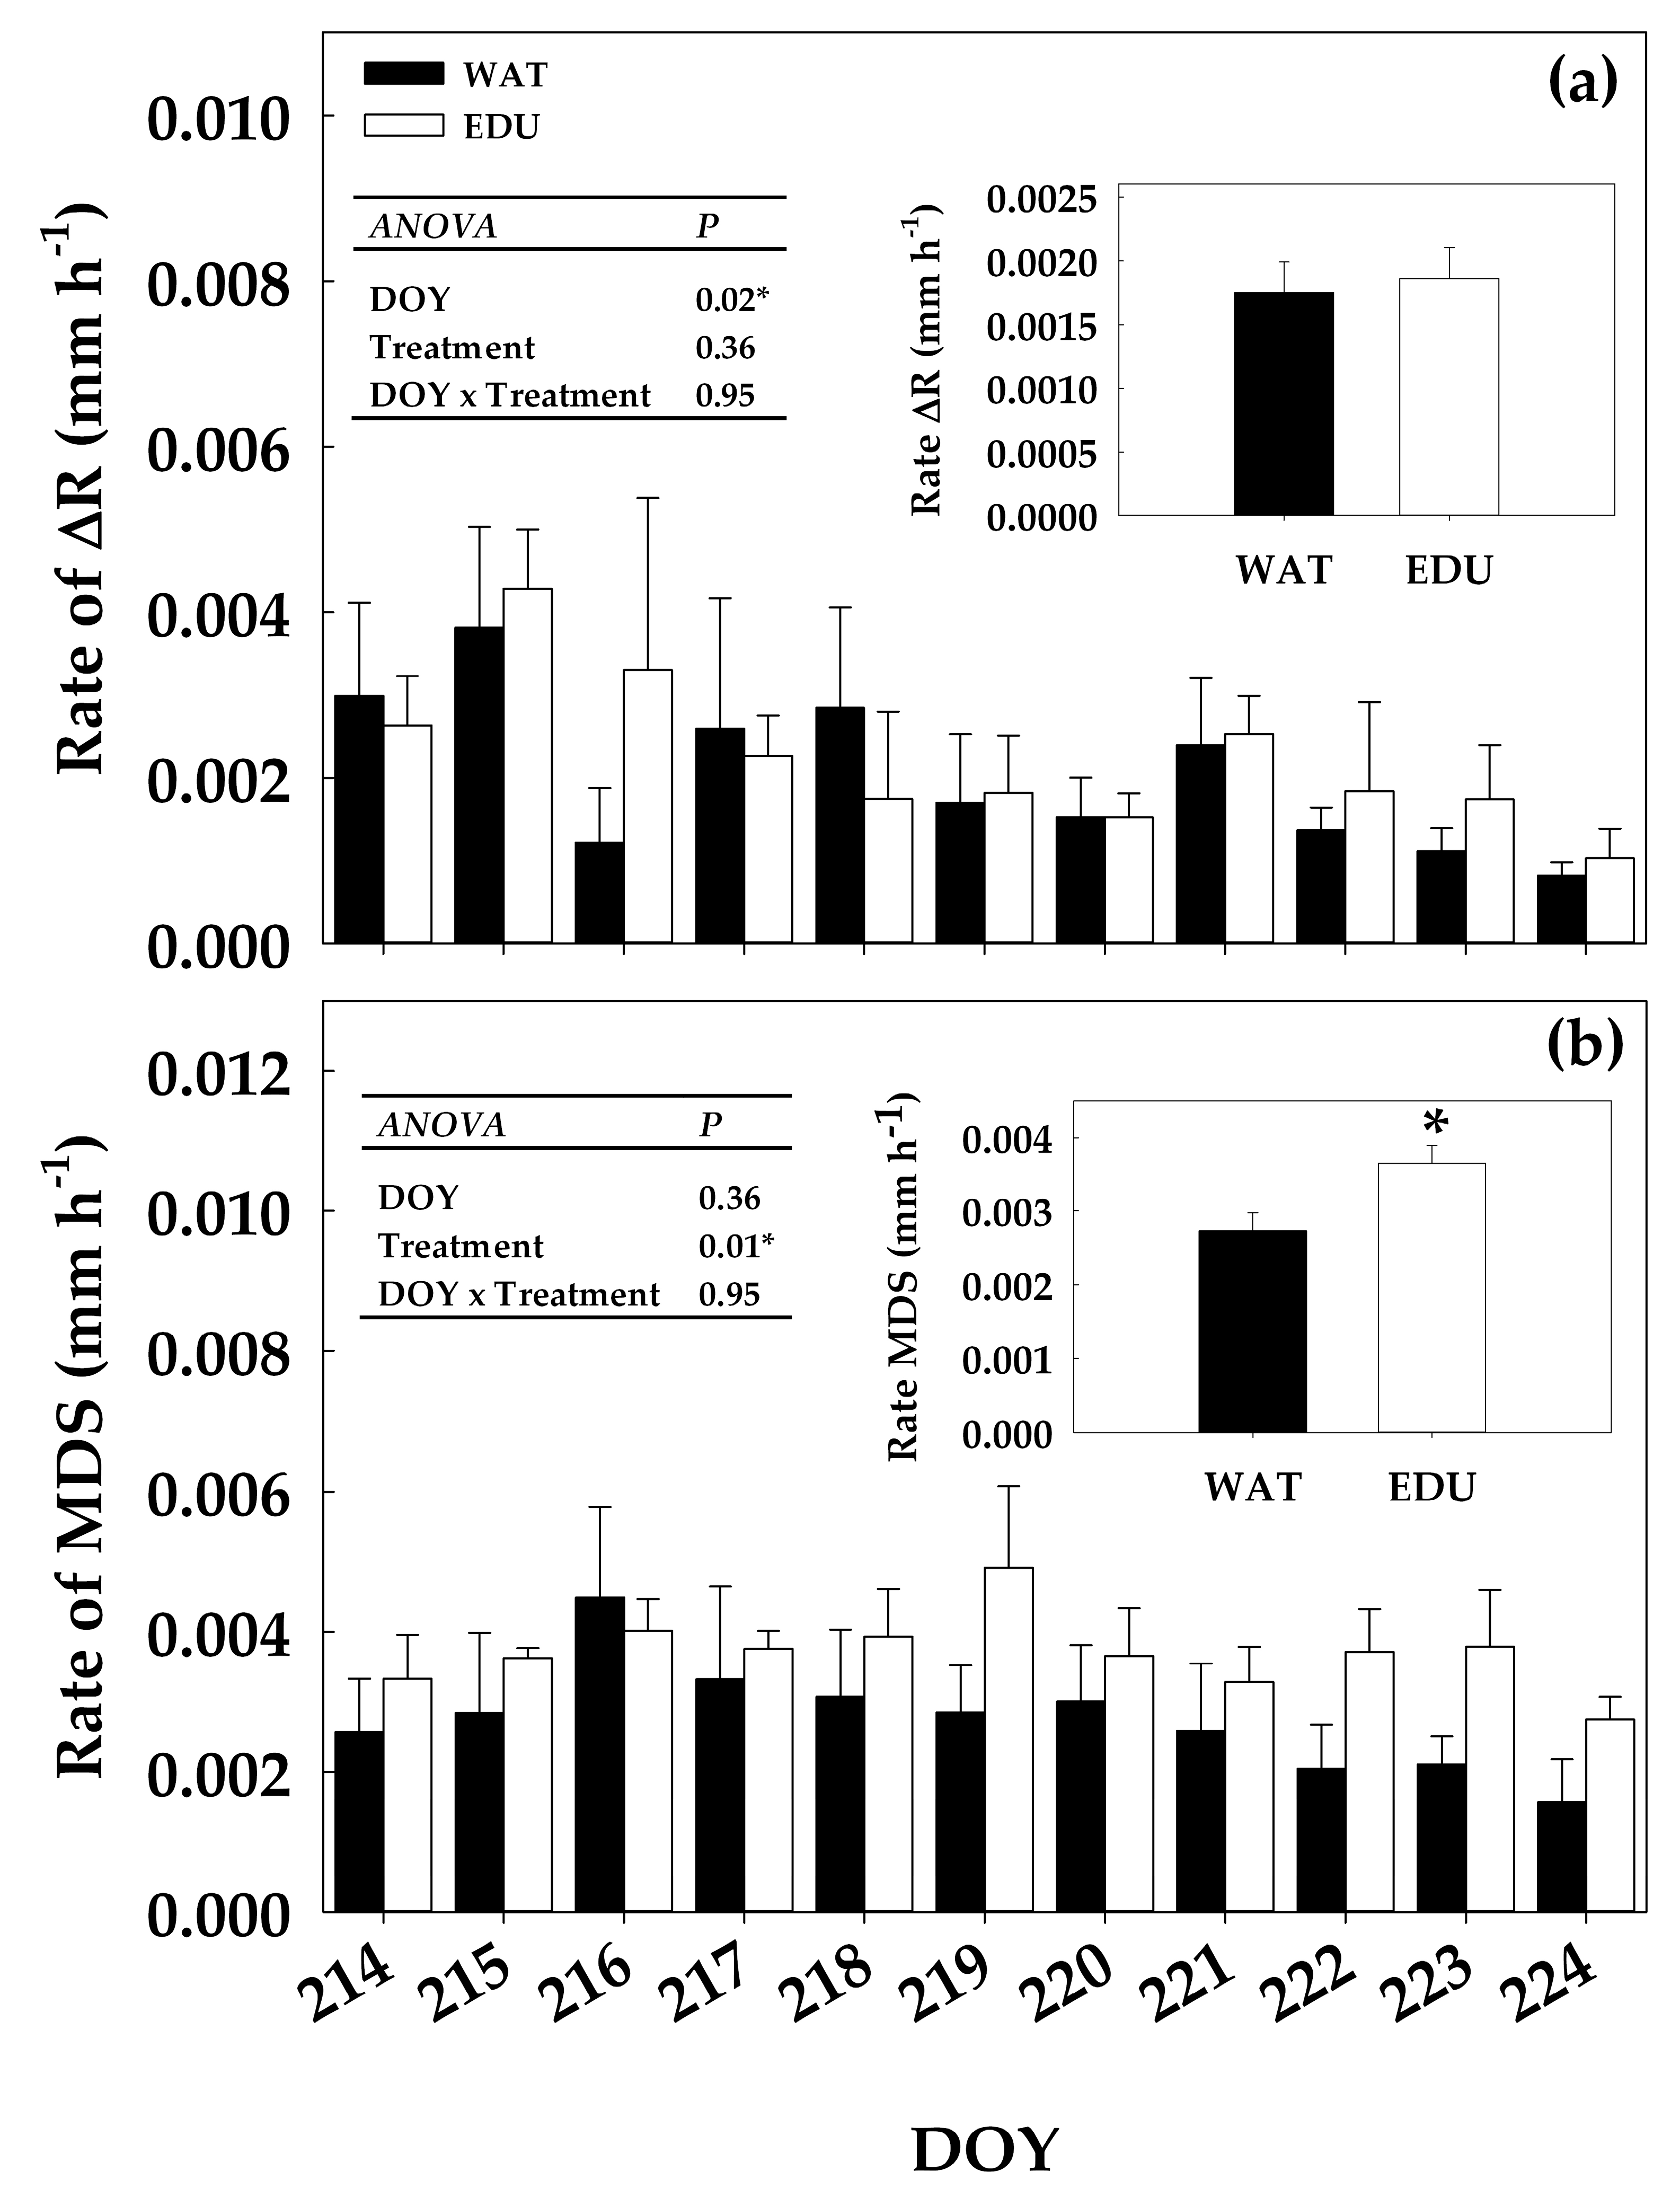
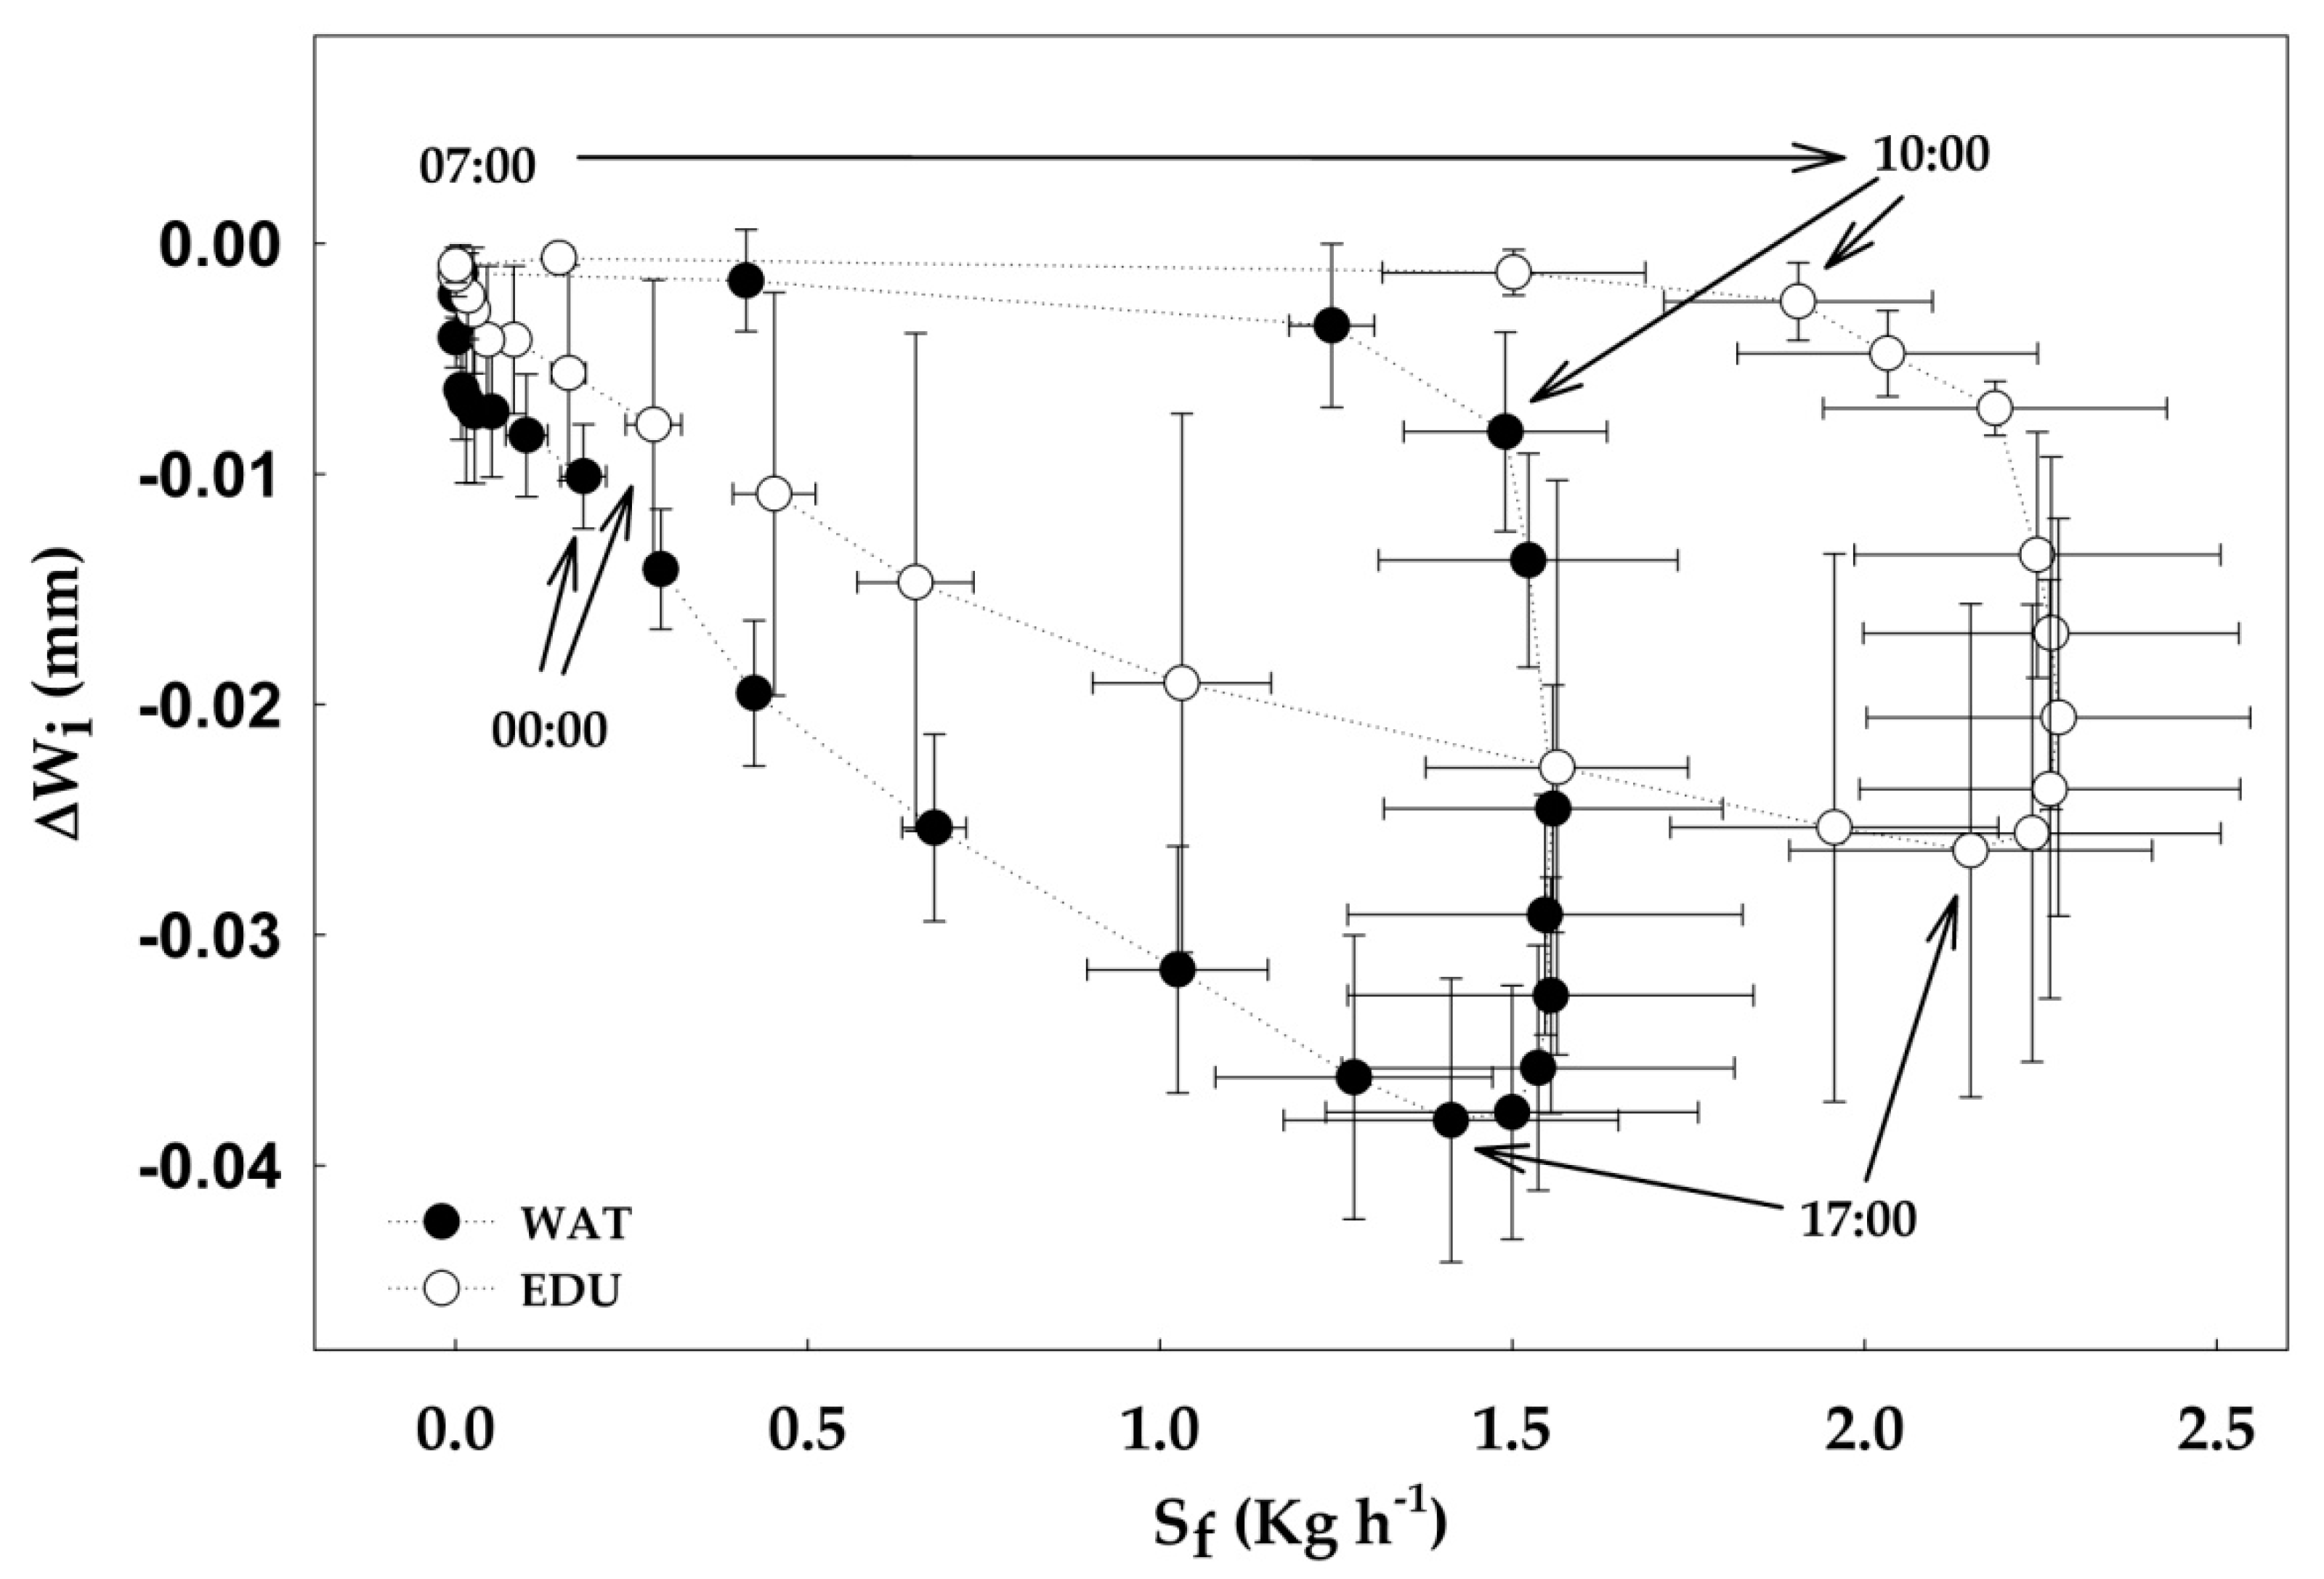
3.3. Effect of Short-term O3 Exposure under High Evaporative Demand on Radial Stem Growth, Stem Water Deficit and Sap Flow

From DOY 214 to DOY 224, under elevated daily M24 (>40 ppb) and high vapour pressure deficit (D>2 kPa), EDU trees showed a higher Sf than WAT ones (Figure 5).
During the mid-afternoon, the Sf of EDU trees was 35% higher than that of WAT trees. On average, we recorded 2.5 kg h−1 and 1.6 kg h−1 for EDU and WAT trees, respectively, except for DOY 220 and DOY 221 in which lowest values were recorded in both treatments as a result of a cloudy day (data not shown). The daily pattern of sap flow variations followed a bell-shaped curve both in WAT and in EDU trees (Figure 5, inset). Sf started to increase in the early morning, peaked at 11:00, remained constant until 19:00 and then gradually decreased after sunset. However, an analysis of the hourly Sf showed that EDU trees had an earlier activation of sap flux than WAT trees (between 08:00 and 09:00 for EDU trees and 09:00 and 10:00 for WAT, respectively).
The results of the stem cycle analyses allowed to highlight the response of WAT and EDU trees under high level of O3 concentration (Figure 6).
High ambient O3 concentration did not affect the rate of ΔR of trees (p = 0.35). The mean rate of ΔR were 0.00167 ± 0.00021 and 0.00183 ± 0.00019 mm h−1 for EDU and WAT trees, respectively (Figure 6a). However, the rate of ΔR significantly declined (p = 0.02) from DOY 215 (on average 0.004 mm h−1) to DOY 224 (<0.001 mm h−1) both in EDU and WAT trees. WAT trees exposed to high ambient O3 concentration had significantly lower rate of MDS than EDU trees (p = 0.01) (Figure 6b). From DOY 214 to DOY 224, the rate of MDS of WAT trees gradually decreased from 0.004 mm h−1 on DOY 215 to 0.0011 mm h−1 on DOY 224 whist it ranged from 0.005 mm h−1 (DOY 219) to 0.003 mm h−1 (DOY 224) for EDU trees.
The high level of ambient O3 concentration increased ΔWi and decreased Sf. The relationship between hourly data of ΔWi and Sf during the period of high O3 pollution (DOY 214–224) was represented by a hysteresis process (Figure 7).
On the basis of the daily pattern, three phases can be defined: a morning phase (MP, from 7:00 to 10:00) dominated by a rapid increase of sap flux occurring in absence of changes in the stem radius; a midday-early afternoon phase (MEP, from 11:00 to 17:00) characterized by a rapid increase of the rate of stem shrinkage (decrease of ΔWi, on average 3 mm h−1 vs. 5 mm h−1 for WAT and EDU trees, respectively) occurring in presence of constant high sap flow; a late afternoon–night time recovery phase (RP, from 18:00 to 5:00 of the following day) characterized by a slight decrease of sap flow and decrease of ΔWi. Thus, MP was mainly controlled by sap flow rate (higher in EDU than in WAT trees), MEP was regulated by the amplitude of ΔWi (higher in WAT than in EDU trees) whilst a linear relationship existed between Sf and ΔWi during RP. To assess differences in the RP between WAT and EDU trees, linear regression analyses based on a polynomial equation was found as best fitting model (R2 > 0.97). Under high O3 concentration the RP of the WAT trees was characterized by lower a coefficients (−0. 0232 vs. −0.0112 for a in WAT and EDU trees, respectively) (Table 3).

4. Discussion

4.1. Effect of Long-term O3 Exposure on Intra-annual Radial Stem Growth and Phenology

At the end of the growing season 2013, the stem basal area at breast height of WAT trees was on average 23% smaller than of EDU-protected trees. The long term ambient O3 exposure reduced the stem growth of the ‘Oxford’ poplar trees, confirming previous findings on breast-height diameter and above- and below-ground biomass production and allocation from the same experiment [20,50]. Other studies on mature trees showed a significant decrease of stem diameter in response to elevated ambient O3 in black cherry [65], yellow poplar [40], Populus tremula × alba (clone ‘INRA 717-1-B4’) [48]. However, long-term O3 fumigation of mature stands of Picea abies Karst. induced a 12% reduction of stem diameter at DBH which was compensated by a 69% increase of height growth, leading to a significant change in height-diameter allometry [9].
The culmination of stem radial growth (ti) of ‘Oxford’ poplar clone occurred early in the spring (on DOY 122 and DOY 144 for EDU and WAT trees, respectively) as already reported for other poplars, P. deltoides Marsch. and P. × canadensis Mönch. [62] where ti occurred 4–6 weeks after the onset of the cambium activity (DOY 90–100). Long-term O3 exposure affected the timing of ti, which was on average 20 days earlier in WAT trees than in EDU trees. The variation of ti represents an adaptive strategy in response to environment variability and has been widely reported for boreal species [63]. Through the shift of ti, the trees were able to synchronize the maximum growth with the most favorable environmental conditions. In cold environments, ti was correlated to warmer spring temperatures as in Picea abies [66] or synchronized with summer solstice as in many coniferous species [63]. On the contrary, in temperate forests, the timing and rate of radial growth seemed highly dependent on leaf phenology in mixed forest [67], e.g., the photosynthetic production of the new leaves in white birch [68], or related to the environmental condition of the previous year as reported in aspen [69]. In poplar, a wide portion of the current woody ring is produced before the complete leaf development, and the stem water content between late winter and early spring determines the rate and timing of cambium activation in the current year [62]. In one-year-old coppice of Populus × canadensis ‘I214’ and Populus deltoides Marsch., ‘Dvina’ the early clone had 22% higher stem water content than the late one at the time of cambium activity [62]. The reduced stem water content affected the time of cambial activation of Pinus halepensis Mill. and Picea mariana Mill. B.S.P. saplings [38,70], whilst in a coniferous mixed stand, the early development of tracheids in Pinus sylvestris L. was related to a higher stem water content than in Picea abies [71]. These results suggest that stem water reserves can regulate wood phenology. We thus conclude that the early ti recorded in WAT trees depended on the higher stem water content than in EDU trees at the beginning of cambium activity. In fact, our previous work on the same trees showed that the WAT trees had 16% higher wood moisture than EDU trees at the time of cambium reactivation [20]. The decrease of leaf area and transpiration under high O3 concentration during summer in WAT trees could have induced an early re-allocation of leaf water content toward stem storage compartments before Autumn. Thus, a high hydrostatic pressure was maintained in the cambium during late winter, and cell division and expansion occurred early. Although the WAT trees had an earlier ti than EDU trees, the value of k, i.e., the rate of change of the curve slope, did not differ between treatments, suggesting that WAT and EDU trees have had similar intra-annual growth patterns.

4.2. Effect of Long-term O3 Exposure on Sap Flow and Hydraulic Traits

Analysis of Sf seasonal time series in 2013 showed that after six years of exposure to ambient O3 the WAT trees displayed lower daily cumulative sap flow (i.e., lower water tree use) than EDU-protected ones. The distribution of the 25–75th quartiles of the daily Sf per tree over the season ranged between 12.7 and 22 kg d−1 for WAT and 13.1 and 28.4 kg d−1 for EDU trees and these values were comparable to those reported for P. trichocarpa × P. deltoides hybrids [72]. On the basis of these results, we accepted the hypothesis that the long-term ambient O3 exposure determined a lower sap flow of WAT trees. Our results did not confirm previous findings in which elevated O3 did not affect the sap flux per unit of ground area of two-year-old plants of Populus tremuloides Michx. and Betula papyrifera Marsh [73]. Similar results were reported for O3-tolerant clones of Betula pendula [74] and European beech [75]. On the contrary, four-year-old ash trees exposed to episodic elevated O3 concentration decreased the sap flow later in the season as result of an increased stomatal resistance as well as a change in leaf area due to early leaf shedding during late summer [76]. Previous results showed that whole-tree use efficiency was lower in WAT trees than in EDU trees, because carbon assimilation decreased more than water losses, while it was not affected by O3-induced stomatal sluggishness [21]. In contrast, stomatal sluggishness—i.e., longer time to respond to the closed signal and slower rate of closing—would be expected to increase water loss, but the effects over the growing season were compensated by lower stomatal conductance and premature leaf shedding [77]. In fact, leaf area of WAT trees was 64% lower than EDU ones after three years of ambient O3 exposure [15]. The reduced sap flow recorded in WAT trees could be the effect of the lower canopy transpiration surface rather than of a change in the wood hydraulic traits. Vessel density and Kst did not significantly change in WAT and EDU trees confirming that reduced sap flow of WAT trees was not related to a change of xylem traits. Kst is the main parameter describing hydraulic efficiency of the xylem and it is highly correlated to tree height, growth, xylem traits and transpiration [59]. In our experiment, we recorded values ranging from 2.2 to 2.5 kg s−1m−1MPa−1 in WAT and EDU trees, respectively, and these values were similar to those reported for five-year-old field growing poplar plants [78].
The reduction in total leaf area observed in the WAT trees during the previous experiments in the same plantation [20,21] resulted in an increased Hv (ratio of sapwood area: leaf area) of WAT trees. Huber value is a quantitative trait of the hydraulic architecture [79]. An increase of Hv was related to short-term drought response in Arundo donax L. [80], homeostasis in leaf water relations and gas exchanges in Eucaliptus kochii ssp borealis (C. Gardner) D. Nicolle [81] as well as long-term plant acclimation to chronic environmental stresses in Castanopsis acuminatissima (Bl) A. DC. [82]. Although Hv increased significantly in WAT trees, the values ranged from 1.2 to 1.5 × 10⁻⁴ in both treatments remaining within the range of variability reported for poplar [83]. It is postulated that an increase of Hv as result of decreased leaf area improves the stem capacity to transport water from the roots to the leaves [84] maintaining the same water use efficiency under environmental constrains. This is the first report of an increase of Hv under O3 stress; the same sapwood area supporting a lower total leaf area could represent an acclimation strategy to sustain the growth rate even under O3 stress. This hypothesis was partially confirmed both by the lack of significant differences of the seasonal sap flow pattern and radial growth rates between WAT and EDU trees during the entire 2013 growing season and by the contrasting daily stem water deficit pattern (ΔWi and MDS) in WAT and EDU trees during the time window with severe evaporative demand and high ambient O3 concentration.

4.3. Effect of Short-term O3 Exposure under High Evaporative Demand on Radial Stem Growth, Stem Water Deficit and Sap Flow

It was postulated that high levels of ambient O3 can increase water stress in trees through the increase of water loss during drought period following impaired stomatal control [40]. We were thus interested in understanding the dynamics of tree water use monitored by sap flow measurements and the variation in stem water content by dendrometers under high evaporative demand and high ambient O3 concentration. From DOY 214 to DOY 224, climatic conditions within the plantation were characterized by D > 2 kPa, daily maximum temperature >30°C, reduced precipitation and M24 >40ppb. In a recent paper [85], drought-sensitive poplar clones significantly decreased the transpiration rates at D values higher than 2 kPa. The high sensitivity to water deficit of ‘Oxford’ poplar clone [86] confirmed that the high evaporative demand observed during the time window selected for the analyses could be considered as limiting for the tree water use of our trees. The combination of high evaporative demand and elevated O3 concentration induced a reduction of MDS rate and hourly sap flow in WAT plants. The rate of MDS (the amplitude of the stem shrinkage over time) is considered the most suitable proxy of stem water status in poplar [54,87] and can be used to estimate the water radial flow within the stem [88]. Basically, daily stem radius fluctuations are determined by crown transpiration [46] and stem shrinkage mirrors the water loss occurring within storage compartments within the stem (bark and phloem) to support increased water demand due to the transpiration rate of the tree crown. The analyses of the amplitude and duration of the shrinkage phase allow to extrapolate information about the acclimation strategies of trees in response to a wide range of environmental constrains [33,36,89]. High O3 pollution combined with high evaporative demand induced a decrease of transpiration rate of WAT trees, as suggested by the reduced xylem sap fluxes, which in turn generated a consistent reduction of the radial water fluxes from stem water reserves (phloem and bark) toward the leaves, as suggested by the low MDS recorded in the WAT trees. This result supported the hypothesis that high O3 pollution can amplify the effect of water deficit in poplar trees.
The relationship between stem shrinkage and sap flow has been investigated in different woody species such as olive [90], yellow poplar [40] and Douglas fir [88], and the results showed that stem shrinkage and Sf were strictly connected to each other at daily level. The coupling of MDS and Sf was widely used to determine the effect of environmental constrains to plant water relations [91,92]. Thus, we hypothesized that the reduction of tree water use of WAT trees recorded under high O3 pollution could be explained by an altered pattern of Sf and ΔWi. Our results showed that at a daily level, the diurnal pattern of Sf and ΔWi generated a hysteresis process driven by sap flow and transpiration rate during the early morning, by stem shrinkage from late morning and mid-afternoon (depletion of stem water reserves) while a linear relationship existed between Sf and ΔWi during the night (refilling of the stem water reserves). The timing of MP showed that EDU trees had a faster increase of sap flux than WAT trees. The slow start of the sap fluxes in the morning in the WAT trees could be connected to the sluggish response of stomata to the environmental condition favorable to transpiration. These results showed that a large part of the daytime sap flux in WAT trees was supported by internal stem water resources, rather than by water uptake from the roots. Previous findings reported that stem water reserves were able to support from 8 to 20% of daily transpiration rates in mature trees [88]. Thus, WAT plants had a high use of the internal stem water resources (high ΔWi) thus predisposing them to a water deficit condition during summer. While stomatal sluggishness does not have a significant role over the entire growing season [21], it may help mobilizing the internal water resources during short periods of intense evaporative stress in O3-injured trees.

5. Conclusions

Taken together, our results showed that long-term O3 exposure of O3-sensitive poplar trees induced significant changes in stem radial growth and tree water use. For the first time we showed a direct effect of long-term O3 exposure on the culmination of stem radial growth and the crucial role of this pollutant in the modulation of phenology of secondary meristems. The decrease of sap flow was driven by a decrease in HV (less leaf area was supported per unit of stem basal area) rather than by adaptive changes in xylem traits, whilst the low use of internal water resources to support transpiration rates could be related to the sluggish response of stomata under O3. Our findings are crucial to increase the knowledge about the differential responses of tree organs to O3 and overall resource allocation at the whole-plant level under stress impact. Besides, our results warrant for more research on organ changes in carbon allocation and xylem features under future climate and O3 pollution.
Using high resolution point dendrometers and heat pulse technology with an ecophysiological approach, we were able to evaluate the whole tree response to multiple environmental constrains such as O3 and drought. The high resolution monitoring of the tree water status and growth under climate change and air pollution is considered a priority to improve the operational processing chain to integrate data and to scale up from tree to forest ecosystem level [93]. For example, the reduced evapotranspiration and growth of O3-sensitive species under high O3 level could alter the hydrological cycle of forest ecosystems, thus affecting ecosystem services such as water quantity and quality [94] as well as promoting the change of the specie composition of the forest communities, favoring the O3-toleant specie. Thus, our results could be useful for silviculture, ecology and management decision-making in forestry in a broader scale.

Supplementary Materials

The following are available online at https://www.mdpi.com/1999-4907/10/5/396/s1, Figure S1: Time series of hourly stem radius variation (a, ΔR ± SD) and instantaneous stem water deficit (b, ΔWi ± SD) during ten days of high evaporative demand and M24 > 40 ppb in WAT and EDU trees (N = 5 trees). Data of stem radius were set to 0 before the analyses. ΔWi was extracted by de-trending the daily time series of ΔR using a piecewise linear regression.

Author Contributions

Conceptualization, E.P.; methodology, E.P., S.F.; M.L.T. and M.A.; validation, E.P., A.G. and Y.H.; formal analysis, A.G.; investigation, Y.H., E.P., M.L.T. and M.A.; data analysis, A.G., M.L.T., M.A.; writing—original draft preparation, A.G.; writing—review and editing, A.G., E.P., Y.H., S.F.; visualization, A.G.; supervision, E.P.; project coordination, E.P.; funding acquisition, E.P.

Funding

This work was written with the support of the LIFE15 MOTTLES project ENV/IT/000183.

Acknowledgments

We would like to thank Giulia Carriero for assistance during field work.

Conflicts of Interest

The authors declare no conflict of interest.

References

  1. Paoletti, E. Ozone impacts on forests. CAB Rev. Perspect. Agric. Vet. Sci. Nutr. Resour. 2007, 2, 13. [Google Scholar] [CrossRef]
  2. Mills, G.; Pleijel, H.; Malley, C.; Sinha, B.; Cooper, O.; Schultz, M.; Neufeld, H.; Simpson, D.; Sharps, K.; Feng, Z.; et al. Tropospheric ozone assessment report: Present-day tropospheric ozone distribution and trends relevant to vegetation. Elementa-Sci. Anthrop. 2018, 6. [Google Scholar] [CrossRef]
  3. Pellegrini, E.; Hoshika, Y.; Dusart, N.; Cotrozzi, L.; Gérard, J.; Nali, C.; Vaultier, M.-N.; Jolivet, Y.; Lorenzini, G.; Paoletti, E. Antioxidative responses of three oak species under ozone and water stress conditions. Sci. Total Environ. 2019, 647, 390–399. [Google Scholar] [CrossRef]
  4. Zhang, L.; Hoshika, Y.; Carrari, E.; Cotrozzi, L.; Pellegrini, E.; Paoletti, E. Effects of nitrogen and phosphorus imbalance on photosynthetic traits of poplar Oxford clone under ozone pollution. J. Plant Res. 2018, 131, 915–924. [Google Scholar] [CrossRef]
  5. Zhang, L.; Xu, B.; Wu, T.; Wen, M.-X.; Fan, L.-X.; Feng, Z.-Z.; Paoletti, E. Transcriptomic analysis of Pak Choi under acute ozone exposure revealed regulatory mechanism against ozone stress. BMC Plant Boil. 2017, 17, 236. [Google Scholar] [CrossRef] [PubMed]
  6. Hoshika, Y.; Carrari, E.; Zhang, L.; Carriero, G.; Pignatelli, S.; Fasano, G.; Materassi, A.; Paoletti, E. Testing a ratio of photosynthesis to O3 uptake as an index for assessing O3-induced foliar visible injury in poplar trees. Environ. Sci. Pollut. R. 2018, 25, 8113–8124. [Google Scholar] [CrossRef] [PubMed]
  7. Li, P.; Feng, Z.; Catalayud, V.; Yuan, X.; Xu, Y.; Paoletti, E. A meta-analysis on growth, physiological, and biochemical responses of woody species to ground-level ozone highlights the role of plant functional types. Plant Cell Environ. 2017, 40, 2369–2380. [Google Scholar] [CrossRef]
  8. Manning, W.J. Establishing a cause and effect relationship for ambient ozone exposure and tree growth in the forest: Progress and an experimental approach. Environ. Pollut. 2005, 137, 443–454. [Google Scholar] [CrossRef]
  9. Pretzsch, H.; Dieler, J.; Matyssek, R.; Wipfler, P. Tree and stand growth of mature Norway spruce and European beech under long-term ozone fumigation. Environ. Pollut. 2010, 158, 1061–1070. [Google Scholar] [CrossRef] [PubMed]
  10. Talhelm, A.F.; Pregitzer, K.S.; Kubiske, M.E.; Zak, D.R.; Campany, C.E.; Burton, A.J.; Dickson, R.E.; Hendrey, G.R.; Isebrands, J.G.; Lewin, K.F.; et al. Elevated carbon dioxide and ozone alter productivity and ecosystem carbon content in northern temperate forests. Chang. Boil. 2014, 20, 2492–2504. [Google Scholar] [CrossRef] [PubMed] [Green Version]
  11. Matyssek, R.; Karnosky, D.; Wieser, G.; Percy, K.; Oksanen, E.; Grams, T.; Kubiske, M.; Hanke, D.; Pretzsch, H.; Grams, T. Advances in understanding ozone impact on forest trees: Messages from novel phytotron and free-air fumigation studies. Environ. Pollut. 2010, 158, 1990–2006. [Google Scholar] [CrossRef]
  12. Zak, D.R.; Pregitzer, K.S.; Kubiske, M.E.; Burton, A.J. Forest productivity under elevated CO2 and O3: positive feedbacks to soil N cycling sustain decade-long net primary productivity enhancement by CO2. Ecol. Lett. 2011, 14, 1220–1226. [Google Scholar] [CrossRef] [PubMed]
  13. Kubiske, M.E.; Quinn, V.S.; Marquardt, P.E.; Karnosky, D.F. Effects of Elevated Atmospheric CO2 and/or O3 on Intra- and Interspecific Competitive Ability of Aspen. Plant Boil. 2007, 9, 342–355. [Google Scholar] [CrossRef]
  14. Oksanen, E.; Riikonen, J.; Kaakinen, S.; Holopainen, T.; Vapaavuori, E. Structural characteristics and chemical composition of birch (Betula pendula) leaves are modified by increasing CO2 and ozone. Chang. Boil. 2005, 11, 732–748. [Google Scholar] [CrossRef]
  15. Hoshika, Y.; Pecori, F.; Conese, I.; Bardelli, T.; Marchi, E.; Manning, W.J.; Badea, O.; Paoletti, E. Effects of a three-year exposure to ambient ozone on biomass allocation in poplar using ethylenediurea. Environ. Pollut. 2013, 180, 299–303. [Google Scholar] [CrossRef] [PubMed]
  16. Paoletti, E.; Contran, N.; Manning, W.J.; Ferrara, A.M. Use of the antiozonant ethylenediurea (EDU) in Italy: Verification of the effects of ambient ozone on crop plants and trees and investigation of EDU’s mode of action. Environ. Pollut. 2009, 157, 1453–1460. [Google Scholar] [CrossRef] [PubMed]
  17. Agathokleous, E. Perspectives for elucidating the ethylenediurea (EDU) mode of action for protection against O3 phytotoxicity. Ecotoxicol. Environ. Saf. 2017, 142, 530–537. [Google Scholar] [CrossRef]
  18. Agathokleous, E.; Koike, T.; Watanabe, M.; Hoshika, Y.; Saitanis, C. Ethylenediurea (EDU), an effective phytoproctectant against O3 deleterious effects and a valuable research tool. J. Agric. Meteorol. 2015, 71, 185–195. [Google Scholar] [CrossRef]
  19. Agathokleous, E.; Paoletti, E.; Manning, W.J.; Kitao, M.; Saitanis, C.J.; Koike, T. High doses of ethylenediurea (EDU) as soil drenches did not increase leaf N content or cause phytotoxicity in willow grown in fertile soil. Ecotoxicol. Environ. Saf. 2018, 147, 574–584. [Google Scholar] [CrossRef]
  20. Carriero, G.; Emiliani, G.; Giovannelli, A.; Hoshika, Y.; Manning, W.; Traversi, M.; Paoletti, E. Effects of long-term ambient ozone exposure on biomass and wood traits in poplar treated with ethylenediurea (EDU). Environ. Pollut. 2015, 206, 575–581. [Google Scholar] [CrossRef]
  21. Hoshika, Y.; Omasa, K.; Paoletti, E. Whole-Tree Water Use Efficiency Is Decreased by Ambient Ozone and Not Affected by O3-Induced Stomatal Sluggishness. PLoS ONE 2012, 7, e39270. [Google Scholar] [CrossRef] [PubMed]
  22. Katanic, M.; Paoletti, E.; Orlovic, S.; Grebenc, T.; Kraigher, H. Mycorrhizal status of an ozone-sensitive poplar clone treated with the antiozonant ethylene diurea. Eur. J. Forest Res. 2014, 133, 735–743. [Google Scholar] [CrossRef]
  23. Bowman, D.M.; Brienen, R.J.; Gloor, E.; Phillips, O.L.; Prior, L.D. Detecting trends in tree growth: Not so simple. Trends Plant Sci. 2013, 18, 11–17. [Google Scholar] [CrossRef] [PubMed]
  24. Jyske, T.; Mäkinen, H.; Kalliokoski, T.; Nöjd, P. Intra-annual tracheid production of Norway spruce and Scots pine across a latitudinal gradient in Finland. Agric. Meteorol. 2014, 194, 241–254. [Google Scholar] [CrossRef]
  25. Cocozza, C.; Palombo, C.; Tognetti, R.; La Porta, N.; Anichini, M.; Giovannelli, A.; Emiliani, G. Monitoring intra-annual dynamics of wood formation with microcores and dendrometers in Picea abies at two different altitudes. Tree Physiol. 2016, 36, 832–846. [Google Scholar] [CrossRef] [Green Version]
  26. Zweifel, R.; Zimmermann, L.; Newbery, D.M. Modeling tree water deficit from microclimate: An approach to quantifying drought stress. Tree Physiol. 2005, 25, 147–156. [Google Scholar] [CrossRef]
  27. Cocozza, C.; Giovannelli, A.; Lasserre, B.; Cantini, C.; Lombardi, F.; Tognetti, R. A novel mathematical procedure to interpret the stem radius variation in olive trees. Agric. Meteorol. 2012, 161, 80–93. [Google Scholar] [CrossRef]
  28. Van Der Maaten, E.; Van Der Maaten-Theunissen, M.; Smiljanić, M.; Rossi, S.; Simard, S.; Wilmking, M.; DesLauriers, A.; Fonti, P.; Von Arx, G.; Bouriaud, O. dendrometeR: Analyzing the pulse of trees in R. Dendrochronologia 2016, 40, 12–16. [Google Scholar] [CrossRef]
  29. Rossi, S.; DesLauriers, A.; Morin, H. Application of the Gompertz equation for the study of xylem cell development. Dendrochronologia 2003, 21, 33–39. [Google Scholar] [CrossRef]
  30. Woo, S.Y.; Hinckley, T.M. The effects of ozone on growth and stomatal response in the F2 generation of hybrid poplar (Populus trichocarpa × Populus deltoides). Boil. Plant. 2005, 49, 395–404. [Google Scholar] [CrossRef]
  31. Zweifel, R.; Drew, D.M.; Schweingruber, F.; Downes, G.M. Xylem as the main origin of stem radius changes in Eucalyptus. Funct. Plant Boil. 2014, 41, 520–534. [Google Scholar] [CrossRef]
  32. DesLauriers, A.; Rossi, S.; Anfodillo, T. Dendrometer and intra-annual tree growth: What kind of information can be inferred? Dendrochronologia 2007, 25, 113–124. [Google Scholar] [CrossRef] [Green Version]
  33. Berta, M.; Giovannelli, A.; Sebastiani, F.; Camussi, A.; Racchi, M.L. Transcriptome changes in the cambial region of poplar (Populus alba L.) in response to water deficit. Plant Boil. 2010, 12, 341–354. [Google Scholar] [CrossRef]
  34. Zweifel, R.; Eugster, W.; Etzold, S.; Dobbertin, M.; Buchmann, N.; Hasler, R. Link between continuous stem radius changes and net ecosystem productivity of a subalpine Norway spruce forest in the Swiss Alps. New Phytol. 2010, 187, 819–830. [Google Scholar] [CrossRef] [Green Version]
  35. Traversari, S.; Francini, A.; Traversi, M.L.; Emiliani, G.; Sorce, C.; Sebastiani, L.; Giovannelli, A. Can sugar metabolism in the cambial region explain the water deficit tolerance in poplar? J. Exp. Bot. 2018, 69, 4083–4097. [Google Scholar] [CrossRef]
  36. Cocozza, C.; Lasserre, B.; Giovannelli, A.; Castro, G.; Fragnelli, G.; Tognetti, R. Low temperature induces different cold sensitivity in two poplar clones (Populus × canadensis Monch ’I-214’ and P. deltoides Marsh. ’Dvina’). J. Exp. Bot. 2009, 60, 3655–3664. [Google Scholar] [CrossRef] [PubMed]
  37. Drew, D.M.; Downes, G.M. The use of precision dendrometers in research on daily stem size and wood property variation: A review. Dendrochronologia 2009, 27, 159–172. [Google Scholar] [CrossRef]
  38. Balducci, L.; DesLauriers, A.; Giovannelli, A.; Rossi, S.; Rathgeber, C.B. Effects of temperature and water deficit on cambial activity and woody ring features in Picea mariana saplings. Tree Physiol. 2013, 33, 1006–1017. [Google Scholar] [CrossRef] [PubMed] [Green Version]
  39. DesLauriers, A.; Beaulieu, M.; Balducci, L.; Giovannelli, A.; Gagnon, M.J.; Rossi, S. Impact of warming and drought on carbon balance related to wood formation in black spruce. Ann. Bot. 2014, 114, 335–345. [Google Scholar] [CrossRef] [PubMed] [Green Version]
  40. McLaughlin, S.B.; Nosal, M.; Wullschleger, S.D.; Sun, G. Interactive effects of ozone and climate on tree growth and water use in a southern Appalachian forest in the USA. New Phytol. 2007, 174, 109–124. [Google Scholar] [CrossRef] [Green Version]
  41. McLaughlin, S.B.; Wullschleger, S.D.; Nosal, M.; Cate, T.M.; Perkins, T.D. Diurnal and seasonal changes in stem increment and water use by yellow poplar trees in response to environmental stress. Tree Physiol. 2003, 23, 1125–1136. [Google Scholar] [CrossRef] [PubMed] [Green Version]
  42. Smith, D.; Allen, S. Measurement of sap flow in plant stems. J. Exp. Bot. 1996, 47, 1833–1844. [Google Scholar] [CrossRef] [Green Version]
  43. Braun, S.; Schindler, C.; Leuzinger, S. Use of sap flow measurements to validate stomatal functions for mature beech (Fagus sylvatica) in view of ozone uptake calculations. Environ. Pollut. 2010, 158, 2954–2963. [Google Scholar] [CrossRef]
  44. Wieser, G.; Matyssek, R.; Köstner, B.; Oberhuber, W. Quantifying ozone uptake at the canopy level of spruce, pine and larch trees at the alpine timberline: An approach based on sap flow measurement. Environ. Pollut. 2003, 126, 5–8. [Google Scholar] [CrossRef]
  45. Wang, B.; Shugart, H.H.; Shuman, J.K.; Lerdau, M.T. Forests and ozone: Productivity, carbon storage and feedbacks. Sci. Rep. 2016, 6, 22133. [Google Scholar] [CrossRef]
  46. Zweifel, R.; Häsler, R. Dynamics of water storage in mature subalpine Picea abies: Temporal and spatial patterns of change in stem radius. Tree Physiol. 2001, 21, 561–569. [Google Scholar] [CrossRef] [PubMed]
  47. Sevanto, S.; Nikinmaa, E.; Riikonen, A.; Daley, M.; Pettijohn, J.C.; Mikkelsen, T.N.; Phillips, N.; Holbrook, N.M. Linking xylem diameter variations with sap flow measurements. Plant Soil 2008, 305, 77–90. [Google Scholar] [CrossRef]
  48. Richet, N.; Afif, D.; Huber, F.; Pollet, B.; Banvoy, J.; El Zein, R.; Lapierre, C.; Dizengremel, P.; Perré, P.; Cabané, M. Cellulose and lignin biosynthesis is altered by ozone in wood of hybrid poplar (Populus tremula × alba). J. Exp. Bot. 2011, 62, 3575–3586. [Google Scholar] [CrossRef] [PubMed]
  49. Kostiainen, K.; Jalkanen, H.; Kaakinen, S.; Saranpää, P.; Vapaavuori, E. Wood properties of two silver birch clones exposed to elevated CO2 and O3. Chang. Boil. 2006, 12, 1230–1240. [Google Scholar] [CrossRef]
  50. Hoshika, Y.; Katata, G.; Deushi, M.; Watanabe, M.; Koike, T.; Paoletti, E. Ozone-induced stomatal sluggishness changes carbon and water balance of temperate deciduous forests. Sci. Rep. 2015, 5, 9871. [Google Scholar] [CrossRef] [Green Version]
  51. Goff, J.A.; Gratch, S. Low-pressure Properties of water from −160 to 212 F. In Proceedings of the 52nd Annual Meeting of the American Society of Heating and Ventilating Engineers, New York, NY, USA, 10–13 June 1946; pp. 95–122. [Google Scholar]
  52. UNECE-ICP-Forest. Manual on Methods and Criteria for Harmonized Sampling, Assessment, Monitoring and Analysis of the Effects of Air Pollution on Forest. Part II Visual Assessment of Frown Condition; UNECE-ICP-Forest: Hamburg, Germany, 2010. [Google Scholar]
  53. Hoshika, Y.; Moura, B.; Paoletti, E. Ozone risk assessment in three oak species as affected by soil water availability. Environ. Sci. Pollut. R. 2018, 25, 8125–8136. [Google Scholar] [CrossRef] [PubMed]
  54. Giovannelli, A.; Deslauriers, A.; Fragnelli, G.; Scaletti, L.; Castro, G.; Rossi, S.; Crivellaro, A. Evaluation of drought response of two poplar clones (Populus x canadensis Monch ’I-214’ and P. deltoides Marsh. ’Dvina’) through high resolution analysis of stem growth. J. Exp. Bot. 2007, 58, 2673–2683. [Google Scholar] [CrossRef] [PubMed]
  55. Cocozza, C.; Tognetti, R.; Giovannelli, A. High-Resolution Analytical Approach to Describe the Sensitivity of Tree–Environment Dependences through Stem Radial Variation. Forests 2018, 9, 134. [Google Scholar] [CrossRef]
  56. Granier, A. A new method of sap flow measurement in tree stems. Ann. Des. Sci. For. 1985, 42, 193–200. [Google Scholar] [CrossRef]
  57. Tyree, M.T.; Ewers, F.W. The hydraulic architecture of trees and other woody plants. New Phytol. 1991, 119, 345–360. [Google Scholar] [CrossRef] [Green Version]
  58. Sperry, J.S.; Saliendra, N.Z. Intra- and inter-plant variation in xylem cavitation in Betula occidentalis. Plant Cell Environ. 1994, 17, 1233–1241. [Google Scholar] [CrossRef]
  59. Tyree, M.T.; Zimmermann, M.H.; Tyree, P.M.T. Xylem Structure and the Ascent of Sap; Springer: New York, NK, USA, 2002. [Google Scholar]
  60. Santiago, L.; Machado, K.; Woodruff, D.; Meinzer, F.; Santiago, L.S.; Goldstein, G.; Fisher, J.B.; Jones, T. Leaf photosynthetic traits scale with hydraulic conductivity and wood density in Panamanian forest canopy trees. Oecologia 2004, 140, 543–550. [Google Scholar] [CrossRef] [PubMed] [Green Version]
  61. DesLauriers, A.; Giovannelli, A.; Rossi, S.; Castro, G.; Fragnelli, G.; Traversi, L. Intra-annual cambial activity and carbon availability in stem of poplar. Tree Physiol. 2009, 29, 1223–1235. [Google Scholar] [CrossRef] [PubMed] [Green Version]
  62. Bouriaud, O.; Deleuze, C.; Leban, J.-M.; Bert, D. Intra-annual variations in climate influence growth and wood density of Norway spruce. Tree Physiol. 2005, 25, 651–660. [Google Scholar] [CrossRef] [Green Version]
  63. Rossi, S.; DesLauriers, A.; Anfodillo, T.; Morin, H.; Saracino, A.; Motta, R.; Borghetti, M. Conifers in cold environments synchronize maximum growth rate of tree-ring formation with day length. New Phytol. 2006, 170, 301–310. [Google Scholar] [CrossRef] [Green Version]
  64. DesLauriers, A.; Urbinati, C.; Carrer, M.; Morin, H. Daily weather response of balsam fir (Abies balsamea (L.) Mill.) stem radius increment from dendrometer analysis in the boreal forests of Québec (Canada). Trees 2003, 17, 477–484. [Google Scholar] [CrossRef]
  65. Vollenweider, P.; Woodcock, H.; Kelty, M.; Hofer, R.-M. Reduction of stem growth and site dependency of leaf injury in Massachusetts black cherries exhibiting ozone symptoms. Environ. Pollut. 2003, 125, 467–480. [Google Scholar] [CrossRef]
  66. Mäkinen, H.; Nöjd, P.; Kahle, H.-P.; Neumann, U.; Tveite, B.; Mielikäinen, K.; Röhle, H.; Spiecker, H. Radial growth variation of Norway spruce (Picea abies (L.) Karst.) across latitudinal and altitudinal gradients in central and northern Europe. Ecol. Manag. 2002, 171, 243–259. [Google Scholar] [CrossRef]
  67. Michelot, A.; Simard, S.; Rathgeber, C.; Dufrêne, E.; Damesin, C. Comparing the intra-annual wood formation of three European species (Fagus sylvatica, Quercus petraea and Pinus sylvestris) as related to leaf phenology and non-structural carbohydrate dynamics. Tree Physiol. 2012, 32, 1033–1045. [Google Scholar] [CrossRef] [PubMed] [Green Version]
  68. Huang, J.; Tardif, J.C.; Bergeron, Y.; Denneler, B.; Berninger, F.; Girardin, M.P. Radial growth response of four dominant boreal tree species to climate along a latitudinal gradient in the eastern Canadian boreal forest. Chang. Boil. 2010, 16, 711–731. [Google Scholar] [CrossRef]
  69. Zhai, L.; Bergeron, Y.; Huang, J.-G.; Berninger, F. Variation in intra-annual wood formation, and foliage and shoot development of three major Canadian boreal tree species. Am. J. Bot. 2012, 99, 827–837. [Google Scholar] [CrossRef] [Green Version]
  70. De Luis, M.; Novak, K.; Raventós, J.; Gričar, J.; Prislan, P.; Čufar, K. Cambial activity, wood formation and sapling survival of Pinus halepensis exposed to different irrigation regimes. Ecol. Manag. 2011, 262, 1630–1638. [Google Scholar] [CrossRef]
  71. Oberhuber, W. Soil water availability and evaporative demand affect seasonal growth dynamics and use of stored water in co-occurring saplings and mature conifers under drought. Trees 2017, 31, 467–478. [Google Scholar] [CrossRef]
  72. Hinckley, T.M.; Brooks, J.R.; Čermák, J.; Ceulemans, R.; Kučera, J.; Meinzer, F.; Roberts, D.A. Water flux in a hybrid poplar stand. Tree Physiol. 1994, 14, 1005–1018. [Google Scholar] [CrossRef]
  73. Uddling, J.; Teclaw, R.M.; Kubiske, M.E.; Pregitzer, K.S.; Ellsworth, D.S. Sap flux in pure aspen and mixed aspen-birch forests exposed to elevated concentrations of carbon dioxide and ozone. Tree Physiol. 2008, 28, 1231–1243. [Google Scholar] [CrossRef] [Green Version]
  74. Pääkkönen, E.; Váhala, J.; Holopainen, T.; Karjalainen, R.; Kärenlampi, L. Growth responses and related biochemical and ultrastructural changes of the photosynthetic apparatus in birch (Betula pendula) saplings exposed to low concentrations of ozone. Tree Physiol. 1996, 16, 597–605. [Google Scholar] [CrossRef] [PubMed] [Green Version]
  75. Matyssek, R.; Bytnerowicz, A.; Karlsson, P.-E.; Paoletti, E.; Sanz, M.; Schaub, M.; Wieser, G. Promoting the O3 flux concept for European forest trees. Environ. Pollut. 2007, 146, 587–607. [Google Scholar] [CrossRef] [PubMed]
  76. Wiltshire, J.; Unsworth, M.H.; Wright, C.J. Seasonal changes in water use of ash trees exposed to ozone episodes. New Phytol. 1994, 127, 349–354. [Google Scholar] [CrossRef] [Green Version]
  77. Hoshika, Y.; Carriero, G.; Feng, Z.; Zhang, Y.; Paoletti, E. Determinants of stomatal sluggishness in ozone-exposed deciduous tree species. Sci. Total Environ. 2014, 481, 453–458. [Google Scholar] [CrossRef] [PubMed] [Green Version]
  78. Hajek, P.; Leuschner, C.; Hertel, D.; Delzon, S.; Schuldt, B. Trade-offs between xylem hydraulic properties, wood anatomy and yield in Populus. Tree Physiol. 2014, 34, 744–756. [Google Scholar] [CrossRef] [Green Version]
  79. Cruiziat, P.; Cochard, H.; Améglio, T. Hydraulic architecture of trees: main concepts and results. Ann. Sci. 2002, 59, 723–752. [Google Scholar] [CrossRef] [Green Version]
  80. Haworth, M.; Centritto, M.; Giovannelli, A.; Marino, G.; Proietti, N.; Capitani, D.; De Carlo, A.; Loreto, F. Xylem morphology determines the drought response of two Arundo donax ecotypes from contrasting habitats. GCB Bioenergy 2017, 9, 119–131. [Google Scholar] [CrossRef]
  81. Carter, J.L.; White, D.A. Plasticity in the Huber value contributes to homeostasis in leaf water relations of a mallee Eucalypt with variation to groundwater depth. Tree Physiol. 2009, 29, 1407–1418. [Google Scholar] [CrossRef] [Green Version]
  82. Schuldt, B.; Leuschner, C.; Horna, V.; Moser, G.; Kohler, M.; Van Straaten, O.; Barus, H. Change in hydraulic properties and leaf traits in a tall rainforest tree species subjected to long-term throughfall exclusion in the perhumid tropics. Biogeosciences 2011, 8, 2179–2194. [Google Scholar] [CrossRef]
  83. Kern, K.A.; Ewers, F.W.; Telewski, F.W.; Koehler, L. Mechanical perturbation affects conductivity, mechanical properties and aboveground biomass of hybrid poplars. Tree Physiol. 2005, 25, 1243–1251. [Google Scholar] [CrossRef] [Green Version]
  84. Magnani, F.; Grace, J.; Borghetti, M. Adjustment of tree structure in response to the environment under hydraulic constraints. Funct. Ecol. 2002, 16, 385–393. [Google Scholar] [CrossRef] [Green Version]
  85. Devi, M.J.; Reddy, V.R. Transpiration Response of Cotton to Vapor Pressure Deficit and Its Relationship With Stomatal Traits. Front. Plant Sci. 2018, 9, 1572. [Google Scholar] [CrossRef] [PubMed]
  86. Pollastrini, M.; Desotgiu, R.; Camin, F.; Ziller, L.; Gerosa, G.; Marzuoli, R.; Bussotti, F. Severe drought events increase the sensitivity to ozone on poplar clones. Environ. Exp. Bot. 2014, 100, 94–104. [Google Scholar] [CrossRef]
  87. Bloemen, J.; Fichot, R.; Horemans, J.; Broeckx, L.; Verlinden, M.; Zenone, T.; Ceulemans, R. Water use of a multigenotype poplar short-rotation coppice from tree to stand scale. GCB Bioenergy 2017, 9, 370–384. [Google Scholar] [CrossRef]
  88. Čermák, J.; Kučera, J.; Bauerle, W.L.; Phillips, N.; Hinckley, T.M. Tree water storage and its diurnal dynamics related to sap flow and changes in stem volume in old-growth Douglas-fir trees. Tree Physiol. 2007, 27, 181–198. [Google Scholar] [CrossRef] [Green Version]
  89. Balducci, L.; Cuny, H.E.; Rathgeber, C.B.K.; DesLauriers, A.; Giovannelli, A.; Rossi, S. Compensatory mechanisms mitigate the effect of warming and drought on wood formation. Plant Cell Environ. 2016, 39, 1338–1352. [Google Scholar] [CrossRef] [PubMed] [Green Version]
  90. Cocozza, C.; Marino, G.; Giovannelli, A.; Cantini, C.; Centritto, M.; Tognetti, R. Simultaneous measurements of stem radius variation and sap flux density reveal synchronisation of water storage and transpiration dynamics in olive trees. Ecohydrology 2015, 8, 33–45. [Google Scholar] [CrossRef]
  91. Intrigliolo, D.S.; Castel, J.R. Crop load affects maximum daily trunk shrinkage of plum trees. Tree Physiol. 2007, 27, 89–96. [Google Scholar] [CrossRef] [PubMed] [Green Version]
  92. Steppe, K.; Cochard, H.; Lacointe, A.; Ameglio, T. Could rapid diameter changes be facilitated by a variable hydraulic conductance? Plant Cell Environ. 2012, 35, 150–157. [Google Scholar] [CrossRef]
  93. Verstraeten, W.W.; Veroustraete, F.; Feyen, J. Estimating evapotranspiration of European forests from NOAA-imagery at satellite overpass time: Towards an operational processing chain for integrated optical and thermal sensor data products. Remote Sens. Environ. 2005, 96, 256–276. [Google Scholar] [CrossRef]
  94. Serengil, Y.; Augustaitis, A.; Bytnerowicz, A.; Grulke, N.; Kozovitz, A.R.; Matyssek, R.; Müller-Starck, G.; Schaub, M.; Wieser, G.; Coskun, A.A.; Paoletti, E. Adaptation of forest ecosystems to air pollution and climate change: A global assessment on research priorities. iForest 2010, 4, 44–48. [Google Scholar] [CrossRef]
Figure 1. Time course of meteorological parameters from DOY 90 to DOY 256 at the experimental site: (a) daily minimum, mean and maximum air temperature; (b) daily rainfall and vapour pressure deficit (D); (c) 24-h daily average (M24) of hourly O3 concentration. The horizontal line represents the threshold value of 40 ppb M24.
Forests 10 00396 g001
Figure 2. Mean stem basal area increment (±SD) recorded at the harvest for WAT (water treated trees) and EDU (EDU treated trees) (N = 5). Difference between stem sapwood of 2013 and 2012 represented the stem basal increment for each tree. Significant mean differences were recorded by t-test.
Forests 10 00396 g002
Figure 3. Modelling of the stem radial increase obtained by fitting the Gompertz equation of WAT (water treated, black line) and EDU (EDU treated, gray line) trees. Each point represents the average of maximum values of stem radius over a five-day period (ΔR pentad) calculated for WAT (white dot) and O3-protected EDU trees (black dot). Solid line represents the Gompertz fitting calculated on the mean pentad values of four plants (N = 5).
Forests 10 00396 g003
Figure 4. Time course of sap flow (±SD) during the growing season 2013 (N = 5 trees). The inset shows the box-plot representing the range of daily sap flow in WAT (water treated) and O3-protected EDU (EDU treated) trees. The box shows the distribution of the 25–75% quartiles, the median is represented by a horizontal line within the box, vertical bars indicate minimum/maximum values and circles symbolize outlying data points. p-value was based on the Mann-Whitney test.
Forests 10 00396 g004
Figure 5. Time series of hourly sap flow (±SD) from DOY 214 to DOY 224 in WAT (water treated) and EDU (EDU treated) trees (N = 5 trees). The inset shows the mean hourly sap flow, Sf, (±SD) calculated over this 10-day time window. The black horizontal line represents the significant differences between means for p < 0.05 (t-test).
Forests 10 00396 g005
Figure 6. Rate of ΔR (Rate of stem increment), ((a), ±SD) and rate of MDS (rate of maximum daily shrinkage), ((b), ±SD) for WAT (water treated) and EDU (EDU treated) trees from DOY 214 to DOY 224. The bars represent the mean of five trees. Data were analyzed with two-way analysis of variance (ANOVA) and the results were reported in the inset table. The inset graphic represents the mean of rate of ΔR and rate of MDS calculated on 10 days (N = 5). Asterisks indicate significant differences between treatments (p < 0.05).
Forests 10 00396 g006
Figure 7. Daily course of changes in ΔWi, stem water deficit, (±SD) and Sf, sap flow, (±SD) in WAT (water treated) and EDU (EDU treated) trees, from DOY 214 to DOY 224 (N = 5 trees). Arrows indicates the hour of the day (00:00, 07:00, 10:00, 17:00). From 07:00 to 10:00, morning phase (MP); from 11:00 to 17:00, midday-early afternoon phase (MEP); from 18:00 to 06:00, recovery phase (RP).
Forests 10 00396 g007
Table 1. Comparison between parameters of Gompertz function for WAT (water treated) and EDU (EDU treated) trees. ti, inflection point; k, rate of change of curve and time; R2, coefficient of determination.
TreatmentParameters
ti (DOY)k (10−2)R2
EDU144.1 ± 6.8 0.025 ± 0.0050.99
WAT122.4 ± 4.10.032 ± 0.0070.97
t-test (p-value)0.00020.11
Table 2. Mean values (±SD) of xylem morphology and hydraulic traits in WAT (water treated) and EDU (EDU treated) trees. Vd: vessel density, dm: average vessel diameters, DH: hydraulic diameter, Kst: theorical hydraulic conductivity, HV: Huber value.
TreatmentXylem Morphology Hydraulic Traits
Vd
(n mm−2)
dm
(µm)
DH
(µm)
Kst
(kg s−1m−1MPa−1)
Hv
(10−4)
WAT90.5 ± 6.326.3 ± 2.538.6 ± 3.32.2 ± 0.71.2 ± 0.3
EDU90.6 ± 4.328.0 ± 1.937.6 ± 2.72.5 ± 0.61.5 ± 0.2
t-test
(p-value)
0.980.310.670.450.02*
*: Significant for p ≤ 0.05.
Table 3. Results of the polynomial equation (f = y0 + ax) to the RP (recovery phase) extracted from daily course of sap flow (Sf, independent variable) plotted against changes in stem water deficit (ΔWi) in WAT (water treated) and EDU (EDU treated) trees (±SE, N = 5 trees). f, polynomial function; y0, y-value for x = 0; a, slope.
F = y0 + axy0aR2
WAT−0.0062 ± 0.0007−0.0232 ± 0.0010.988
EDU−0.0037 ± 0.0008−0.0112 ± 0.00070.975

