Longleaf Pine Patch Dynamics Influence Ground-Layer Vegetation in Old-Growth Pine Savanna


Abstract
:1. Introduction
2. Materials and Methods
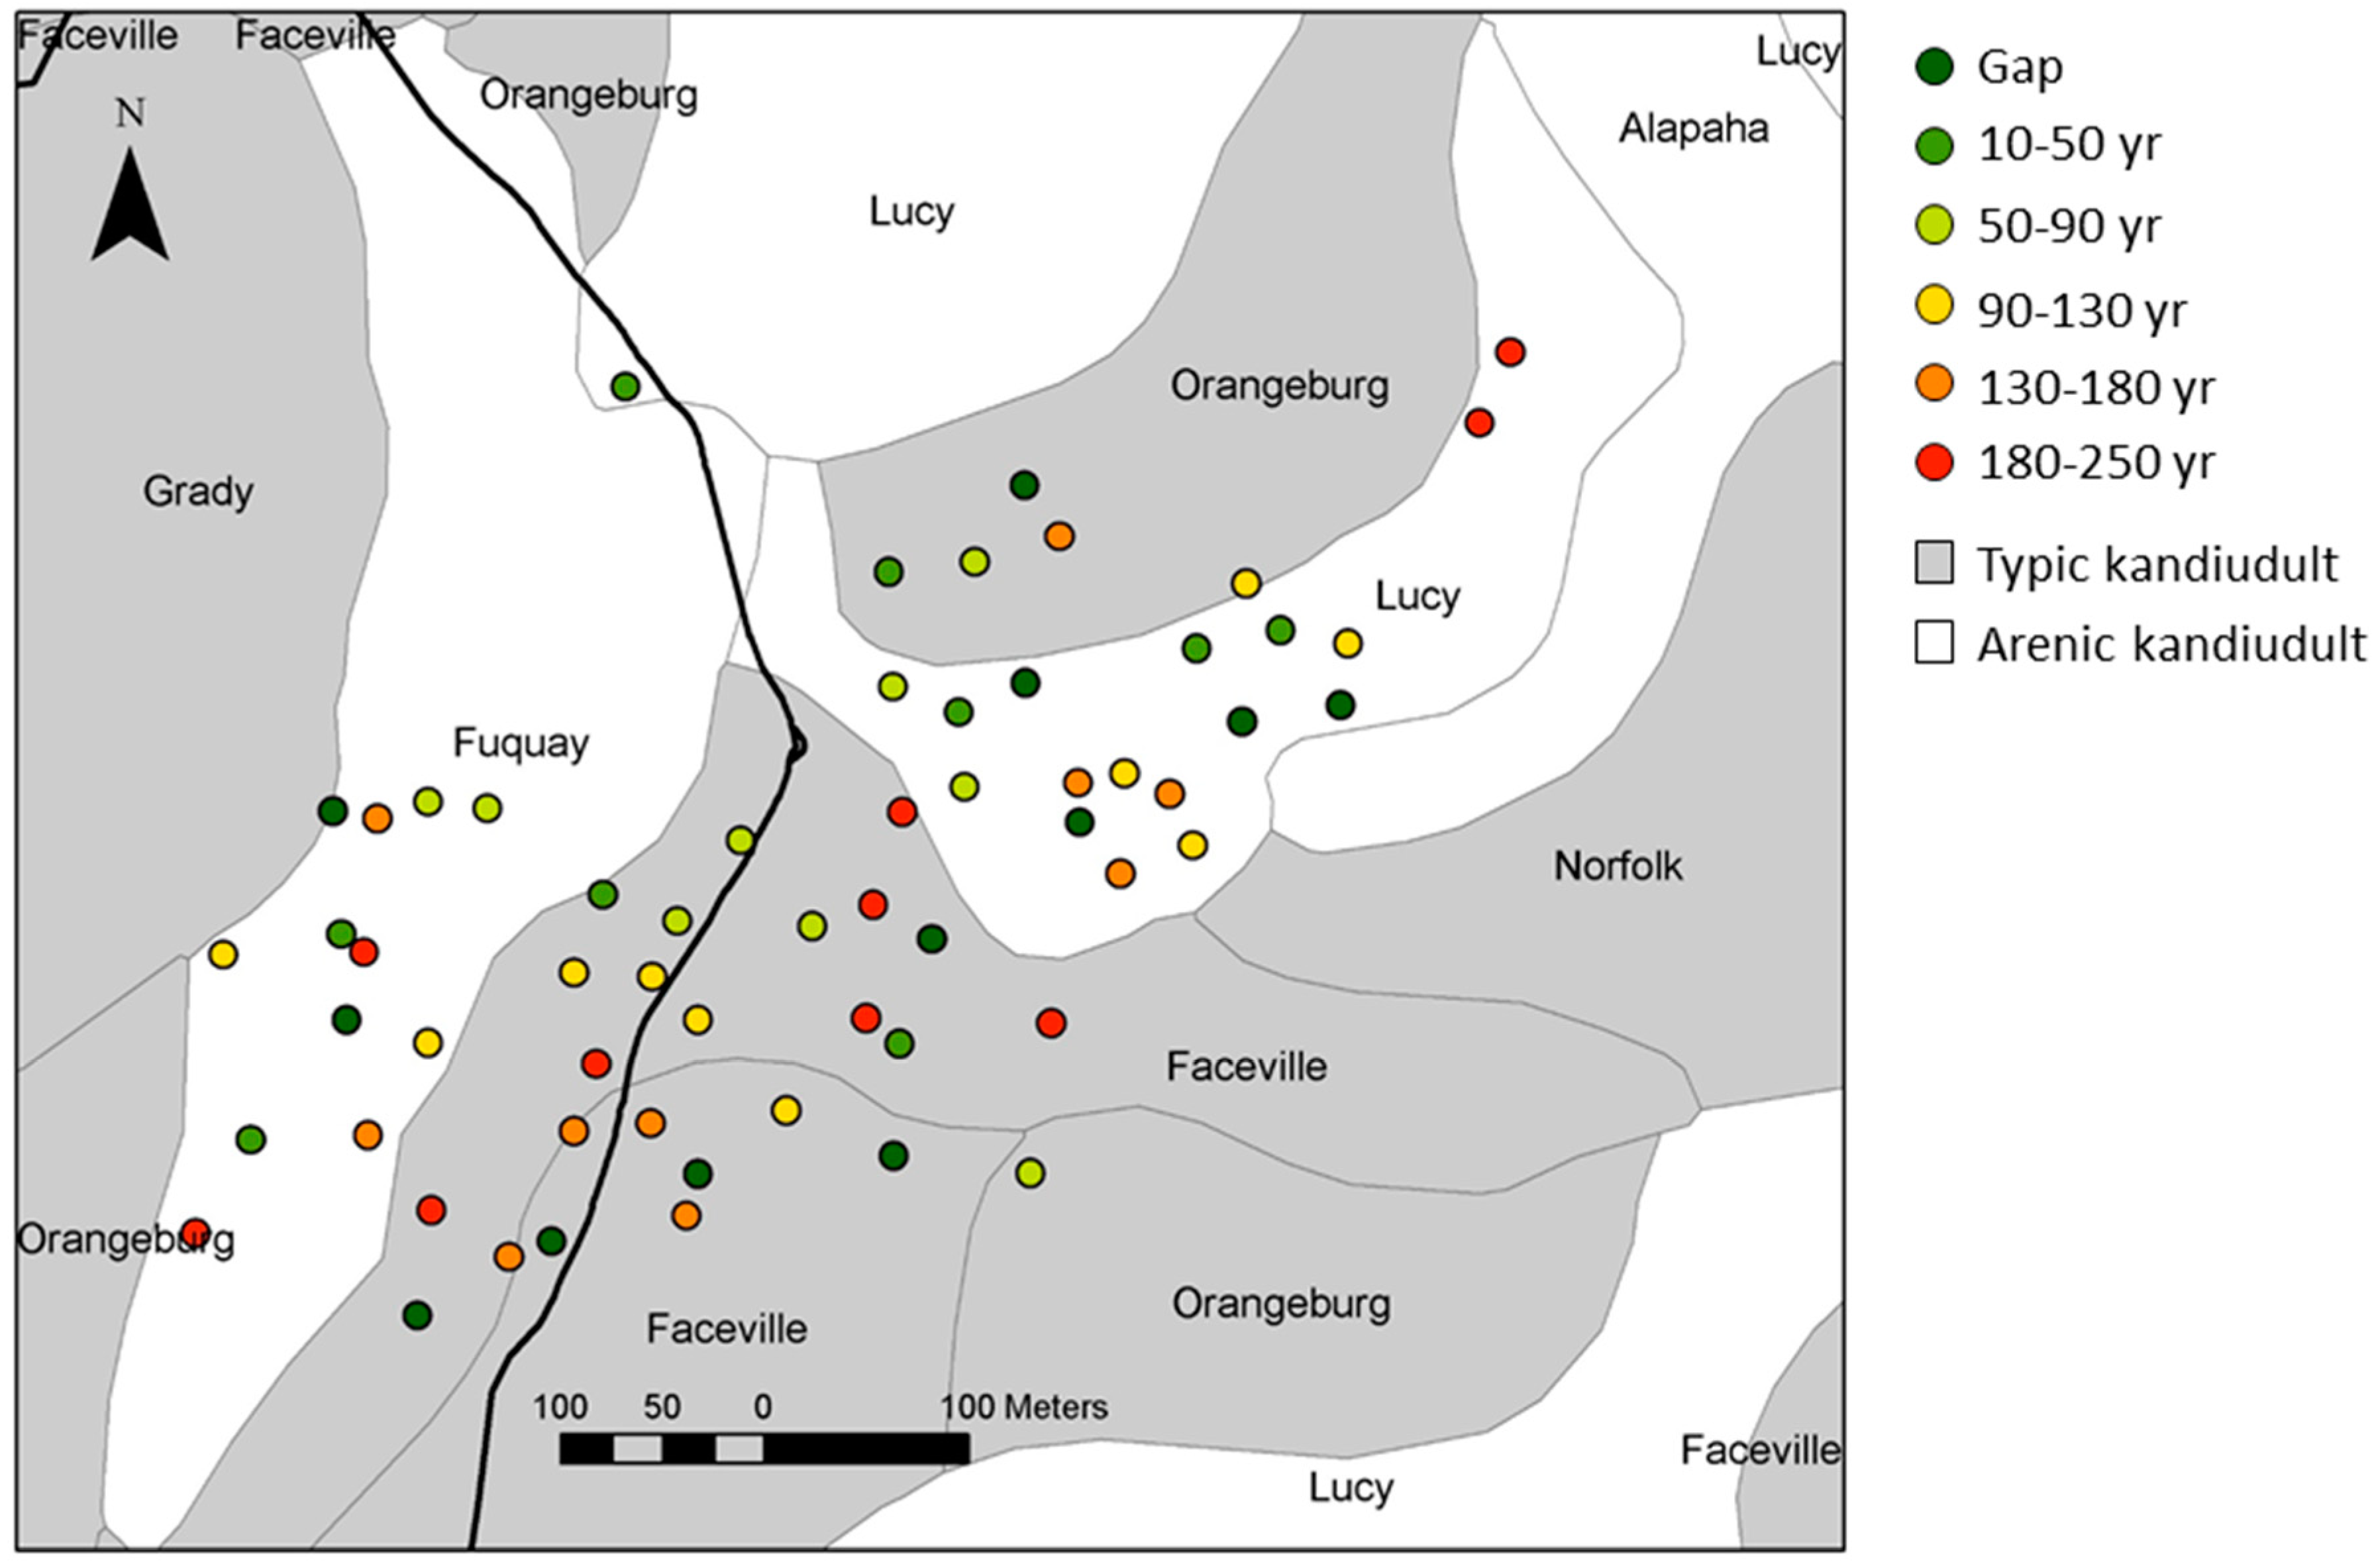
2.1. Study Area and Patches of Longleaf Pine
2.2. Ground-Layer Vegetation
2.3. Fire Behavior and Fuel Loads
2.4. Canopy Structure
2.5. Soil Characteristics
2.6. Data Analyses
3. Results
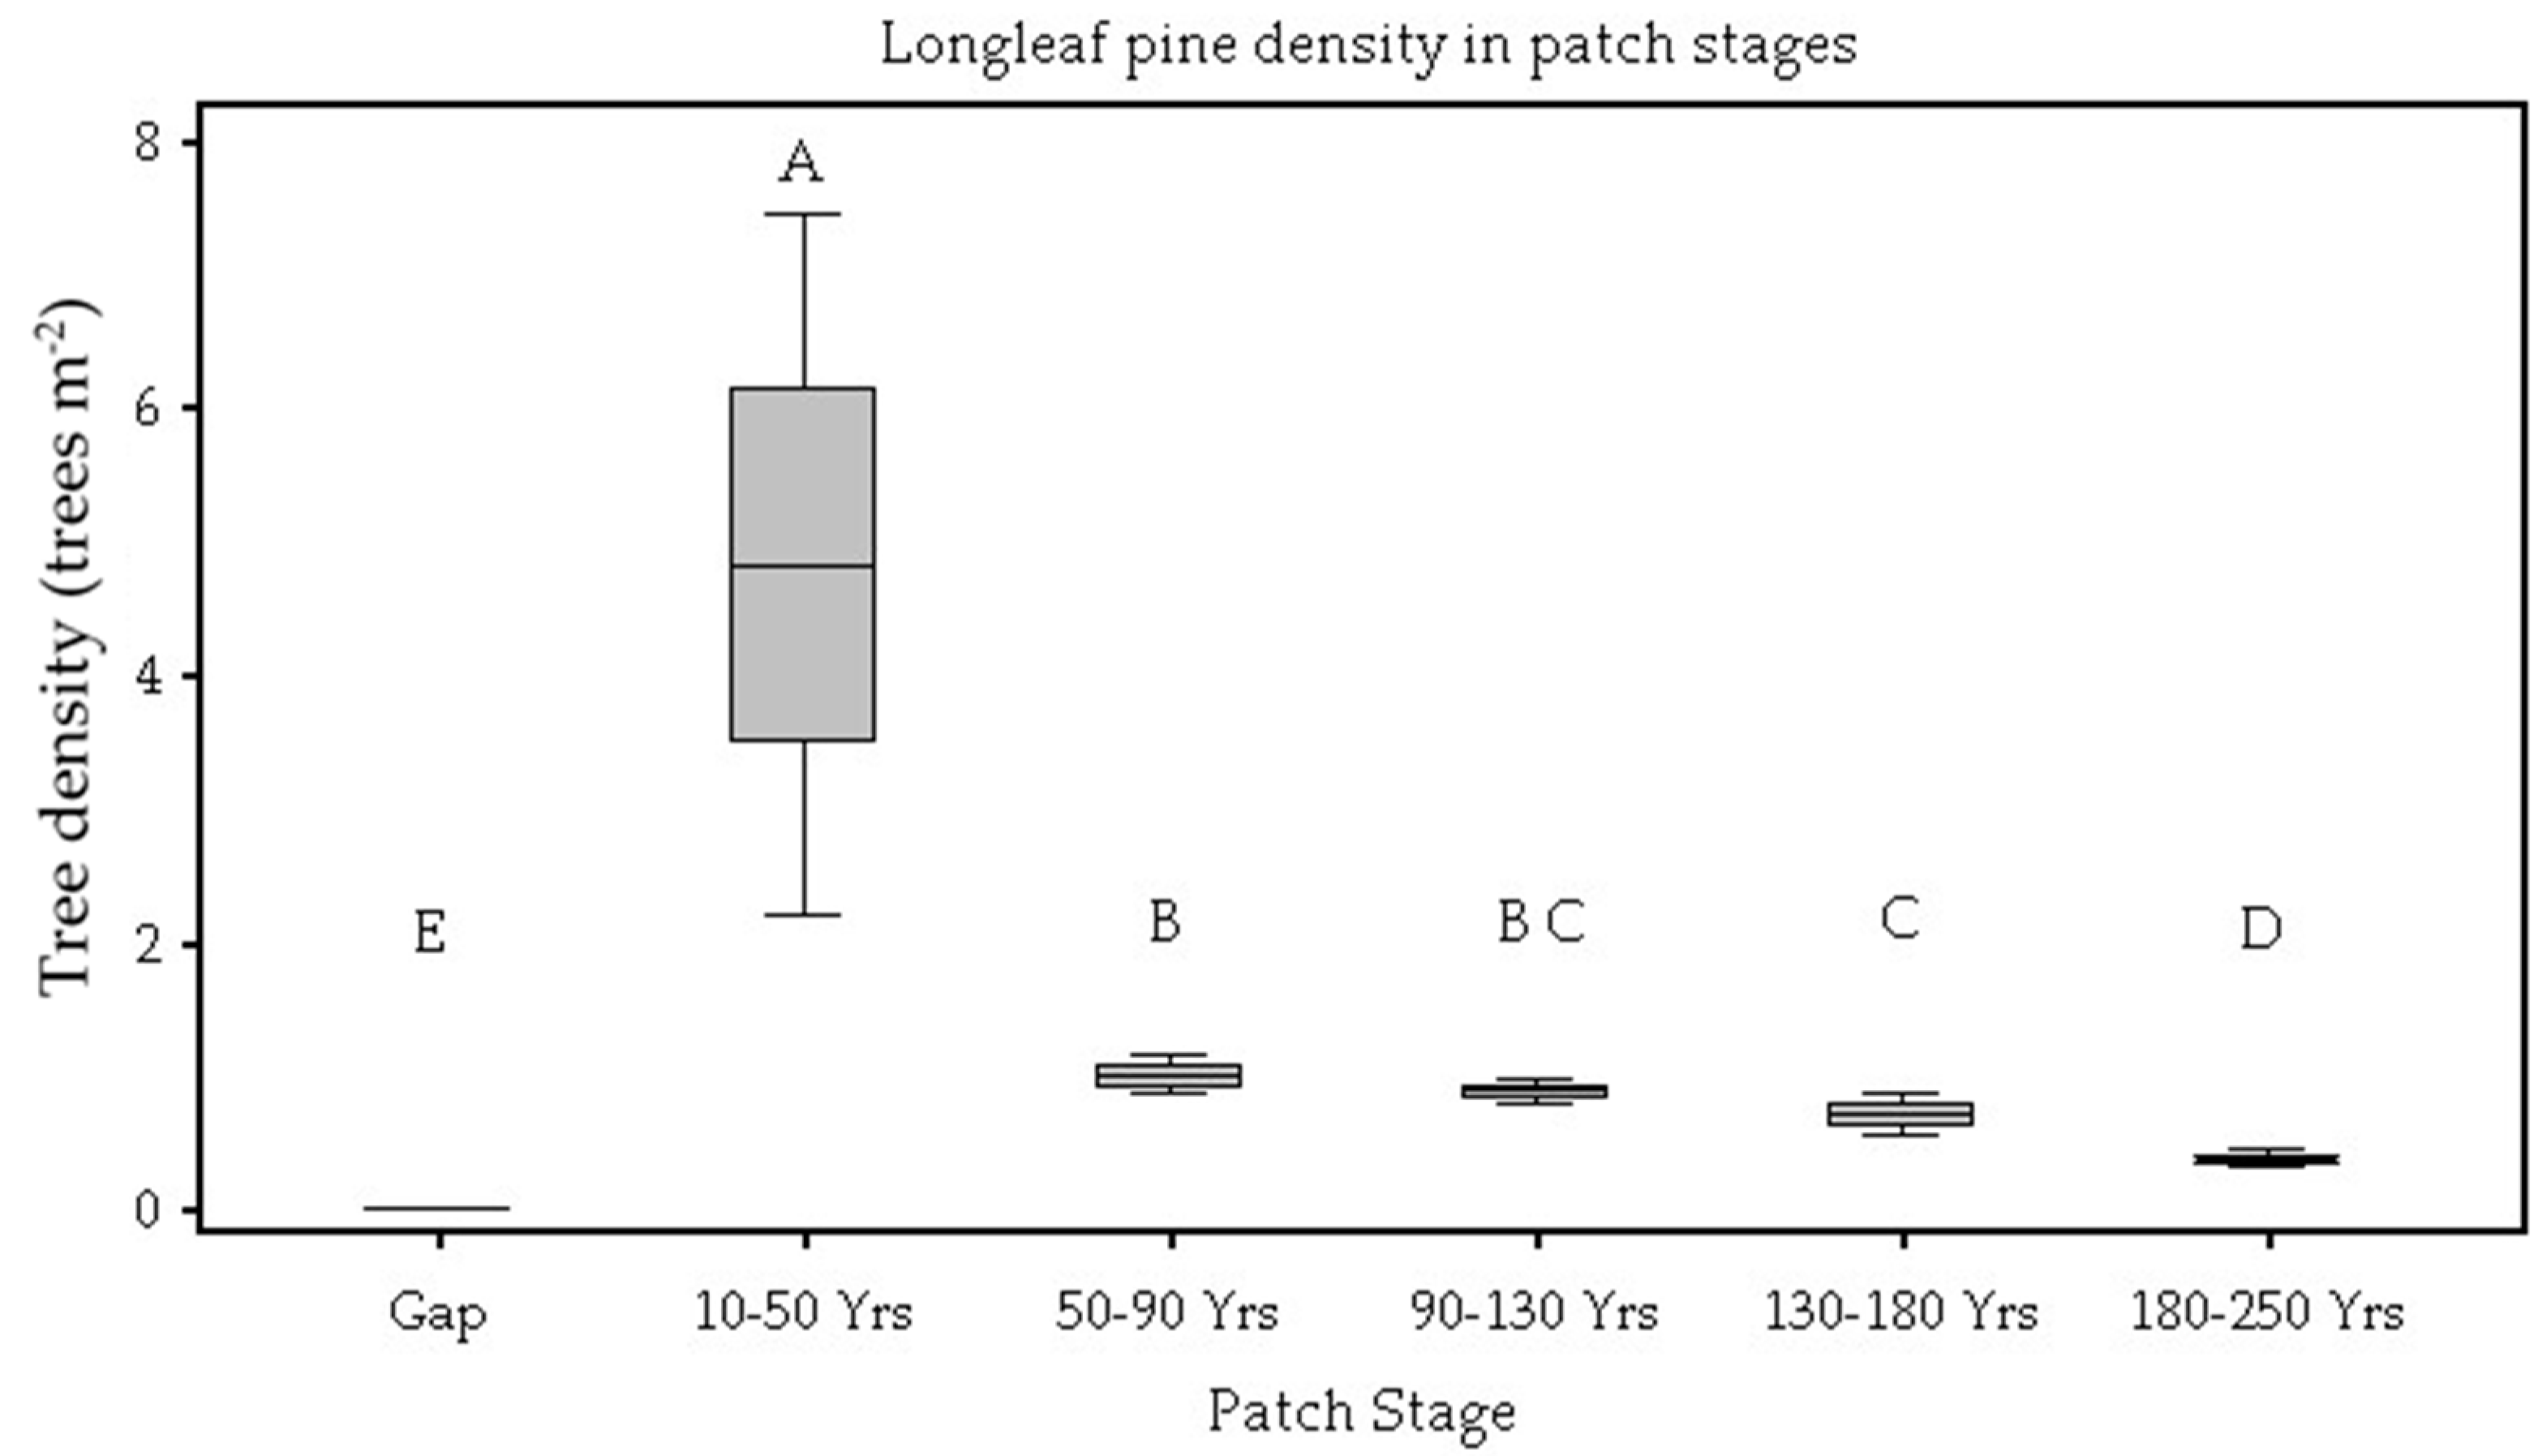
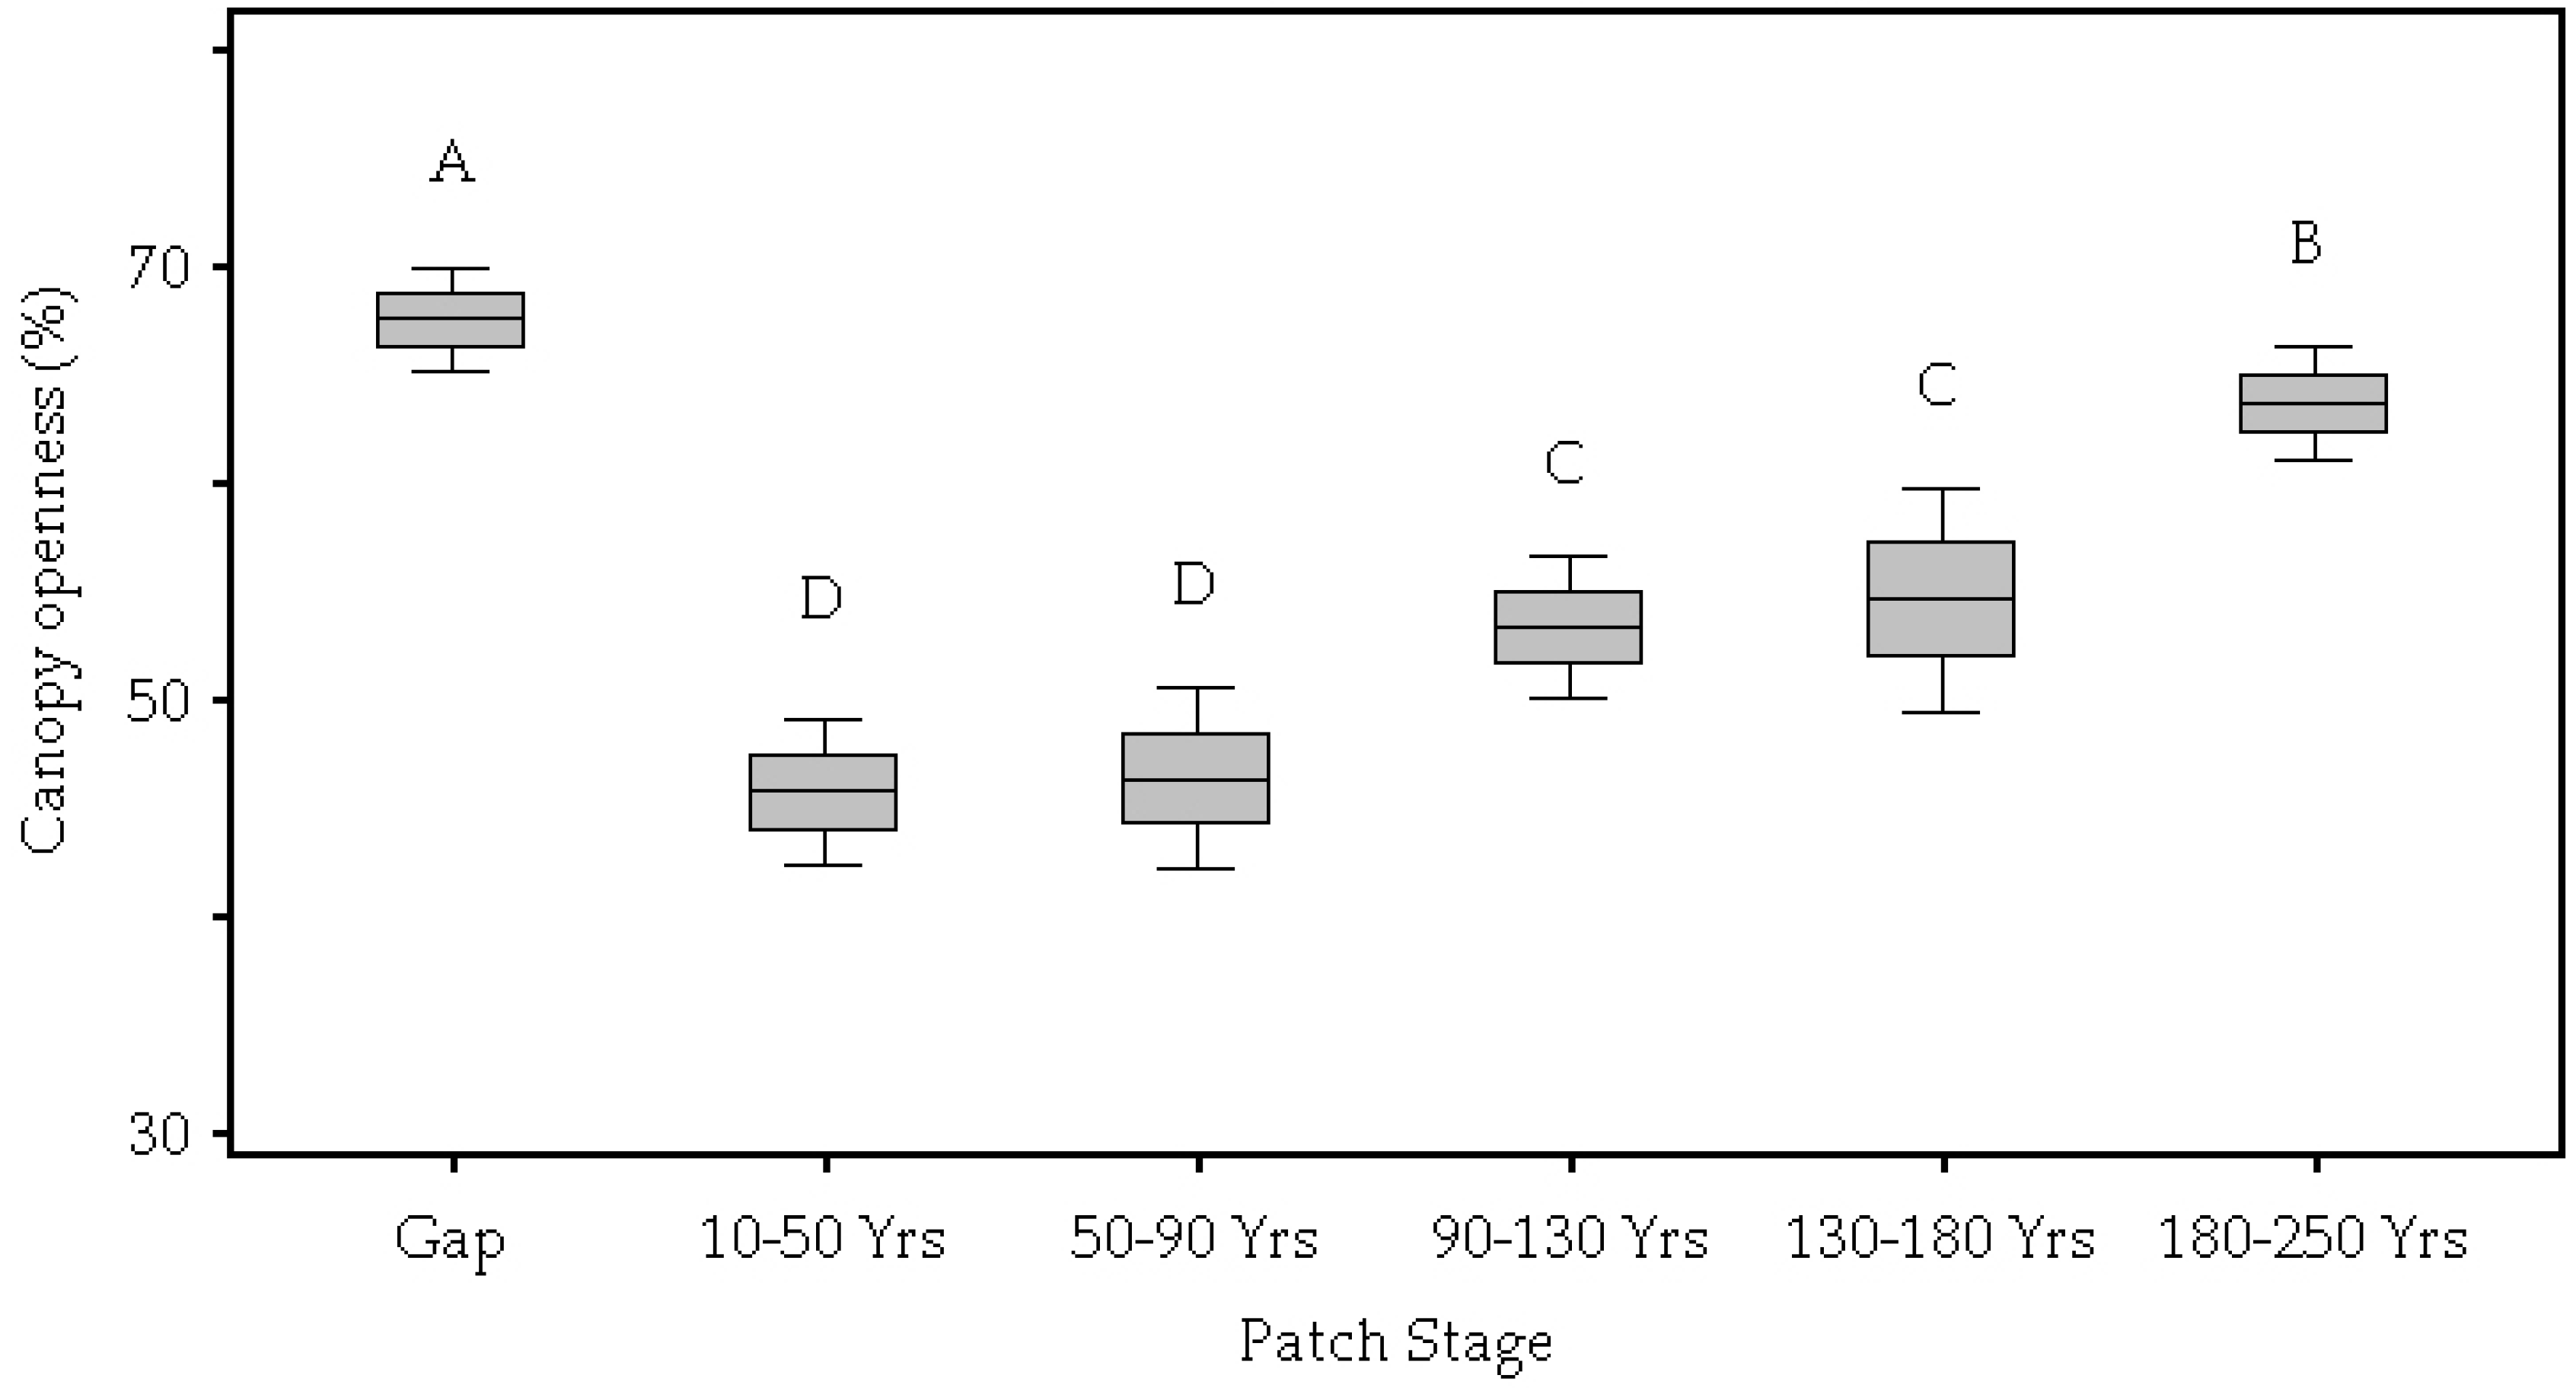
3.1. Patch Environmental Characteristics
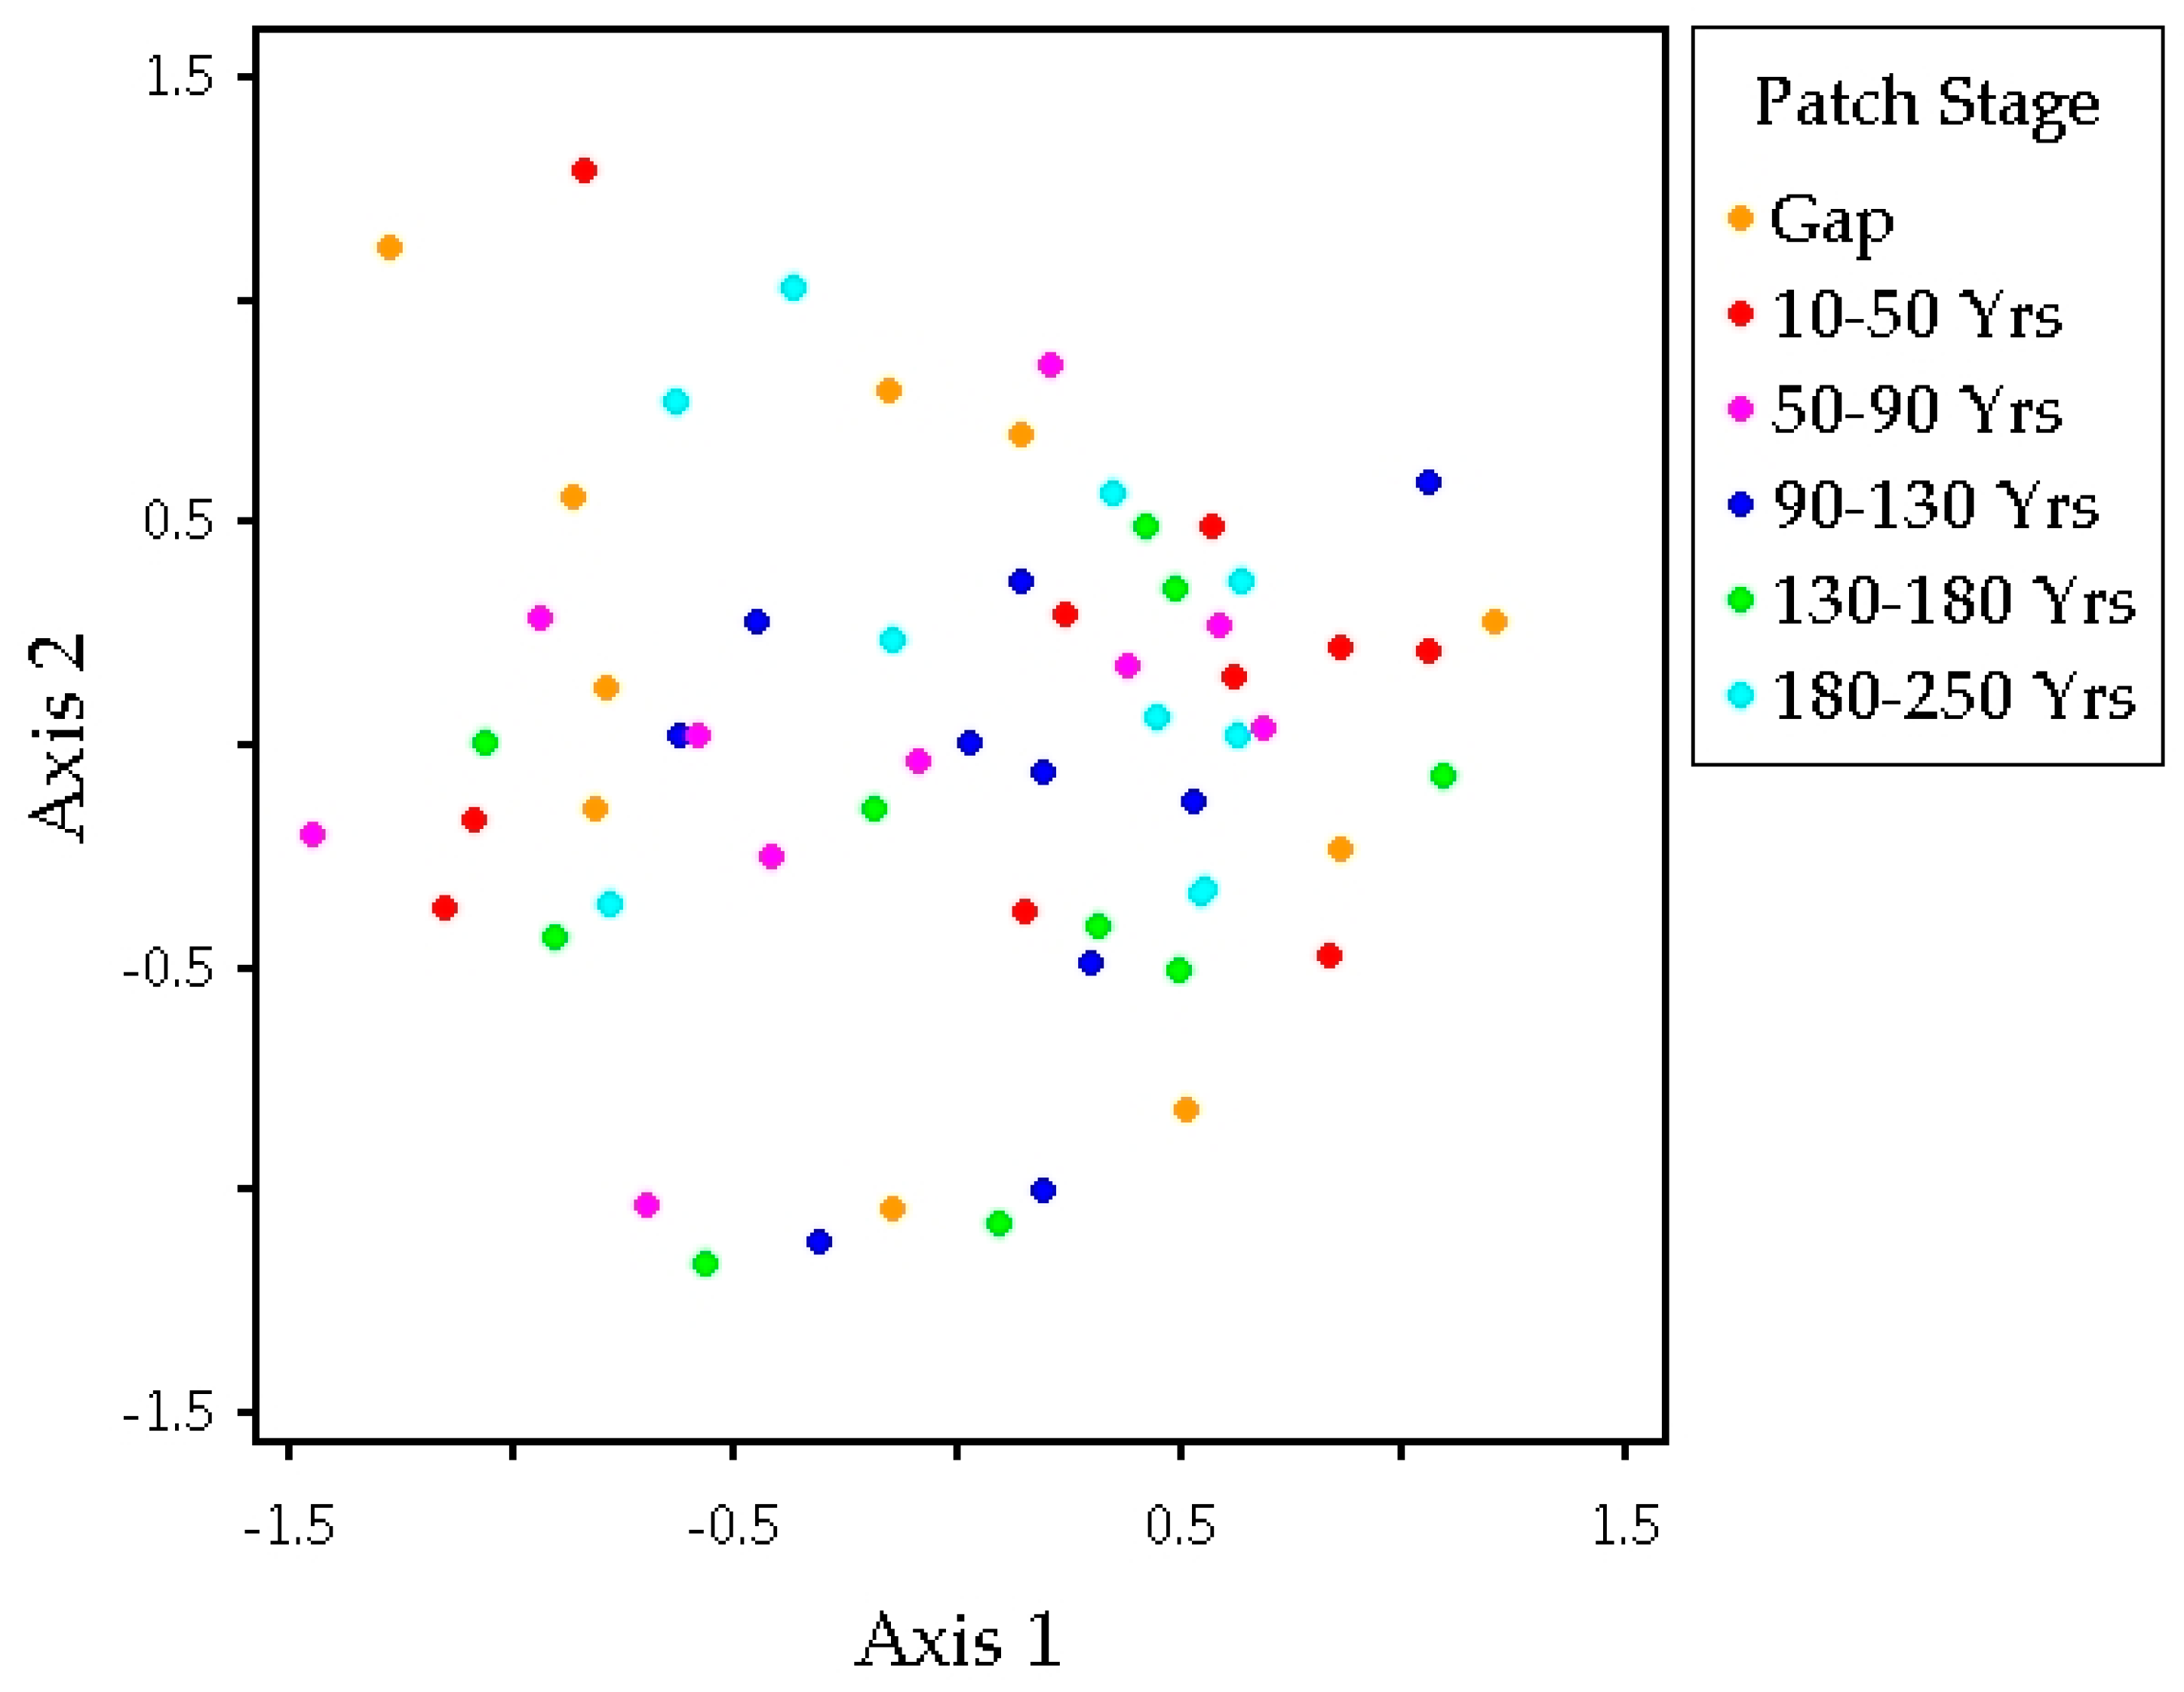
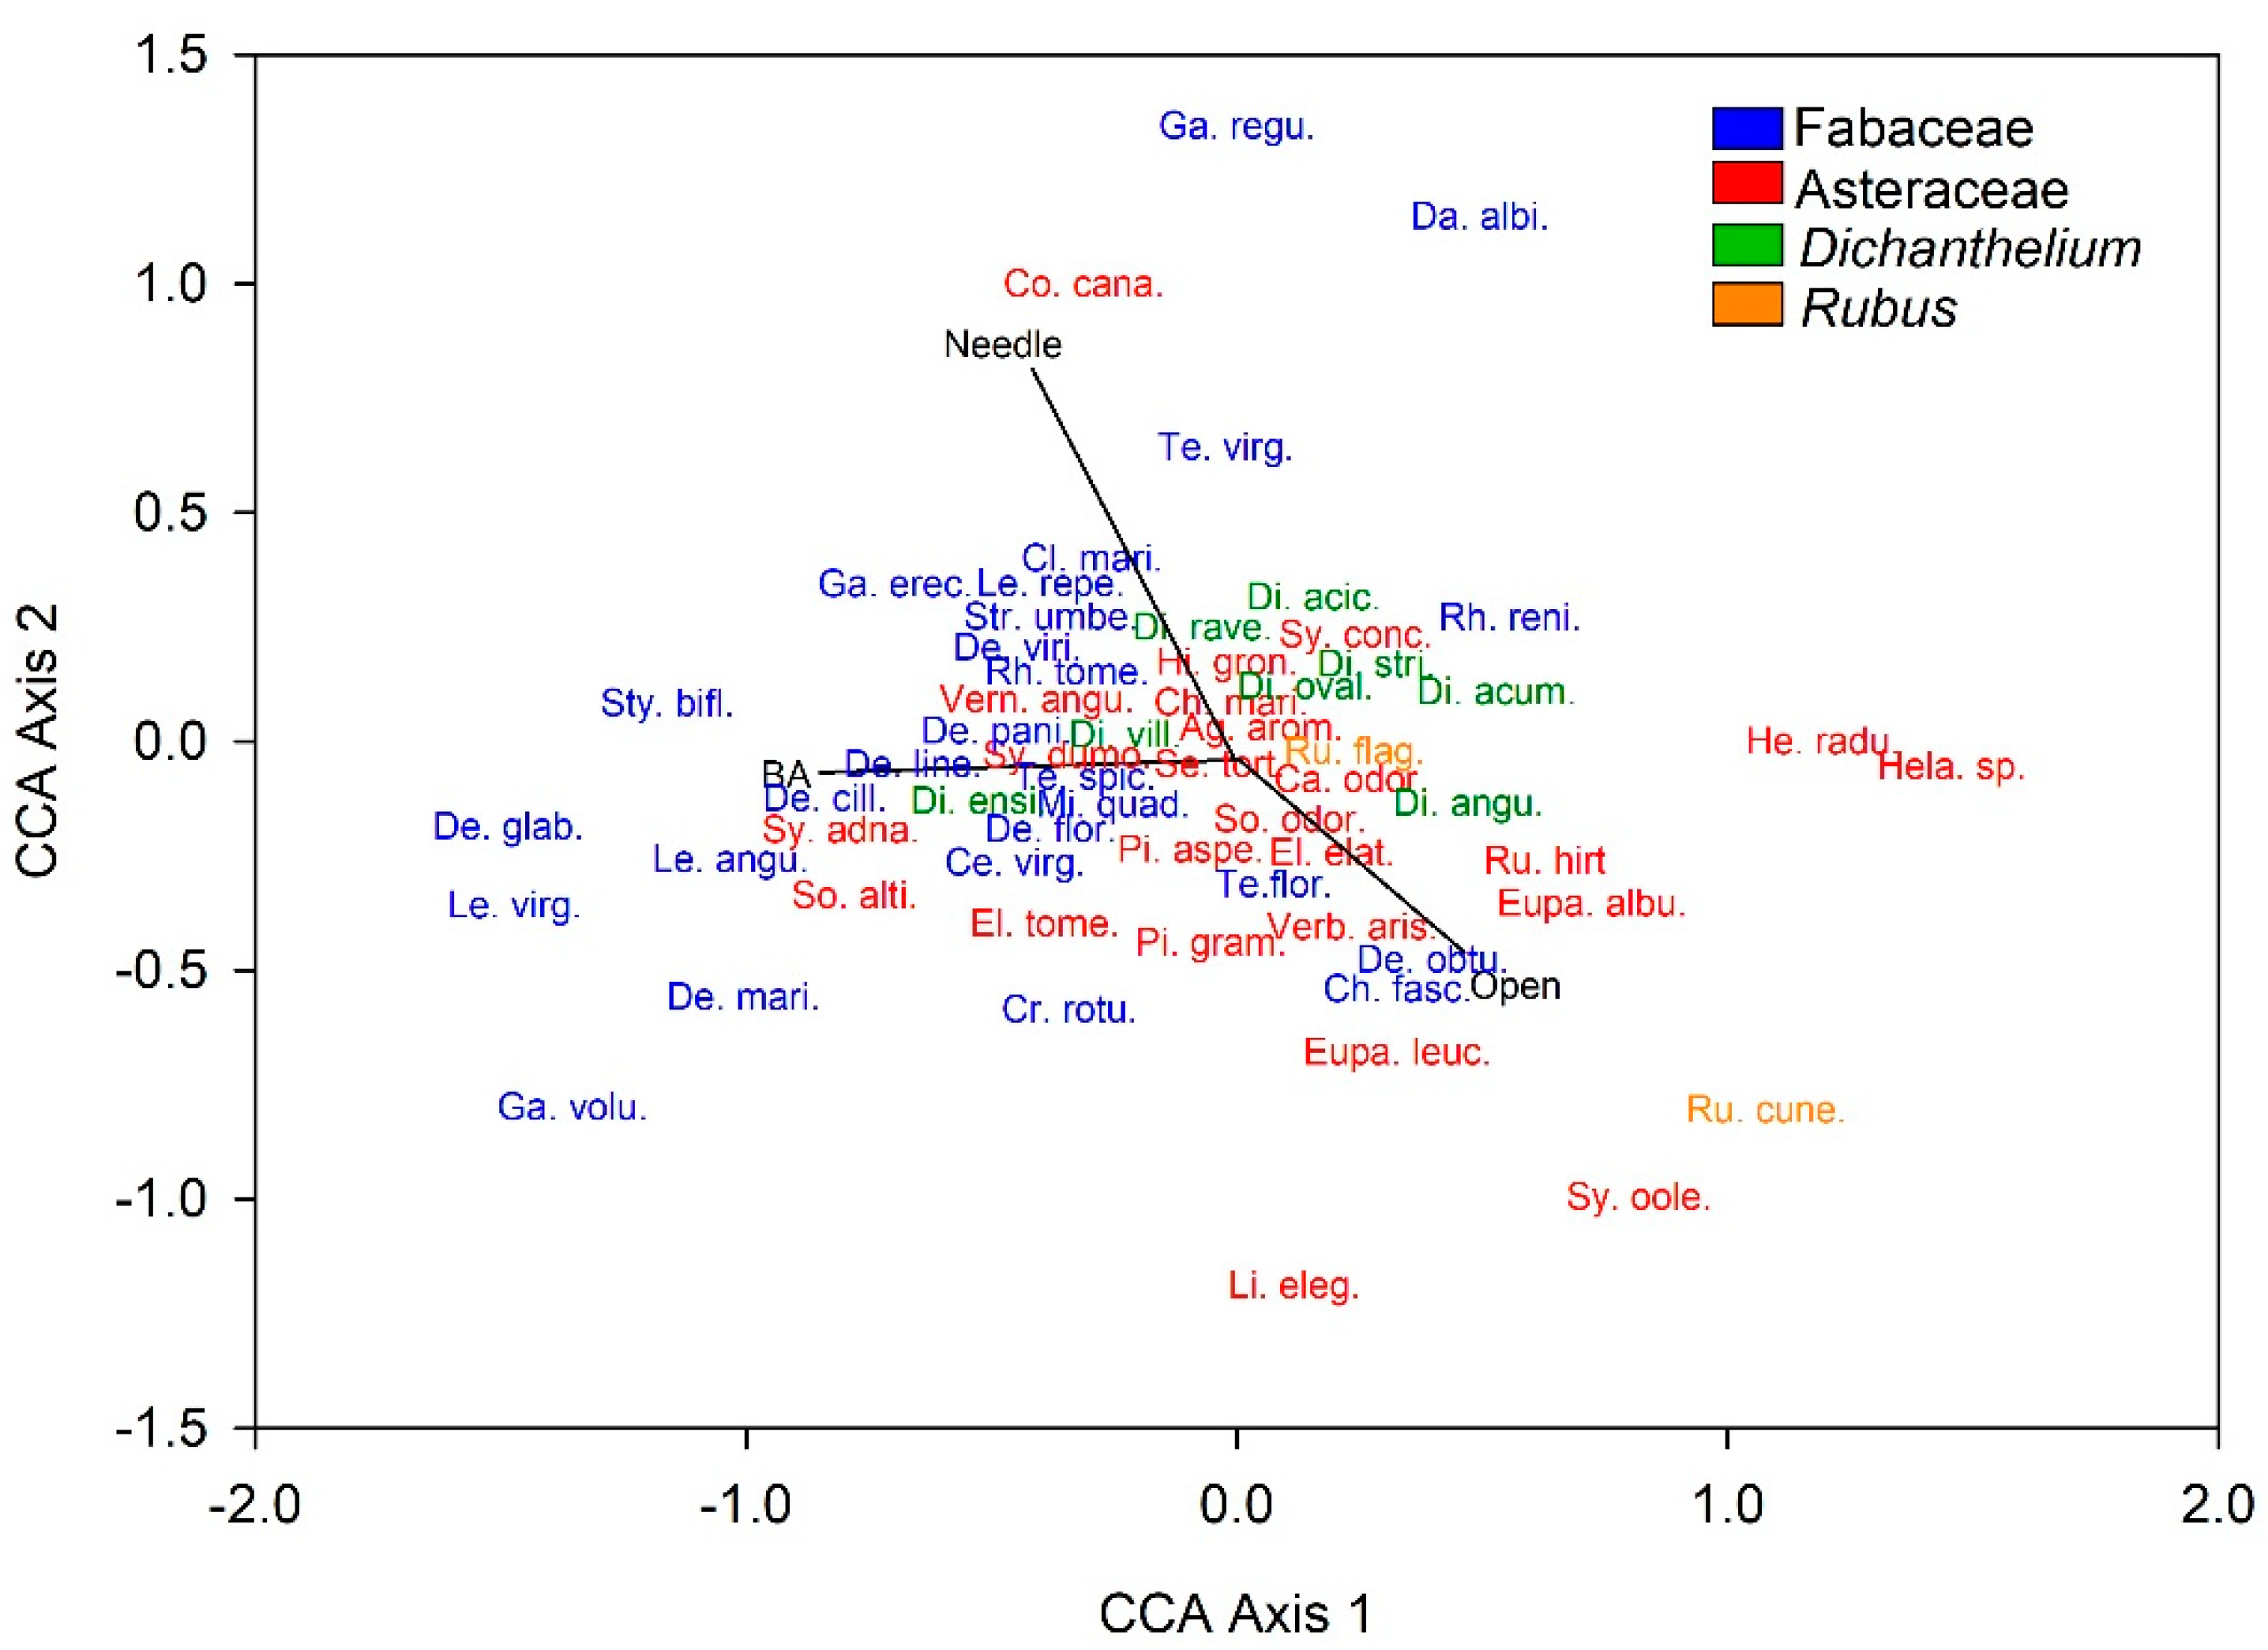
3.2. Plant Community Composition among Patch Stages
4. Discussion
5. Conclusions
Author Contributions
Funding
Acknowledgments
Conflicts of Interest
Appendix A


| Patch Stage Mean | |||||||
|---|---|---|---|---|---|---|---|
| Stage | 0 | 1 | 2 | 3 | 4 | 5 | |
| Analysis Factor | Overall p-Value | Gaps | 10–50 Years | 50–90 Years | 90–130 Years | 130–180 Years | 180–250 Years |
| Tree DBH (cm) | <0.01 | 0.00 E | 11.88 D | 30.45 C | 41.15 B | 47.77 B | 59.95 A |
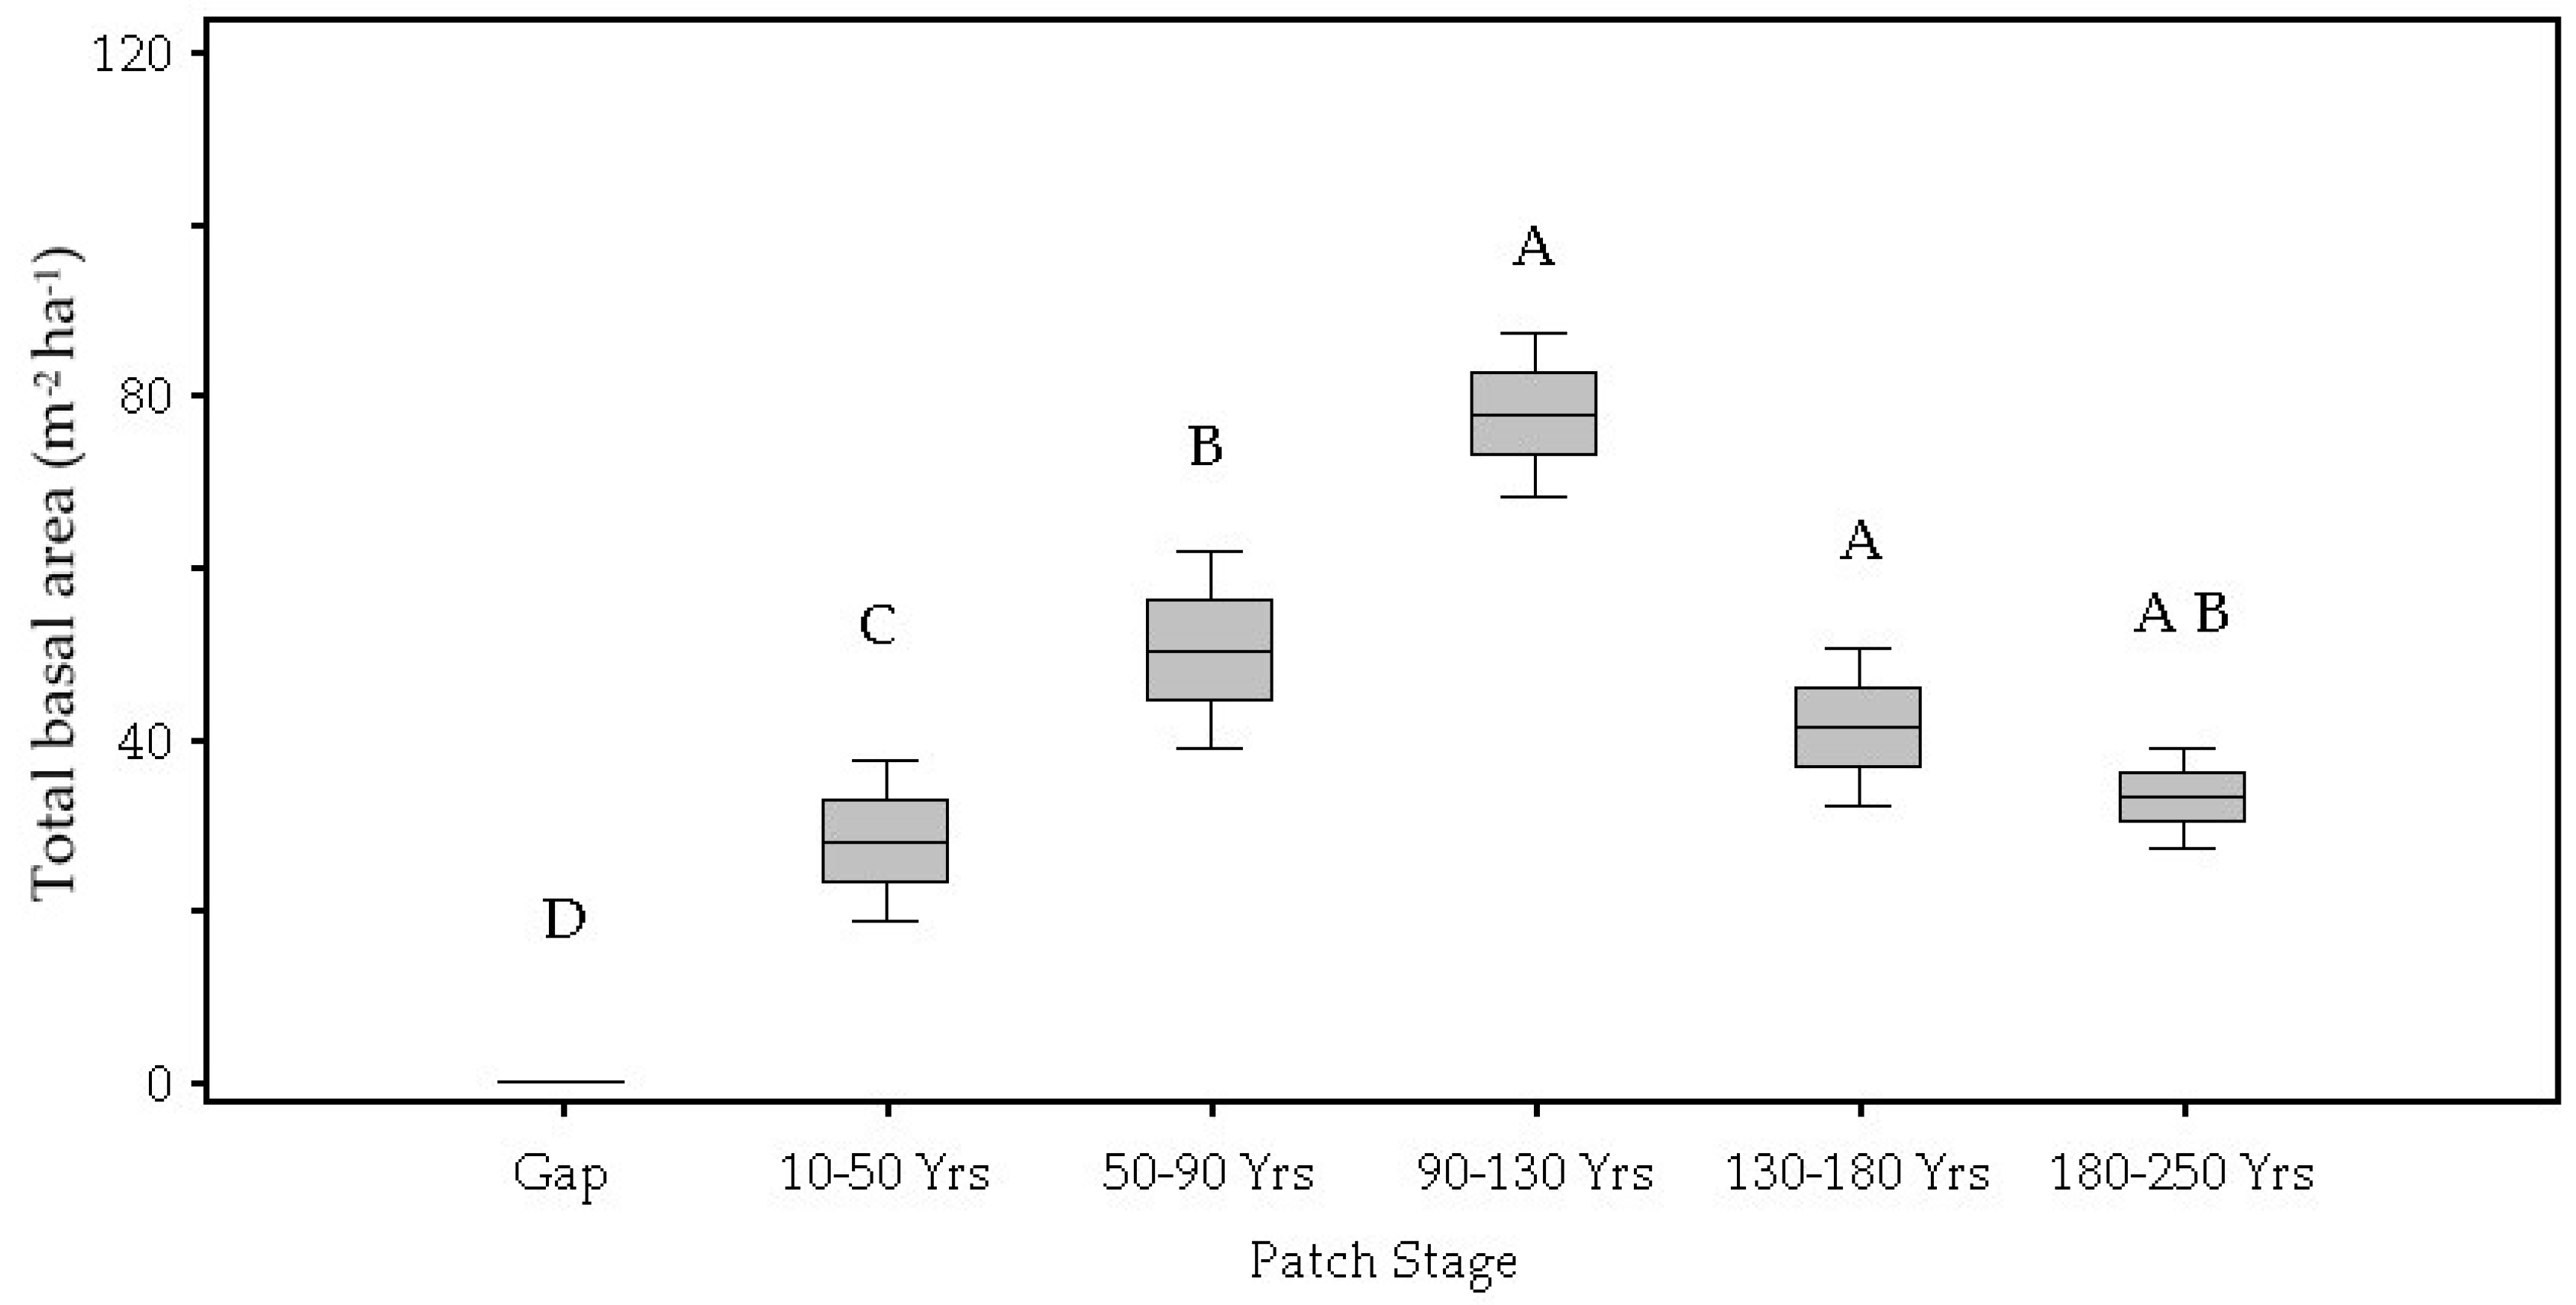
| Total Basal Area (m2 ha) | <0.01 | 0.00 D | 0.04 C | 0.08 B | 0.12 A | 0.13 A | 0.10 A,B |
| Tree Density (trees/10 m2) | <0.01 | 0.00 E | 4.82 A | 1.00 B | 0.88 B,C | 0.70 C | 0.37 D |
| Canopy Openness (%) | <0.01 | 67.49 A | 45.69 D | 46.30 D | 53.27 C | 54.55 C | 63.62 B |
| Patch Stage Mean | |||||||
|---|---|---|---|---|---|---|---|
| Stage | 0 | 1 | 2 | 3 | 4 | 5 | |
| Analysis Factor | Overall p-Value | Gaps | 10–50 Years | 50–90 Years | 90–130 Years | 130–180 Years | 180–250 Years |
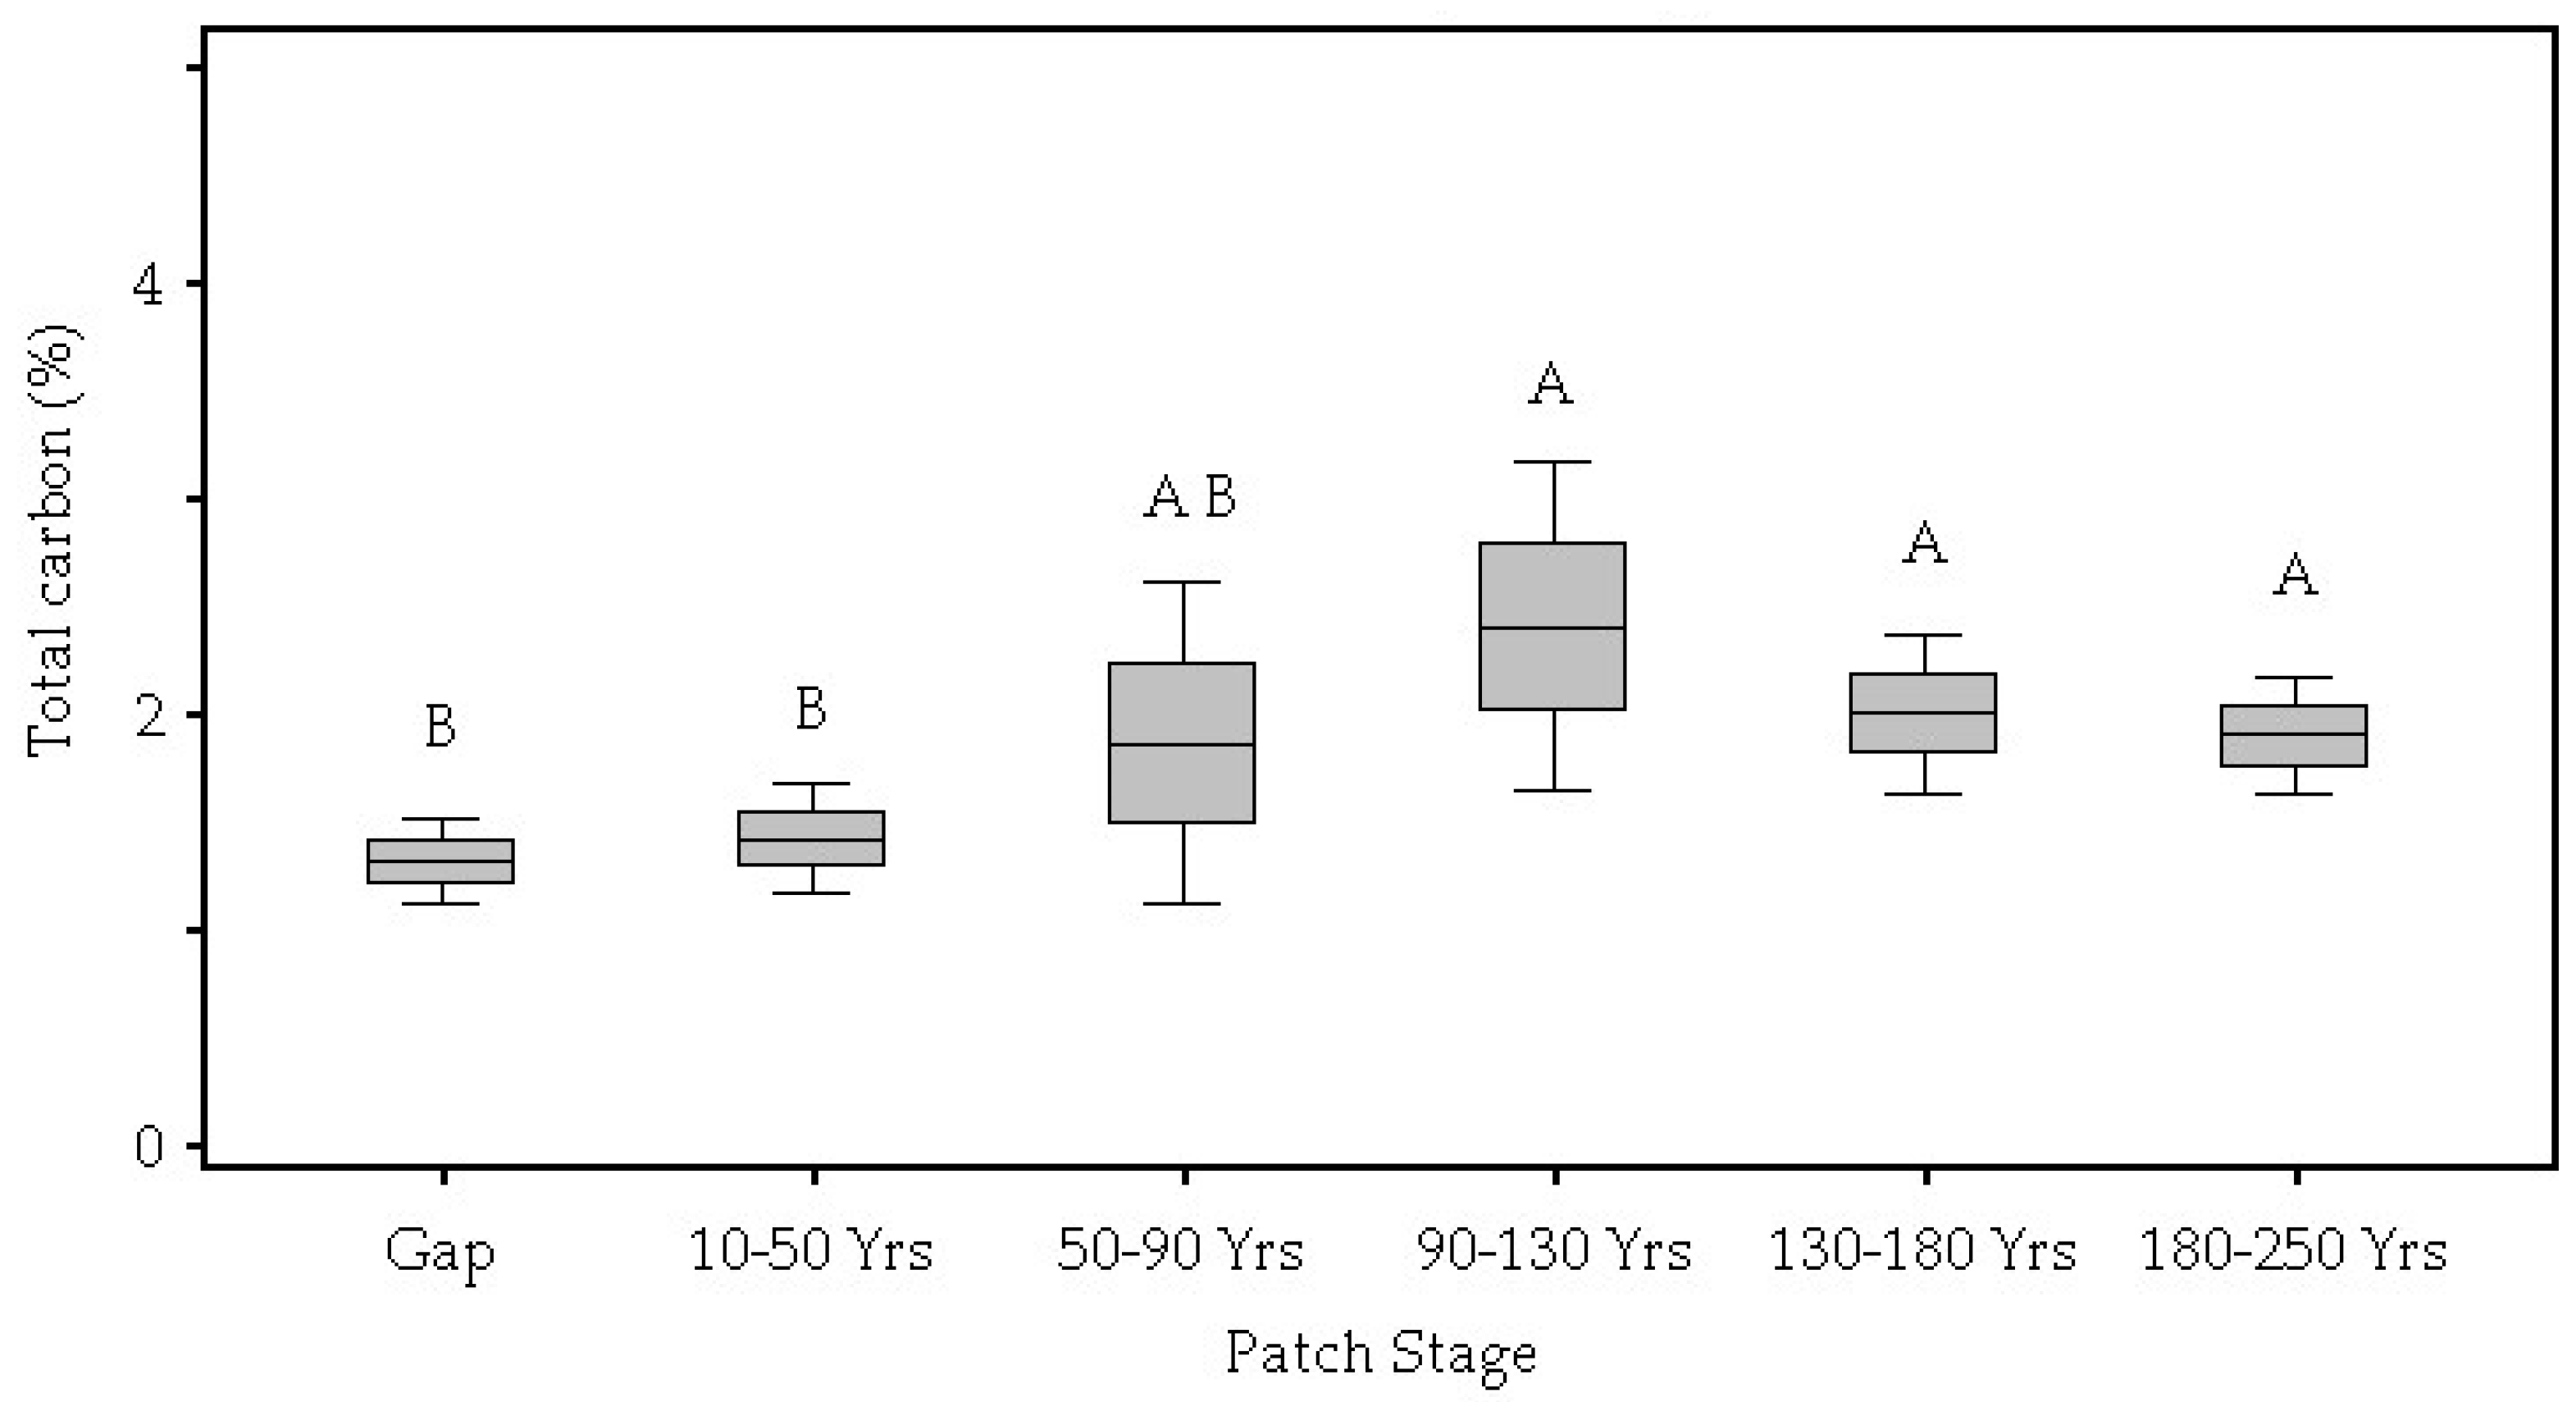
| Total Carbon (%) | 0.05 | 1.32 B | 1.42 B | 1.86 A,B | 2.40 A | 2.00 A | 1.90 A |
| Total Nitrogen (%) | 0.16 | 0.06 | 0.07 | 0.07 | 0.09 | 0.08 | 0.08 |
| Calcium (ppm) | 0.05 | 601.20 B | 613.20 A,B | 521.80 B | 776.40 A | 708.30 A,B | 899.60 A |
| Potassium (ppm) | 0.04 | 14.00 B | 16.00 B | 18.50 B | 19.70 A | 20.30 A,B | 22.90 B |
| Magnesium (ppm) | 0.10 | 104.70 | 121.10 | 105.40 | 141.60 | 131.10 | 153.90 |
| Soil bulk density (g cm−3) | 0.02 | 0.5 A,C | 0.54 A | 0.44 B | 0.46 B,C | 0.48 A | 0.49 A |
| July soil water content (g cm−3) | 0.42 | 0.22 | 0.23 | 0.24 | 0.26 | 0.26 | 0.24 |
| October soil water content (g cm−3) | 0.45 | 0.28 | 0.32 | 0.24 | 0.24 | 0.24 | 0.25 |
| Soil pH | 0.02 | 5.79 A | 5.84 A | 5.60 A | 5.64 B | 5.62 B | 5.64 A |
| Patch Stage Mean | |||||||
|---|---|---|---|---|---|---|---|
| Stage | 0 | 1 | 2 | 3 | 4 | 5 | |
| Analysis Factor | Overall p-Value | Gaps | 10–50 Years | 50–90 Years | 90–130 Years | 130–180 Years | 180–250 Years |
| Total fuel loads (kg m−2) | 0.002 | 0.52 D | 0.69 C,D | 1.06 A | 0.90 B | 0.82 B,C | 0.76 C |
| Total fuel consumed (kg m−2) | 0.002 | 0.32 C | 0.46 B,C | 0.74 A | 0.54 B | 0.52 B | 0.45 B,C |
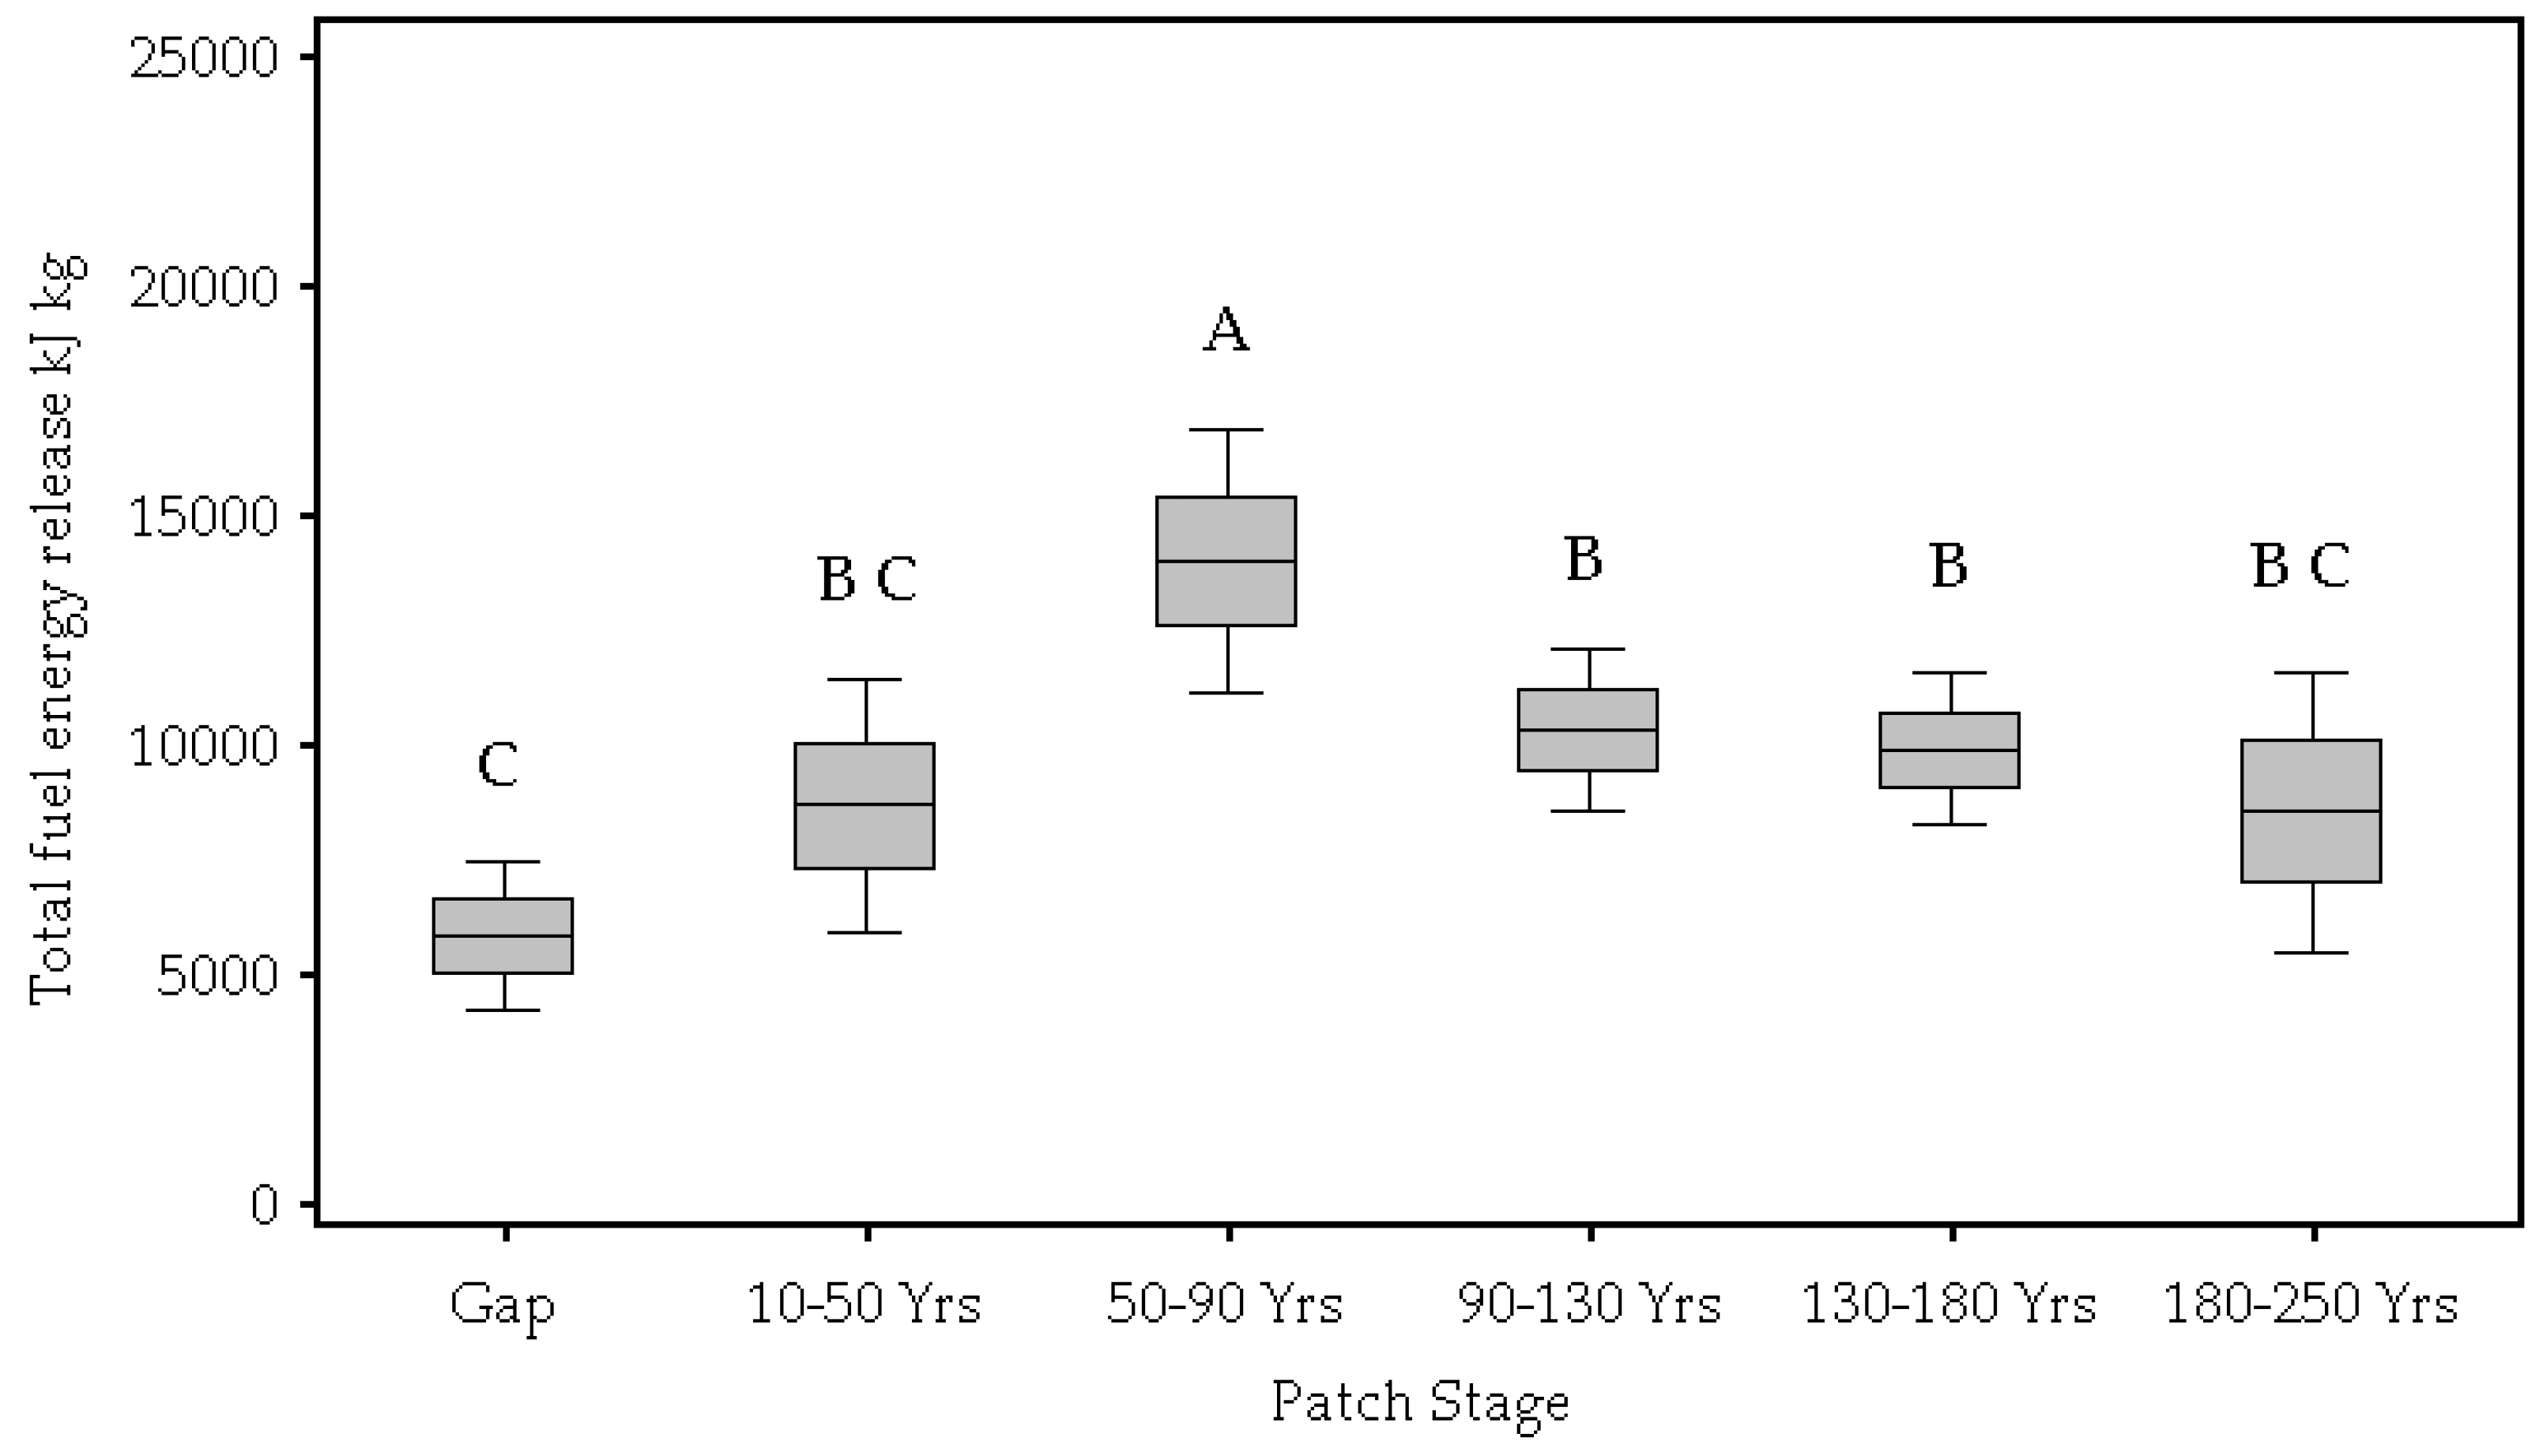
| Total energy released (kJ kg) | 0.00 | 5823.53 C | 8647.13 C,B | 0.13 × 10⁵ A | 0.10 × 10⁵ B | 9861.17 B | 8520.61 B,C |
| Total pine litter (kg m−2) | 0.002 | 0.13 D | 0.35 B | 0.54 A | 0.39 B,C | 0.38 B | 0.27 C |
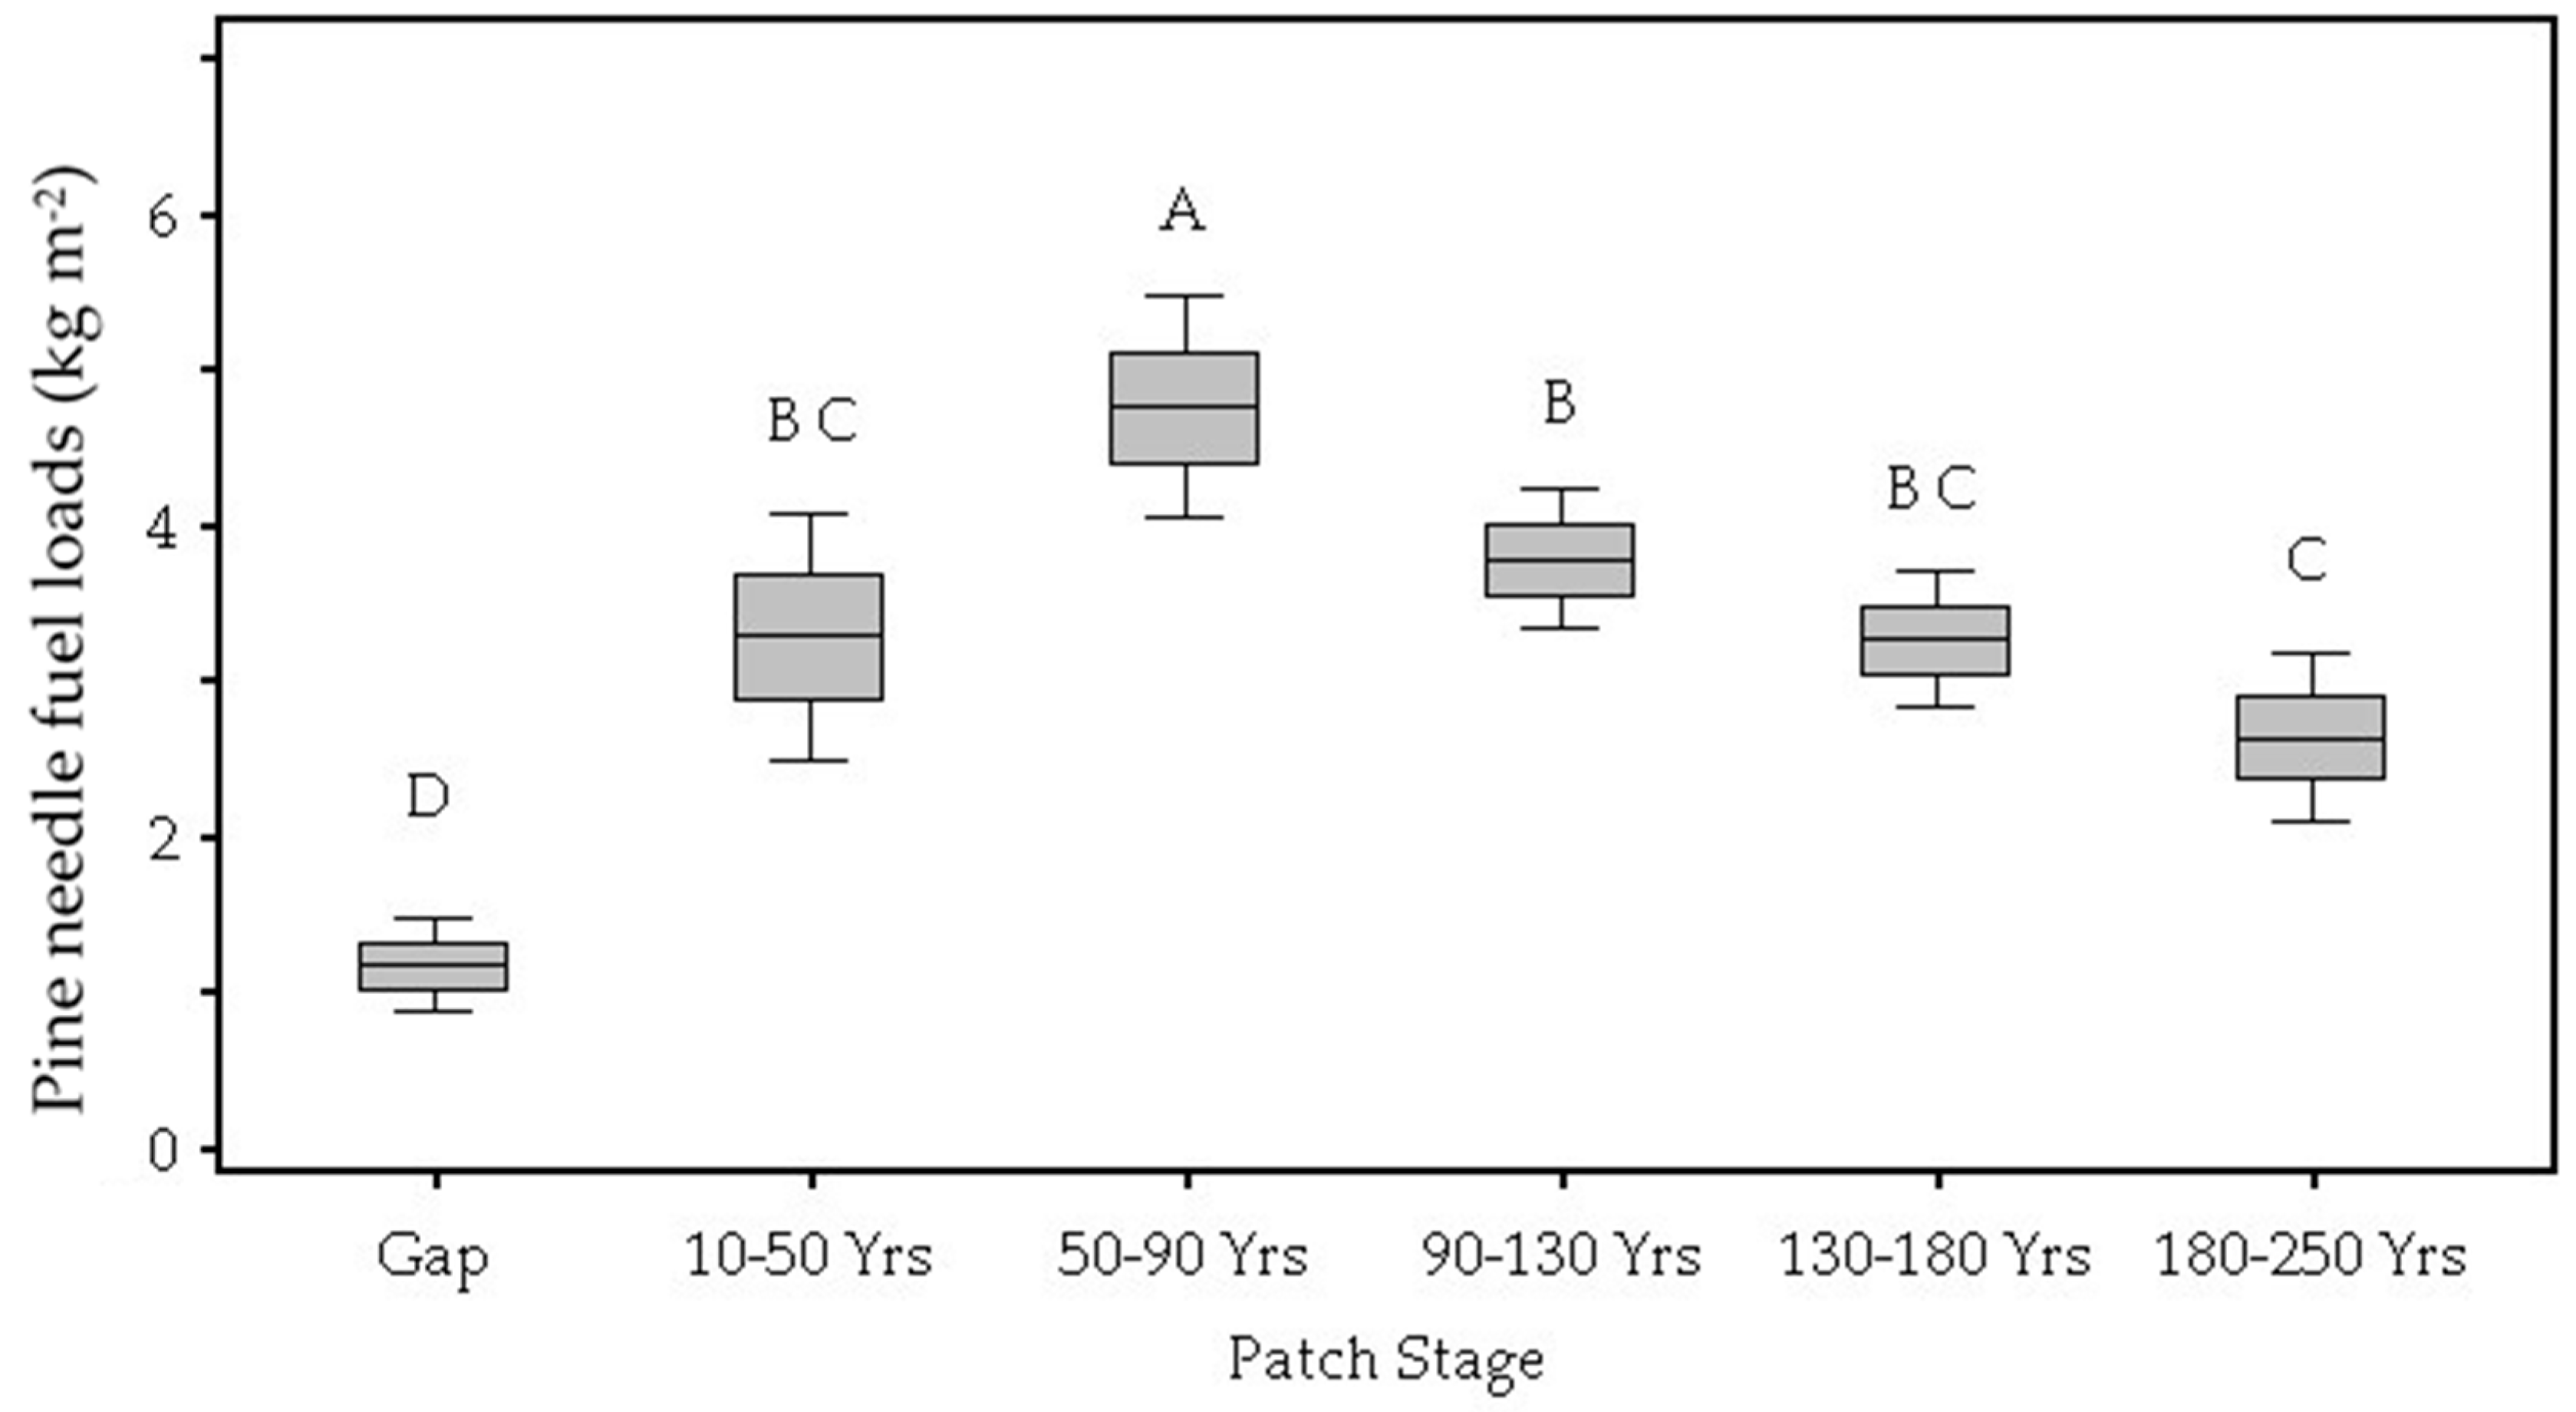
| Pine needle litter (kg m−2) | 0.002 | 0.12 D | 0.33 B,C | 0.47 A | 0.38 B | 0.33 B,C | 0.26 C |
| Woody pine litter (kg m−2) | 0.041 | 0.01 B | 0.03 A,B | 0.07 A | 0.05 A | 0.04 A | 0.03 A |
| Total BL woody (kg m−2) | 0.19 | 0.15 | 0.11 | 0.18 | 0.06 | 0.09 | 0.11 |
| BL woody stems (kg m−2) | 0.13 | 0.08 | 0.10 | 0.14 | 0.05 | 0.05 | 0.06 |
| BL woody leaves (kg m−2) | 0.041 | 0.07 A | 0.03 A,B | 0.06 A | 0.02 B | 0.03 A,B | 0.03 A,B |
| Live herbs (kg m−2) | 0.76 | 0.11 | 0.09 | 0.09 | 0.10 | 0.09 | 0.12 |
| Fine particulate litter (kg m−2) | 0.002 | 0.13 A | 0.16 A | 0.25 B | 0.30 B | 0.27 B | 0.23 B |
| Patch Stage Mean | |||||||
|---|---|---|---|---|---|---|---|
| Stage | 0 | 1 | 2 | 3 | 4 | 5 | |
| Analysis Factor | Overall p-Value | Gaps | 10–50 Years | 50–90 Years | 90–130 Years | 130–180 Years | 180–250 Years |
| Graminoid plant productivity (kg m−2) | 0.42 | 0.03 | 0.02 | 0.02 | 0.03 | 0.03 | 0.03 |
| Forb plant productivity (kg m−2) | 0.83 | 0.03 | 0.02 | 0.03 | 0.02 | 0.03 | 0.03 |
| BL woody plant productivity (kg m−2) | 0.26 | 0.03 | 0.02 | 0.01 | 0.01 | 0.02 | 0.02 |
| BL woody plant biomass (g) | 0.26 | 584.67 | 299.13 | 404.58 | 181.72 | 220.68 | 672.51 |
| Canopy-closing woody Species’ relative cover | 0.46 | 1.64 | 1.28 | 1.22 | 0.85 | 0.53 | 1.95 |
| BL woody species’ relative cover | 0.47 | 1.59 | 1.49 | 1.34 | 1.58 | 1.52 | 2.08 |
| Total percent of plant coverage in plots | 0.17 | 97.70 | 104.21 | 90.90 | 116.70 | 98.43 | 98.35 |
| Ground-layer plant species richness | 0.32 | 36.70 | 41.60 | 36.90 | 39.20 | 37.00 | 34.20 |
References
- Akhavan, R.; Sagheb-Talebi, K.; Zenner, E.K.; Safavimanesh, F. Spatial patterns in different forest development stages of an intact old-growth Oriental beech forest in the Caspian region of Iran. Eur. J. For. Res. 2012, 131, 1355–1366. [Google Scholar] [CrossRef]
- Varner, J.M.; Kush, J.S.; Meldahl, R.S. Structural characteristics of frequently-burned old-growth longleaf pine stands in the mountains of Alabama. Castanea 2003, 68, 211–221. [Google Scholar]
- Platt, W.J.; Evans, G.W.; Rathbun, S.L. The Population Dynamics of a Long-Lived Conifer (Pinus palustris). Am. Nat. 1988, 131, 491–525. [Google Scholar] [CrossRef]
- Platt, W.J.; Rathbun, S.L. Dynamics of an Old-Growth Longleaf Pine Population; Tall Timbers Research Station: Tallahassee, FL, USA, 1993; pp. 275–297. [Google Scholar]
- Vockenhuber, E.A.; Scherber, C.; Langenbruch, C.; Meißner, M.; Seidel, D.; Tscharntke, T. Tree diversity and environmental context predict herb species richness and cover in Germany’s largest connected deciduous forest. Perspectives. Plant Ecol. Evolut. Syst. 2011, 13, 111–119. [Google Scholar] [CrossRef]
- Crozier, C.R.; Boerner, R.E.J. Correlations of understory herb distribution patterns with microhabitats under different tree species in a mixed mesophytic forest. Oecologia 1984, 62, 337–343. [Google Scholar] [CrossRef]
- Barbier, S.; Gosselin, F.; Balandier, P. Influence of tree species on understory vegetation diversity and mechanisms involved—A critical review for temperate and boreal forests. For. Ecol. Manag. 2008, 254, 1–15. [Google Scholar] [CrossRef]
- Roberts, M.R.; Gilliam, F.S. The Herbaceous Layer in Forests of Eastern North America; Oxford University Press: Oxford, UK, 2003. [Google Scholar]
- White, P.S.; Pickett, S.T.A. Natural Disturbance and Patch Dynamics: An Introduction. In The Ecology of Natural Disturbance and Patch Dynamics; Elsevier: Amsterdam, The Netherlands, 1985. [Google Scholar] [CrossRef]
- Platt, W.J.; Ellair, D.P.; Huffman, J.M.; Potts, S.E.; Beckage, B. Pyrogenic fuels produced by savanna trees can engineer humid savannas. Ecol. Monogr. 2016, 86, 352–372. [Google Scholar] [CrossRef]
- Hammond, D.H.; Varner, J.M.; Fan, Z.; Kush, J.S. Long-term stand dynamics of old-growth mountain longleaf pine (Pinus palustris) woodlands. For. Ecol. Manag. 2016, 364, 154–164. [Google Scholar] [CrossRef]
- Peet, R.K.; Allard, D.J. Longleaf pine vegetation of the southern Atlantic and eastern Gulf Coast regions: A preliminary classification. In Proceedings of the 18th Tall Timbers Fire Ecology Conference, Tallahassee, FL, USA, 30 May–2 June 1991. [Google Scholar]
- Peet, R.K.; Platt, W.J.; Costanza, J.K. Fire-maintained Pine Savannas and Woodlands of the Southeastern US Coastal Plain. In Ecology and Recovery of Eastern Old-Growth Forests; Barton, A., Keeton, W., Eds.; Island Press: Washington, DC, USA, 2018; pp. 39–62. [Google Scholar]
- Platt, W.J. The Savanna, Barren, and Rock Outcrop Communities of North America; Anderson, R.C., Fralish, J.S., Baskin, J., Eds.; Cambridge University Press: Cambridge, UK, 1999. [Google Scholar]
- Beckage, B.; Platt, W.J.; Gross, L. Vegetation, fire, and feedbacks: A disturbance-mediated model of savannas. Am. Nat. 2009, 174, 805–818. [Google Scholar]
- Gagnon, P.R.; Passmore, H.A.; Slocum, M.; Myers, J.A.; Harms, K.E.; Platt, W.J.; Paine, C.E.T. Fuels and fires influence vegetation via above- and belowground pathways in a high-diversity plant community. J. Ecol. 2015, 103, 1009–1019. [Google Scholar] [CrossRef]
- Waldrop, T.A.; White, D.L.; Jones, S.M. Fire regimes for pine-grassland communities in the southeastern United States. For. Ecol. Manag. 1992, 47, 195–210. [Google Scholar] [CrossRef]
- Thaxton, J.M.; Platt, W.J. Small-scale fuel variation alters fire intensity and shrub abundance in a pine savanna. Ecology 2006, 87, 1331–1337. [Google Scholar] [CrossRef]
- Van Lear, D.H.; Carroll, W.D.; Kapeluck, P.R.; Johnson, R. History and restoration of the longleaf pine-grassland ecosystem: Implications for species at risk. For. Ecol. Manag. 2005, 211, 150–165. [Google Scholar] [CrossRef]
- Platt, W.J.; Orzell, S.L.; Slocum, M.G. Seasonality of fire weather strongly influences fire regimes in south Florida savanna-grassland landscapes. PLoS ONE 2015, 10. [Google Scholar] [CrossRef]
- Brockway, D.G.; Outcalt, K.W.; Boyer, W.D. Longleaf Pine Regeneration Ecology and Methods. In The Longleaf Pine Ecosystem: Ecology, Silviculture, and Restoration; Shibu, J., Jokela, E.J., Miller, D.L., Eds.; Springer: New York, NY, USA, 2006; pp. 95–133. [Google Scholar] [CrossRef]
- Grace, S.L.; Hamrick, J.L.; Platt, W.J. Estimation of Seed Dispersal in an Old-Growth Population of Longleaf Pine (Pinus palustris) Using Maternity Exclusion Analysis. Castanea 2004, 69, 207–215. [Google Scholar] [CrossRef]
- Landers, J.L.; Van Lear, D.H.; Boyer, W.D. The longleaf pine forests of the southeast: Requiem or renaissance? J. For. 1995, 93, 39–44. [Google Scholar]
- Grace, S.L.; Platt, W.J. Effects of Adult Tree Density and Fire on the Demography of Pregrass Stage Juvenile Longleaf Pine (Pinus palustris Mill.). J. Ecol. 1995, 83, 75. [Google Scholar] [CrossRef]
- Platt, W.J.; Glitzenstein, J.S.; Streng, D.R. Evaluating pyrogenicity and its effects on vegetation in longleaf pine savannas. In Proceedings of the 18th Tall Timbers Fire Ecology Conference, Tallahassee, FL, USA, 30 May–2 June 1991; pp. 143–161. [Google Scholar]
- Robertson, K.M.; Platt, W.J.; Faires, C. The Role of Patchy Burns, Canopy Cover, and Tree Death on Location of Longleaf Pine (Pinus palustris Mill.) Regeneration in an Old-growth Savanna. Forests 2019, in press. [Google Scholar]
- West, D.C.; Doyle, T.W.; Tharp, M.L.; Beauchamp, J.J.; Platt, W.J.; Downing, D.J. Recent growth increases in old-growth longleaf pine. Can. J. For. Res. 1993, 23, 846–853. [Google Scholar] [CrossRef]
- Gilliam, F.S.; Platt, W.J.; Peet, R.K. Natural disturbances and the physiognomy of pine savannas: A phenomenological model. Appl. Veg. Sci. 2006, 9, 83–96. [Google Scholar] [CrossRef]
- Noel, J.M.; Platt, W.J.; Moser, E.B. Structural Characteristics of Old- and Second-Growth Stands of Longleaf Pine (Pinus palustris) in the Gulf Coastal Region of the U.S.A. Conserv. Biol. 1998, 12, 533–548. [Google Scholar] [CrossRef]
- Robertson, K.M.; Ostertag, T.E. Effects of land use on fuel characteristics and fire behavior in pinelands of southwest Georgia. In Proceedings of the 23rd Tall Timbers Fire Ecology Conference: Fire in Grassland & Shrubland Ecosystems, San Diego, CA, USA, 13–17 November 2006; pp. 181–191. [Google Scholar]
- O’Brien, J.J.; Loudermilk, E.L.; Hiers, J.K.; Pokswinski, S.M.; Hornsby, B.; Hudak, A.T.; Strother, D.; Rowell, E.; Bright, B.C. Canopy-Derived Fuels Drive Patterns of in-Fire Energy Release and Understory Plant Mortality in a Longleaf Pine (Pinus palustris) Sandhill in Northwest Florida, USA. Can. J. Remote Sens. 2016, 42, 489–500. [Google Scholar] [CrossRef]
- Palik, B.J.; Mitchell, R.J.; Houseal, G.; Pederson, N. Effects of canopy structure on resource availability and seedling responses in a longleaf pine ecosystem. Can. J. For. Res. 1997, 27, 1458–1464. [Google Scholar] [CrossRef]
- McGuire, J.P.; Mitchell, R.J.; Moser, E.B.; Pecot, S.D.; Gjerstad, D.H.; Hedman, C.W. Gaps in a gappy forest: Plant resources, longleaf pine regeneration, and understory response to tree removal in longleaf pine savannas. Can. J. For. Res. 2001, 31, 765–778. [Google Scholar] [CrossRef]
- Platt, W.J.; Carr, S.M.; Reilly, M.; Fahr, J. Pine savanna overstory influences on ground-cover biodiversity. Appl. Veg. Sci. 2006, 9, 37–50. [Google Scholar] [CrossRef]
- Walker, J.L.; Silletti, A.M. Restoring the Ground Layer of Longleaf Pine Ecosystems. In The Longleaf Pine Ecosystem: Ecology, Silviculture, and Restoration; Shibu, J., Jokela, E.J., Miller, D.L., Eds.; Springer: New York, NY, USA, 2006; pp. 297–333. [Google Scholar] [CrossRef]
- Wilson, C.A.; Mitchell, R.J.; Hendricks, J.J.; Boring, L.R. Patterns and controls of ecosystem function in longleaf pine - wiregrass savannas. II. Nitrogen dynamics. Can. J. For. Res. 1999, 29, 752–760. [Google Scholar] [CrossRef]
- Lavoie, M.; Starr, G.; Mack, M.C.; Martin, T.A.; Gholz, H.L. Effects of a Prescribed Fire on Understory Vegetation, Carbon Pools, and Soil Nutrients in a Longleaf Pine-Slash Pine Forest in Florida. Nat. Areas J. 2010, 30, 82–94. [Google Scholar] [CrossRef]
- Levi, M.R.; Shaw, J.N.; Wood, C.W.; Hermann, S.M.; Carter, E.A.; Feng, Y. Land Management Effects on Near-Surface Soil Properties of Southeastern U.S. Coastal Plain Kandiudults. Soil Sci. Soc. Am. J. 2010, 74, 258. [Google Scholar] [CrossRef]
- Carr, S.C.; Robertson, K.M.; Platt, W.J.; Peet, R.K. A model of geographical, environmental and regional variation in vegetation composition of pyrogenic grasslands of Florida. J. Biogeogr. 2009, 36, 1600–1612. [Google Scholar] [CrossRef]
- Fill, J.M.; Platt, W.J.; Welch, S.M.; Waldron, J.L.; Mousseau, T.A. Updating models for restoration and management of fiery ecosystems. For. Ecol. Manag. 2015, 356, 54–63. [Google Scholar] [CrossRef]
- Huffman, J.M. Historical Fire Regimes in Southeastern Pine Savannas; Louisiana State University: Baton Rouge, LA, USA, 2006. [Google Scholar]
- Stambaugh, M.C.; Guyette, R.P.; Marschall, J.M. Longleaf pine (Pinus palustris Mill.) fire scars reveal new details of a frequent fire regime. J. Veg. Sci. 2011, 22, 1094–1104. [Google Scholar] [CrossRef]
- Rother, M.T.; Huffman, J.M.; Harley, G.L.; Platt, W.J.; Jones, N.; Robertson, K.M.; Orzell, S.L. Cambial phenology informs tree-ring analysis of fire seasonality in Coastal Plain pine savannas. Fire Ecol. 2018, 14, 164–185. [Google Scholar]
- Staff, S.S. Web Soil Survey. National Resources Conservation Service; U.S. Department of Agriculture: Washington, DC, USA, 2018.
- Weakley, A.S. Flora of the Southern and Mid-Atlantic States; University of North Carolina Herbarium: Chapel Hill, NC, USA, 2015. [Google Scholar]
- Daubenmire, R.F. A canopy-cover method of vegetation analysis. Northwest Sci. 1959, 33, 43–46. [Google Scholar]
- Damgaard, C. Estimating mean plant cover from different types of cover data: A coherent statistical framework. Ecosphere 2014, 5, art20. [Google Scholar] [CrossRef]
- Hatton, T.J.; West, N.E.; Johnson, P.S. Relationships of the error associated with ocular estimation and actual total cover. J. Range Manag. 1986, 39, 91–92. [Google Scholar] [CrossRef]
- Kercher, S.M.; Frieswyk, C.B.; Zedler, J.B. Effects of sampling teams and estimation methods on the assessment of plant cover. J. Veg. Sci. 2003, 14, 899–906. [Google Scholar] [CrossRef]
- Reid, A.M.; Robertson, K.M. Energy content of common fuels in upland pine savannas of the south-eastern US and their application to fire behaviour modelling. Int. J. Wildland Fire 2012, 21, 591. [Google Scholar] [CrossRef]
- McCune, B.; Grace, J.B.; Urban, D.L. Analysis of Ecological Communities; MjM Software Design: Gleneden Beach, OR, USA, 2002; Volume 28. [Google Scholar]
- Anderson, M.J. A new method for non-parametric multivariate analysis of variance. Austral Ecol. 2001, 26, 32–46. [Google Scholar] [CrossRef]
- Archer, J.K.; Miller, D.L.; Tanner, G.W. Changes in Understory Vegetation and Soil Characteristics Following Silvicultural Activities in a Southeastern Mixed Pine Forest. J. Torrey Bot. Soc. 2007, 134, 489–504. [Google Scholar] [CrossRef]
- Chappelka, A.H. Reproductive development of blackberry (Rubus cuneifolius), as influenced by ozone. New Phytol. 2002, 155, 249–255. [Google Scholar] [CrossRef]
- Stfir, W.W.; Shelton, H.M. Review of forage resources in plantation crops of Southeast Asia and the Pacific. In Forages for Plantation Crops; Australian Centre for International Agricultural Research: Canberra, Australia, 1990; pp. 25–31. [Google Scholar]
- Lin, C.; McGraw, R.; George, M.; Garrett, H.E. Shade effects on forage crops with potential in temperate agroforestry practices. Agrofor. Syst. 1998, 44, 109–119. [Google Scholar] [CrossRef]
- Hendricks, J.J.; Boring, L.R. N2-fixation by native herbaceous legumes in burned pine ecosystems of the southeastern United States. For. Ecol. Manag. 1999, 113, 167–177. [Google Scholar] [CrossRef]
- Bradstock, R.A.; Auld, T.D. Soil temperatures during experimental bushfires in relation to fire intensity: Consequences for legume germination and fire management in south-eastern Australia. J. Appl. Ecol. 1995, 32, 76–84. [Google Scholar] [CrossRef]
- Wiggers, M.S.; Hiers, J.K.; Barnett, A.; Boyd, R.S.; Kirkman, L.K. Seed heat tolerance and germination of six legume species native to a fire-prone longleaf pine forest. Plant Ecol. 2016, 218, 151–171. [Google Scholar] [CrossRef]
- Coffey, K.L.; Kirkman, L.K. Seed Germination Strategies of Species with Restoration Potential in a Fire-Maintained Pine Savanna. Nat. Areas J. 2006, 26, 289–299. [Google Scholar] [CrossRef]
- Miller, J.H.; Miller, K.V. Forest Plants of the Southeast and Their Wildlife Uses; University of Georgia Press: Athens, GA, USA, 2005. [Google Scholar]
- MacDonald, L.; Mushinsky, H.R.J.H. Foraging ecology of the gopher tortoise, Gopherus polyphemus, in a sandhill habitat. Herpetologica 1988, 44, 345–353. [Google Scholar]
- Christensen, N.L. Fire and soil-plant nutrient relations in a pine-wiregrass savanna on the coastal plain of North Carolina. Oecologia 1977, 31, 27–44. [Google Scholar] [CrossRef]
- Fornara, D.A.; Tilman, D. Plant functional composition influences rates of soil carbon and nitrogen accumulation. J. Ecol. 2008, 96, 314–322. [Google Scholar] [CrossRef]
- Hiers, J.K.; Mitchell, R.J.; Boring, L.R.; Hendricks, J.J.; Wyatt, R. Legumes native to longleaf pine savannas exhibit capacity for high N2-fixation rates and negligible impacts due to timing of fire. New Phytol. 2003, 157, 327–338. [Google Scholar] [CrossRef]
- Hovanes, K.A.; Harms, K.E.; Gagnon, P.R.; Myers, J.A.; Elderd, B.D. Overdispersed spatial patterning of dominant bunchgrasses in southeastern pine savannas. Am. Nat. 2018, 191, 658–667. [Google Scholar] [CrossRef]
- Beckage, B.; Gross, L.J.; Platt, W.J. Grass feedbacks on fire stabilize savannas. Ecol. Model. 2011, 222, 2227–2233. [Google Scholar] [CrossRef]
- Gyssels, G.; Poesen, J.; Bochet, E.; Li, Y. Impact of plant roots on the resistance of soils to erosion by water: A review. Prog. Phys. Geogr. 2005, 29, 189–217. [Google Scholar] [CrossRef]
- Berg, B.; McClaugherty, C.; De Santo, A.V.; Johansson, M.B.; Ekbohm, G. Decomposition of litter and soil organic matter—Can we distinguish a mechanism for soil organic matter buildup? Scand. J. For. Res. 1995, 10, 108–119. [Google Scholar] [CrossRef]
- Tietema, A. Mass loss and nitrogen dynamics in decomposing acid forest litter in the Netherlands at increased nitrogen deposition. Biogeochemistry 1993, 20, 45–62. [Google Scholar] [CrossRef]
- McClaugherty, C.A.; Pastor, J.; Aber, J.D.; Melillo, J.M. Forest Litter Decomposition in Relation to Soil Nitrogen Dynamics and Litter Quality. Ecology 1985, 66, 266–275. [Google Scholar] [CrossRef]
- Aber, J.D.; Melillo, J.M.; McClaugherty, C.A. Predicting long-term patterns of mass loss, nitrogen dynamics, and soil organic matter formation from initial fine litter chemistry in temperate forest ecosystems. Can. J. Bot. 1990, 68, 2201–2208. [Google Scholar] [CrossRef]
- Lehmann, J.; Gaunt, J.; Rondon, M. Bio-char Sequestration in Terrestrial Ecosystems—A Review. Mitig. Adapt. Strateg. Glob. Chang. 2006, 11, 403–427. [Google Scholar] [CrossRef]


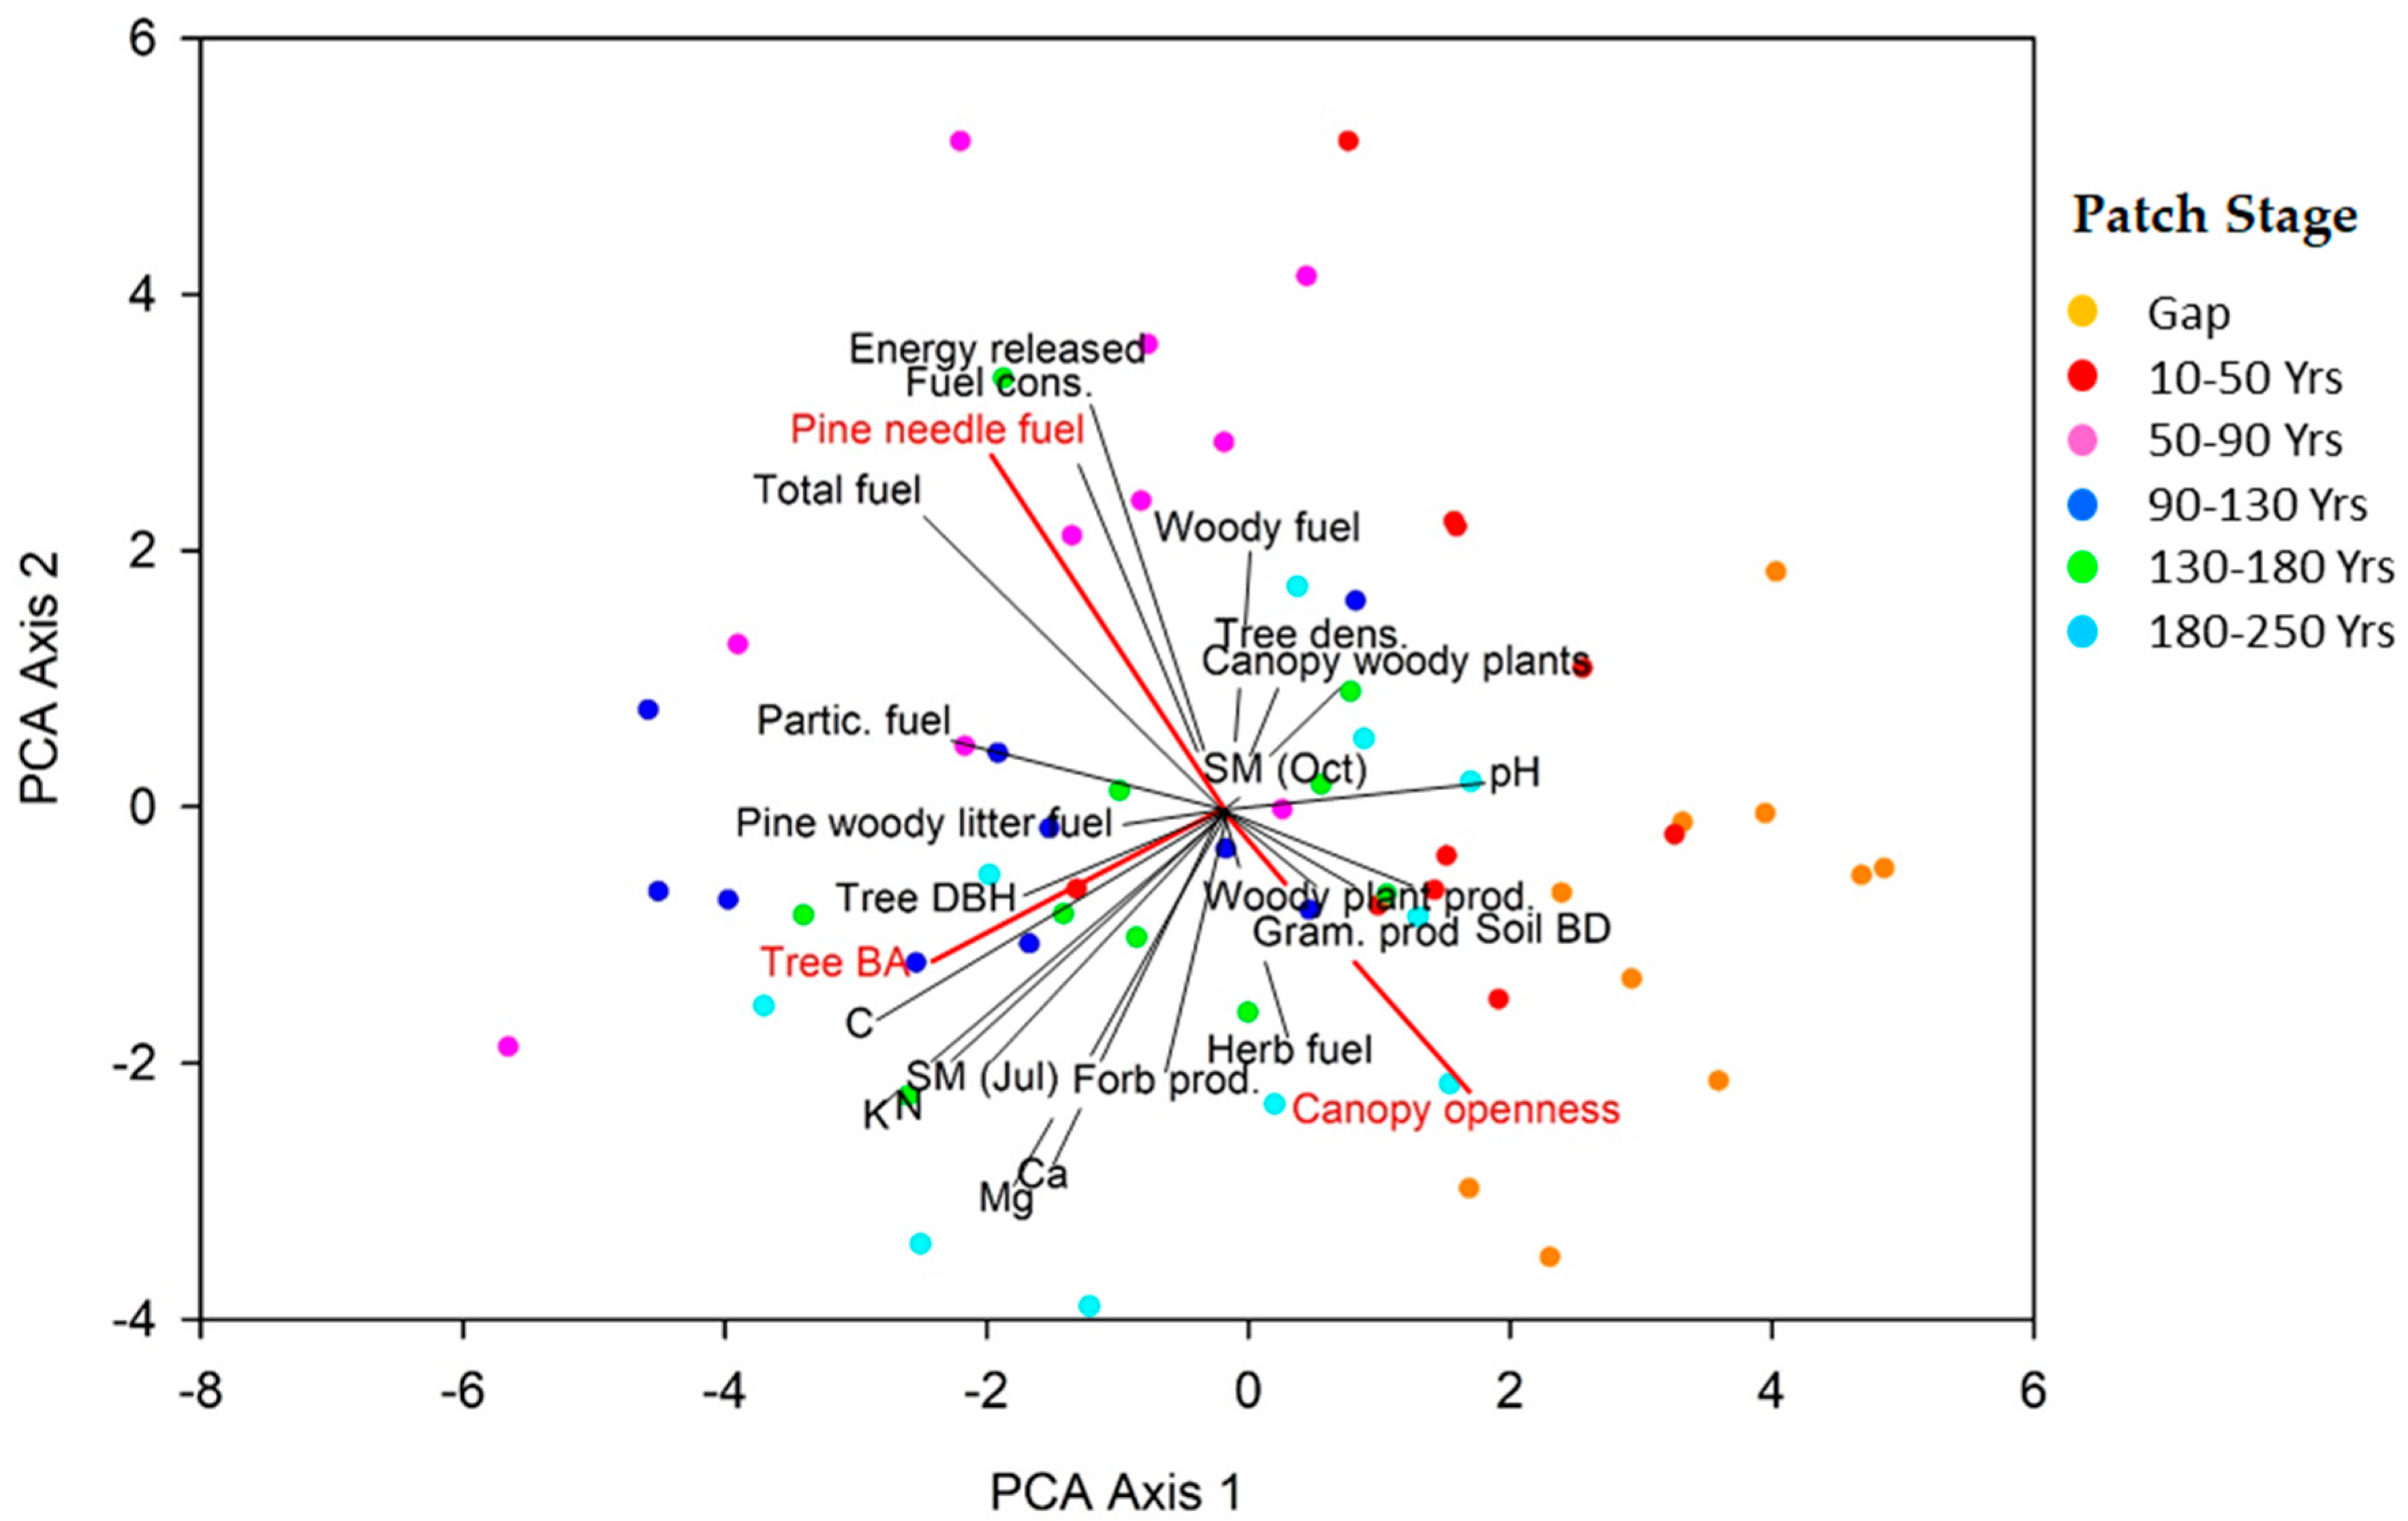


| Canopy Openness | r | Pine Basal Area | r |
|---|---|---|---|
| Herbaceous fuel | 0.333 | Pine tree mean dbh | 0.819 |
| Graminoid productivity | 0.274 | Fine particulate fuel | 0.480 |
| Woody plant productivity | 0.268 | Pine woody litter fuel | 0.453 |
| Canopy woody plant biomass | 0.272 | % total C | 0.450 |
| Tree density | −0.482 | % total N | 0.370 |
| Ca ppm | 0.341 | ||
| Pine needle litter | r | Mg ppm | 0.364 |
| Total fuel | 0.706 | K ppm | 0.503 |
| Total fuel consumed | 0.657 | pH | −0.445 |
| Total energy released | 0.751 | Soil bulk density | −0.162 |
| Forb productivity | −0.225 | Woody plant fuel | −0.210 |
| Soil bulk density | −0.238 | Woody stems | −0.183 |
| Family | Genus | Species | Patch Stage Association (Years) | p-Value |
|---|---|---|---|---|
| Acanthaceae | Dyschoriste | oblongifolia | 10–130 | 0.009 |
| Asteraceae | Gap–50 | 0.026 | ||
| Ageratina | aromatica | 10–130 | 0.038 | |
| Chrysopsis | mariana | Gap–50 | 0.015 | |
| Conyza | canadensis | 50–180 | 0.155 | |
| Elephantopus | 130–Gap | 0.305 | ||
| elatus | Gap–50 | 0.274 | ||
| tomentosus | 90–180 | 0.104 | ||
| Eupatorium | 180–Gap–50 | 0.031 | ||
| album | 180–Gap–50 | 0.025 | ||
| leucolepis | Gap–130 | 1.000 | ||
| Helenium | spp. | Gap–50 | 0.031 | |
| Helianthus | radula | Gap–50 | 0.010 | |
| Hieracium | gronovii | 130–Gap | 0.425 | |
| Liatris | elegantula | 180–250 | 1.000 | |
| Pityopsis | 130–Gap | 0.206 | ||
| aspera | 130–Gap | 0.380 | ||
| graminifolia | 130–Gap | 0.275 | ||
| Rudbeckia | hirta | 180–Gap–50 | 0.201 | |
| Sericocarpus | tortifolius | 130–180 | 0.043 | |
| Solidago | 130–Gap | 0.197 | ||
| altissima | 130–180 | 0.170 | ||
| odora | 180–Gap–50 | 0.254 | ||
| Symphyotrichum | 90–180 | 0.124 | ||
| adnatum | 90–180 | 0.019 | ||
| concolor | Gap–50 | 0.539 | ||
| dumosum | 50–180 | 0.061 | ||
| oolentangiense | 130–Gap | 0.239 | ||
| Trilisa | odoratissima | Gap–180 | 1.000 | |
| Verbesina | aristata | 180–Gap–50 | 0.018 | |
| Vernonia | angustifolia | 90–180 | 0.054 | |
| Convovulaceae | Gap–50 | 0.008 | ||
| Ipomoea | pandurata | Gap–50 | 0.004 | |
| Stylisma | patens | 130–Gap | 0.242 | |
| Euphorbiaceae | 180–Gap-50 | 0.023 | ||
| Cnidoscolus | stimulosus | 10–90 | 0.392 | |
| Euphorbia | 10–90 | 0.466 | ||
| discoidalis | 10–90 | 0.226 | ||
| heterophylla | 180–250 | 1.000 | ||
| Stillingia | sylvatica | 180–Gap–50 | 0.087 | |
| Tragia | 180–Gap–50 | 0.340 | ||
| urens | 180–Gap | 0.190 | ||
| urticifolia | 10–130 | 0.512 | ||
| Lamiaceae | Scutellaria | multiglandulosa | Gap–50 | 0.053 |
| Poaceae | Dichanthelium | Gap–90 | 0.007 | |
| aciculare | 50–130 | 0.283 | ||
| acuminatum | Gap | 0.129 | ||
| angustifolium | Gap–90 | 0.241 | ||
| dichotomum | 130–250 | 0.613 | ||
| ovale | Gap–90 | 0.411 | ||
| ravenelii | 10–90 | 0.093 | ||
| strigosum | Gap–90 | 0.017 | ||
| villosissimum | 10–90 | 0.778 | ||
| Gymnopogon | ambiguus | 50–130 | 0.037 | |
| Rosaceae | Rubus | Gap–50 | 0.010 | |
| cuneifolius | Gaps | 0.045 | ||
| flagellaris | Gap–50 | 0.076 | ||
| Fabaceae | 50–130 | <0.001 | ||
| Centrosema | virginianum | 90–250 | 0.005 | |
| Chamaecrista | fasciculata | 130–Gap | 0.298 | |
| Clitoria | mariana | 10–130 | 0.218 | |
| Crotalaria | rotundifolia | 180–250 | 0.151 | |
| Dalea | albida | 10–50 | 1.000 | |
| Desmodium | 90–130 | 0.002 | ||
| ciliare | 90–130 | 0.010 | ||
| floridanum | 130–250 | 0.283 | ||
| glabellum | 130–250 | 0.331 | ||
| lineatum | 90–130 | 0.002 | ||
| marilandicum | 130–180 | 0.020 | ||
| obtusifolium | 10–50 | 1.000 | ||
| paniculatum | 10–130 | 0.286 | ||
| viridiflorum | 50–130 | 0.092 | ||
| Galactia | 50–180 | 0.021 | ||
| regularis | 10–90 | 0.175 | ||
| volubulis | 50–130 | 0.013 | ||
| Lespedeza | 50–180 | 0.025 | ||
| angustifolia | 130–250 | 0.050 | ||
| repens | 10–130 | 0.030 | ||
| virginica | 130–Gap | 0.236 | ||
| Mimosa | quadrivalvis | 50–180 | 0.430 | |
| Strophostyles | umbellata | 50–180 | 0.386 | |
| Stylosanthes | biflora | 50–180 | 0.271 | |
| Rhynchosia | reniformis | 50–180 | 0.412 | |
| tomentosa | 50–180 | 0.286 | ||
| Tephrosia | 50–180 | 0.029 | ||
| florida | 50–180 | 0.348 | ||
| spicata | 50–180 | 0.492 | ||
| virginiana | 50–90 | 0.044 |
© 2019 by the authors. Licensee MDPI, Basel, Switzerland. This article is an open access article distributed under the terms and conditions of the Creative Commons Attribution (CC BY) license (http://creativecommons.org/licenses/by/4.0/).
Share and Cite
Mugnani, M.P.; Robertson, K.M.; Miller, D.L.; Platt, W.J. Longleaf Pine Patch Dynamics Influence Ground-Layer Vegetation in Old-Growth Pine Savanna. Forests 2019, 10, 389. https://doi.org/10.3390/f10050389
Mugnani MP, Robertson KM, Miller DL, Platt WJ. Longleaf Pine Patch Dynamics Influence Ground-Layer Vegetation in Old-Growth Pine Savanna. Forests. 2019; 10(5):389. https://doi.org/10.3390/f10050389
Chicago/Turabian StyleMugnani, Maria Paula, Kevin M. Robertson, Deborah L. Miller, and William J. Platt. 2019. "Longleaf Pine Patch Dynamics Influence Ground-Layer Vegetation in Old-Growth Pine Savanna" Forests 10, no. 5: 389. https://doi.org/10.3390/f10050389
APA StyleMugnani, M. P., Robertson, K. M., Miller, D. L., & Platt, W. J. (2019). Longleaf Pine Patch Dynamics Influence Ground-Layer Vegetation in Old-Growth Pine Savanna. Forests, 10(5), 389. https://doi.org/10.3390/f10050389